

Abstract
Frequency and distribution of long-SSRs were studied in 18 phytopathogenic prokaryotes. Higher relative abundance of the long-SSRs was observed in phytopathogenic prokaryotes when compared to non-pathogenic control. The frequency of these SSRs was positively correlated with size and GC content of the genomes of phytopathogenic prokaryotes. Interestingly, phytopathogens with higher GC content in the genome were found to posses longer repeat motifs of SSRs, whereas those having lesser GC content were harbouring shorter repeat motifs. Higher abundance of tri- and hexa-nucleotide repeat motifs were the characteristic of actinomycetes, where as higher abundance of mono- and tetra-nucleotide repeats were the characteristic of the mollicutes. The maximum relative abundance and relative density of SSR were found in the smallest genome of host-adapted pathogen Aster yellow, however, length of microsatellite repeat units was the least. On the basis of presence of SSRs in the housekeeping genes, a phylogenetic relationship between these phytopathogenic prokaryotes was deduced and compared with the phylogeny developed based on 16S ribosomal RNA gene.
Keywords: Phytopathogenic prokaryotes, Simple sequence repeats, Long-SSRs, Contingency loci, Housekeeping genes, Phylogenetics
Introduction
Simple sequence repeats (SSRs) or microsatellites are DNA regions comprising tandem iterations of short DNA motifs among which the repeats with motifs of 1–6 base pairs are generally called microsatellites. These kinds of repeated DNA sequences are common in prokaryotes (Coenye and Vandamme 2005; Gur-Arie et al. 2000; Mrazek et al. 2007) as well as in the eukaryotes (Mahfooz et al. 2012, 2015; Toth et al. 2000). Microsatellites are also found to be present in 3′ UTR, 5′ UTR, exons as well as in introns (Lawson and Zhang 2006). The most important characteristic of SSRs lies in the fact that they are highly variable and unusually polymorphic and hence are extensively used as genetic markers (Datta et al. 2010). Unequivocal evidences support that SSR expansion and contraction within genome can affect function of certain genes. If located in promoter sequence, the length of SSR may influence transcriptional activity of genes (Li et al. 2004).
Prokaryotes generally have small genome where around 90% of the sequences codes for protein or RNA molecules (Treangen et al. 2009). The remaining portion of the genome usually consists of regulatory sequences. While most of the genome consists of functional regions, prokaryotic genomes are expected to have fewer repeated sequences as compared to eukaryotes (Hancock 2002). The maximum length of microsatellite repeats in prokaryotic genomes is an order of magnitude lower than that observed in eukaryotes, and the longest naturally occurring SSR repeat units in E. coli are much shorter than any SSR repeats previously analysed for variability in eukaryotes (Field and Wills 1998). However, certain pathogenic prokaryotes carry unusually long-SSRs known as ‘contingency loci’. The contingency repeats of pathogenic prokaryotes are considerably longer and expected to arise by chance and are known to be both hyper-variable and hyper-mutable. It is interesting to note that these repeats occur only in specific sets of genes involved in pathogenicity, and their variability is functionally critical for their hosts (Moxon et al. 1994).
The SSRs acting as contingency loci appear to be relatively common in pathogenic prokaryotic microorganisms. The previous analyses revealed that these SSRs are composed of mono-, di-, tri-, and tetra-nucleotide motifs and are mostly restricted to host-adapted pathogens (Guo and Mrazek 2008; Mrazek et al. 2007). The availability of various phytopathogenic prokaryote genome sequences makes it possible to analyse and compare long-SSRs among many genomes in order to get an insight into the distribution and functionality of these SSRs. The general distribution of SSRs has been studied in many prokaryotic organisms (Guo and Mrazek 2008; Mrazek 2006; Mrazek et al. 2007), however a detailed analysis of long-SSRs is yet to be reported for phytopathogenic prokaryotes. Thus, the aims of the present study were: (1) to reveal various facets of the distribution and dynamics of long-SSRs in the genome of phytopathogenic prokaryotes. In one of our recent approach, we performed motif conservation analysis among the transcripts of four species of genus Aspergillus, which revealed a relationship at par with conserved gene phylogeny. Furthermore, a similar relationship among the Ascomycetes was obtained on the basis of motif conservation in ITS (Internal Transcribed Spacer) region based-phylogenetic study (Mahfooz et al. 2017). Thus, in another approach, we wish to see whether (2) a genetic relationship on the basis of SSRs present in housekeeping genes can be obtained or not. To accomplish this, an in silico approach was used to analyse the frequency and distribution of long-SSRs in the genic and inter-genic regions of the genome.
Materials and methods
DNA sequences
Annotated genome sequences of 18 phytopathogenic prokaryotes were downloaded in FASTA format from the National Center for Biotechnology Information (www.ncbi.nlm.nih.gov). Plasmid DNA sequences were not included in this study. Genic and inter-genic regions within the genomes were determined on the basis of existing annotations. Of the total 18 organisms, 13 belong to phylum Proteobacteria, three belong to Actinobacteria and remaining two were Mollicutes (Table 1). GC content of the genomes was determined using MGcat software (Treangen and Messeguer 2006). The genome sequence of non-pathogenic Lactobacillus casei was used as control.
Table 1.
Taxonomic status of phytopathogenic prokaryotes used in the study and the gene bank accession numbers of their complete genome
| Organism | Disease | Genbank Acc. | Phylum | Class | Order | Family |
|---|---|---|---|---|---|---|
| Agrobacterium tumefaciens | Crown gall | Proteobacteria | α-Proteobacteria | Rhizobiales | Rhizobiaceae | |
| Agrobacterium vitis | Crown gall of grape | Proteobacteria | α-Proteobacteria | Rhizobiales | Rhizobiaceae | |
| Acidovorax avenae ssp. citrulli | Fruit Blotch | NC_008752 | Proteobacteria | β-Proteobacteria | Burkholderiales | Comamonadaceae |
| Burkholderia cenocepacia | Sour skin of onions | Proteobacteria | β-Proteobacteria | Burkholderiales | Burkholderiaceae | |
| Burkholderia glumae | Seedling rot of rice | Proteobacteria | β-Proteobacteria | Burkholderiales | Burkholderiaceae | |
| Ralstonia solanacearum | Bacteria wilt | NC_003295 | Proteobacteria | β-Proteobacteria | Burkholderiales | Ralstoniaceae |
| Pseudomonas aeruginosa | Soft rot | NC_008463 | Proteobacteria | γ-Proteobacteria | Pseudomonadales | Pseudomonadaceae |
| Pseudomonas syringae pv. tomato | Speck of tomato | NC_004578 | Proteobacteria | γ-Proteobacteria | Pseudomonadales | Pseudomonadaceae |
| Xanthomonas axonopodis pv. citri | Citrus canker | NC_003919 | Proteobacteria | γ-Proteobacteria | Xanthomonadales | Xanthomonadaceae |
| Xanthomonas campestris | Black rot of crucifers | NC_007086 | Proteobacteria | γ-Proteobacteria | Xanthomonadales | Xanthomonadaceae |
| Xanthomonas oryzae | Blight in rice | NC_007705 | Proteobacteria | γ-Proteobacteria | Xanthomonadales | Xanthomonadaceae |
| Xylella fastidiosa | Citrus variegated chlorosis | NC_010513 | Proteobacteria | γ-Proteobacteria | Xanthomonadales | Xanthomonadaceae |
| Pectobacterium atrosepticum | Softrot and black leg of potato | NC_004547 | Proteobacteria | γ-Proteobacteria | Enterobacteriales | Enterobacteriaceae |
| Clavibacter michiganensis ssp. michiganensis | Canker of tomato | NC_009480 | Actinobacteria | Actinobacteria | Actinomycetales | Microbacteriaceae |
| C. michiganensis subsp. sepedonicus | Potato ring rot | NC_010407 | Actinobacteria | Actinobacteria | Actinomycetales | Microbacteriaceae |
| Leifsonia xyli ssp. xyli | Ratoon stunting in sugarcane | NC_006087 | Actinobacteria | Actinobacteria | Actinomycetales | Microbacteriaceae |
| Onion yellows (phytoplasma) | Onions yellow | NC_005303 | Tenericutes | Mollicutes | Acholeplasmatales | Acholeplasmataceae |
| Aster yellows (phytoplasma) | Witches-broom | NC_007716 | Tenericutes | Mollicutes | Acholeplasmatales | Acholeplasmataceae |
Simple sequence repeats
Higher number of short repeats is present in the genomes of both prokaryotes and eukaryotes. However, in prokaryotes, this excess is confined to mono- and trinucleotide repeats due to which a higher number of short mononucleotide repeats (between lengths of 2 to 7–8) are often found in most of the prokaryotes (Field and Wills 1998). Hence, to overcome this, in the present investigation, we restricted to the long-SSRs only, which are more than 12 bases in length. Previous SSR analyses in prokaryotic organisms had included the microsatellites with shorter length (Gur-Arie et al. 2000). SSRs were measured in nucleotide bases rather than repeat motifs. The frequency of the long-SSRs in genic and inter-genic regions was analysed using WebSat online software (Martins et al. 2009), which is assessable through internet and required no program installation. Since the program was online, each SSR was checked manually resulting in the exclusion of partial copies. All SSRs were analysed for their frequency of occurrence, relative abundance and relative density. Relative abundance was calculated as the number of SSR present per kilobase (kb) of sequence, whereas the relative density was calculated as length of SSR per megabase (mb) (Mahfooz et al. 2016).
Statistical analysis
A binary data was generated on the basis of presence or absence of repeat motifs in the housekeeping genes of phytopathogenic prokaryotes and these molecular data were analysed using SIMQUAL route to generate Jaccard’s similarity coefficients with NTSYSpc software version 2.1 (Rohlf 1998). These similarity coefficients were used to construct a dendrogram depicting genetic relationships among the species by employing the unweighted paired group method of arithmetic averages (UPGMA) algorithm and SAHN clustering. The robustness of the dendrogram was evaluated with a bootstrap analysis performed on the binary dataset using WINBOOT software (version. 2.0).
The polymorphism information content (PIC) was measured as described earlier (Botstein et al. 1980). PIC is defined as the probability that two randomly chosen copies of gene will represent different alleles within a population. The PIC value was calculated with the formula as follows:
where Pij represents the frequency of the jth allele for marker i, and summation extends over ‘n’ alleles.
A phylogenetic tree of the 16S rRNA gene was also constructed using ClustalW program in the MEGA 5.2 software (Tamura et al. 2011). The phylogenetic tree was constructed using the neighbour-joining algorithm with bootstrap analysis for 1000 replicates.
Results
Distribution of long-SSRs in genic and inter-genic sequences
In order to systematically characterize the distribution of long-SSRs in genomes of phytopathogenic prokaryotes, we surveyed SSRs in 18 completely sequenced prokaryotic genomes with size ranging from 0.7 Mb (Aster yellows) to 7.2 Mb (B. cenocepacia) (Table 2). A total of 7133 SSRs were observed in all the genomes of phytopathogenic prokaryotes with an average of 396.2 SSRs per genome. Our results revealed a positive correlation between the genome sizes and frequency of SSRs observed (p = 0.0267, r = 0.271). Small genomes like Aster yellows harbour the least SSRs (66 in genic and 62 in inter-genic), whereas the larger genomes like B. glumae and B. cenocepacia harbour the maximum SSRs (1159 and 703, respectively). Some discrepancies were also observed in our comparative analysis. For example, in comparison of similar sized genomes, P. aeruginosa has a twofold SSR abundance over that of P. syringae although they have approximately the same genome size. Therefore, to compare the SSRs more realistically, we have taken the total length of each set of sequence as a reference. Thus, relative abundance and density were calculated. The highest relative abundance and density of SSRs was observed in Aster yellow (177.7 and 2457.1, respectively), which is closely followed by B. glumae (172.9 and 2291.3, respectively), while the least relative abundance and density was observed in P. syringe (27.5 and 400.5, respectively) (Table 2).
Table 2.
Details of genome size, % GC content, number of genes, % coding, number and relative abundance of SSRs in phytopathogenic prokaryotic organisms
| S. No. | Organism | Genome size (Mb) | % GC content | No. of genes | Total SSRs | Inter-genic (%) | Genic (%) | Relative abundance | Relative density |
|---|---|---|---|---|---|---|---|---|---|
| 1 | A. tumefaciens | 4.9 | 59.3 | 4617 | 281 | 17 (6.1) | 264 (93.9) | 57.3 | 718.7 |
| 2 | A. vitis | 5.0 | 57.6 | 4290 | 239 | 22 (9.2) | 217 (90.8) | 47.8 | 3027.0 |
| 3 | Acidovorax avenae | 5.4 | 68.5 | 4709 | 636 | 89 (14.0) | 547 (86.0) | 101.2 | 1602.8 |
| 4 | B. cenocepacia | 7.2 | 66.9 | 4061 | 703 | 306 (43.5) | 397 (56.5) | 96.9 | 1266.7 |
| 5 | B. glumae | 6.7 | 68.4 | 5366 | 1159 | 220 (19.0) | 939 (81.0) | 172.9 | 2291.3 |
| 6 | R. solanacearum | 3.7 | 67.0 | 3441 | 412 | 36 (8.7) | 376 (91.3) | 111.4 | 1436.2 |
| 7 | P. aeruginosa | 6.5 | 66.3 | 5892 | 376 | 24 (6.4) | 352 (93.6) | 57.6 | 768.9 |
| 8 | P. syringe | 6.4 | 58.4 | 5481 | 176 | 31 (17.6) | 145 (82.4) | 27.5 | 400.5 |
| 9 | X. axonopodis | 5.2 | 64.8 | 4312 | 408 | 74 (19.1) | 334 (81.9) | 78.9 | 1150.8 |
| 10 | X. campestris | 5.2 | 65.0 | 4271 | 448 | 81 (19.1) | 367 (81.9) | 86.9 | 1280.8 |
| 11 | X. oryzae | 4.9 | 63.7 | 4372 | 370 | 48 (13.0) | 322 (87.0) | 74.9 | 1065.7 |
| 12 | X. fastidiosa | 2.5 | 51.9 | 2104 | 183 | 55 (30.1) | 128 (69.9) | 73.8 | 900.8 |
| 13 | P. atrosepticum | 5.1 | 51.0 | 4494 | 149 | 15 (10.1) | 134 (89.9) | 29.4 | 401.9 |
| 14 | C. m. michiganensis | 3.2 | 72.6 | 2983 | 519 | 84 (16.2) | 435 (83.8) | 162.2 | 2183.7 |
| 15 | C. m. sepedonicus | 3.2 | 76.7 | 2941 | 528 | 105 (19.9) | 423 (80.1) | 165.0 | 2318.4 |
| 16 | L. xyli ssp. xyli | 2.6 | 67.7 | 2030 | 304 | 84 (27.6) | 220 (72.4) | 117.8 | 1592.7 |
| 17 | Onion yellow | 0.8 | 27.8 | 750 | 114 | 61 (53.5) | 53 (46.5) | 134.1 | 1897.5 |
| 18 | Aster yellow | 0.7 | 26.9 | 671 | 128 | 62 (48.4) | 66 (51.6) | 177.7 | 2457.1 |
| Lactobacillus casei (control) | 3.0 | 46.4 | 3047 | 68 | 15 (23.5) | 52 (76.4) | 7.5 | 274.3 | |
| Mean | 4.3 | 59.3 | 3675.3 | 379.0 | 75.2 | 303.7 | 93.7 | 1422.9 |
The SSRs were found to be differentially distributed in both genic and inter-genic regions. An average of 317.2 (80.1%) SSRs were present in genic regions whereas, 78.5 (19.9%) SSRs were located in inter-genic regions. Our analysis revealed that, unlike eukaryotic genomes, SSRs were abundantly present in the genic regions when compare to inter-genic one; however, Onion yellow showed a reverse pattern of distribution. Among inter-genic sequences, maximum number of SSRs (306) was observed in B. cenocepacia whereas in genic sequences it was B. glumae (939) with highest SSR count. Similarly, the least number of SSRs in inter-genic sequences was observed in P. atrosepticum (15) whereas among genic sequences onion yellow harbours the least (53). The available sequences were used to calculate the GC content of each bacterial genome. Our result suggests that phytopathogenic prokaryotes are generally GC-rich. A wide range of percent GC value was found, from 26.9 in Aster yellows to 76.7 in C. michiganensis ssp. sepedonicus, the average being 60.0. Interestingly, GC content was also found to be positively correlated with frequency of SSRs (r = 0.380, p = 0.0064). GC content in long-SSR may be contributing to their stability and contributing in pathogenicity as earlier reported.
The frequency of different classes of SSRs among the genic and inter-genic regions of all sequence sets was investigated. The results revealed that in the genic region, the maximum frequency was of tri-nucleotide repeats (60.1%) while the mono-nucleotide repeats contributed the least (0.24%). Tetra-nucleotide motifs constitute the second-most frequent motif (21.9%) followed by hexa- (8.1%), di- (5.9%) and pentanucleotide (3.7%) motif. In the inter-genic region, tetranucleotide repeat contributes the maximum number of motifs (38.7%) which is closely followed by trinucleotide repeats (35.6%). Mono, hexa-, penta- and di-, nucleotide SSRs represent 31.0, 9.9, 9.7 and 2.9% of SSRs, respectively (Fig. 1).
Fig. 1.
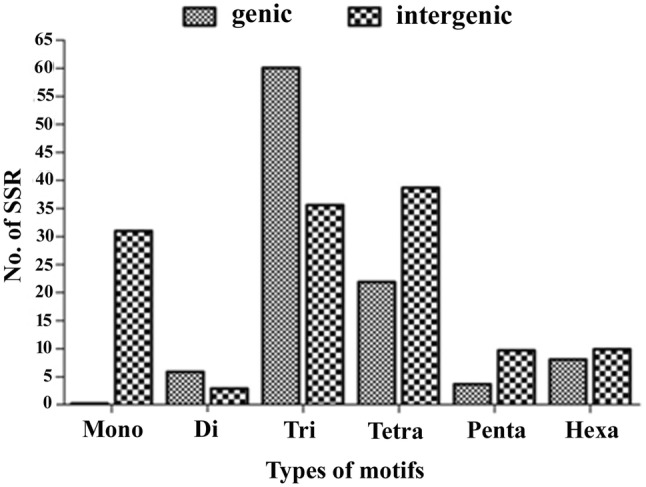
Figure showing frequency of different classes of repeats in the genic and inter-genic sequences
Different species have their own preference for different classes of SSRs
While analysing the relative abundance and density of different classes of repeat motifs, we identified a very unique pattern. Relative abundance of mono- and tetra- nucleotide repeats was highest in the mollicutes Aster yellows and Onion yellows. The relative abundance of di-nucleotide repeats was recorded maximum in B. glumae which was followed by X. oryzae. Similarly the highest relative abundance of tri- and hexa-nucleotide repeat motifs was exhibited by the species of C. michiganensis whereas, the highest relative abundance of penta-nucleotide repeats have been found in B. glumae followed by onion yellows (Table 3).
Table 3.
Relative abundance and relative density of mono-/di-/tri-/tetra/penta/and hexa nucleotide repeats in phytopathogenic prokaryotic organisms
| S. No. | Taxa | Relative abundance | Relative density | ||||||||||
|---|---|---|---|---|---|---|---|---|---|---|---|---|---|
| Mono | Di | Tri | Tetra | Penta | Hexa | Mono | Di | Tri | Tetra | Penta | Hexa | ||
| 1 | A. tumefaciens | 0.0 | 1.0 | 40.6 | 13.3 | 1.4 | 1.6 | 0.0 | 12.4 | 495.3 | 159.2 | 21.4 | 30.6 |
| 2 | A. vitis | 0.2 | 0.8 | 27.8 | 16.4 | 1.2 | 1.6 | 0.0 | 5.0 | 340.2 | 200.0 | 18.0 | 39.6 |
| 3 | Acidovorax avenae | 0.0 | 5.4 | 63.9 | 35.6 | 6.1 | 8.7 | 0.0 | 77.8 | 794.4 | 433.3 | 93.7 | 205.6 |
| 4 | B. cenocepacia | 0.1 | 3.8 | 59.3 | 25.6 | 6.1 | 4.0 | 1.7 | 45.8 | 720.0 | 306.7 | 95.8 | 96.7 |
| 5 | B. glumae | 0.0 | 23.1 | 81.9 | 43.9 | 14.2 | 7.3 | 0.0 | 286.6 | 1080.4 | 533.1 | 220.1 | 171.0 |
| 6 | R. solanacearum | 0.5 | 5.7 | 72.7 | 24.3 | 6.8 | 3.2 | 69.7 | 891.9 | 291.9 | 110.8 | 64.9 | 7.0 |
| 7 | P. aeruginosa | 0.2 | 0.5 | 40.3 | 11.2 | 1.6 | 4.6 | 5.5 | 486.5 | 134.8 | 27.7 | 112.6 | 1.8 |
| 8 | P. syringe | 0.8 | 0.2 | 10.5 | 10.9 | 0.9 | 4.2 | 10.8 | 1.9 | 125.6 | 141.3 | 14.1 | 106.3 |
| 9 | X. axonopodis | 0.4 | 8.5 | 38.3 | 17.3 | 4.0 | 12.1 | 104.2 | 475.4 | 210.0 | 69.2 | 291.9 | 5.0 |
| 10 | X. campestris | 0.2 | 6.2 | 49.2 | 17.7 | 3.8 | 12.5 | 76.2 | 604.6 | 216.2 | 89.4 | 291.9 | 2.5 |
| 11 | X. oryzae | 2.0 | 8.8 | 35.7 | 16.5 | 3.9 | 10.0 | 112.7 | 337.8 | 208.2 | 75.5 | 202.0 | 29.6 |
| 12 | X. fastidiosa | 1.6 | 2.8 | 35.6 | 19.6 | 4.0 | 14.8 | 34.4 | 451.2 | 241.6 | 25.6 | 128.8 | 19.2 |
| 13 | P. atrosepticum | 0.0 | 0.0 | 15.5 | 11.9 | 0.4 | 1.6 | 0.0 | 0.0 | 190.6 | 151.4 | 5.8 | 54.1 |
| 14 | C. m. michiganensis | 0.3 | 0.0 | 103.8 | 36.2 | 5.9 | 19.4 | 8.6 | 0.0 | 1273.1 | 437.5 | 90.6 | 369.4 |
| 15 | C. m. sepedonicus | 0.9 | 2.2 | 104.4 | 35.6 | 6.9 | 21.6 | 26.3 | 1287.2 | 437.5 | 107.8 | 448.1 | 11.6 |
| 16 | L. xyli ssp. xyli | 3.1 | 0.8 | 61.5 | 31.6 | 4.6 | 15.8 | 9.2 | 756.9 | 389.2 | 75.0 | 313.8 | 48.5 |
| 17 | Onion yellow | 3.8 | 0.8 | 41.2 | 72.5 | 12.5 | 11.3 | 85.0 | 50.0 | 502.5 | 870.0 | 187.5 | 202.5 |
| 18 | Aster yellow | 24.3 | 4.3 | 5.9 | 74.3 | 11.4 | 11.4 | 108.6 | 741.4 | 891.4 | 171.4 | 205.7 | 338.6 |
Longest SSR
We carried out further analysis of the data to find the longest SSRs among individual genomes. Our analysis revealed that hexa-nucleotide constitutes the longest repeats in 15 genomes while the remaining three were tri-nucleotide repeats. B. cenocepacia harbours the longest SSR (142 bp) which is followed by P. syringe (72 base pairs). It is interesting to note that the mollicutes which showed higher relative abundance and density as compared to others harbour shorter SSRs. Among all, nearly half of the longest SSRs were located in genes which are directly or indirectly related to pathogenicity (Table 4).
Table 4.
Gene-wise location of longest SSR in phytopathogenic prokaryotes
| Organism | Longest SSR | Length (bases) | Gene |
|---|---|---|---|
| A. tumefaciens | (gcc)6 | 18 | Hypothetical protein |
| A. vitis | (accacg)11 | 66 | Hypothetical protein |
| Acidovorax | (acggca)11 | 66 | YD repeat coding protein |
| B. cenocepacia | (ctcctg)22 | 142 | Hypothetical protein |
| B. glumae | (gtcgaa)8 | 48 | Exinuclease ABC subunit C |
| R. solanacearum | (cggctc)7 | 42 | Dihydrolipoamide acetyl transferase |
| P. aeruginosa | (tcgcaa)7 | 42 | Hypothetical protein |
| P. syringe | (ccgagc)12 | 72 | DNA polymerase 3 subunit gamma and tau |
| X. axonopodis | (cctgca)8 | 48 | Tellurium resistance protein terA |
| X. campestris | (gtgctg)10 | 60 | Hypothetical protein |
| X. oryzae | (cgacag)7 | 42 | Anti-freeze glycopeptides AFGP-related protein |
| X. fastidiosa | (accgac)7 | 42 | Cellulase |
| P. atrosepticum | (cgcgaa)11 | 66 | Serine protease |
| C. m. michiganensis | (cgccga)6 | 36 | Hypothetical protein |
| C. m. sepedonicus | (caccat)9 | 54 | merR family transcriptional regulator |
| L. xyli ssp. xyli | (ccgcca)5 | 30 | NADPH-dependent dehydrogenase |
| Onion yellow | (tag)5 | 15 | Malate citrate symporter |
| Aster yellow | (tat)6 | 18 | ABC-type cobalt transport system permease component |
SSR in housekeeping genes
Analysis of 13 housekeeping genes involved in different cellular functions like DNA replication, transcription, translation and virulence in all the organisms revealed that different bacterial species has its specific pattern for different type, motifs and repeat units of SSR. High level of conservation of long-SSR is evident in the three species of Xanthomonas where trinucleotide repeats (TGG), (CGT) and (ACC) were found to be conserved in methionyl tRNA formyl transferase (fmt),30S ribosomal protein S6(rpsf) and UDP-n-acetylmuramate-l-alanine ligase (murc) genes, respectively. Similar observations were recorded in DNA topoisomerase IV subunit (gyrB) and single-strand DNA-binding protein (ssb) genes in both the species of Clavibacter. Cross-genera conservation of SSRs was also recorded in our study. Trinucleotide repeat (CAT)4 in gyrB was conserved in five species (Table 5). Among the genes, DNA gyrase (gyrB) harbours maximum SSRs (8), whereas single-strand DNA-binding protein (ssb), transcription termination factor (rho) and 30S ribosomal protein S2 (rpsB) harbours the least (2). Based on the presence and absence of SSRs in the genes, PIC values were calculated. dnaA and purA genes were found to be most polymorphic with the PIC value of 0.997, whereas gyrB and dnaG was found to be least polymorphic with PIC value of 0.802 and 0.889, the average being 0.947.
Table 5.
Frequency and distribution of different classes of SSRs in the housekeeping genes
| S. No. | Bacteria | uvrA | dnaA | dnaG | gyrB | purA | ssb | clpA | recG | fmt | rpsF | vir | rho | murC | infB | rpsB |
|---|---|---|---|---|---|---|---|---|---|---|---|---|---|---|---|---|
| 1 | A. tumefaciens | (gccg)3 | (cgggg)3 | |||||||||||||
| 2 | A. vitis | (gtg)4 | ||||||||||||||
| 3 | Acidovorax | – | (cgggg)3 | (cat)4 | (tca)4 | (ccgg)3 | (acc)4 | |||||||||
| 4 | B. cenocepacia | (tca)4 | ||||||||||||||
| 5 | B. glumae | (cga)4 | (cg)7 (cat)4 | (tca)4 | (cga)4 | |||||||||||
| 6 | R. solanacearum | (gcc)4 | (cat)4 | (acc)4 | ||||||||||||
| 7 | P. aeruginosa | (cat)4 | (tgcg)3 | (cgg)3 | ||||||||||||
| 8 | P. syringe | (cat)4 | ||||||||||||||
| 9 | X. axonopodis | (ctgg)3 | (tgg)4 | (cgt)4 | (gcgcc)3, (gcc)4 | (acc)4 | (gcgt)3 | |||||||||
| 10 | X. campestris | (tgg)4 | (cgt)4 | (gcccaa)3, (cac)4 | (acc)4 | (gcgt)3 | ||||||||||
| 11 | X. oryzae | (ctg)4 | (cg)6 | (tgg)4 | (cgt)4 | (gcc)4, (tcc)5 | (acc)4 | (gcgccg)3 | ||||||||
| 12 | X. fastidiosa | |||||||||||||||
| 13 | P. atrosepticum | (gcg)4 | (gct)4 (ctgg)3 | (cgg)4 | ||||||||||||
| 14 | C. m. michiganensis | (cgg)4 | (cgg)4 (cag)4 | (ccg)4 | (cgg)4 | |||||||||||
| 15 | C. m. sepedonicus | (cgg)4 | (cgg)4 (cag)4 | |||||||||||||
| 16 | L. xyli ssp. xyli | (cccg)3 | (gcc)4 | (cagaac)4 | (ggc)4 | |||||||||||
| 17 | Onion yellow | (caaa)3 | (aag)4 | |||||||||||||
| 18 | Aster yellow | (aaat)3 | (agg)4 |
Amino acid runs
The trinucleotide motifs, which are abundant in the genic regions, were further analysed for amino acids encoded by them. In our analysis, we observed that GC-rich alanine is the most abundant amino acid in most of the Proteobacteria which was followed by another GC-rich amino acid arginine. Similarly, the three actinomycetes also showed preferences for arginine. In contrast, the class mollicutes exhibits preferences for AT-rich amino acid (glutamic acid and asparagines). With these results, we have attempted to find correlation between amino acids encoded by trinucleotide SSRs within these phytopathogenic prokaryotes. Our observation revealed that maximum correlation was exhibited by gamma-proteobacteria Ralstonia solanacearum and Acidovorax avenae which is followed by actinomycetes Leifsonia xyli and Clavibacter michiganensis. A negative correlation was observed between mollicutes and remaining bacteria (Table 6).
Table 6.
Pearson correlation coefficient among amino acid repeats encoded by trinucleotide repeats in different species
| 2 | 3 | 4 | 5 | 6 | 7 | 8 | 9 | 10 | 11 | 12 | 13 | 14 | 15 | 16 | 17 | 18 | |
|---|---|---|---|---|---|---|---|---|---|---|---|---|---|---|---|---|---|
| 1 | 0.864 | 0.949 | 0.929 | 0.948 | 0.970 | 0.918 | 0.849 | 0.847 | 0.903 | 0.907 | 0.747 | 0.771 | 0.837 | 0.837 | 0.875 | − 0.157 | − 0.197 |
| 2 | 0.896 | 0.776 | 0.853 | 0.886 | 0.767 | 0.810 | 0.769 | 0.839 | 0.811 | 0.759 | 0.881 | 0.672 | 0.672 | 0.715 | − 0.074 | − 0.191 | |
| 3 | 0.878 | 0.963 | 0.981 | 0.874 | 0.865 | 0.877 | 0.946 | 0.928 | 0.744 | 0.812 | 0.773 | 0.773 | 0.811 | − 0.173 | − 0.266 | ||
| 4 | 0.944 | 0.902 | 0.933 | 0.721 | 0.810 | 0.849 | 0.856 | 0.685 | 0.677 | 0.925 | 0.925 | 0.945 | − 0.143 | − 0.179 | |||
| 5 | 0.975 | 0.927 | 0.809 | 0.890 | 0.942 | 0.929 | 0.684 | 0.771 | 0.859 | 0.859 | 0.902 | − 0.124 | − 0.177 | ||||
| 6 | 0.896 | 0.859 | 0.881 | 0.946 | 0.934 | 0.722 | 0.829 | 0.788 | 0.789 | 0.833 | − 0.132 | − 0.216 | |||||
| 7 | 0.838 | 0.919 | 0.908 | 0.927 | 0.645 | 0.654 | 0.962 | 0.962 | 0.968 | − 0.139 | − 0.153 | ||||||
| 8 | 0.897 | 0.865 | 0.929 | 0.663 | 0.623 | 0.735 | 0.735 | 0.729 | − 0.258 | − 0.291 | |||||||
| 9 | 0.969 | 0.969 | 0.693 | 0.654 | 0.811 | 0.811 | 0.839 | − 0.205 | − 0.231 | ||||||||
| 10 | 0.957 | 0.738 | 0.783 | 0.787 | 0.787 | 0.837 | − 0.176 | − 0.209 | |||||||||
| 11 | 0.684 | 0.669 | 0.827 | 0.827 | 0.841 | − 0.225 | − 0.279 | ||||||||||
| 12 | 0.666 | 0.548 | 0.548 | 0.608 | − 0.229 | − 0.262 | |||||||||||
| 13 | 0.529 | 0.529 | 0.597 | 0.139 | 0.012 | ||||||||||||
| 14 | 1 | 0.979 | − 0.146 | − 0.112 | |||||||||||||
| 15 | 0.979 | − 0.146 | − 0.112 | ||||||||||||||
| 16 | − 0.084 | − 0.095 | |||||||||||||||
| 17 | 0.557 | ||||||||||||||||
| 18 |
Genetic relationship
In order to quantify the level of polymorphism, Jaccard’s estimate of similarity based on probability that SSR present in a particular gene of one species will also be present in the same gene of another species was used to generate a similarity matrix. The estimated similarity coefficient value ranged from 0 to 1.0 with a mean of 0.28 over the 171 combinations. The proteobacteria included in the study showed a higher average genetic diversity of 76% when compared with actinomycetes and mollicutes which exhibited a lower average genetic diversity of 35.0% and 11.0%, respectively. Among the Proteobacteria, α-Proteobacteria were found to be more diverse with an average genetic diversity of 82% when compared with β (56%) and γ (11%) Proteobacteria. Among individuals, the highest similarity coefficient value was observed between Proteobacteria X. axonopodis and X. campestris (0.92) which were followed by X. axonopodis and X. oryzae (0.91).
The dendrogram constructed based on the similarity index resulted into two main clusters A and B. α-Proteobacteria and mollicutes grouped together in cluster A, whereas β and γ-Proteobacteria along with actinomycetes grouped together in the second cluster (Fig. 2a). Two γ-Proteobacteria (X. fastidiosa and P. atrosepticum) showed similarity with α-Proteobacteria and grouped along with them in the first cluster. High bootstrap values were recorded for many nodes which indicated the robustness of this clustering. Several studies have examined the usefulness of housekeeping genes in determining phylogeny and observe that phylogenies derived from comparison of housekeeping genes diverge significantly from the 16S rRNA gene-derived phylogeny (Christensen et al. 2004; Ludwig et al. 1993). We have tried to limit this diversion by using the presence of SSRs in place of the whole gene sequence and tried to make congruence with the 16S phylogeny (Fig. 2b). While comparing both dendrograms, we observed a common trend that there is not much divergence in genus as different species of a same genus tend to cluster together.
Fig. 2.

Figure showing phylogenetic relationship among different phytopathogenic prokaryotes on the basis of SSR present in housekeeping genes (a) 16S rRNA sequences (b)
Discussion
It is a well-known fact that recombination and selection for repeats vary between genomes. Similarly, the number and types of repeats are also quite diverse and in line with ecological variables, such as host-dependent associations or population sizes, and with genetic variables, such as the recombination machinery (Treangen et al. 2009). Relative abundance and density of long-SSRs in the smallest genome of Aster yellow was found to be highest, whereas it was least in the fourth largest genome of Pseudomonas syringae. The higher abundance of long-SSRs in Aster yellow can be explained on the basis of its exposure to the host immune system. It has been reported that the frequency of long-SSRs in pathogens depend on the degree to which the pathogen is exposed to the immune system of host and the availability of other defense mechanisms to avoid the host immune response (Mrazek et al. 2007). While comparing the relative abundance of different repeat classes, we observed a very interesting trend. The relative abundance of mono- and tetra-nucleotide repeats was maximum in mollicutes, whereas the relative abundance of tri- and hexa-nucleotide repeats was maximum in actinomycetes. The proteobacteria Burkholderia glumae depicts highest abundance of di- and penta-nucleotide repeats. The dominance of mono-nucleotide repeats in mollicutes may be attributed to its genome size. It has been reported that larger genome tends to be more GC-rich with lower abundance of mononucleotide SSRs whereas, smaller genomes are generally AT-rich with higher abundance of mononucleotide SSRs (Coenye and Vandamme 2005). The lower relative abundance of di-nucleotide repeats in most of the genomes is expected as di-nucleotide repeats are considered as hot-spot of mutation (Lee et al. 1999). It has been reported that many virulence-associated genes present in bacteria are of prophage origin, which are considered to be an integral part of bacterial chromosomes (Srividhya et al. 2007). We can speculate that the higher abundance of di-nucleotide repeats in Burkholderia glumae may have viral origins.
While comparing the different repeat classes of SSRs in genic and inter-genic regions, we observed that tetranucleotide repeats were most abundant in inter-genic regions, whereas trinucleotide repeats were the most abundant class of repeat in genic regions with a frequent occurrence of motif GCC/GGC and CGC/GCG. The higher occurrence of tri-nucleotide repeats in the genic regions is expected because trinucleotide SSRs are translated into amino acid repeats, which possibly contribute to the biological function of the protein (Garnica et al. 2006; Kim et al. 2008; Lawson and Zhang 2006) and may also involve in protein–protein interaction (Karlin et al. 2002). In our analysis, we observed that long mono-nucleotide traces of SSR were least in the genic regions and second-most abundant in the inter-genic region. This may be explained on the basis that longer mono-nucleotide SSRs are more prone to undergo slipped-strand mispairing and there will be more mutability in their length. This could help to explain why these are overrepresented in non-coding regions of the genome as selection has ample opportunity to operate against these larger repeats that would cause frameshift and non-sense mutations in coding regions (Coenye and Vandamme 2005). The frequent occurrence of motifs GCC/GGC and CGC/GCG reflect the higher G + C content of the genome; similarly, mollicutes which are AT-rich showed AT-rich motifs. The above results are in agreement with the earlier study on nucleotide composition of genome and SSR variation where it was observed that SSRs in GC-rich genomes tend to use GC-rich motifs, whereas those in AT-rich genomes tend to use AT-rich motifs (Tian et al. 2011).
In most organisms, hexa-nucleotide SSRs constitute the longest SSR. It is feasible because hexa-nucleotide SSR contribute with the maximum number of nucleotide. Other factors which may facilitate in the over representation of length includes the interaction between DNA and DNA polymerase which may promote polymerase slippage specifically in hexa-nucleotide SSR. In our analysis we observed that SSRs were present even in housekeeping genes; however, most of the SSRs were present as tri-nucleotide motif along with few di-, tetra-, and penta-nucleotide. These housekeeping genes were associated with various cellular processes. The presence of SSRs in housekeeping genes is surprising because SSRs are known to be the hot-spot for mutation and if any mutation occurs in the housekeeping gene, it would be lethal. Since, most of the SSRs are trinucleotide, their chances to cause phase variation is generally low (Treangen et al. 2009). Long-SSRs associated with housekeeping genes could serve to influence expression of these genes by regulatory properties of DNA or RNA molecules. In our analysis, we observed that some of the SSR motifs were conserved in particular housekeeping genes across genera. For instance, motif (cat) 4 and motif (acc) 4 was found to be conserved in gyrB and murC genes of genera Acidovorax, Pseudomonas, Ralstonia, and Acidovorax, Ralstonia and Xanthomonas, respectively. The possible reason for this cross-genera conservation in housekeeping genes may be attributed to the fact that these conserved motifs when translated into amino acids runs provide active/regulatory sites for enzymes. In our analysis, we observed that in proteobacteria and actinomycetes, alanine and arginine were the most frequent amino acids which is in accordance with an earlier published report (Subramanyam et al. 2006). The higher occurrence of alanine may be attributed to the fact that prokaryotes generally prefers amino acids which are governed by low biosynthetic cost, evolutionary age and base composition of codons (Akashi and Gojobori 2002).
The presence of SSRs in certain housekeeping genes was used to create a phylogenetic relationship. The housekeeping genes have been selected with regard to properties suitable for phylogenetic inference, such as evolutionary conservation and low selection pressure (Christensen et al. 2004; Hill et al. 2013; Kullberg et al. 2006). Results indicate that set of housekeeping genes coupled with the presence of SSR were capable of analysing the phylogenetic content of the genome. Protein-coding genes (dnaA and purA) were found to be most informative, whereas gyrB and dnaG genes were least. The gyrB gene which encodes the subunit B protein of DNA gyrase sequences have been used in phylogenetic studies of many bacteria (Kasai et al. 2000; La Duc et al. 2004; Niemann et al. 2000; Yamamoto and Harayama 1998). The possible explanation for the poor performance of gyrB in our study lies in the fact that we have considered only the presence of repeat in a particular gene for estimating phylogenetic relationship. Fine resolution can be obtained by taking the presence of a particular motif or repeat number; however, this will lead to incongruent results.
Conclusion
The study has identified the pattern of distribution of long-SSRs in the genic and inter-genic regions of different phytopathogenic prokaryotes and established genetic relationship between individual species. Most of the repeat motifs were confined to the genic regions. Hence the occurrence of microsatellites is non-random in phytopathogenic prokaryotes. Tri-nucleotide repeat motifs were the most abundant class of repeats in the genic regions, whereas tetra-nucleotide repeats were the maximum in inter-genic regions. A novel approach to analyse the genetic relationship based on SSR motif length present in certain housekeeping genes of phytopathogenic microorganism has been described.
Compliance with ethical standards
Conflict of interest
None declared.
References
- Akashi H, Gojobori T. Metabolic efficiency and amino acid composition in the proteomes of Escherichia coli and Bacillus subtilis. Proc Natl Acad Sci USA. 2002;99(6):3695–3700. doi: 10.1073/pnas.062526999. [DOI] [PMC free article] [PubMed] [Google Scholar]
- Botstein D, White RL, Skolnick M, Davis RW. Construction of a genetic linkage map in man using restriction fragment length polymorphisms. Am J Hum Genet. 1980;32(3):314–331. [PMC free article] [PubMed] [Google Scholar]
- Christensen H, Kuhnert P, Olsen JE, Bisgaard M. Comparative phylogenies of the housekeeping genes atpD, infB and rpoB and the 16S rRNA gene within the Pasteurellaceae. Int J Syst Evol Microbiol. 2004;54(Pt 5):1601–1609. doi: 10.1099/ijs.0.03018-0. [DOI] [PubMed] [Google Scholar]
- Coenye T, Vandamme P. Characterization of mononucleotide repeats in sequenced prokaryotic genomes. DNA Res. 2005;12(4):221–233. doi: 10.1093/dnares/dsi009. [DOI] [PubMed] [Google Scholar]
- Datta S, Mahfooz S, Singh P, Choudhary AK, Singh F, Kumar S. Cross-genera amplification of informative microsatellite markers from common bean and lentil for the assessment of genetic diversity in pigeonpea. Physiol Mol Biol Plants. 2010;16(2):123–134. doi: 10.1007/s12298-010-0014-x. [DOI] [PMC free article] [PubMed] [Google Scholar]
- Field D, Wills C. Abundant microsatellite polymorphism in Saccharomyces cerevisiae, and the different distributions of microsatellites in eight prokaryotes and S. cerevisiae, result from strong mutation pressures and a variety of selective forces. Proc Natl Acad Sci USA. 1998;95(4):1647–1652. doi: 10.1073/pnas.95.4.1647. [DOI] [PMC free article] [PubMed] [Google Scholar]
- Garnica DP, Pinzon AM, Quesada-Ocampo LM, Bernal AJ, Barreto E, Grunwald NJ, Restrepo S. Survey and analysis of microsatellites from transcript sequences in Phytophthora species: frequency, distribution, and potential as markers for the genus. BMC Genom. 2006;7:245. doi: 10.1186/1471-2164-7-245. [DOI] [PMC free article] [PubMed] [Google Scholar]
- Guo X, Mrazek J. Long simple sequence repeats in host-adapted pathogens localize near genes encoding antigens, housekeeping genes, and pseudogenes. J Mol Evol. 2008;67(5):497–509. doi: 10.1007/s00239-008-9166-5. [DOI] [PubMed] [Google Scholar]
- Gur-Arie R, Cohen CJ, Eitan Y, Shelef L, Hallerman EM, Kashi Y. Simple sequence repeats in Escherichia coli: abundance, distribution, composition, and polymorphism. Genom Res. 2000;10(1):62–71. [PMC free article] [PubMed] [Google Scholar]
- Hancock JM. Genome size and the accumulation of simple sequence repeats: implications of new data from genome sequencing projects. Genetica. 2002;115(1):93–103. doi: 10.1023/A:1016028332006. [DOI] [PubMed] [Google Scholar]
- Hill MS, Hill AL, Lopez J, Peterson KJ, Pomponi S, Diaz MC, Thacker RW, Adamska M, Boury-Esnault N, Cardenas P, Chaves-Fonnegra A, Danka E, De Laine BO, Formica D, Hajdu E, Lobo-Hajdu G, Klontz S, Morrow CC, Patel J, Picton B, Pisani D, Pohlmann D, Redmond NE, Reed J, Richey S, Riesgo A, Rubin E, Russell Z, Rutzler K, Sperling EA, di Stefano M, Tarver JE, Collins AG. Reconstruction of family-level phylogenetic relationships within Demospongiae (Porifera) using nuclear encoded housekeeping genes. PLoS One. 2013;8(1):e50437. doi: 10.1371/journal.pone.0050437. [DOI] [PMC free article] [PubMed] [Google Scholar]
- Karlin S, Brocchieri L, Trent J, Blaisdell BE, Mrazek J. Heterogeneity of genome and proteome content in bacteria, archaea, and eukaryotes. Theor Popul Biol. 2002;61(4):367–390. doi: 10.1006/tpbi.2002.1606. [DOI] [PubMed] [Google Scholar]
- Kasai H, Ezaki T, Harayama S. Differentiation of phylogenetically related slowly growing mycobacteria by their gyrB sequences. J Clin Microbiol. 2000;38(1):301–308. doi: 10.1128/jcm.38.1.301-308.2000. [DOI] [PMC free article] [PubMed] [Google Scholar]
- Kim TS, Booth JG, Gauch HG, Jr, Sun Q, Park J, Lee YH, Lee K. Simple sequence repeats in Neurospora crassa: distribution, polymorphism and evolutionary inference. BMC Genom. 2008;9:31. doi: 10.1186/1471-2164-9-31. [DOI] [PMC free article] [PubMed] [Google Scholar]
- Kullberg M, Nilsson MA, Arnason U, Harley EH, Janke A. Housekeeping genes for phylogenetic analysis of eutherian relationships. Mol Biol Evol. 2006;23(8):1493–1503. doi: 10.1093/molbev/msl027. [DOI] [PubMed] [Google Scholar]
- La Duc MT, Satomi M, Agata N, Venkateswaran K. gyrB as a phylogenetic discriminator for members of the Bacillus anthracis-cereus-thuringiensis group. J Microbiol Methods. 2004;56(3):383–394. doi: 10.1016/j.mimet.2003.11.004. [DOI] [PubMed] [Google Scholar]
- Lawson MJ, Zhang L. Distinct patterns of SSR distribution in the Arabidopsis thaliana and rice genomes. Genome Biol. 2006;7(2):R14. doi: 10.1186/gb-2006-7-2-r14. [DOI] [PMC free article] [PubMed] [Google Scholar]
- Lee JS, Hanford MG, Genova JL, Farber RA. Relative stabilities of dinucleotide and tetranucleotide repeats in cultured mammalian cells. Hum Mol Genet. 1999;8(13):2567–2572. doi: 10.1093/hmg/8.13.2567. [DOI] [PubMed] [Google Scholar]
- Li YC, Korol AB, Fahima T, Nevo E. Microsatellites within genes: structure, function, and evolution. Mol Biol Evol. 2004;21(6):991–1007. doi: 10.1093/molbev/msh073. [DOI] [PubMed] [Google Scholar]
- Ludwig W, Neumaier J, Klugbauer N, Brockmann E, Roller C, Jilg S, Reetz K, Schachtner I, Ludvigsen A, Bachleitner M, et al. Phylogenetic relationships of Bacteria based on comparative sequence analysis of elongation factor Tu and ATP-synthase beta-subunit genes. Antonie Van Leeuwenhoek. 1993;64(3–4):285–305. doi: 10.1007/BF00873088. [DOI] [PubMed] [Google Scholar]
- Mahfooz S, Maurya DK, Srivastava AK, Kumar S, Arora DK. A comparative in silico analysis on frequency and distribution of microsatellites in coding regions of three formae speciales of Fusarium oxysporum and development of EST-SSR markers for polymorphism studies. FEMS Microbiol Lett. 2012;328(1):54–60. doi: 10.1111/j.1574-6968.2011.02483.x. [DOI] [PubMed] [Google Scholar]
- Mahfooz S, Srivastava A, Srivastava AK, Arora DK. A comparative analysis of distribution and conservation of microsatellites in the transcripts of sequenced Fusarium species and development of genic-SSR markers for polymorphism analysis. FEMS Microbiol Lett. 2015 doi: 10.1093/femsle/fnv131. [DOI] [PubMed] [Google Scholar]
- Mahfooz S, Singh SP, Rakh R, Bhattacharya A, Mishra N, Singh PC, Chauhan PS, Nautiyal CS, Mishra A. A comprehensive characterization of simple sequence repeats in the sequenced trichoderma genomes provides valuable resources for marker development. Front Microbiol. 2016;7:575. doi: 10.3389/fmicb.2016.00575. [DOI] [PMC free article] [PubMed] [Google Scholar]
- Mahfooz S, Singh SP, Mishra N, Mishra A. A comparison of microsatellites in phyto-pathogenic Aspergillus species in order to develop markers for the assessment of genetic diversity among its isolates. Front Microbiol. 2017;8:1774. doi: 10.3389/fmicb.2017.01774. [DOI] [PMC free article] [PubMed] [Google Scholar]
- Martins WS, Lucas DC, Neves KF, Bertioli DJ. WebSat–a web software for microsatellite marker development. Bioinformation. 2009;3(6):282–283. doi: 10.6026/97320630003282. [DOI] [PMC free article] [PubMed] [Google Scholar]
- Moxon ER, Rainey PB, Nowak MA, Lenski RE. Adaptive evolution of highly mutable loci in pathogenic bacteria. Curr Biol. 1994;4(1):24–33. doi: 10.1016/S0960-9822(00)00005-1. [DOI] [PubMed] [Google Scholar]
- Mrazek J. Analysis of distribution indicates diverse functions of simple sequence repeats in Mycoplasma genomes. Mol Biol Evol. 2006;23(7):1370–1385. doi: 10.1093/molbev/msk023. [DOI] [PubMed] [Google Scholar]
- Mrazek J, Guo X, Shah A. Simple sequence repeats in prokaryotic genomes. Proc Natl Acad Sci USA. 2007;104(20):8472–8477. doi: 10.1073/pnas.0702412104. [DOI] [PMC free article] [PubMed] [Google Scholar]
- Niemann S, Harmsen D, Rusch-Gerdes S, Richter E. Differentiation of clinical Mycobacterium tuberculosis complex isolates by gyrB DNA sequence polymorphism analysis. J Clin Microbiol. 2000;38(9):3231–3234. doi: 10.1128/jcm.38.9.3231-3234.2000. [DOI] [PMC free article] [PubMed] [Google Scholar]
- Rohlf FJ (1998) NTSYSpc: Numerical Taxonomy and Multivariate Analysis System Version 2.02h. Exeter Software, Appllied Biostatistics, New York
- Srividhya KV, Alaguraj V, Poornima G, Kumar D, Singh GP, Raghavenderan L, Katta AV, Mehta P, Krishnaswamy S. Identification of prophages in bacterial genomes by dinucleotide relative abundance difference. PLoS One. 2007;2(11):e1193. doi: 10.1371/journal.pone.0001193. [DOI] [PMC free article] [PubMed] [Google Scholar]
- Subramanyam MB, Gnanamani M, Ramachandran S. Simple sequence proteins in prokaryotic proteomes. BMC Genom. 2006;7:141. doi: 10.1186/1471-2164-7-141. [DOI] [PMC free article] [PubMed] [Google Scholar]
- Tamura K, Peterson D, Peterson N, Stecher G, Nei M, Kumar S. MEGA5: molecular evolutionary genetics analysis using maximum likelihood, evolutionary distance, and maximum parsimony methods. Mol Biol Evol. 2011;28(10):2731–2739. doi: 10.1093/molbev/msr121. [DOI] [PMC free article] [PubMed] [Google Scholar]
- Tian X, Strassmann JE, Queller DC. Genome nucleotide composition shapes variation in simple sequence repeats. Mol Biol Evol. 2011;28(2):899–909. doi: 10.1093/molbev/msq266. [DOI] [PubMed] [Google Scholar]
- Toth G, Gaspari Z, Jurka J. Microsatellites in different eukaryotic genomes: survey and analysis. Genome Res. 2000;10(7):967–981. doi: 10.1101/gr.10.7.967. [DOI] [PMC free article] [PubMed] [Google Scholar]
- Treangen TJ, Messeguer X. M-GCAT: interactively and efficiently constructing large-scale multiple genome comparison frameworks in closely related species. BMC Bioinform. 2006;7:433. doi: 10.1186/1471-2105-7-433. [DOI] [PMC free article] [PubMed] [Google Scholar]
- Treangen TJ, Abraham AL, Touchon M, Rocha EP. Genesis, effects and fates of repeats in prokaryotic genomes. FEMS Microbiol Rev. 2009;33(3):539–571. doi: 10.1111/j.1574-6976.2009.00169.x. [DOI] [PubMed] [Google Scholar]
- Yamamoto S, Harayama S. Phylogenetic relationships of Pseudomonas putida strains deduced from the nucleotide sequences of gyrB, rpoD and 16S rRNA genes. Int J Syst Bacteriol. 1998;48(Pt 3):813–819. doi: 10.1099/00207713-48-3-813. [DOI] [PubMed] [Google Scholar]