Abstract
Upon liver injury, quiescent hepatic stellate cells (qHSCs) transdifferentiate to myofibroblast-like activated HSCs (aHSCs), which are primarily responsible for the accumulation of extracellular matrix proteins during the development of liver fibrosis. Therefore, aHSCs may exhibit different energy metabolism from qHSCs to meet their high energy demand. We previously demonstrated that astaxanthin (ASTX), a xanthophyll carotenoid, prevents the activation of HSCs. The objective of this study was to determine ASTX can exert its anti-fibrogenic effect by attenuating any changes in energy metabolism during HSC activation. To characterize the energy metabolism of qHSCs and aHSCs, mouse primary HSCs were cultured on uncoated plastic dishes for 7 days for spontaneous activation in the presence or absence of 25 μM ASTX. qHSCs (one day after isolation) and aHSCs treated with or without ASTX for 7 days were used to determine parameters related to mitochondrial respiration using a Seahorse XFe24 Extracellular Flux analyzer. aHSCs had significantly higher basal respiration, maximal respiration, ATP production, spare respiratory capacity, and proton leak than those of qHSCs. However, ASTX prevented most of the changes occurring during HSC activation and improved mitochondrial cristae structure with decreased cristae junction width, lumen width, and the area in primary mouse aHSCs. Furthermore, qHSCs isolated from ASTX-fed mice had lower mitochondrial respiration and glycolysis than control qHSCs. Our findings suggest that ASTX may exert its anti-fibrogenic effect by attenuating the changes in energy metabolism during HSC activation.
Keywords: astaxanthin, hepatic stellate cell, mitochondrial respiration
1. Introduction
Fibrogenesis is a protective response to liver injury caused by a variety of factors such as chronic hepatitis B or hepatitis C infection, excess alcohol consumption, nonalcoholic fatty liver disease (NAFLD), drug toxicity, chemical intoxication, parasitic diseases, congenital abnormalities, and biliary atresia [1–3]. However, progressive deposition of extracellular matrix (ECM) proteins results in liver fibrosis, which can progress to cirrhosis and ultimately hepatocellular carcinoma [4, 5].
Hepatic stellate cells (HSCs), present in the subendothelial Space of Disse in the liver, play an important role in the development of liver fibrosis [6]. Upon liver injury, quiescent HSCs (qHSCs) transdifferentiate into myofibroblast-like cells, i.e., activated HSCs (aHSCs). aHSCs are characterized by enhanced proliferation and migration, excessive secretion of ECM proteins, enhanced contractility, and increased production of growth factors and pro-inflammatory and pro-fibrogenic cytokines [3, 4, 6, 7]. Therefore, it is likely that qHSCs and aHSCs have different energy demanding states. While HSC activation has been related to changes in glycolysis [8], little is known about the metabolic features of HSCs in a different activation state.
Astaxanthin (ASTX), a xanthophyll carotenoid, has potent antioxidant properties [9]. It has been suggested that ASTX exerts its protective effect against the development of various diseases, such as cancer, diabetes, cardiovascular diseases, gastrointestinal diseases, and liver diseases [10, 11]. We and others have previously demonstrated that ASTX has a potent anti-fibrogenic effect in HSCs in vitro [12–14] and in vivo [15, 16]. In the present study, we determined energy phenotypes, i.e., metabotypes, of qHSCs and aHSCs. Furthermore, we sought to link the alterations of the metabolic changes of HSCs by ASTX during the transdifferentiation of qHSCs into aHSCs to its anti-fibrogenic effect.
2. Materials and Methods
2.1. Cell culture and treatment
Primary mouse HSCs were isolated from C57BL/6J mice (Jackson Laboratory, Bar Harbor, ME, USA) using a pronase/collagenase digestion method and cultured on uncoated plastic dishes (BD Falcon, Franklin Lakes, NJ, USA) for spontaneous activation [6] as previously described [12, 14]. LX-2 cells were kindly provided by Dr. Scott Friedman at the Icahn School of Medicine at Mount Sinai (New York, NY, USA) and cultured as previously described [12]. LX-2 cells were treated with 4 ng/mL of transforming growth factor β1 (TGFβ1; Peprotech, Rocky Hill, NJ, USA) for 3, 6, 12, or 24 h. Primary human HSCs (Zen-Bio, Research Triangle Park, NC, USA) were maintained in a Human Stellate Growth Medium (Zen-Bio) and cultured on collagen-coated plates (Corning life sciences, Oneonta, NY, USA). Primary human HSCs were treated with 25 μM ASTX for 24 h and additional 3 h. ASTX, provided by Fuji Chemical Industry Co., Ltd. (Toyama, Japan), was prepared as previously described [12]. Two days after primary mouse HSCs were plated on an uncoated dish, the cells were incubated with 25 μM ASTX for additional 5 days during activation with daily replenishment of ASTX. Mesoxalonitrile 4-trifluoromethoxyphenylhydrazone (FCCP; Sigma, St. Louis, MO, USA) was solubilized in dimethyl sulfoxide (DMSO) to a final concentration of 0.5 μM and DMSO was used as a vehicle control. All cells were cultured in a 37°C humidified cell culture chamber under 5% CO2. Cell culture supplies were purchased from HyClone unless stated otherwise (Thermo Scientific, Logan, UT, USA).
2.2. Mouse feeding
C57BL/6J mice were purchased at 8 weeks of age (Jackson Laboratory). The mice were fed a low-fat diet (6% fat by weight) or a low-fat diet containing 0.03% ASTX by weight for 4 weeks. AstaREAL Oil L10, an extract from Haematoccus pluvialis containing 10% ASTX, was provided by Fuji Chemical Industry Co., Ltd. The composition of diets is shown in Supplemental Table 1. The contents of lard and soybean oil were adjusted based on the composition of AstaREAL Oil L10. All animal procedures were approved by the Institutional Animal Care and Use Committee at the University of Connecticut.
2.3. Gene analysis by reverse transcription quantitative real-time PCR (RT-qPCR)
Total RNA extraction from cells and tissues, cDNA synthesis, and RT-qPCR for gene analysis were conducted using the SYBR green method with a Bio-Rad CFX96 Real-Time system (Bio-Rad, Hercules, CA, USA) as previously described [17, 18].
2.4. Energy metabolism of cells
qHSCs and aHSCs treated with or without ASTX during activation, qHSCs from mice fed a control or ASTX containing diet for 4 weeks, LX-2 cells, and primary human HSCs were subjected to an XFe24 Extracellular Flux Analyzer (Seahorse Bioscience, North Billerica, MA, USA) for Mito Stress test (Seahorse Biosciences) as previously described [19]. Once the assay was finished, total DNA was isolated from each well using NucleoSpin® Tissue (MACHEREYNAGEL Inc, Germany) to normalize the data.
2.5. RNA sequencing and data analysis
Total RNA was isolated from primary mouse HSCs using RNeasy Mini Kit (Qiagen, Germantown, MD, USA) and RNA quality were validated on an Agilent 2100 Bioanalyzer with an Agilent RNA 6000 pico kit. Total RNA was used for library preparation using Illumina TruSeq mRNA paired-end (PE) RNA-seq kit. Libraries were then sequenced on using an Illumina NextSeq500 next generation sequencer. We performed PE reads of 2X150bp for each library and ran 12 samples in one run to obtain ~33 million mappable reads (~66 million paired) per sample, ensuring coverage of ~140X. Sequence reads obtained in FASTQ format were aligned using Bowtie2 [20] and TopHat [21] to mouse reference genome mm9. The gene expression levels were quantified using Cufflinks [22]. Results were normalized for exon length and FPKM (fragments per kilobase of exon per million mapped reads) values were obtained for each sample. FPKM values were input to statistics packages LIMMA [23] and SAMSeq [24] to identify differentially expressing (DE) genes. Subsequent analysis of DE genes was performed using the meta-analysis pipeline called Pattern Based Clustering (PBC) [25, 26] which produces the Gene Ontology enrichment score using GOStat [27] for gene groups of differing regulation patterns generated by PBC. Z-scores were calculated from average FPKM values of 4 replicates of each condition to make heatmaps.
2.6. Transmission electron microscopy (TEM) and mitochondrial morphological analysis
aHSCs and ASTX-treated aHSCs were fixed in a 2.5% glutaraldehyde solution in 0.1 M sodium cacodylate buffer, pH 7.4. The cells were then postfixed in 1% osmium tetroxide for 1 h and dehydrated through a series of graded ethanol at 30%, 50%, 70%, and 95% once, and 100% twice. The samples were infiltrated in a 1:1 mixture of resin: propylene oxide for 1.5 h and then in a 3:1 mixture of resin: propylene oxide overnight. Subsequently, infiltration was completed in 100% Glauert resin for 3 h with one change of resin after 1.5 h. The samples were then transferred to flat double end molds (Ted Pella, Inc., Redding, CA, USA) and polymerized in an oven (Lab-Line Instruments, Inc., Melrose Park, IL, USA) under vacuum at 60°C for 48 h. Ultrathin sections (~100 nm) were prepared using an ultra 45° Diatome™ diamond knife on a Leica Ultracut UCT microtome and collected on 150 mesh copper/palladium grids (Ted Pella, Inc.) for staining with 2% aqueous uranyl acetate and 2.5% Sato’s lead citrate. Images were obtained using a bright field FEI Tecnai Biotwin G2 Spirit (FEI company, Hillsboro, OR, USA) transmission electron microscope operated at an accelerating voltage of 80 kV and equipped with an AMT 2k (4 megapixel) XR40 CCD camera. To analyze the mitochondrial morphology, the mitochondria were photographed at ×49000 magnification. All the procedures were conducted at the Bioscience Electron Microscopy Laboratory at University of Connecticut. Mitochondrial cristae length, junction width, lumen width, and cristae area were quantified using Image J (National Institutes of Health, Bethesda, MD, USA).
2.7. Mitochondrial DNA copy number in primary mouse HSCs
Total DNA was isolated from primary mouse qHSCs and aHSCs treated with or without ASTX during their activation using NucleoSpin® Tissue (MACHEREY-NAGEL Inc). Mitochondrial DNA copy number was determined by qPCR using the SYBR green method witha Bio-Rad CFX96 Real-Time system (Bio-Rad). We measured the level of 16S ribosomal RNA (16S) and cytochrome b (CyB) as mitochondrial genes and hexokinase 2 (Hk2) as a nuclear gene.
2.8. Statistical analysis
One-way analysis of variance and Student Newman Keuls post hoc analysis or unpaired t-test were used to determine differences between groups using GraphPad Prism 6.0 (GraphPad Software, La Jolla, CA, USA). P values less than 0.05 were considered significant. Values were expressed as mean ± SEM.
3. Results
3.1. ASTX decreased the expression of fibrogenic genes during HSC activation
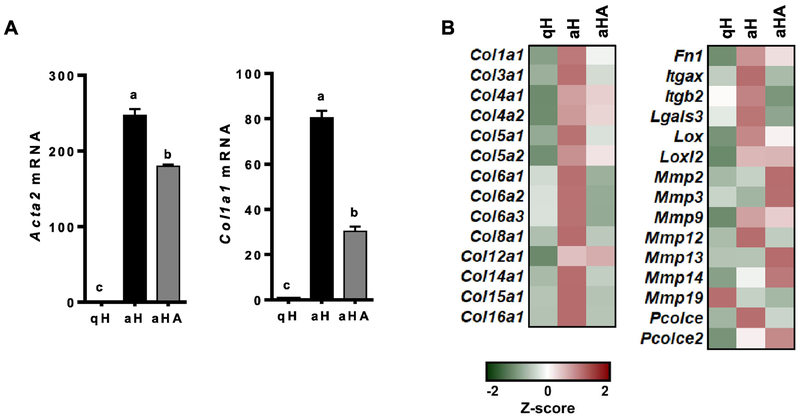
To confirm the anti-fibrogenic effect of ASTX, primary HSCs isolated from mice were cultured for 1 day or 7 days to represent qHSCs or aHSCs, respectively. ASTX was treated during HSC activation for 7 days. aHSCs expressed significantly higher mRNA levels of smooth muscle α actin (Acta2) and procolcollagen type I α1 (Col1a1) than qHSCs (Figure 1A) and other fibrogenic genes (Figure 1B and Supplemental Table 2). ASTX suppressed the expression of the fibrogenic genes during HSC activation, consistent with our previous findings [12–14].
Figure 1.
The expression of fibrogenic genes was higher in aHSCs than qHSCs, which was attenuated by ASTX. HSCs were isolated from mice and cultured for 1 day or 7 days to represent qHSCs (qH) or aHSCs (aH), respectively. ASTX (25 μM) was added during HSC activation for 7 days (aHA). RT-qPCR analysis for fibrogenic genes (A), heatmap of fibrogenic genes from RNAseq analysis (B).
3.2. Mitochondrial respiration was increased in primary mouse aHSCs compared with qHSCs, which was attenuated by ASTX
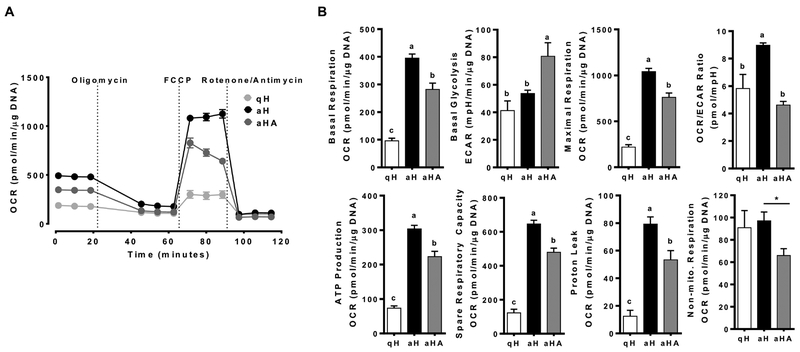
To investigate energy metabolism of HSCs, oxygen consumption rate (OCR) and extracellular acidification rate (ECAR), indices of mitochondrial respiration and glycolysis, respectively, of qHSCs and aHSCs as well as aHSCs treated with ASTX during activation were determined. Metabolic flux rates associated basal respiration, maximal respiration, OCR/ECAR ratio, ATP production, spare respiratory capacity, and proton leak were significantly higher in aHSCs than those in qHSCs (Figure 2A and B). ASTX, when added during HSC activation, significantly prevented the changes. The expression of genes associated with oxidative phosphorylation was markedly different between qHSCs and aHSCs, many of which were attenuated by ASTX (Supplementary Figure S1A and Supplemental Table 3). Interestingly, there was no significant difference in non-mitochondrial respiration between qHSCs and aHSCs, but ASTX significantly decreased non-mitochondrial respiration. Non-mitochondrial respiration is induced by a variety of oxygenases [28] and NADPH oxidases (NOXs) [29], which is likely related to the generation of reactive oxygen species (ROS). aHSCs displayed elevated expression of the genes related to oxidative stress compared with qHSCs, which was inhibited by ASTX (Supplementary Figure S1B and Supplemental Table 4). Notably, aHSCs had a significantly higher expression of Cybb, encoding Nox2, compared to qHSCs, which was abolished by ASTX to a similar level as qHSCs (Supplementary Figure S1C).
Figure 2.
Mitochondrial respiration was higher in aHSCs than qHSCs with ASTX-treated aHSCs being intermediate. HSCs were isolated from mice and cultured for 1 day or 7 days to represent qHSCs (qH) or aHSCs (aH), respectively. The cells were treated with 25 μM of ASTX during HSC activation for 7 days (aHA). MitoStress tests (A and B) were conducted. Bars sharing a common letter are not significantly different (P ≥ 0.05). *, P < 0.05.
3.3. Mitochondrial respiration of LX-2 cells was not altered by TGFβ1
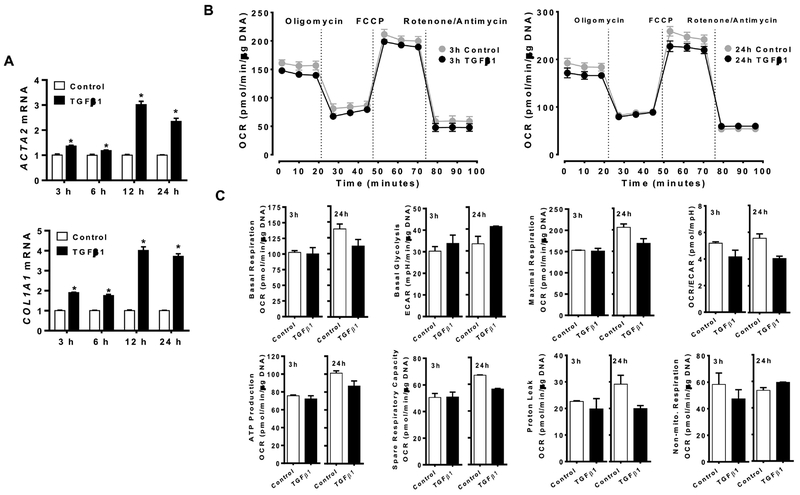
We next determined whether TGFβ1, a potent fibrogenic cytokine, can alter mitochondrial respiration in LX-2 cells, a human HSC cell line, concomitantly increasing fibrogenic genes. The expression of fibrogenic genes, e.g., ACTA2 and COL1A1, was significantly increased by, TGFβ1 (Figure 3A). However, TGFβ1 did not alter basal respiration, basal glycolysis, maximal respiration, OCR/ECAR ratio, ATP production, spare respiratory capacity, proton leak, and non-mitochondrial respiration when LX-2 cells were incubated with the cytokine for 3, 6, 12 or 24 h (Figure 3B and C; Supplementary Figure S2).
Figure 3.
Mitochondrial respiration was not altered by TGFβ1 despite increased fibrogenic gene expression in LX-2 cells. LX-2 cells were treated with 4 ng/mL of TGFβ1 for 3, 6, 12, or 24 h to measure the expression of Acta2 and Col1a1 (A) and MitoStress test was conducted with TGFβ1 incubation for 3 or 24 h (B and C). *, P < 0.05.
3.4. ASTX did not alter mitochondrial respiration in primary human HSCs
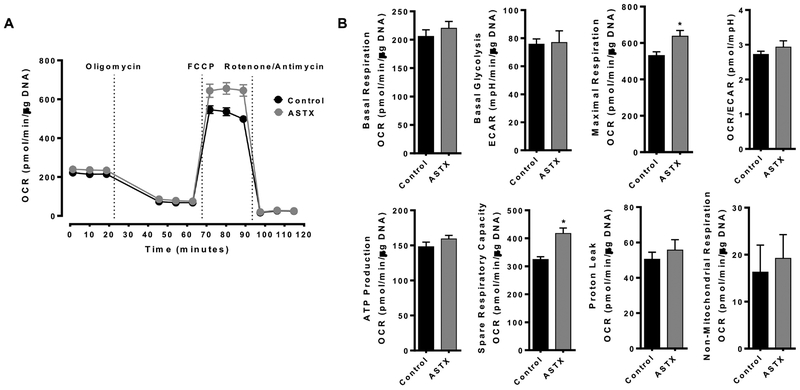
We further investigated the effect of ASTX on energy metabolism in primary human HSCs. When the cells were treated with 25 μM ASTX for 24 h and additional 3 h, ASTX had no effect on basal respiration, basal glycolysis, OCR/ECAR ration, ATP production, proton leak, and non-mitochondrial respiration while it significantly increased maximal respiration and spare respiratory capacity (Figure 4).
Figure 4.
ASTX did not alter mitochondrial respiration in primary human HSCs. Primary human HSCs were treated with 25 μM ASTX for 24 h and additional 3 h to conduct Mitostress test. *, P < 0.05.
3.5. Primary mouse aHSCs showed a higher mitochondrial DNA copy number than qHSCs, which was further increased by ASTX
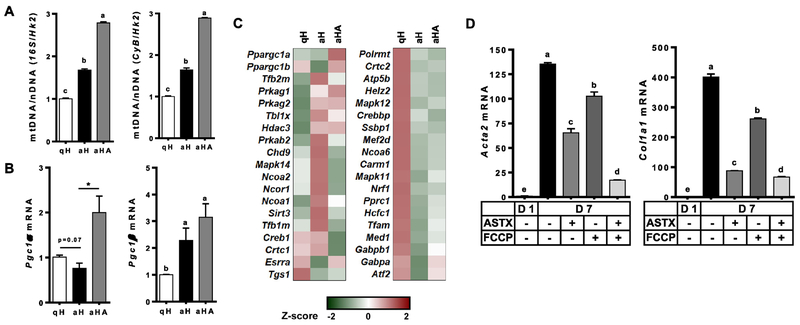
As primary mouse aHSCs showed significantly higher mitochondrial respiration than qHSCs, with ASTX-treated aHSCs being intermediate, we compared cellular mitochondrial contents. Mitochondrial DNA copy number was significantly higher in aHSCs than qHSCs, which was further increased by ASTX (Figure 5A). The expression of peroxisome proliferator activated receptor γ coactivator 1α (Pgc1α), a critical activator of mitochondrial biogenesis [30], showed a trend toward a decrease in aHSCs while ASTX markedly induced its expression (Figure 5B and C). Expression of Pgc1β, which is more abundantly expressed than Pgc1α in both qHSCs and aHSCs, was significantly induced in aHSCs and ASTX-treated aHSCs. Furthermore, changes in the expression of several genes related to mitochondrial biogenesis during HSC activation were attenuated by ASTX (Figure 5C and Supplemental Table 5). To determine the effect of mitochondrial respiration on HSC activation, FCCP, an uncoupler that dissipates proton gradient, was added during HSC activation. FCCP only treatment significantly reduced mRNA levels of Acta2 and Col1a1 in aHSCs while the combination of FCCP and ASTX drastically reduced their expression (Figure 5D).
Figure 5.
Mitochondrial quantity was higher in aHSCs than qHSCs, and ASTX increased mitochondrial quantity. HSCs isolated from mice were cultured for 1 day or 7 days in the absence or presence of 25 μM ASTX to represent qHSCs (qH), aHSCs (aH), or aHA, respectively. (A) Mitochondrial DNA copy number was determined by using16S ribosomal RNA (16S) and cytochrome b (CyB) as mitochondrial genes and hexokinase 2 (Hk2) as a nuclear gene. (B) mRNA levels of Pgc1α and Pgc1β. (C) Heatmap of genes involved in mitochondrial biogenesis. (D) HSCs were cultured for 1 day or 7 days in the absence or presence of 25 μM ASTX and 0.5 μM FCCP.
3.6. ASTX altered mitochondrial cristae structure in primary mouse HSCs during the activation
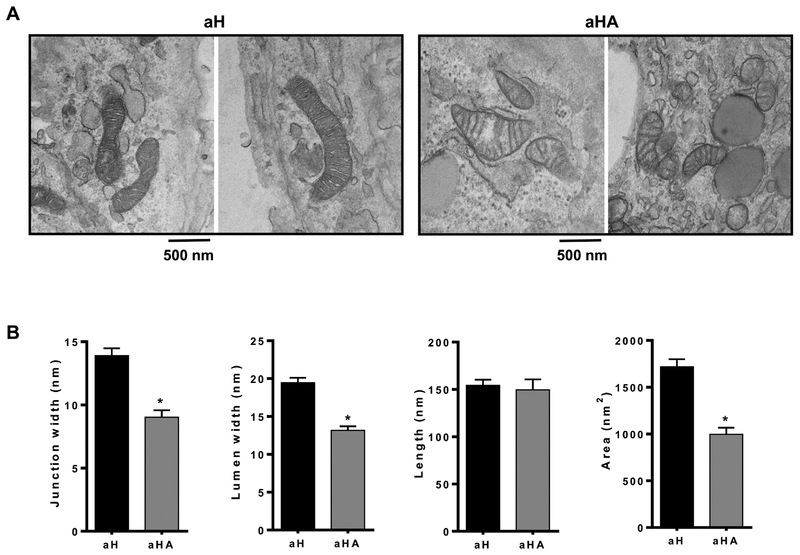
Next, we investigated the effect of ASTX on mitochondrial morphology using TEM in aHSCs treated with or without ASTX (Figure 6A). ASTX significantly decreased mitochondrial cristae junction width, lumen width, and area without altering cristae length (Figure 6B), which indicates improved mitochondrial function by ASTX.
Figure 6.
ASTX altered mitochondrial cristae structure in primary mouse activated HSCs. (A) Representative TEM mitochondrial images. (B) Mitochondrial cristae junction width, lumen width, length, and area were determined from the TEM images. Bars sharing a common letter are not significantly different (P ≥ 0.05). *, P < 0.05.
3.7. ASTX supplementation decreased mitochondrial respiration and glycolysis in primary mouse qHSCs
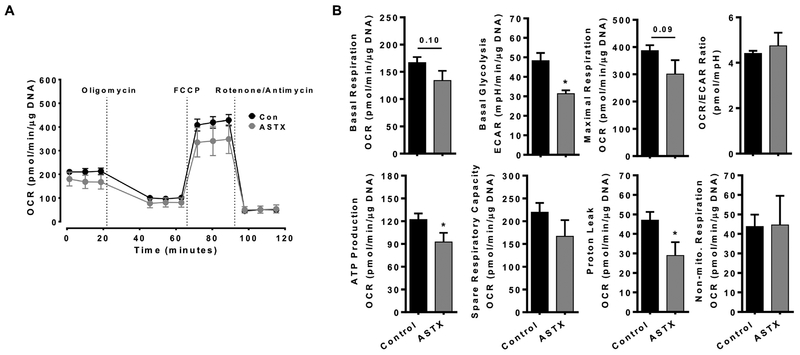
To determine in vivo effects of ASTX on HSC energy metabolism, we fed mice a regular chow or an ASTX-supplemented diet for 4 weeks, after which HSCs were isolated from the mice. qHSCs from ASTX-fed mice showed a trend toward a decrease in both basal respiration and maximal respiration compared with cells from control mice (Figure 7A and B). Also, ASTX significantly decreased basal glycolysis, ATP production, and proton leak in the HSCs. There were no significant differences in OCR/ECAR ratio, spare respiratory capacity, and non-mitochondrial respiration between two groups.
Figure 7.
ASTX supplementation decreased mitochondrial respiration and glycolysis in primary mouse qHSCs. Primary mouse HSCs were isolated from C57BL/6J mice fed a Con or ASTX diet containing 0.03% ASTX by weight for 4 weeks (n=11 and n=7 for Con and ASTX, respectively). The cells were plated in an XFe24 cell culture plate and incubated for 12 h and MitoStress test was conducted (A and B). *, P < 0.05.
4. Discussion
During the development of liver fibrosis, proliferative aHSCs produce ECM proteins, growth factors, and cytokines [3, 4, 6, 7]. To support the cellular activities and processes, aHSCs must be properly equipped to meet the high energy demand without being stressed. Thus far, the metabolic characteristics and energetics of qHSCs and aHSCs have not well understood. In addition, we previously demonstrated that ASTX has potent anti-fibrogenic effects in HSCs and prevents the activation of qHSCs [12–14]. However, whether the anti-fibrogenic effect of ASTX is related to the changes in energy metabolism of HSCs has not been investigated. In the present study, we found that aHSCs have higher mitochondrial respiration than qHSCs; and the presence of ASTX during HSC activation attenuated the increase in mitochondrial respiration. Interestingly, ASTX markedly increased mitochondrial quantity with improved mitochondrial cristae structure in aHSCs although it lowered mitochondrial respiration, which was also observed in the primary mouse qHSCs isolated from the ASTX-fed mouse liver.
Mitochondrial respiration in aHSCs was much higher than qHSCs, which was attenuated by ASTX. Consistently, we observed that aHSCs had significantly higher mitochondrial DNA copy numbers. It is of interest that ASTX increased mitochondrial copy number in conjunction with increased expression of Pgc1α, a critical factor for mitochondrial biogenesis although it significantly decreased mitochondrial respiration and other mitochondrial functions compared with control aHSCs. In addition, ASTX altered mitochondrial cristae structure. Membrane protein complexes of the respiratory chain and ATP synthase are located in the inner membrane of mitochondria where cristae are formed [34]. Mitochondrial cristae structure determines the assembly of respiratory chain complexes and mitochondrial respiratory efficiency [35]. Increases in cristae lumen and junction widths are associated with the defects in the assembly of respiratory chain complexes and lower respiratory efficiency [36]. Our analysis of mitochondrial cristae structure revealed that ASTX significantly decreased cristae junction width, lumen width, and area, suggesting that ASTX may improve mitochondrial respiratory efficiency in aHSCs. It is noteworthy that when mitochondria were subjected to FCCP treatment, mRNA levels of Acta2 and Col1a1 in aHSCs were significantly reduced while ASTX in combination with FCCP further reduced their expression. The results suggest that mild uncoupling in aHSCs, attendant with a reduction in membrane potential, may prevent HSC activation and that the effect of ASTX on mitochondrial respiration is one factor among others that contribute to its inhibitory action in HSC activation. In this regard, it has been demonstrated that mild uncoupling can decrease ROS production within mitochondrial oxidative phosphorylation complexes [37]. This speculation is well supported by the findings that ASTX attenuated increases in Cybb expression as well as in proton leak that is likely related to increased ROS levels in the mitochondria [38, 39]. Also, our previous study demonstrated that ASTX decreases cellular ROS accumulation in primary mouse and human HSCs [12, 14].
Drastic differences in metabotypes between mouse qHSCs and aHSCs were observed concomitantly with higher expression of fibrogenic genes in aHSCs than qHSCs. However, when LX-2 cells were stimulated by TGFβ, there were minimal changes in mitochondrial respiration despite ACTA2 and COL1A1 mRNA levels were markedly induced. In addition, ASTX did not alter basal respiration in primary human HSCs. Overall, the little or no effect of TGFβ or ASTX on energy metabolism in LX-2 cells or primary human HSCs may be due to the intrinsic characteristics of the cells as aHSCs, that is, they are in an activated state to some degree [44], evidenced by the loss of lipid droplets. The activation of HSCs is characterized by 2 steps; initiation and perpetuation [45]. Initiation of HSC activation is induced by paracrine stimuli, including apoptotic bodies of hepatocytes, TGFβ, inflammatory cytokines, ROS, and lipid peroxides [45, 46]. Subsequently, aHSCs are under the perpetuation phase in which they have characteristics of proliferation, fibrogenesis, chemotaxis, contractility, retinoid loss, and the production of cytokines and chemokines [46, 47]. Therefore, metabolic changes of HSCs may occur during the initiation phase, but not the perpetuation phase, suggesting that regulating energy metabolism at the initial stage of HSC activation may be a great target to prevent HSC activation and therefore liver fibrosis.
Energy metabolism of cells is tightly linked to their functions and proliferation. For instance, metabolic differences between two phenotypes of macrophages with distinct functions, i.e., classically activated, pro-inflammatory M1 and alternatively activated, anti-inflammatory M2, exist to meet their respective energy and functional needs [48]. M1 macrophages have high aerobic glycolysis for ATP generation with low mitochondrial respiration to increase substrate flux to the pentose phosphate pathway for NADPH production, which is critical for ROS generation [48, 49]. In contrast, M2 macrophages have elevated fatty acid oxidation and mitochondrial respiration with reduced glycolysis for effective energy production to play a role in wound-healing and tissue repair processes upon tissue injury [3, 48, 49]. The similarities in mitochondrial respiration and functions of M2 macrophages and aHSCs are of interest, clearly suggesting a tight link between function and energy metabolism of cells.
Our study provides new insight into distinct energy metabolism of quiescent and activated HSCs, and the effect of ASTX on HSC energy metabolism. aHSCs had higher mitochondrial respiration than qHSCs, which was attenuated by ASTX during HSC activation. It may lead to the inhibition of HSC activation. The present study opens a new avenue of investigation for better understanding of biological processes of HSC activation, focusing on their energy metabolism, and further the effect of ASTX on HSC energy metabolism.
Supplementary Material
Funding sources
This study was supported by NIH 1R01DK108254-01, USDA AFRI (2012-67018-129290), USDA Hatch CONS00972, and USDA Multistate Hatch CONS 00916 to J. Lee; and USDA AFRI 2016-08864 to Y. Park.
Abbreviations:
- Acta2
smooth muscle α actin
- aHSCs
activated hepatic stellate cells
- ASTX
astaxanthin
- Col1a1
procollagen type I α1
- CyB
cytochrome b
- DMSO
dimethyl sulfoxide
- DE
differentially expressing
- ECAR
extracellular acidification rate
- ECM
extracellular matrix
- FACS
fluorescence-activated cell sorting
- FCCP
mesoxalonitrile 4-trifluoromethoxyphenylhydrazone
- FPKM
fragments per kilobase of exon per million mapped reads
- GAPDH
glyceraldehyde 3-phosphate dehydrogenase
- HK
hexokinase
- HSCs
hepatic stellate cells
- NAFLD
nonalcoholic fatty liver disease
- NOX
NADPH oxidase
- OCR
oxygen consumption rate
- PBC
pattern based clustering
- PE
paired-end
- Pgc1α
peroxisome proliferator activated receptor γ coactivator 1α
- qHSCs
quiescent hepatic stellate cells
- ROS
reactive oxygen species
- RT-qPCR
reverse transcription quantitative real-time PCR
- TEM
transmission electron microscopy
- TGFβ1
transforming growth factor β1
- 16S
16S ribosomal RNA
Footnotes
Publisher's Disclaimer: This is a PDF file of an unedited manuscript that has been accepted for publication. As a service to our customers we are providing this early version of the manuscript. The manuscript will undergo copyediting, typesetting, and review of the resulting proof before it is published in its final citable form. Please note that during the production process errors may be discovered which could affect the content, and all legal disclaimers that apply to the journal pertain.
Competing interests
The authors declare no competing interests.
References
- [1].Wang XB, Feng Y, Wang N, Cheung F, Wong CW. Recent progress on anti-liver fibrosis candidates in patents of herbal medicinal products. Recent patents on food, nutrition & agriculture. 2012;4:91–106. [DOI] [PubMed] [Google Scholar]
- [2].Huang G, Brigstock DR. Regulation of hepatic stellate cells by connective tissue growth factor. Frontiers in bioscience. 2012;17:2495–507. [DOI] [PubMed] [Google Scholar]
- [3].Hernandez-Gea V, Friedman SL. Pathogenesis of liver fibrosis. Annual review of pathology. 2011;6:425–56. [DOI] [PubMed] [Google Scholar]
- [4].Pellicoro A, Ramachandran P, Iredale JP, Fallowfield JA. Liver fibrosis and repair: immune regulation of wound healing in a solid organ. Nat Rev Immunol. 2014;14:181–94. [DOI] [PubMed] [Google Scholar]
- [5].Torre LA, Bray F, Siegel RL, Ferlay J, Lortet-Tieulent J, Jemal A. Global cancer statistics, 2012. CA: a cancer journal for clinicians. 2015;65:87–108. [DOI] [PubMed] [Google Scholar]
- [6].Friedman SL. Hepatic stellate cells: protean, multifunctional, and enigmatic cells of the liver. Physiological reviews. 2008;88:125–72. [DOI] [PMC free article] [PubMed] [Google Scholar]
- [7].Ramm GA, Nair VG, Bridle KR, Shepherd RW, Crawford DH. Contribution of hepatic parenchymal and nonparenchymal cells to hepatic fibrogenesis in biliary atresia. The American journal of pathology. 1998;153:527–35. [DOI] [PMC free article] [PubMed] [Google Scholar]
- [8].Chen Y, Choi SS, Michelotti GA, Chan IS, Swiderska-Syn M, Karaca GF, et al. Hedgehog controls hepatic stellate cell fate by regulating metabolism. Gastroenterology. 2012;143:1319–29 e1–11. [DOI] [PMC free article] [PubMed] [Google Scholar]
- [9].Higuera-Ciapara I, Felix-Valenzuela L, Goycoolea F. Astaxanthin: a review of its chemistry and applications. Critical reviews in food science and nutrition. 2006;46:185–96. [DOI] [PubMed] [Google Scholar]
- [10].Yuan JP, Peng J, Yin K, Wang JH. Potential health-promoting effects of astaxanthin: a high-value carotenoid mostly from microalgae. Molecular nutrition & food research. 2011;55:150–65. [DOI] [PubMed] [Google Scholar]
- [11].Yang Y, Kim B, Lee J-Y. Astaxanthin structure, metabolism, and health benefits. J Hum Nutr Food Sci. 2013;1:1–1003. [Google Scholar]
- [12].Yang Y, Kim B, Park Y-K, Koo SI, Lee J-Y. Astaxanthin prevents TGFβ1-induced pro-fibrogenic gene expression by inhibiting Smad3 activation in hepatic stellate cells. Biochim Biophys Acta. 2015;1850:178–85. [DOI] [PubMed] [Google Scholar]
- [13].Yang Y, Bae M, Park Y-K, Lee Y, Pham TX, Rudraiah S, et al. Histone deacetylase 9 plays a role in the antifibrogenic effect of astaxanthin in hepatic stellate cells. The Journal of Nutritional Biochemistry. 2017;40:172–7. [DOI] [PubMed] [Google Scholar]
- [14].Yang Y, Bae M, Kim B, Park YK, Koo SI, Lee JY. Astaxanthin prevents and reverses the activation of mouse primary hepatic stellate cells. J Nutr Biochem. 2016;29:21–6. [DOI] [PubMed] [Google Scholar]
- [15].Shen M, Chen K, Lu J, Cheng P, Xu L, Dai W, et al. Protective effect of astaxanthin on liver fibrosis through modulation of TGF-beta1 expression and autophagy. Mediators of inflammation. 2014;2014:954502. [DOI] [PMC free article] [PubMed] [Google Scholar]
- [16].Kim B, Farruggia C, Ku CS, Pham TX, Yang Y, Bae M, et al. Astaxanthin inhibits inflammation and fibrosis in the liver and adipose tissue of mouse models of diet-induced obesity and nonalcoholic steatohepatitis. The Journal of nutritional biochemistry. 2016;43:27–35. [DOI] [PubMed] [Google Scholar]
- [17].Park Y-K, Rasmussen HE, Ehlers SJ, Blobaum KR, Lu F, Schlegal VL, et al. Repression of proinflammatory gene expression by lipid extract of Nostoc commune var sphaeroides Kützing, a blue-green alga, via inhibition of nuclear factor-κB in RAW 264.7 macrophages. Nutrition research. 2008;28:83–91. [DOI] [PubMed] [Google Scholar]
- [18].Rasmussen HE, Blobaum KR, Park Y-K, Ehlers SJ, Lu F, Lee J-Y. Lipid extract of Nostoc commune var. sphaeroides Kützing, a blue-green alga, inhibits the activation of sterol regulatory element binding proteins in HepG2 cells. The Journal of nutrition. 2008;138:476–81. [DOI] [PubMed] [Google Scholar]
- [19].Pham TX, Park Y-K, Bae M, Lee J-Y. The Potential Role of an Endotoxin Tolerance-Like Mechanism for the Anti-inflammatory Effect of Spirulina platensis Organic Extract in Macrophages. Journal of medicinal food. 2017;20:201–10. [DOI] [PubMed] [Google Scholar]
- [20].Langmead B, Salzberg SL. Fast gapped-read alignment with Bowtie 2. Nature methods. 2012;9:357–9. [DOI] [PMC free article] [PubMed] [Google Scholar]
- [21].Trapnell C, Pachter L, Salzberg SL. TopHat: discovering splice junctions with RNA-Seq. Bioinformatics. 2009;25:1105–11. [DOI] [PMC free article] [PubMed] [Google Scholar]
- [22].Trapnell C, Williams BA, Pertea G, Mortazavi A, Kwan G, van Baren MJ, et al. Transcript assembly and quantification by RNA-Seq reveals unannotated transcripts and isoform switching during cell differentiation. Nat Biotechnol. 2010;28:511–5. [DOI] [PMC free article] [PubMed] [Google Scholar]
- [23].Law CW, Chen Y, Shi W, Smyth GK. voom: Precision weights unlock linear model analysis tools for RNA-seq read counts. Genome Biol. 2014;15:R29. [DOI] [PMC free article] [PubMed] [Google Scholar]
- [24].Li J, Tibshirani R. Finding consistent patterns: A nonparametric approach for identifying differential expression in RNA-Seq data. Stat Methods Med Res. 2013;22:519–36. [DOI] [PMC free article] [PubMed] [Google Scholar]
- [25].Shin D-G, Hong S-H, Joshi P, Nori R, Pei B, Wang H-W, et al. PBC: A software framework facilitating pattern-based clustering for microarray data analysis. Bioinformatics, Systems Biology and Intelligent Computing, 2009 IJCBS’09 International Joint Conference on: IEEE; 2009. p. 30–6. [Google Scholar]
- [26].Joshi P, Pei B, Hong S-H, Kalajzic I, Shin D-J, Rowe D, et al. A software framework integrating gene expression patterns, binding site analysis and gene ontology to hypothesize gene regulation relationships. Bioinformatics and Biomedicine (BIBM), 2013 IEEE International Conference on: IEEE; 2013. p. 210–3. [Google Scholar]
- [27].Beissbarth T, Speed TP. GOstat: find statistically overrepresented Gene Ontologies within a group of genes. Bioinformatics. 2004;20:1464–5. [DOI] [PubMed] [Google Scholar]
- [28].Koopman M, Michels H, Dancy BM, Kamble R, Mouchiroud L, Auwerx J, et al. A screening-based platform for the assessment of cellular respiration in Caenorhabditis elegans. Nature protocols. 2016;11:1798–816. [DOI] [PMC free article] [PubMed] [Google Scholar]
- [29].Brand MD, Nicholls DG. Assessing mitochondrial dysfunction in cells. Biochemical Journal. 2011;435:297–312. [DOI] [PMC free article] [PubMed] [Google Scholar]
- [30].Scarpulla RC. Metabolic control of mitochondrial biogenesis through the PGC-1 family regulatory network. Biochimica et biophysica acta. 2011;1813:1269–78. [DOI] [PMC free article] [PubMed] [Google Scholar]
- [31].Yang Y, Kim B, Park Y-K, Koo SI, Lee J-Y. Astaxanthin prevents TGFβ1-induced pro-fibrogenic gene expression by inhibiting Smad3 activation in hepatic stellate cells. Biochimica et Biophysica Acta (BBA)-General Subjects. 2015;1850:178–85. [DOI] [PubMed] [Google Scholar]
- [32].Osterlie M, Bjerkeng B, Liaaen-Jensen S. Plasma appearance and distribution of astaxanthin E/Z and R/S isomers in plasma lipoproteins of men after single dose administration of astaxanthin. The Journal of nutritional biochemistry. 2000;11:482–90. [DOI] [PubMed] [Google Scholar]
- [33].Goodman DS. Overview of current knowledge of metabolism of vitamin A and carotenoids. J Natl Cancer Inst. 1984;73:1375–9. [PubMed] [Google Scholar]
- [34].Structure Kühlbrandt W. and function of mitochondrial membrane protein complexes. BMC biology. 2015;13:89. [DOI] [PMC free article] [PubMed] [Google Scholar]
- [35].Cogliati S, Frezza C, Soriano ME, Varanita T, Quintana-Cabrera R, Corrado M, et al. Mitochondrial cristae shape determines respiratory chain supercomplexes assembly and respiratory efficiency. Cell. 2013;155:160–71. [DOI] [PMC free article] [PubMed] [Google Scholar]
- [36].Quintana-Cabrera R, Mehrotra A, Rigoni G, Soriano M. Who and how in the regulation of mitochondrial cristae shape and function. Biochemical and biophysical research communications. 2017. [DOI] [PubMed] [Google Scholar]
- [37].Mookerjee SA, Divakaruni AS, Jastroch M, Brand MD. Mitochondrial uncoupling and lifespan. Mechanisms of ageing and development. 2010;131:463–72. [DOI] [PMC free article] [PubMed] [Google Scholar]
- [38].Echtay KS, Roussel D, St-Pierre J, Jekabsons MB, Cadenas S, Stuart JA, et al. Superoxide activates mitochondrial uncoupling proteins. Nature. 2002;415:96–9. [DOI] [PubMed] [Google Scholar]
- [39].Echtay KS, Murphy MP, Smith RA, Talbot DA, Brand MD. Superoxide activates mitochondrial uncoupling protein 2 from the matrix side Studies using targeted antioxidants. Journal of Biological Chemistry. 2002;277:47129–35. [DOI] [PubMed] [Google Scholar]
- [40].Kim B, Farruggia C, Ku CS, Pham TX, Yang Y, Bae M, et al. Astaxanthin inhibits inflammation and fibrosis in the liver and adipose tissue of mouse models of diet-induced obesity and nonalcoholic steatohepatitis. The Journal of nutritional biochemistry. 2017;43:27–35. [DOI] [PubMed] [Google Scholar]
- [41].Astaxanthin Kidd P., cell membrane nutrient with diverse clinical benefits and anti-aging potential. Altern Med Rev. 2011;16:355–64. [PubMed] [Google Scholar]
- [42].Shang L, Hosseini M, Liu X, Kisseleva T, Brenner DA. Human hepatic stellate cell isolation and characterization. Journal of gastroenterology. 2018;53:6–17. [DOI] [PubMed] [Google Scholar]
- [43].Mederacke I, Dapito DH, Affo S, Uchinami H, Schwabe RF. High-yield and high-purity isolation of hepatic stellate cells from normal and fibrotic mouse livers. Nat Protoc. 2015;10:305–15. [DOI] [PMC free article] [PubMed] [Google Scholar]
- [44].Xu L, Hui A, Albanis E, Arthur M, O’byrne S, Blaner W, et al. Human hepatic stellate cell lines, LX-1 and LX-2: new tools for analysis of hepatic fibrosis. Gut. 2005;54:142–51. [DOI] [PMC free article] [PubMed] [Google Scholar]
- [45].Wallace MC, Friedman SL, Mann DA. Emerging and disease-specific mechanisms of hepatic stellate cell activation. Seminars in liver disease. 2015;35:107–18. [DOI] [PubMed] [Google Scholar]
- [46].Lee UE, Friedman SL. Mechanisms of hepatic fibrogenesis. Best practice & research Clinical gastroenterology. 2011;25:195–206. [DOI] [PMC free article] [PubMed] [Google Scholar]
- [47].Puche JE, Saiman Y, Friedman SL. Hepatic stellate cells and liver fibrosis. Comprehensive Physiology. 2013;3:1473–92. [DOI] [PubMed] [Google Scholar]
- [48].Galván-Peña S, O’Neill LA. Metabolic reprograming in macrophage polarization. Frontiers in immunology. 2014;5. [DOI] [PMC free article] [PubMed] [Google Scholar]
- [49].Gaber T, Strehl C, Buttgereit F. Metabolic regulation of inflammation. Nature Reviews Rheumatology. 2017;13:267–79. [DOI] [PubMed] [Google Scholar]
Associated Data
This section collects any data citations, data availability statements, or supplementary materials included in this article.


