

Abstract
In preclinical studies, mesenchymal stromal cells (MSCs) exhibit robust potential for numerous applications. To capitalize on these benefits, cell manufacturing and delivery protocols have been scaled up to facilitate clinical trials without adequately addressing the impact of these processes on cell utility nor inevitable regulatory requirements for consistency. Growing evidence indicates that culture‐aged MSCs, expanded to the limits of replicative exhaustion to generate human doses, are not equivalent to early passage cells, and their use may underpin reportedly underwhelming or inconsistent clinical outcomes. Here, we sought to define the maximum expansion boundaries for human umbilical cord‐derived MSCs, cultured in chemically defined xeno‐ and serum‐free media, that yield consistent cell batches comparable to early passage cells. Two male and two female donor populations, recovered from cryostorage at mean population doubling level (mPDL) 10, were serially cultivated until replicative exhaustion (senescence). At each passage, growth kinetics, cell morphology, and transcriptome profiles were analyzed. All MSC populations displayed comparable growth trajectories through passage 9 (P9; mPDL 45) and variably approached senescence after P10 (mPDL 49). Transcription profiles of 14,500 human genes, generated by microarray, revealed a nonlinear evolution of culture‐adapted MSCs. Significant expression changes occurred only after P5 (mPDL 27) and accumulated rapidly after P9 (mPDL 45), preceding other cell aging metrics. We report that cryobanked umbilical cord‐derived MSCs can be reliably expanded to clinical human doses by P4 (mPDL 23), before significant transcriptome drift, and thus represent a mesenchymal cell source suited for clinical translation of cellular therapies. stem cells translational medicine 2019;8:945&958
Keywords: Mesenchymal stromal cells, Wharton's jelly cells, Replicative senescence, Cell aging, Gene expression profiles (transcriptome profiles), Culture media, Serum‐free
Significance Statement.
Culture‐adapted mesenchymal stromal cells (MSCs) are promising therapeutics for diverse applications. Despite accumulating evidence that prolonged expansion can attenuate therapeutic utility and promote culture‐influenced variability and differentiation, MSCs are often cultivated to the brink of senescence to meet clinical requirements for human doses of at least 109 cells. The study shows, for the first time, that transcriptome drift is minimal in early‐ to mid‐passage human umbilical cord‐derived MSCs, thus defining an optimal window for producing consistent MSC batches. Beyond this window, MSC cultures accumulate transcriptome variation resulting in populations that are divergent from both early passage cells and each other before predictors of replicative exhaustion, including decelerated proliferation, altered morphology, or expression of senescence markers, are detected.
Introduction
Mesenchymal stromal cells (MSCs) comprise a diverse family of postnatal multipotent cells with regenerative and immune‐modulatory properties. Human umbilical cord perivascular cells (HUCPVCs) are a convenient and abundant source of MSCs derived from a defined region of Wharton's jelly 1, 2. HUCPVCs exhibit robust growth potential 1, are amenable to stockpiling 3, 4, exhibit immune‐modulatory properties that support allogeneic transplantation 3, 4, 5, and can be used as gene therapy vectors (L.R. Braid, C.A. Wood, and B.N. Ford, manuscript submitted for publication) 6, 7. Thus, HUCPVCs present a promising platform technology for developing off‐the‐shelf MSC therapies.
MSCs are a heterogeneous population 8, 9 that includes cell types with different growth kinetics and clonal capacities which can give rise to progeny with variable fate commitments and therapeutic potency 8, 10, 11, 12, 13. Once removed from the natural perivascular niche and the associated signaling mechanisms that orchestrate the balance of cell types, the cell population changes in response to ex vivo culture conditions 9, 13, 14, 15, 16, 17. For example, single cell‐derived HUCPVC clones exhibit a hierarchical loss of self‐renewal and multipotency 13. In the absence of active selection or self‐renewal, faster cycling cells may displace cell types with slower growth kinetics and become over‐represented. Moreover, culture conditions that modify or fail to provide specific metabolic, compartmental or other signaling requirements normally provided by the niche apply further selective pressure, whether intentional or not 17.
For optimal efficacy, most cell therapists strive to use MSCs at the soonest opportunity after harvest 18, 19 to ensure maximum similarity to their freshly isolated state. It is imperative that expanded cells retain full functionality to achieve clinical endpoints. Generating sufficient cells for an effective treatment, however, necessitates large‐scale in vitro expansion that may exceed the optimal cultivation parameters. Although such in vitro expanded cells have consistently proven safe in clinical trials 20, the therapeutic benefits achieved in preclinical studies, using low passage cells, are often not recapitulated in scaled‐up human trials where prolonged expansion is required to produce sufficient cell doses 9, 21, 22.
The most common source of growth factors to support rapid in vitro expansion of MSCs is animal serum, such as fetal calf serum (FCS). However, FCS is a potential source of pathogens, can elicit immunological reactions in humans, is prone to variable composition, and has a limited production capacity that cannot support commercialized cell therapies 23, 24, 25. Human blood derivatives, including serum, platelet‐rich plasma, and platelet lysate or fractions thereof, are animal‐free alternatives to FCS but are also subject to source variations that exacerbate the cost of goods 23, 26. Moreover, these additives may have pleiotropic effects on the biological characteristics of the cells 26, 27, 28, 29, 30; for example, human platelet lysate is known to stimulate an inflammation‐like profile in cultured MSCs 31. Ideally, MSCs could be rapidly expanded to clinical quantities in a chemically defined culture media devoid of animal and human serum additives. However, such media formulations do not always provide sufficient nutritional support to match the expansion kinetics of MSCs cultured in serum‐supplemented media 28, 32.
The purpose of this study was to characterize the culture‐adapted evolution of previously cryopreserved HUCPVCs cultivated in chemically defined xeno‐ and serum‐free media. Many previous studies have compared the transcriptome of various MSCs at selected passages or population doubling levels (PDLs), typically comparing mid‐passage and/or late passage cells to early passage cells 33, 34, 35, 36, 37, 38. The limitation of this “snapshot” approach is that it fails to capture nonsimultaneous changes occurring in biomarkers of interest or between different metrics of cell aging, including expansion kinetics, cell morphology, and transcriptome profiles. Thus, selection of optimal expansion parameters for a continuously evolving cell population has not been feasible. Here, we evaluated the rate and extent of transcriptome divergence of HUCPVCs over time, using RNA microarray analysis at each passage until replicative senescence, concurrently with growth kinetics and cell morphology. Our goal was to gain an in‐depth understanding of the HUCPVC cell source and inevitable evolution of the cell milieu subjected to prolonged ex vivo expansion. The resulting data will inform optimal exploitation of the HUCPVC cell source, such that maximal cell expansion can be achieved while preserving the therapeutic potential of early passage HUCPVCs.
Methods
Cell Source
An extensively characterized neonatal MSC population, HUCPVCs 1, 5, 13, 39, 40, 41, was provided by Tissue Regeneration Therapeutics (TRT), Inc. (Toronto, ON, Canada). Using a proprietary explant process, HUCPVCs are isolated from the perivascular region of Wharton's jelly 2 from healthy term (>37 weeks) umbilical cords delivered by C‐section and cultivated in mesenchymal stem cell growth media—chemically defined (MSCGM‐CD; Lonza, Walkersville, MD). HUCPVCs are defined by TRT as: positive for the cell surface markers CD73, CD90, CD105, CD10, CD140b, CD146 (40%–60%), CD166, and MHC‐I and negative for the cell surface markers CD45, CD31, CD34, and HLA‐DR, and exhibit trilineage potential (adipogenesis, chondrogenesis, and osteogenesis) in directed differentiation assays. After 7 days, HUCPVCs at PDL 4.87 (±0.68) are subcultured to passage 1 (P1) at a seeding density of 1,333 cells per centimeter square in MSCGM‐CD. P1 HUCPVCs are expanded to PDL 10.04 ± 1.36 (n = 59 cords) and then cryopreserved.
Cell Culture
HUCPVCs at mean PDL (mPDL) 10 (P1) were recovered from cryostorage according to TRT's proprietary standard operating procedures and seeded at a density of 1,333 cells per centimeter square in MSCGM‐CD according to TRT's recommended expansion protocol. Thawed HUCPVCs meet internationally accepted minimal criteria for MSCs 42 (Supporting Information Fig. S1A) and exhibit trilineage potential 6, 40, 43 (Supporting Information Fig. S1B). Culture vessels were precoated with fibronectin (Corning, Corning, NY) at 0.75 μg/cm2 diluted in 0.133 ml/cm2 Dulbecco's phosphate‐buffered saline without calcium or magnesium (DPBS−/−; ThermoFisher Scientific, Waltham, MA). Cells were incubated at 37°C, 5% CO2 with media changes every 3–4 days. Cells were passaged once the monolayer reached 70%–80% confluence (2.0–4.5 × 10⁴ cells per centimeter square, depending on cell size).
Immediately before passaging, cells were photo‐documented by phase‐contrast microscopy using a Nikon Eclipse TS100 inverted microscope (Nikon, Tokyo, Japan) mounted with an Amscope MU300 microscope camera. Images were captured at a final magnification of ×10. Micrographs were cropped in Adobe Photoshop CS6 using fixed dimensions to preserve relative cell size attributes. Culture media was aspirated and cells were washed with DPBS−/− and then enzymatically detached using TrypLE Select (ThermoFisher Scientific). Once cells were dissociated, an equal volume of MSCGM‐CD was added to the suspension and cells were counted with a Millipore Scepter cell counter using 60 μm probes (Millipore, Billerica, MA). Cell viability was consistently 94%–98%, as determined by Trypan blue exclusion using a TC20 Automated Cell Counter (Bio‐Rad, Hercules, CA). PDL was calculated using the following formula:
where X e is the final viable cell count, X b is the initial seeded cell count, and S is the PDL at the start of the culture incubation.
Cells were centrifuged at 149g for 5 minutes, and the cell pellet resuspended in fresh MSCGM‐CD. Seeding density for all passaging procedures was 1,333 cells per centimeter square. The remaining cells were collected for RNA extraction: cells in suspension were pelleted by centrifugation as described above, supernatant removed, and resuspended in 0.5 ml of RNAprotect cell reagent (Qiagen, Germantown, MD) for storage at −80°C.
HUCPVC donor populations derived from two females (F1 and F2) and two males (M1 and M2) were cultured independently. Cells were serially cultured until they reached replicative senescence; for the purposes of this study, senescence was defined as subconfluence four or more weeks after seeding, indicative of replication failure. For technical assurance, donor population F2 was cultured a second time (F2.2); a subset of data points was analyzed by microarray to verify original experimental results. The final senescent passages did not yield sufficient RNA to facilitate microarray hybridization or analysis for any population.
RNA Extraction
Qiagen RNeasy Plus Mini Kits (Qiagen) were used to extract RNA according to manufacturer's recommendations. Twenty microliters (μl) of 2 M dithiothreitol was added per milliliter of RNeasy Plus lysis buffer (RLT buffer), and 600 μl RLT buffer was used for each sample. RNA concentration and quality were assessed in 96 well plates using a BioTek Synergy HT microplate reader (BioTek Instruments Inc., Winooski, VT) and Gen5 2.05 software accounting for path length correction.
Microarray Processing
RNA expression was analyzed using GeneChip U133A 2.0 arrays (Affymetrix, Waltham, MA). RNA was amplified and labeled using GeneChip 3′ IVT Plus Kits (Affymetrix) following the manufacturer's instructions with the following modifications: 200 ng of RNA was used for cDNA synthesis and the total amount of cDNA for hybridization was increased from 10 to 20 μg. Arrays were hybridized for 16 hours at 45°C, 60 rpm in a GeneChip hybridization oven 640 (Affymetrix). Samples were registered in Affymetrix GeneChip control console (AGCC), and program FS450_0002 was used with GeneChip Fluidics Station 450 (Affymetrix). Chips were scanned using a GeneChip 3000 7G Scanner (Affymetrix), and the resulting probe array images were subjected to grid alignment and fluorescence intensity review in AGCC Viewer.
Microarray Gene Expression Statistical Analysis
Microarray .CEL files were analyzed using R 44 with Bioconductor 45 packages. Preprocessing (GC robust multi‐array average [GCRMA] background adjustment, normalization, and log2 expression matrix output) was performed using GCRMA 46 and Affymetrix U133A 2.0 probe affinity data. Data quality related to RNA hybridization was interrogated using simpleaffy 47, 48, following GeneChip analysis guidelines 49. The final set of 57 arrays had 51.8%–60.1% of genes called present with 42.7–88.3 normally distributed background units, indicative of good quality 47, 49. Batch effects were explored by evaluating all BatchQC 50 metrics with and without ComBat 51 adjustment. The data have been deposited in NCBI's Gene Expression Omnibus database 52, available through accession number GSE119987.
Comparisons, differential expression assessment, and presentation of results were performed using limma 53. Linear modeling for comparisons of P2 versus each subsequent passage was designed to allow repeated sampling within each cell population by empirical Bayes‐moderated paired t tests 54. A comparison of cells from male versus female donors did not include such cell population blocking. Significantly differentially expressed (DE) probe sets were designated as having a Benjamini‐Hochberg 55 false discovery rate adjusted p value (q) of <.05. Annotation information was accessed through AnnotationDbi 56, 57, and heat maps were plotted using simpleaffy 47.
Functional enrichment analysis was performed using tools from DAVID (the database for annotation, visualization and integrated discovery) 58, 59 with default settings, and in limma 53 using: gene ontology (GO) biological process over‐representation tests (Fisher's exact test), ROMER (rotation testing using mean ranks), ROAST (rotation gene set testing) 60, and CAMERA (correlation adjusted mean rank gene set test) 61 matched to the Molecular Signatures Database 62, 63 C5 biological process GO gene sets and/or C1 positional gene sets. Many of the test results were accompanied by a low degree of statistical significance and/or a low number of DE probe sets, with related enriched terms seldom grouping together and thus were not informative of meaningful functional differences and not reported.
Results
HUCPVCs Consistently Display Robust Growth Potential
HUCPVCs from four donors, including two male and two female populations, were recovered from cryostorage at mPDL 10 (P2) and serially passaged in chemically defined media until they entered replicative senescence. Sarugaser et al. 1 and others 13, 39, 64, 65, 66 since have characterized the growth dynamics of HUCPVCs and other Wharton's jelly MSCs in serum‐supplemented media. Consistent with their reports, cryobanked HUCPVCs exhibit a strong proliferative trajectory through mPDL 45 (P9), doubling at a consistent pace in all donor populations (Fig. 1A). Cell division significantly decelerated in later passages, preceding replicative senescence (Fig. 1A). Although doubling time diverged between populations after mPDL 45 (P9) (Fig. 1A), accumulated PDLs remained comparable until mPDL 56 (P12) (Fig. 1B). Passage number and PDL were closely correlated for all donor populations and slowly diverged over time (Fig. 1B). Thus, the expansion kinetics of early passage (P2–P5; mPDL 14–27) and mid‐passage (P6–P9; mPDL 32–45) HUCPVCs are minimally influenced by donor source, and growth potential is not substantially compromised until presenescence (P10–P12; mPDL 49–56).
Figure 1.
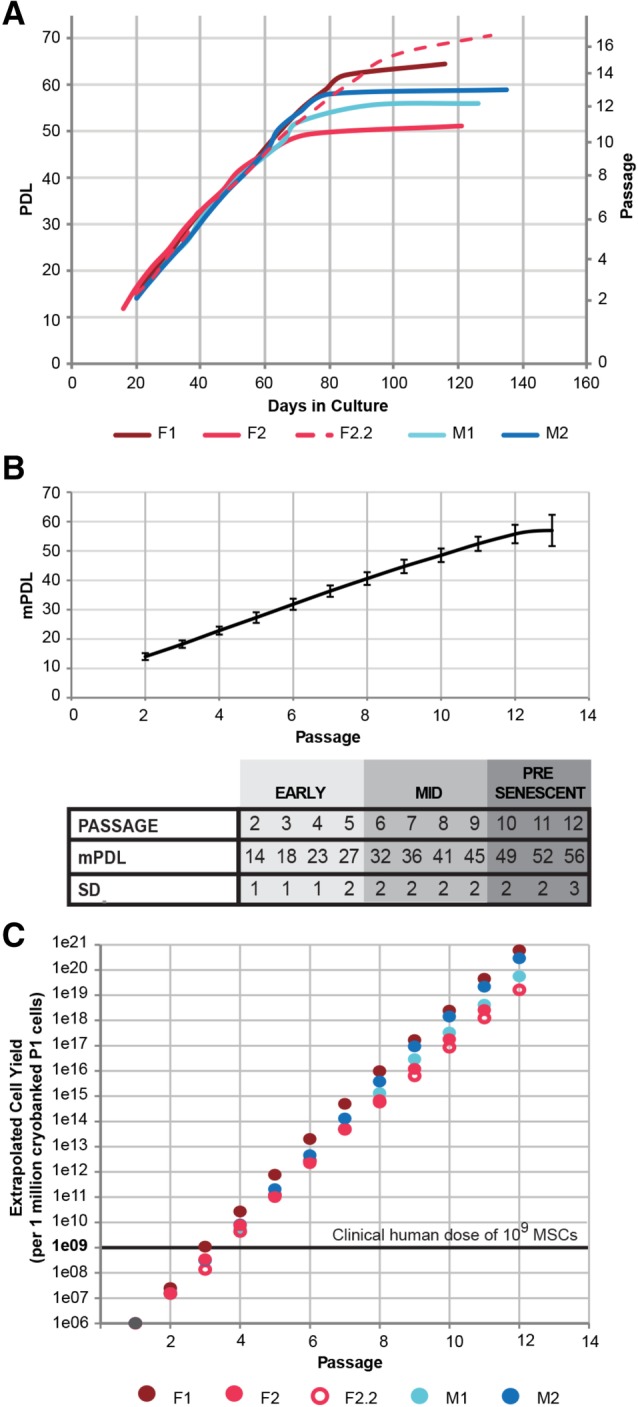
Human umbilical cord perivascular cells (HUCPVCs) consistently demonstrate high growth potential. (A): HUCPVCs from four different donors, including two M and two F donors, exhibit comparable and linear growth trajectories to P10 (mPDL 49), when the cells variably approach replicative senescence and doubling rate decelerates. Data reflect PDL and days in culture at the end of each passage. (B): The average accumulated doubling level (mPDL) of all donor populations correlates with passage number, particularly in early passage cells, and slowly diverges over time in culture. Thus, HUCPVC donor populations are comparably aged at all points of analysis until P12. (C): Extrapolation of potential cell yield, using the experimentally documented growth kinetics in (A), indicates that a seed stock of 1 million cryopreserved HUCPVCs can yield a clinical dose of MSCs by P4 (mPDL 23) in xeno‐ and serum‐free media. Abbreviations: F, female; M, male; P, passage; mPDL, mean population doubling level; MSC, mesenchymal stromal cell; PDL, population doubling level.
The potential cell yield from a cryopreserved 1 million cell aliquot was extrapolated using the experimentally documented doubling rates and live cell counts from each passage. A conventional adult human dose of 109 cells 67 can be generated by all donor populations by the end of P4 (mPDL 23; Fig. 1C). The consistent and robust proliferative capacity of HUCPVCs documented previously 1, 13, 39, 64, 65, 66 and here, in chemically defined media, supports their development as cellular therapies.
Microarray Data Quality
The extensive data set of 57 arrays, each of which contain 22,277 probe sets for 14,500 named human genes plus system controls, was interrogated for batch effects. To minimize operator‐induced variability, cell culture was performed by a small group of personnel in the same laboratory, whereas RNA extraction and microarray experiments were executed by a single individual. The parameters of “experimental start date” and “chip run date” should encompass any remaining potential sources of batch effects, such as reagent lot and laboratory conditions. The set of 57 data files included 5 different experimental start date batches and 8 chip run batches, for a total of 15 unique combined batches (Supporting Information Table S1). Using BatchQC 50, both potential sources of batch effects were trialed separately, because the combined variable lacked replicates in two batches. Nygaard et al. 68 caution against performing batch correction when study groups are not evenly distributed among batches. In this study, cell population had a strong correlation with both batches (r = .96). As the cell populations were unevenly distributed among array batches, the batches included low replicate numbers, and few expression differences were detectable without batch adjustment (Fig. 2A–2D), batch adjustment was deemed unnecessary.
Figure 2.
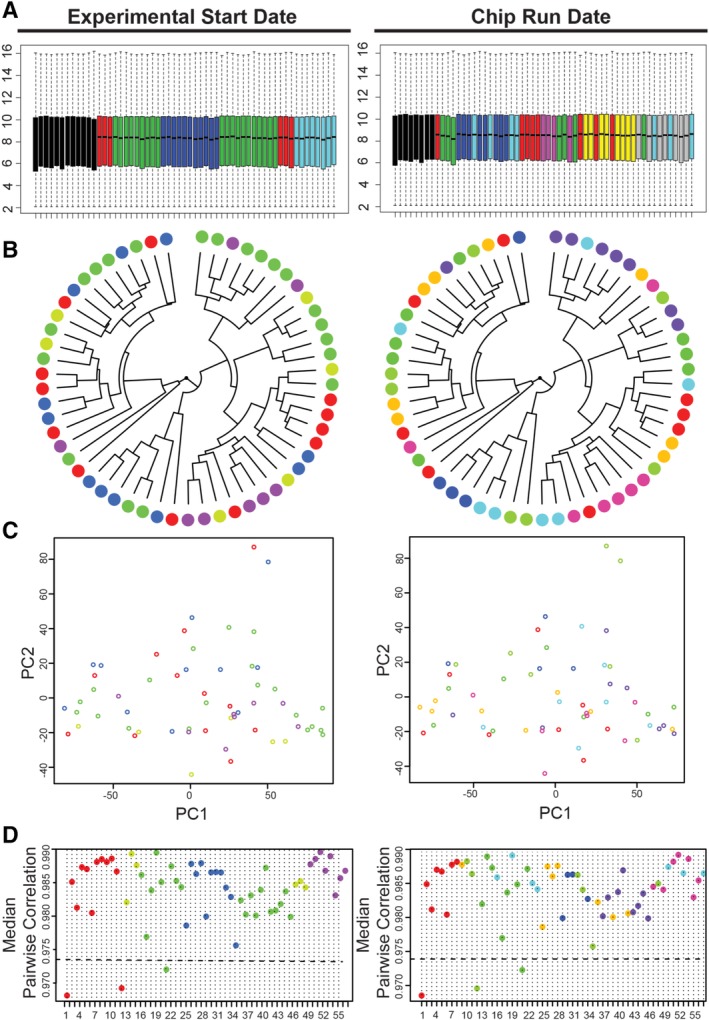
Batch effects are undetectable in the complete array data set. (A–D): Microarray data were color‐coded according to the potential sources of batch effects in this study—“Experimental Start Date” and “Chip Run Date.” (A): Boxplots of array expression intensity, colored by batch, show highly consistent expression intensity across the 57 microarrays and reveal no batch‐related differences. (B): Plotting the data using Spearman correlation and complete‐linkage clustering, (C) the top two principal components from principal components analysis, and (D) median correlations also fail to identify substantial batch‐related clustering. Abbreviation: PC, principal component.
Minimal Transcriptome Drift Is Evident in Early Passages
To characterize the pace and extent of transcriptome drift in culture‐expanded HUCPVCs, we performed a step‐wise comparison of each passage against P2, within each donor population, using moderated paired t tests. A striking trend of accumulating transcriptome drift over serial passaging is revealed by plotting the average log2 fold change of all genes against average expression intensity, relative to P2 (Fig. 3A). A marked increase in scatter occurred at P6 and again at P10, generating three tiers of transcriptome drift that correlate with the early passages, mid‐passages, and presenescent passages (Fig. 3A). Remarkably, not a single significantly DE gene (q < .05) was identified until P6, although hundreds of DE genes were evident and accumulated at later passages (Fig. 3A, 3B).
Figure 3.
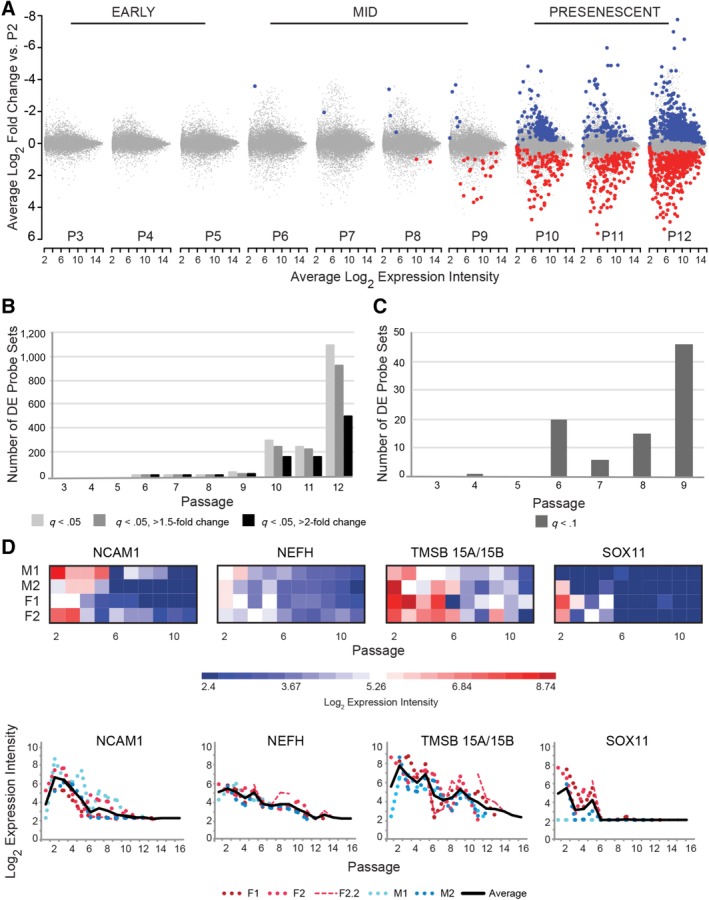
The transcriptome of human umbilical cord perivascular cells (HUCPVCs) is stable through P5. (A): Mean‐difference plots show the average log2 fold change and expression intensity across all donor populations for each probe set at the end of each passage versus P2. Significantly DE probe sets (q < .05) with lower expression (blue) and higher expression (red) compared with P2 increase in number and fold change over time. The degree of divergence from P2 can be segregated into three tiers of accumulated drift and correlates with the early passages, mid‐passages, and presenescent passages. (B): The number of significant DE probe sets (q < .05) versus P2 is plotted at each passage (light gray), including subsets of these with >1.5‐fold change (dark gray) and >2‐fold change (black). No significantly DE probe sets are identified before P6 and few are identified in mid‐passage cultures (P6–P9). After P9, the number of DE probe sets increases dramatically. (C): Using a highly relaxed threshold of q < .1, additional DE probe sets are identified in mid‐passage cells, whereas only one additional DE probe is identified in early passage cells. (D): Expression profiles of the four most downregulated genes at P6–P9 versus P2 cells are plotted by heat map and line graph. Expression trends are similar between the four HUCPVC populations, and expression intensity diminishes over time. The SOX11 probe set first detected as DE is represented, although all three probe sets exhibit the same expression trend (Supporting Information Table S6). Abbreviations: DE, differentially expressed; F, female; M, male; P, passage.
The largest subset of DE genes (1,094 probe sets; Fig. 3B) was selected to assess interdonor variation in transcriptome expression as a function of passage using the Pearson correlation coefficient (r) as a measure of similarity 69. A similarity matrix reveals high correlation of donor population transcriptomes over all passages with no apparent outliers (mean r = .96–.97) (Supporting Information Table S2). Interdonor variability was lowest in early passage and mid‐passage cells (mean r = .97–.98) and increased slightly in presenescent passages (mean r = .93 by P12) due to deviation of the M1 donor.
To identify genes with more subtle expression changes between P2 and P5, the q‐value threshold was relaxed to .1. Still, only one gene of interest (GOI), EPN1, met this criterion (Fig. 3C; Table 1). In three cell populations, EPN1 was more highly expressed at P4 than P2 (1.99‐fold change; Supporting Information Fig. S2B). The lack of DE genes meeting stringent or relaxed significance criteria between P2 and P5 (mPDL 14–27) suggests that evolution of the HUCPVC transcriptome is minimal within the early passages.
Table 1.
Genes of interest and associated functions of interest arising over time during human umbilical cord perivascular cell in vitro culture
| Symbol | Log2 FCa | Functionb |
|---|---|---|
| Early passages (3–5) | ||
| EPN1 | 0.3c | Endocytosis of clathrin‐coated vesicles; cell signaling 70 |
| FUZ | −0.4 | GO: embryonic organ morphogenesis (skeletal system) |
| GLI1 | −0.6 | GO: embryonic organ morphogenesis |
| HIPK2 | −0.5 | GO: embryonic organ morphogenesis, negative regulation of transcription, DNA templated |
| PCGF2 | −0.6 | GO: embryonic organ morphogenesis (skeletal system), negative regulation of transcription, DNA templated, chromosome and chromatin organization |
| SOX11 | −2.0 | GO: embryonic organ morphogenesis (skeletal system), negative regulation of transcription, DNA templated |
| Mid‐passages (6–9) | ||
| NCAM1 | −3.5 | Cell interactions during nervous, immune system development |
| NEFH | −1.8 | Maintains neuronal caliber; intracellular transport to axons, dendrites |
| SOX11 | −3.5 | Regulation of embryonic development, determination of cell fate (TF); GO: regulation of glial cell proliferation, spinal cord development |
| TMSB15A/B | −3.3c | Tissue regeneration: module migration, angiogenesis, immune responses 71, 72 |
| Presenescent passages (10–12): Decreased expression | ||
| CREB1 | −1.1 | GO: regulation of glial cell proliferation |
| GLI2 | −1.3 | GO: ventral spinal cord development, spinal cord motor neuron differentiation |
| IDH2 | −1.4 | GO: regulation of glial cell proliferation |
| LMO4 | −1.2 | GO: ventral spinal cord development, spinal cord motor neuron differentiation |
| ZC4H2 | −1.0 | GO: ventral spinal cord development, spinal cord motor neuron differentiation |
| Presenescent passages (10–12): Increased expression | ||
| COL8A2 | 3.9 | Encodes collagen in basement membrane of the corneal endothelium |
| DMD | 2.2 | GO: muscle organ development; regulation of skeletal and cardiac muscle contraction |
| DSP | 3.3 | Skin development and strength by anchoring intermediate filaments to desmosomal plaques |
| HIST1H2B‐C, ‐E, ‐F, ‐G, ‐H, ‐I, ‐K | 4.2 | Nucleosome structure, compaction of chromatin, antibacterial and antifungal antimicrobial activity |
| IDS | 1.5 | Lysosomal degradation of heparan sulfate, dermatan sulfate; chondrogenesis |
| KRT17 // JUP | 1.7 | Encodes type I intermediate filament chain keratin 17 // cytoplasmic protein of desmosomes, intermediate junctions; forms cadherin complexes |
| MFAP5 | 5.2 | Promotes attachment of cells to microfibrils of extracellular matrix |
| PCDH7 | 3.6 | GO: cell adhesion, cell–cell signaling, platelet degranulation |
| PSTPIP2 | 1.3 | GO: actin filament polymerization, cell migration, cytoskeleton organization |
| TAGLN | 1.1 | Early marker of smooth muscle differentiation, tumor suppressor; platelet degranulation |
| HIST2H2AA3/4 | 2.7 | DNA damage processes: cell cycle regulation, apoptosis |
| NSG1 | 3.0 | DNA damage processes: cell cycle regulation, apoptosis |
| RGCC | 2.7 | DNA damage processes: cell cycle regulation, apoptosis |
| SRGN | 1.3 | DNA damage processes: cell cycle regulation, apoptosis; GO: platelet degranulation, negative regulation of bone mineralization |
| THBS1 | 2.5 | DNA damage processes: cell cycle regulation, apoptosis |
| SLC20A2 | 1.4 | Solute carrier: cell metabolism, transmembrane support and signaling |
| SLC22A4 | 1.7 | Solute carrier: cell metabolism, transmembrane support and signaling |
| SLC31A2 | 1.1 | Solute carrier: cell metabolism, transmembrane support and signaling |
| WNT5A | 1.3 | Canonical WNT pathway activation 73 |
| WNT5B | 1.4 | Noncanonical WNT pathway activation 73 |
Average log2 fold change of most highly expressed probe set (if >1) for all designated passages; positive number is upregulated and negative is downregulated versus P2.
Taken from gene's RefSeq summary as provided by www.ncbi.nlm.nih.gov/gene or published literature search unless otherwise stated.
Not statistically significant at any of the designated passages, q > .05.
Abbreviations: //, nonspecific probe set; FC, fold change; GO, Gene Ontology biological process terms of interest; TF, transcription factor.
The potential functional consequences of the low‐significance, stochastic expression changes between P2 and P5 were explored to characterize early trends in HUCPVC culture adaptation. The top 100 DE probe sets were ranked by unadjusted p value at each passage (Supporting Information Table S3). Ninety‐two genes exhibited a 1.5‐fold change within the period of P3–P5 compared with P2 (p = 3.17 × 10⁻⁶ − 0.012) and were selected as GOIs (Supporting Information Table S4; Fig. S2A, S2B). The 45 GOIs most highly expressed at P2 were predominantly linked to embryonic morphogenesis (Table 1), chromosome organization, DNA binding, transcription and repair, epigenetic modification, chromatin silencing, and RNA biosynthesis and metabolism (Supporting Information Tables S4–S6).
Forty‐seven genes were more highly expressed during P3–P5 than at P2 (Supporting Information Table S4). The top over‐represented functions of these GOIs (Supporting Information Table S5) broadly related to development and muscle morphogenesis. Other enriched functions included vasoconstriction, regulation of necroptotic process, and macromolecule localization.
Mid‐Passage HUCPVCs Exhibit Moderate Transcriptome Drift Compared with P2
In the mid‐passages (P6–P9), transcriptome divergence from P2 became increasingly evident. A single significantly DE gene (q < .05) was identified at P6 and P7 compared with P2, whereas 5 DE genes were detected at P8 and 27 at P9 (Fig. 3A, 3B; Supporting Information Table S7). NCAM1/CD56 was first significantly downregulated at P6 (Fig. 3D; Table 1). Plotting NCAM1 expression over all passages revealed a general decreasing trend, although peaks and troughs in expression intensity are apparent in half of the cell populations (Fig. 3D). NEFH was among the top nonsignificant DE genes at P6–P9 (Table 1) and the only significant DE gene at P7. TMSB15A/15B was among the top three most downregulated genes at passages 6, 7, and 8 (Fig. 3D; Table 1). Multiple probe sets for the transcription factor SOX11 were included in the 10 most downregulated probe sets at P6–P9 (Supporting Information Table S7). SOX11 expression declines steeply to P6, and then remains undetectable (Fig. 3D) except in population M1, which lacked SOX11 expression as of P2. Relaxing the q‐value threshold to .1 revealed 20 additional moderately DE genes at P6 with greater accumulating changes evident by P9 (Fig. 3C; Supporting Information Table S7).
Presenescent HUCPVCs Become Transcriptionally Divergent
In contrast to early passages, differential gene expression increased substantially during P10–P12, the presenescent passages (Fig. 3A, 3B). The number of significantly DE probe sets increased from 27 (P9) to 301 (P10), then to 1,094 (P12) (Fig. 3B). The rapidly expanding transcriptome scatter in P10–P12 cultures correlated with conventional signs of aging including prolonged doubling times (Fig. 1A) and morphological changes (Fig. 4A). Aging MSCs stereotypically exhibit large nuclear to cytoplasmic ratio, enlarged cells with angular perimeters, and stress fibers from actin‐myosin cytoskeletal filaments 64. These visible signs of aging accumulated subtly with each passage until P10–P12 when enlarged, angular cells with obvious stress lines became more prevalent in the culture (Fig. 4A).
Figure 4.
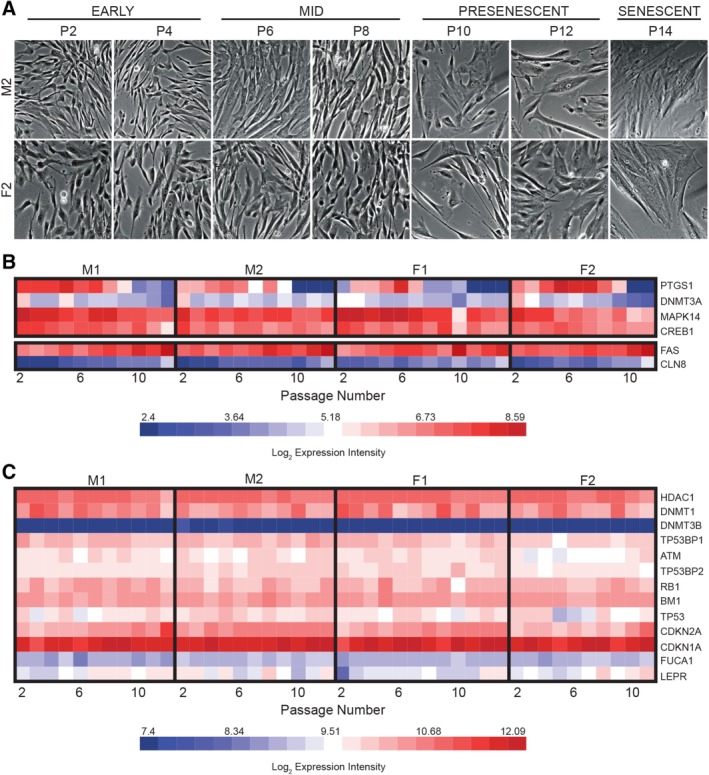
Cell aging is not evident in human umbilical cord perivascular cells (HUCPVCs) before P10. (A): Representative photomicrographs of M2 (top row) and F2 (bottom row) serially expanded HUCPVCs reveal gradual accumulation of physical signs of aging, including enlarged cells, high nucleus to cytoplasmic ratio, increased granulation, and accumulation of stress fibers. These morphological changes become more prevalent in presenescent cells after P10, particularly in senescing cultures (P14). Micrographs were captured at ×10 magnification and cropped using fixed dimensions to preserve relative cell size attributes. (B): Expression intensity of genes related to senescence or aging gene ontology terms with significantly differential expression at P10, P11, and P12 compared with P2, represented by heat map. Differentially expressed genes with both lower expression (top panel) and higher expression (bottom panel) at P10–P12 compared with P2 were identified. (C): Heat map of expression intensity of select known senescence markers, clustered based on Pearson correlation. Many well‐characterized markers do not reliably report cellular aging or replicative senescence in HUCPVCs cultured in serum‐ and xeno‐free conditions. Abbreviations: F, female; M, male; P, passage.
Cell Aging Genes Are Not Predictive Biomarkers at Mid‐Passages
The correlation between prolific transcriptome variability (Fig. 3A, 3B) and physical manifestations of replicative senescence (Fig. 4A) suggested that the accumulating DE genes at the presenescent passages might have functional roles related to cell aging. The DE probe sets at each of P10, P11, and P12 with >1.5‐fold change compared with P2 (q < .05; Supporting Information Table S8) were interrogated for GO biological processes related to cellular aging and senescence. At all three passages, the GO terms “cell aging,” “cellular senescence,” “negative regulation of cell proliferation,” “cell death,” and “cell fate commitment” were indeed represented. “Aging” was also an enriched term identified by ROMER and CAMERA 61. Interestingly, only a small subset of the DE genes functioning in negative regulation of cell proliferation, cellular senescence, and aging as classified by GO were common to all three late passages (Fig. 4B). Temporal expression profiles of these genes were plotted to query whether these GOIs might include predictive biomarkers of aging and attenuated clinical utility in P5–P9 HUCPVCs, before visible signs of aging. None of these genes, either decreasing (PTGS1, DNMT3A, MAPK14, and CREB1) or increasing (FAS and CLN8) in expression from P2 to P12 (Fig. 4B), proved to be reliable predictors of cell aging until the late passages when aging was already visually apparent and so are not useful as predictive biomarkers of aging in mid‐passage cells.
Expression dynamics of senescence markers reported in the literature were also evaluated. Senescence genes can be disparate between MSC sources and culture conditions, and the majority was not significantly represented in this study. The canonical senescence marker gene LEPR did exhibit considerably increased expression in the late presenescent passages (Fig. 4C). Some commonly cited senescence markers, such as DNMT3B and CDKN1A, displayed consistent expression intensity over time (Fig. 4C) and thus were not indicators of cellular aging or senescence for HUCPVCs cultured in chemically defined media. Additional biomarkers, such as TP53 and ATM, exhibited nonlinear changes in expression over culture life and thus were not reliable predictors of senescence. In this study, then, aging and senescence manifested as an accumulation of changes at the transcriptional level, in addition to differential expression of a small set of aging and senescence‐related genes.
Functional Trajectory of Transcriptome Drift
To elucidate broad changes in cell utility due to prolonged culture adaptation, we examined the function of DE genes with >1.5‐fold higher expression at P2 compared with P10–P12 (Supporting Information Table S8). Top over‐represented GO terms were related to central nervous system development, gene expression, metabolic processes, regulation of transcription, and macromolecule biosynthesis (Table 1; Supporting Information Table S9). Overall, early passage HUCPVCs exhibit robust expression of genes involved in transcription, translation, cell division, DNA repair, ATP binding, and neurogenesis (Supporting Information Table S10). Enrichment for these genes in early passage HUCPVCs is consistent with the notion that the functional potency of MSCs diminishes with age in ex vivo culture 9, 14, 15, 16, 18, 74.
To better define the characteristics of presenescent HUCPVCs, the data were interrogated for significantly DE probe sets (q < .05) exhibiting >2‐fold change at P10, P11, and P12 versus P2. This yielded 52 probe sets, corresponding to 43 genes, that were DE at all three presenescent passages (Fig. 5A, 5B, Supporting Information Table S8) and exhibited log2 fold changes of up to 7.35 (237‐fold change). Several of these genes had already been identified in earlier interrogations for DE genes at P6–P9 (NCAM1, NEFH, and SOX11) or as aging and senescence markers (MAPK14, PTGS1, and DNMT3A). The identity of genes upregulated at the presenescent passages compared with P2 (Fig. 5B; Table 1) suggests an overall shift toward structural function, cell cycle regulation, and stress response, including apoptosis (Supporting Information Table S9).
Figure 5.
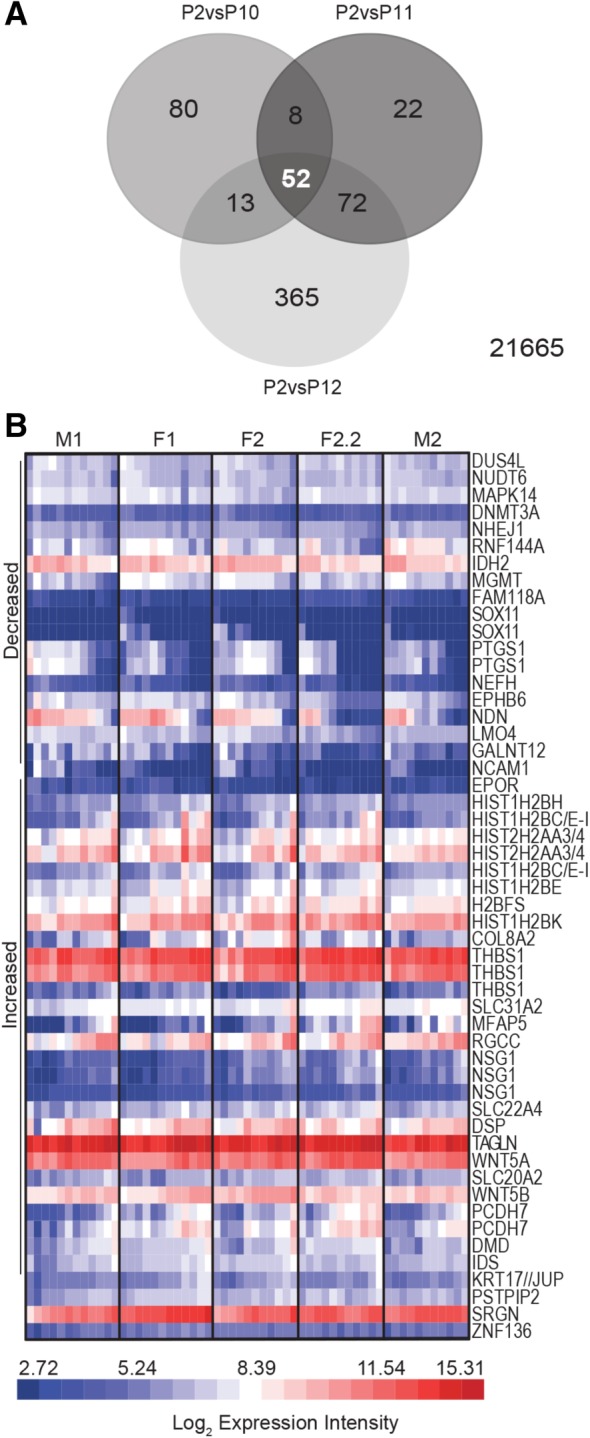
Genes with consistent expression differences between early and presenescent human umbilical cord perivascular cells (HUCPVCs) have multifarious functions. (A): Venn diagram of significantly differentially expressed (DE) probe sets (q < .05) with >2‐fold difference between P2 and P10, P11 and P12. Fifty two probe sets, corresponding to 43 genes, are common to the three presenescent passages. Twenty‐one thousand six hundred sixty five probe sets did not meet this criterion. (B): Expression intensity of the 52 commonly DE probe sets identified in (A) represented by heat map. Probe sets are segregated by those with decreased (top) and increased (bottom) expression intensity versus P2, clustered based on Pearson correlation. All passages analyzed, beginning at P2 through senescence, are represented. Expression trends are highly consistent between all HUCPVC donor populations, including the technical replicates F2 and F2.2. Abbreviations: F, female; M, male; P, passage.
Comparative Analysis of Male and Female HUCPVCs
We next examined male and female donor HUCPVC transcriptomes for potential therapeutic differences. One hundred eighty unique genes with >1.5‐fold difference between sexes (88 higher in males, 92 higher in females) were identified (Supporting Information Table S11). Of these, 63 showed >2‐fold difference between sexes (38 higher in males and 25 higher in females).
The most significantly DE genes corresponded to sex chromosomes and could be categorized as Y linked or X inactive (Fig. 6A, 6B). However, most DE genes were autosomal (q = 0.0496 – 1.96 × 10⁻¹⁰; log2 fold change 0.585–3.21). The autosomal genes most highly expressed by male cells included CXCL12, PDGFRL, lRRC15, GSTT2, LAMC2, NFIB, ZFBM2, GSAP, and SRSF6 (Fig. 6B). Female cells exhibited significantly higher expression of MAB21L2, FPR1, MCTP2, AGTR1, ARHGDIB, NEFM, PPAT, and ELP5 (Fig. 6B).
Figure 6.

Autosomal gene expression differences are modest between male (M) and female (F) human umbilical cord perivascular cells (HUCPVCs). (A): Mean‐difference plot of probe set expression differences between M and F HUCPVC populations. The most significantly differentially expressed (DE) genes (q < .05) are sex linked, and map to the Y chromosome (red circles), or are X inactive (green circles). (B): Heat map of DE genes between M and F HUCPVCs exhibiting two‐fold change, ranked from highest expression in M to highest expression in F HUCPVCs. Red font: Y‐linked genes; black font: autosomal genes; green font: X‐inactive genes. Although overall expression intensity differences are detected between M and F populations for these genes, the majority of DE autosomal genes are not strikingly different between the sexes. N/A, gene symbol not applicable as probe set has not been classified. Abbreviations: F, female; M, male.
Functional enrichment tests generated broad and specific top over‐represented GO terms for female HUCPVCs related to neuronal patterning, dendritic cell apoptosis, lipid metabolism, and alcohol catabolism (Supporting Information Table S12). Female HUCPVC DE genes are involved in functional clusters for mRNA processing, GTPase activation, and transcription regulation (Supporting Information Table S13). DE genes more highly expressed by male HUCPVCs are associated with negative regulation of cell death and mesenchymal cell proliferation, dermatan sulfate biosynthetic and metabolic processes, and responses to endogenous stimulus (Supporting Information Table S12). Male HUCPVCs have an enriched functional cluster for transcription regulation, similar to females, as well as for cell adhesion (Supporting Information Table S13). However, the functional enrichment tests did not identify strong links between DE genes that clearly report clinically relevant GO terms including regenerative processes, wound healing, or immunomodulation.
Discussion
HUCPVCs represent a robust neonatal MSC platform with potential for a range of applications, particularly acute indications requiring an off‐the‐shelf treatment modality 6, 8, 40, 75, 76. The current study comprises an important component of the preclinical assessment of the benefits and limitations of the HUCPVC cell source cultivated in chemically defined xeno‐ and serum‐free media. Accumulating preclinical evidence supports development of HUCPVCs, cultivated in chemically defined media, as therapeutics that can attenuate acute respiratory response syndrome 40 and reduce inflammation 75, 76, 77 with superior outcomes compared with bone marrow‐derived MSCs 40, 77. In addition, intramuscularly implanted xeno‐ and serum‐free HUCPVCs persist in situ where they remain metabolically and secretorially active 43, 77 and have delocalized anti‐inflammatory benefits 77. Herein, we sought to define the practical parameters of cell expansion and transcriptome stability of HUCPVCs, cultivated in chemically defined xeno‐ and serum‐free media, to support scale‐up and clinical translation of promising preclinical outcomes.
The expansion kinetics documented here indicate that, within approximately 16 days of recovery from cryopreservation, a single aliquot of 1 million HUCPVCs at P1 (mPDL 10) can yield a standard human dose of 109 MSCs at P4 (mPDL 23) in chemically defined media. HUCPVC donor populations exhibited equally strong growth trajectories and doubling rates until the cultures variably approached replicative senescence after P10 (mPDL 49). Our findings are consistent with Batsali et al.'s report that human umbilical cord MSCs derived from different donors exhibit comparable growth kinetics, unlike bone marrow MSCs which are susceptible to donor‐influenced doubling rates and finite doublings 66, a drawback of adult‐derived MSCs 14. The robust proliferative potential of HUCPVCs in serum‐supplemented media 1, 13, 39, 64, 65, 66 was recapitulated here in serum‐ and xeno‐free media. Other xeno‐ and serum‐free media formulations also reportedly support robust MSC expansion. For example, Swamynathan et al. 78 demonstrated superior proliferative capacity of Wharton's jelly MSCs cultured in Mesencult XF (Stemcell Technologies) compared with FCS‐cultured cells. By contrast, Wang et al. 28 reported impaired proliferation of umbilical cord‐derived MSCs in the same chemically defined media used in this study compared with MSCs cultivated in FCS‐supplemented media. A concomitant downregulation of cell cycle, mitosis, and proliferation genes was observed, although the immune‐suppressive effects of the cells were unchanged in vitro 28. The disparate growth potentials documented in that study and here may reflect the different adhesion substrates used in the culture protocols. In this study, HUCPVCs were cultured on fibronectin‐coated vessels, whereas Wang et al. used culture vessels with a chemically altered attachment surface 28.
The transcriptome profiles presented here illustrate the dynamic, culture‐driven evolution of HUCPVCs. Expression of both SOX11, a proposed biomarker for early progenitor human MSCs 35, and the proposed umbilical cord progenitor cell marker NCAM1 79 decline from P2 and are significantly reduced or lost by P6, when transcriptome drift is first detected at a significant level. However, the stochastic decline in NCAM1 expression intensity suggests that NCAM1 levels may not accurately report the progenitor state at a given PDL. Genes functionally linked to neurogenesis were also enriched at low PDLs and decreased as a function of passage. Prior reports have characterized the neurogenic potential of Wharton's jelly MSCs 80, 81; this study reveals that therapeutic potential may be limited to early‐ or mid‐passage HUCPVCs depending on the required levels of specific neurogenic genes. Early passage HUCPVCs were also enriched for genes with products linked to cellular metabolism and ATP binding. Moya et al. 82 recently demonstrated that survival of implanted MSCs is limited by glycolytic availability of ATP. We previously reported that the survival of intramuscularly implanted presenescent HUCPVCs is compromised compared with early‐ and mid‐passage HUCPVCs 43. Taken together, we propose that the diminishing expression of metabolic genes shown here may contribute to reduced or variable therapeutic efficacy reported for high passage cells 9, 21, 22.
The broad sense of the accumulating late‐passage changes is of a cell population, or dominant subpopulation, beginning to adopt cell fate commitments with a concomitant reduction of the progenitor cell state. Expression of genes encoding collagen, dystrophin, desmoplakin, and keratin, as well as genes related to extracellular matrix, cytoskeletal arrangement, and chondrogenesis significantly increased in presenescent passages. Genes functionally linked to DNA damage processes including cell cycle regulation and apoptosis also became enriched, in addition to aging and senescence‐related genes. Expression of genes encoding a family of histones with reported antibacterial and antimicrobial functions (HIST1H2B‐C, ‐E, ‐F, ‐G, ‐H, ‐I, ‐K) also increased as a function of PDL. Wang et al. 28 reported a similar upregulation of this histone family in P10 umbilical cord‐derived MSCs cultured in the same media and compared with FCS‐supplemented cells.
Interestingly, Ren et al. 83 reported similar late passage changes in a longitudinal transcriptome study of bone marrow‐derived MSCs cultured in FBS‐supplemented media. They also documented an age‐related transition by P6, before the onset of senescence‐associated markers and phenotype 83. These similar outcomes for neonatal and adult‐sourced MSCs, cultured in chemically defined versus FBS‐supplemented media, respectively, imply that the trajectory of MSC culture adaptation may be comparable across tissue source and media formulation. Given the volume of reports describing variable growth potentials, finite doublings and therapeutic efficacy as a function of cell source and culture conditions, among numerous other variables, we postulate that the pace and extent of transcriptome drift may prove context dependent. The cell therapy field is still deciphering the impact of culture media formulations and growth supplements on the biological properties of MSCs, and their consequent therapeutic potential. A growing number of xeno‐ and serum‐free media alternatives that support MSC proliferation, multipotency, and chromosome stability 78, 84, 85, 86, 87, 88 are becoming available; the influence of these different formulations on transcriptome drift is yet to be determined.
The concept of in vitro drift has important implications for the development of cell‐derived therapies. The initial heterogeneous MSC milieu changes in response to intrinsic and extrinsic factors in culture, and these changes accumulate with time in culture or passage 9, 14, 15, 16, 74. This study characterizes the pace and extent of such evolution, revealing a previously uncharacterized undercurrent of transcriptome drift. Statistically relevant transcriptome drift was evident in robustly proliferating cultures with cell morphologies consistent with young cells, therefore preceding physical manifestations of aged cells. In the different enrichment tests used, surprisingly few DE genes exhibited functional coregistration. Thus, further work is necessary to elucidate the functional outcomes of each tier of transcriptome drift with respect to therapeutic utility. The gradual loss of continuity within the MSC cultures, culminating in substantial heterogeneity, is an important challenge for manufacturing consistent cell products. Of greater concern, it implies that the use of aged or late passage cells may lead to variable clinical outcomes, rather than simple therapeutic failure. We propose that reproducible therapeutic outcomes are best supported by protocols that limit cell expansion to the first or second tier of transcriptome drift.
The optimal expansion window may be context dependent, not only between culture protocols and MSC types but also for specific downstream applications of a single MSC source and manufacturing protocol. The dynamics of transcriptome drift illustrated here are not adequately captured by a conventional “snapshot” approach using a few select doubling levels for comparison. Data from representative passages do not allow for optimization using a biomarker panel in which expression dynamics may be discordant. The uninterrupted transcriptome profiles reported here will allow us to interrogate for biomarkers of interest and to evaluate relative levels of desired genes of interest to refine parameters for maximum cell expansion without compromising therapeutic efficacy. We anticipate that the dynamics of transcriptome drift described here, for static cultures, will need to be reassessed once protocols for optimal HUCPVC expansion in three‐dimensional bioreactor cultures have been developed.
Conclusion
Transcriptome drift accumulates as a function of serial passage and precedes standard metrics of replicative exhaustion. To ensure reproducible clinical outcomes, MSC manufacturing protocols would ideally limit cell expansion to PDLs preceding significant transcriptome drift. In the absence of ill‐defined additives such as animal serum or human platelet lysate, cryobanked HUCPVCs can be reliably expanded to clinical human doses within the first tier of transcriptome drift and are therefore well‐suited for development of consistent cell‐based therapeutics.
Author Contributions
D.M.W.: collection and/or assembly of data, data analysis and interpretation, manuscript writing, critical review of the manuscript, final approval of manuscript; C.C.R., C.A.W.: collection and/or assembly of data, critical review of the manuscript, final approval of manuscript; B.N.F.: conception/design, data analysis and interpretation, financial support, critical review of the manuscript, final approval of manuscript; L.R.B.: conception/design, collection and/or assembly of data, data analysis and interpretation, manuscript writing, critical review of the manuscript, final approval of manuscript.
Disclosure of Potential Conflicts of Interest
L.R.B. is an officer and a shareholder of Aurora BioSolutions Inc. The other authors indicated no potential conflicts of interest.
Data Availability Statement
The data have been deposited in NCBI's Gene Expression Omnibus (GEO) database 52, available through accession number GSE119987.
Supporting information
Supporting Information File 1, Figure S1 (.pdf): Characterization of post‐thaw HUCPVCs (A): The internationally accepted MSC cell surface marker profile was confirmed on P3 HUCPVCs after thaw. Cell surface markers were labeled using the BD Stemflow human MSC (hMSC) Analysis Kit (BD Biosciences) and detected using a FACSAria II flow cytometer (BD Biosciences). Detection of CD105‐ PerCP‐Cy5.5, CD73‐APC, CD90‐FITC, and no detection of CD45/CD34/CD11b/CD19/HLA‐DR‐PE confirms that HUCPVCs recovered from cryopreservation still meet the ISCT's minimal criteria for MSCs. CD44‐PE is an additional marker not included in the minimal criteria. The surface marker profile of HUCPVCs is more comprehensively defined in the Materials and Methods. (B): Multi‐differentiation potential was assessed by directed differentiation into adipogenic, chondrogenic and osteogenic lineages (Lonza; PT‐3004, PT‐3003 and PT‐3002, respectively), and visualized using AdipoRed (Lonza; PT‐7009), OsteoImage (Lonza; PA‐1503) and Alexa488‐conjugated antibodies targeting Collagen II (Abcam; 34,712), respectively. Fluorescence from adipogenic and osteogenic cultures was captured at 260X magnification using an EVOS digital microscope (ThermoFisher Scientific). Collagen II‐stained chondrogenic micromass pellets were imaged at 400X magnification using a Quorum WaveFX laser scanning confocal microscope (Quorum Technologies Inc.). Post‐thaw HUCPVCs retain tri‐lineage potential consistent with their characterization as MSCs. Abbreviations: HUCPVCs, human umbilical cord perivascular cells, MSC, mesenchymal stromal cell; P, passage; ISCT, International Society for Cell and Gene Therapy.
Supporting Information File 3, Figure S2 (.pdf): Expression intensity of genes with > 1.five‐fold change between any of P3, P4 and/or P5 versus P2. Genes displayed in heat maps are a subset of the top 100 DE probes (ranked by lowest unadjusted p‐values) at each passage versus P2. (A): DE genes with lower expression intensity after P2. (B): DE genes with higher expression intensity after P2. Abbreviations: DE, differentially expressed; F, female; M, male; P, passage.
Supporting Information File 2 (.xlsx): Supplementary Tables. Complete lists of DE genes or GOIs identified in all reported interrogations, and select functional enrichment test outputs, summarized in 13 Tables (1 table per worksheet following Table of Contents). Tables include probe set IDs, gene symbols, full gene names, log2 expression intensity and fold change values, significance test statistics, GO terms and GO IDs as per the specified interrogation. Abbreviations: DE, differentially expressed; GOIs, genes of interest; GO, Gene Ontology; ID, identification number. Any footnotes or additional abbreviations are included at the bottom of each table.
Acknowledgments
We thank Tissue Regeneration Therapeutics Inc. (TRT), Toronto, Canada, for provision of HUCPVCs. This work was funded by Public Service and Procurement Canada contracts 145669, 155729, and 175853 to Aurora BioSolutions Inc.
Reproduced with the permission of the Minister of Defence.
References
- 1. Sarugaser R, Lickorish D, Baksh D et al. Human umbilical cord perivascular (HUCPV) cells: A source of mesenchymal progenitors. Stem Cells 2005;23:220–229. [DOI] [PubMed] [Google Scholar]
- 2. Davies JE, Walker JT, Keating A. Concise review: Wharton's jelly: The rich, but enigmatic, source of mesenchymal stromal cells. Stem Cells Translational Medicine 2017;6:1620–1630. [DOI] [PMC free article] [PubMed] [Google Scholar]
- 3. Ennis J, Götherström C, Le Blanc K et al. In vitro immunologic properties of human umbilical cord perivascular cells. Cytotherapy 2008;10:174–181. [DOI] [PubMed] [Google Scholar]
- 4. Deasy BM Schugar RC, Chirieleison SM, Wescoe KE et al. High harvest yield, high expansion, and phenotype stability of CD146 mesenchymal stromal cells from whole primitive human umbilical cord tissue. J Biomed Biotechnol 2009;2009:1–11. 10.1155/2009/789526. [DOI] [PMC free article] [PubMed] [Google Scholar]
- 5. Ennis J, Sarugaser R, Gomez A et al. Isolation, characterization, and differentiation of human umbilical cord perivascular cells (HUCPVCs). Methods Cell Biol 2008;86:121–136. [DOI] [PubMed] [Google Scholar]
- 6. Braid LR, Hu W‐G, Davies JE et al. Engineered mesenchymal cells improve passive immune protection against lethal Venezuelan equine encephalitis virus exposure. Stem Cells Translational Medicine 2016;5:1026–1035. [DOI] [PMC free article] [PubMed] [Google Scholar]
- 7. Vallejo CE. Characterization of genetically modified HUCPVCs as an osteogenic cell source [doctoral thesis]. Toronto, ON: University of Toronto, 2013. [Google Scholar]
- 8. Digirolamo CM, Stokes D, Colter D et al. Propagation and senescence of human marrow stromal cells in culture: A simple colony‐forming assay identifies samples with the greatest potential to propagate and differentiate. Br J Haematol 1999;107:275–281. [DOI] [PubMed] [Google Scholar]
- 9. Bara JJ, Richards RG, Alini M et al. Concise review: Bone marrow‐derived mesenchymal stem cells change phenotype following in vitro culture: Implications for basic research and the clinic. Stem Cells 2014;32:1713–1723. [DOI] [PubMed] [Google Scholar]
- 10. Russell KC, Phinney DG, Lacey MR et al. In vitro high‐capacity assay to quantify the clonal heterogeneity in trilineage potential of mesenchymal stem cells reveals a complex hierarchy of lineage commitment. Stem Cells 2010;28:788–798. [DOI] [PubMed] [Google Scholar]
- 11. Colter DC, Sekiya I, Prockop DJ. Identification of a subpopulation of rapidly self‐renewing and multipotential adult stem cells in colonies of human marrow stromal cells. Proc Natl Acad Sci USA 2001;98:7841–7845. [DOI] [PMC free article] [PubMed] [Google Scholar]
- 12. Schellenberg A, Stiehl T, Horn P et al. Population dynamics of mesenchymal stromal cells during culture expansion. Cytotherapy 2012;14:401–411. [DOI] [PubMed] [Google Scholar]
- 13. Sarugaser R, Hanoun L, Keating A et al. Human mesenchymal stem cells self‐renew and differentiate according to a deterministic hierarchy. PLoS One 2009;4:e6498 10.1371/journal.pone.0006498. [DOI] [PMC free article] [PubMed] [Google Scholar]
- 14. Churchman SM, Boxall SA, McGonagle D et al. Predicting the remaining lifespan and cultivation‐related loss of osteogenic capacity of bone marrow multipotential stromal cells applicable across a broad donor age range. Stem Cells Int 2017;2017:1–10. 10.1155/2017/6129596. [DOI] [PMC free article] [PubMed] [Google Scholar]
- 15. Wagner W, Horn P, Castoldi M et al. Replicative senescence of mesenchymal stem cells: A continuous and organized process. PLoS One 2008;3:e2213 10.1371/journal.pone.0002213. [DOI] [PMC free article] [PubMed] [Google Scholar]
- 16. Cheng H, Qiu L, Ma J et al. Replicative senescence of human bone marrow and umbilical cord derived mesenchymal stem cells and their differentiation to adipocytes and osteoblasts. Mol Biol Rep 2011;38:5161–5168. [DOI] [PubMed] [Google Scholar]
- 17. Snippert HJ, Clevers H. Tracking adult stem cells. EMBO Rep 2011;12:113–122. [DOI] [PMC free article] [PubMed] [Google Scholar]
- 18. von Bahr L, Sundberg B, Lönnies L et al. Long‐term complications, immunologic effects, and role of passage for outcome in mesenchymal stromal cell therapy. Biol Blood Marrow Transplant 2012;18:557–564. [DOI] [PubMed] [Google Scholar]
- 19. Moll G, Le Blanc K. Engineering more efficient multipotent mesenchymal stromal (stem) cells for systemic delivery as cellular therapy. ISBT Sci Ser 2015;10:357–365. [Google Scholar]
- 20. Lalu MM, McIntyre L, Pugliese C et al. Safety of cell therapy with mesenchymal stromal cells (SafeCell): A systematic review and meta‐analysis of clinical trials. PLoS One 2012;7:e47559 10.1371/journal.pone.0047559. [DOI] [PMC free article] [PubMed] [Google Scholar]
- 21. Galipeau J. The mesenchymal stromal cells dilemma‐does a negative phase III trial of random donor mesenchymal stromal cells in steroid‐resistant graft‐versus‐host disease represent a death knell or a bump in the road? Cytotherapy 2013;15:2–8. [DOI] [PubMed] [Google Scholar]
- 22. Galipeau J, Sensébé L. Mesenchymal stromal cells: Clinical challenges and therapeutic opportunities. Cell Stem Cell 2018;22:824–833. [DOI] [PMC free article] [PubMed] [Google Scholar]
- 23. Martin C, Olmos É, Collignon ML et al. Revisiting MSC expansion from critical quality attributes to critical culture process parameters. Process Biochem 2017;59:231–243. [Google Scholar]
- 24. Cimino M, Gonçalves RM, Barrias CC et al. Xeno‐free strategies for safe human mesenchymal stem/stromal cell expansion: Supplements and coatings. Stem Cells Int 2017;2017:1–13. 10.1155/2017/6597815. [DOI] [PMC free article] [PubMed] [Google Scholar]
- 25. Karnieli O, Friedner OM, Allickson JG et al. A consensus introduction to serum replacements and serum‐free media for cellular therapies. Cytotherapy 2017;19:155–169. [DOI] [PubMed] [Google Scholar]
- 26. Hemeda H, Giebel B, Wagner W. Evaluation of human platelet lysate versus fetal bovine serum for culture of mesenchymal stromal cells. Cytotherapy 2014;16:170–180. [DOI] [PubMed] [Google Scholar]
- 27. Amable PR, Teixeira MVT, Carias RBV et al. Mesenchymal stromal cell proliferation, gene expression and protein production in human platelet‐rich plasma‐supplemented media. PLoS One 2014;9:e104662 10.1371/journal.pone.0104662. [DOI] [PMC free article] [PubMed] [Google Scholar]
- 28. Wang Y, Wu H, Yang Z et al. Human mesenchymal stem cells possess different biological characteristics but do not change their therapeutic potential when cultured in serum free medium. Stem Cell Res Ther 2014;5:132–145. [DOI] [PMC free article] [PubMed] [Google Scholar]
- 29. Duggal S, Brinchmann JE. Importance of serum source for the in vitro replicative senescence of human bone marrow derived mesenchymal stem cells. J Cell Physiol 2011;226:2908–2915. [DOI] [PubMed] [Google Scholar]
- 30. Schallmoser K, Bartmann C, Rohde E et al. Replicative senescence‐associated gene expression changes in mesenchymal stromal cells are similar under different culture conditions. Haematologica 2010;95:867–874. [DOI] [PMC free article] [PubMed] [Google Scholar]
- 31. Ulivi V, Tasso R, Cancedda R et al. Mesenchymal stem cell paracrine activity is modulated by platelet lysate: Induction of an inflammatory response and secretion of factors maintaining macrophages in a proinflammatory phenotype. Stem Cells Dev 2014;00:1–12. [DOI] [PubMed] [Google Scholar]
- 32. Gottipamula S, Muttigi MS, Chaansa S et al. Large‐scale expansion of pre‐isolated bone marrow mesenchymal stromal cells in serum‐free conditions. J Tissue Eng Regen Med 2016;10:108–119. [DOI] [PubMed] [Google Scholar]
- 33. Boquest A, Shahdadfar A, Frønsdal K et al. Isolation and transcription profiling of purified uncultured human stromal stem cells: Alteration of gene expression after in vitro cell culture. Mol Biol Cell 2005;16:1131–1141. [DOI] [PMC free article] [PubMed] [Google Scholar]
- 34. Izadpanah R, Kaushal D, Kriedt C et al. Long‐term in vitro expansion alters the biology of adult mesenchymal stem cells. Cancer Res 2008;68:4229–4238. [DOI] [PMC free article] [PubMed] [Google Scholar]
- 35. Larson BL, Ylostalo J, Lee RH et al. Sox11 is expressed in early progenitor human multipotent stromal cells and decreases with extensive expansion of the cells. Tissue Eng Part A 2010;16:3385–3394. [DOI] [PMC free article] [PubMed] [Google Scholar]
- 36. Fong CY, Chak LL, Biswas A et al. Human Wharton's jelly stem cells have unique transcriptome profiles compared to human embryonic stem cells and other mesenchymal stem cells. Stem Cell Rev Rep 2011;7:1–16. [DOI] [PubMed] [Google Scholar]
- 37. Gatta V, D'Aurora M, Lanuti P et al. Gene expression modifications in Wharton's Jelly mesenchymal stem cells promoted by prolonged in vitro culturing. BMC Genomics 2013;14:635–649. [DOI] [PMC free article] [PubMed] [Google Scholar]
- 38. Bellayr IH, Catalano JG, Lababidi S et al. Gene markers of cellular aging in human multipotent stromal cells in culture. Stem Cell Res Ther 2014;5:59–80. [DOI] [PMC free article] [PubMed] [Google Scholar]
- 39. Baksh D, Yao R, Tuan RS. Comparison of proliferative and multilineage differentiation potential of human mesenchymal stem cells derived from umbilical cord and bone marrow. Stem Cells 2007;25:1384–1392. [DOI] [PubMed] [Google Scholar]
- 40. Curley GF, Jerkic M, Dixon S et al. Cryopreserved, xeno‐free human umbilical cord mesenchymal stromal cells reduce lung injury severity and bacterial burden in rodent escherichia coli–induced acute respiratory distress syndrome. Crit Care Med 2017;45:e202–e212. [DOI] [PubMed] [Google Scholar]
- 41. Holley RJ, Tai G, Williamson AJK et al. Comparative quantification of the surfaceome of human multipotent mesenchymal progenitor cells. Stem Cell Rep 2015;4:473–488. [DOI] [PMC free article] [PubMed] [Google Scholar]
- 42. Dominici M, Le Blanc K, Mueller I et al. Minimal criteria for defining multipotent mesenchymal stromal cells. The International Society for Cellular Therapy position statement. Cytotherapy 2006;8:315–317. [DOI] [PubMed] [Google Scholar]
- 43. Braid LR, Wood CA, Wiese DM et al. Intramuscular administration potentiates extended dwell time of mesenchymal stromal cells compared to other routes. Cytotherapy 2018;20:232–244. [DOI] [PubMed] [Google Scholar]
- 44. R Core Team. R . A Language and Environment for Statistical Computing. R Version 3.4.2.. Vienna, Austria: R Foundation for Statistical Computing, 2017. Available at https://www.r-project.org Accessed January 4, 2019. [Google Scholar]
- 45. Huber W, Carey VJ, Gentleman R et al. Orchestrating high‐throughput genomic analysis with bioconductor. Nat Methods 2015;12:115–121. [DOI] [PMC free article] [PubMed] [Google Scholar]
- 46. Wu J, Irizarry R. Available at https://www.bioconductor.org. GCRMA: Background Adjustment Using Sequence Information. R Package Version 2.50.0. Vienna, Austria: R Foundation for Statistical Computing, 2017. Accessed January 4, 2019. [Google Scholar]
- 47. Miller CJ. simpleaffy: Very Simple High Level Analysis of Affymetrix Data. Vienna, Austria: R Foundation for Statistical Computing, 2017. Available at https://www.bioconductor.org Accessed January 4, 2019. [Google Scholar]
- 48. Wilson CL, Miller CJ. simpleaffy: A BioConductor package for affymetrix quality control and data analysis. Bioinformatics 2005;21:3683–3685. [DOI] [PubMed] [Google Scholar]
- 49. Affymetrix Inc . GeneChip® Expression Analysis Data Analysis Fundamentals. Available at http://tools.thermofisher.com/content/sfs/manuals/data_analysis_fundamentals_manual.pdf. Accessed January 4, 2019.
- 50. Manimaran S, Selby HM, Okrah K et al. BatchQC: Interactive software for evaluating sample and batch effects in genomic data. Bioinformatics 2016;32:3836–3838. [DOI] [PMC free article] [PubMed] [Google Scholar]
- 51. Johnson WE, Li C, Rabinovic A. Adjusting batch effects in microarray expression data using empirical Bayes methods. Biostatistics 2007;8:118–127. [DOI] [PubMed] [Google Scholar]
- 52. Edgar R, Domrachev M, Lash A. Gene expression omnibus: NCBI gene expression and hybridization array data repository. Nucleic Acids Res 2002;30:207–210. [DOI] [PMC free article] [PubMed] [Google Scholar]
- 53. Ritchie ME, Phipson B, Wu D et al. Limma powers differential expression analyses for RNA‐sequencing and microarray studies. Nucleic Acids Res 2015;43:e47–e59. [DOI] [PMC free article] [PubMed] [Google Scholar]
- 54. Smyth GK. Linear models and empirical bayes methods for assessing differential expression in microarray experiments. Stat Appl Genet Mol Biol 2004;3:1–25. [DOI] [PubMed] [Google Scholar]
- 55. Benjamini Y, Hochberg Y. Controlling the false discovery rate: A practical and powerful approach to multiple testing. J R Stat Soc Ser B 1995;57:289–300. [Google Scholar]
- 56. Pagès H, Carlson M, Falcon S et al. AnnotationDbi: Annotation Database Interface. R package version 1.40.0. Vienna, Austria: R Foundation for Statistical Computing, 2017. Available at https://www.bioconductor.org Accessed January 4, 2019. [Google Scholar]
- 57. Carlson M. hgu133a2.db: Affymetrix Human Genome U133A 2.0 Array annotation data (chip hgu133a2). R package version 3.2.3. Vienna, Austria: Available at https://www.bioconductor.org: R Foundation for Statistical Computing, 2016. Accessed January 4, 2019. [Google Scholar]
- 58. Huang DW, Sherman BT, Lempicki RA. Bioinformatics enrichment tools: Paths toward the comprehensive functional analysis of large gene lists. Nucleic Acids Res 2009;37:1–13. [DOI] [PMC free article] [PubMed] [Google Scholar]
- 59. Huang DW, Sherman BT, Lempicki RA. Systematic and integrative analysis of large gene lists using DAVID bioinformatics resources. Nat Protoc 2009;4:44–57. [DOI] [PubMed] [Google Scholar]
- 60. Wu D, Lim E, Vaillant F et al. ROAST: Rotation gene set tests for complex microarray experiments. Bioinformatics 2010;26:2176–2182. [DOI] [PMC free article] [PubMed] [Google Scholar]
- 61. Wu D, Smyth GK. Camera: A competitive gene set test accounting for inter‐gene correlation. Nucleic Acids Res 2012;40:e133–e144. [DOI] [PMC free article] [PubMed] [Google Scholar]
- 62. Subramanian A, Tamayo P, Mootha VK et al. Gene set enrichment analysis: A knowledge‐based approach for interpreting genome‐wide expression profiles. Proc Natl Acad Sci USA 2005;102:15545–15550. [DOI] [PMC free article] [PubMed] [Google Scholar]
- 63. Liberzon A, Subramanian A, Pinchback R et al. Molecular signatures database (MSigDB) 3.0. Bioinformatics 2011;27:1739–1740. [DOI] [PMC free article] [PubMed] [Google Scholar]
- 64. Christodoulou I, Kolisis FN, Papaevangeliou D et al. Comparative evaluation of human mesenchymal stem cells of fetal (Wharton's jelly) and adult (adipose tissue) origin during prolonged in vitro expansion: Considerations for cytotherapy. Stem Cells Int 2013;2013:1–12. 10.1155/2013/246134. [DOI] [PMC free article] [PubMed] [Google Scholar]
- 65. Amable PR, Teixeira MVT, Carias RBV et al. Protein synthesis and secretion in human mesenchymal cells derived from bone marrow, adipose tissue and Wharton's jelly. Stem Cell Res Ther 2014;5:53–65. [DOI] [PMC free article] [PubMed] [Google Scholar]
- 66. Batsali AK, Pontikoglou C, Koutroulakis D et al. Differential expression of cell cycle and WNT pathway‐related genes accounts for differences in the growth and differentiation potential of Wharton's jelly and bone marrow‐derived mesenchymal stem cells. Stem Cell Res Ther 2017;8:102–118. [DOI] [PMC free article] [PubMed] [Google Scholar]
- 67. Pigeau GM, Csaszar E, Dulgar‐Tulloch A. Commercial scale manufacturing of allogeneic cell therapy. Front Med 2018;5:1–8. [DOI] [PMC free article] [PubMed] [Google Scholar]
- 68. Nygaard V, Rødland EA, Hovig E. Methods that remove batch effects while retaining group differences may lead to exaggerated confidence in downstream analyses. Biostatistics 2016;17:29–39. [DOI] [PMC free article] [PubMed] [Google Scholar]
- 69. Rogue A, Lambert C, Spire C et al. Interindividual variability in gene expression profiles in human hepatocytes and comparison with HepaRG cells. Drug Metab Dispos 2012;40:151–158. [DOI] [PubMed] [Google Scholar]
- 70. Sen A, Madhivanan K, Mukherjee D et al. The epsin protein family: Coordinators of endocytosis and signaling. Biomol Concepts 2012;3:117–126. [DOI] [PMC free article] [PubMed] [Google Scholar]
- 71. Mannherz HG, Hannappel E. The β‐thymosins: Intracellular and extracellular activities of a versatile actin binding protein family. Cell Motil Cytoskeleton 2009;66:839–851. [DOI] [PubMed] [Google Scholar]
- 72. Sosne G, Chan CC, Thai K et al. Thymosin beta 4 promotes corneal wound healing and modulates inflammatory mediators in vivo. Exp Eye Res 2001;72:605–608. [DOI] [PubMed] [Google Scholar]
- 73. Lien WH, Fuchs E. Wnt some lose some: Transcriptional governance of stem cells by Wnt/β‐catenin signaling. Genes Dev 2014;28:1517–1532. [DOI] [PMC free article] [PubMed] [Google Scholar]
- 74. Burrow KL, Hoyland JA, Richardson SM. Human adipose‐derived stem cells exhibit enhanced proliferative capacity and retain multipotency longer than donor‐matched bone marrow mesenchymal stem cells during expansion in vitro. Stem Cells Int 2017;2017:1–15. 10.1155/2017/2541275. [DOI] [PMC free article] [PubMed] [Google Scholar]
- 75. Hamidian Jahromi S, Li Y, Davies JE. Effect of tumor necrosis factor alpha dose and exposure time on tumor necrosis factor induced gene‐6 activation by neonatal and adult mesenchymal stromal cells. Stem Cells Dev 2018;27:44–54. [DOI] [PubMed] [Google Scholar]
- 76. Mordant P, Nakajima D, Kalaf R et al. Mesenchymal stem cell treatment is associated with decreased perfusate concentration of interleukin‐8 during ex vivo perfusion of donor lungs after 18‐hour preservation. J Hear Lung Transplant 2016;35:1245–1254. [DOI] [PubMed] [Google Scholar]
- 77. Hamidian Jahromi S, Estrada C, Li Y et al. Human umbilical cord perivascular cells and human bone marrow mesenchymal stromal cells transplanted intramuscularly respond to a distant source of inflammation. Stem Cells Dev 2018;27:415–429. [DOI] [PubMed] [Google Scholar]
- 78. Swamynathan P, Venugopal P, Kannan S et al. Are serum‐free and xeno‐free culture conditions ideal for large scale clinical grade expansion of Wharton's jelly derived mesenchymal stem cells? A comparative study. Stem Cell Res Ther 2014;5:88–104. [DOI] [PMC free article] [PubMed] [Google Scholar]
- 79. Bosch J, Houben AP, Radke TF et al. Distinct differentiation potential of “MSC” derived from cord blood and umbilical cord: Are cord‐derived cells true mesenchymal stromal cells? Stem Cells Dev 2012;21:1977–1988. [DOI] [PubMed] [Google Scholar]
- 80. Pires AO, Mendes‐Pinheiro B, Teixeira FG et al. Unveiling the differences of secretome of human bone marrow mesenchymal stem cells, adipose tissue‐derived stem cells, and human umbilical cord perivascular cells: A proteomic analysis. Stem Cells Dev 2016;25:1073–1083. [DOI] [PubMed] [Google Scholar]
- 81. Taran R, Mamidi MK, Singh G et al. In vitro and in vivo neurogenic potential of mesenchymal stem cells isolated from different sources. J Biosci 2014;39:157–169. [DOI] [PubMed] [Google Scholar]
- 82. Moya A, Paquet J, Deschepper M et al. Human mesenchymal stem cell failure to adapt to glucose shortage and rapidly use intracellular energy reserves through glycolysis explains poor cell survival after implantation. Stem Cells 2018;36:363–376. [DOI] [PubMed] [Google Scholar]
- 83. Ren J, Stroncek DF, Zhao Y et al. Intra‐subject variability in human bone marrow stromal cell (BMSC) replicative senescence: Molecular changes associated with BMSC senescence. Stem Cell Res 2013;11:1060–1073. [DOI] [PMC free article] [PubMed] [Google Scholar]
- 84. Blázquez‐Prunera A, Díez JM, Gajardo R et al. Human mesenchymal stem cells maintain their phenotype, multipotentiality, and genetic stability when cultured using a defined xeno‐free human plasma fraction. Stem Cell Res Ther 2017;8:103–113. [DOI] [PMC free article] [PubMed] [Google Scholar]
- 85. Julavijitphong S, Wichitwiengrat S, Tirawanchai N et al. A xeno‐free culture method that enhances Wharton's jelly mesenchymal stromal cell culture efficiency over traditional animal serum‐supplemented cultures. Cytotherapy 2014;16:683–691. [DOI] [PubMed] [Google Scholar]
- 86. Van Pham P, Truong NC, Le PT et al. Isolation and proliferation of umbilical cord tissue derived mesenchymal stem cells for clinical applications. Cell Tissue Bank 2016;17:289–302. [DOI] [PubMed] [Google Scholar]
- 87. Antoninus AA, Widowati W, Wijaya L et al. Human platelet lysate enhances the proliferation of Wharton's jelly‐derived mesenchymal stem cells. Biomarkers Genomic Med 2015;7:87–97. [Google Scholar]
- 88. Chen G, Yue A, Ruan Z et al. Human umbilical cord‐derived mesenchymal stem cells do not undergo malignant transformation during long‐term culturing in serum‐free medium. PLoS One 2014;9:e98565 10.1371/journal.pone.0098565. [DOI] [PMC free article] [PubMed] [Google Scholar]
Associated Data
This section collects any data citations, data availability statements, or supplementary materials included in this article.
Supplementary Materials
Supporting Information File 1, Figure S1 (.pdf): Characterization of post‐thaw HUCPVCs (A): The internationally accepted MSC cell surface marker profile was confirmed on P3 HUCPVCs after thaw. Cell surface markers were labeled using the BD Stemflow human MSC (hMSC) Analysis Kit (BD Biosciences) and detected using a FACSAria II flow cytometer (BD Biosciences). Detection of CD105‐ PerCP‐Cy5.5, CD73‐APC, CD90‐FITC, and no detection of CD45/CD34/CD11b/CD19/HLA‐DR‐PE confirms that HUCPVCs recovered from cryopreservation still meet the ISCT's minimal criteria for MSCs. CD44‐PE is an additional marker not included in the minimal criteria. The surface marker profile of HUCPVCs is more comprehensively defined in the Materials and Methods. (B): Multi‐differentiation potential was assessed by directed differentiation into adipogenic, chondrogenic and osteogenic lineages (Lonza; PT‐3004, PT‐3003 and PT‐3002, respectively), and visualized using AdipoRed (Lonza; PT‐7009), OsteoImage (Lonza; PA‐1503) and Alexa488‐conjugated antibodies targeting Collagen II (Abcam; 34,712), respectively. Fluorescence from adipogenic and osteogenic cultures was captured at 260X magnification using an EVOS digital microscope (ThermoFisher Scientific). Collagen II‐stained chondrogenic micromass pellets were imaged at 400X magnification using a Quorum WaveFX laser scanning confocal microscope (Quorum Technologies Inc.). Post‐thaw HUCPVCs retain tri‐lineage potential consistent with their characterization as MSCs. Abbreviations: HUCPVCs, human umbilical cord perivascular cells, MSC, mesenchymal stromal cell; P, passage; ISCT, International Society for Cell and Gene Therapy.
Supporting Information File 3, Figure S2 (.pdf): Expression intensity of genes with > 1.five‐fold change between any of P3, P4 and/or P5 versus P2. Genes displayed in heat maps are a subset of the top 100 DE probes (ranked by lowest unadjusted p‐values) at each passage versus P2. (A): DE genes with lower expression intensity after P2. (B): DE genes with higher expression intensity after P2. Abbreviations: DE, differentially expressed; F, female; M, male; P, passage.
Supporting Information File 2 (.xlsx): Supplementary Tables. Complete lists of DE genes or GOIs identified in all reported interrogations, and select functional enrichment test outputs, summarized in 13 Tables (1 table per worksheet following Table of Contents). Tables include probe set IDs, gene symbols, full gene names, log2 expression intensity and fold change values, significance test statistics, GO terms and GO IDs as per the specified interrogation. Abbreviations: DE, differentially expressed; GOIs, genes of interest; GO, Gene Ontology; ID, identification number. Any footnotes or additional abbreviations are included at the bottom of each table.
Data Availability Statement
The data have been deposited in NCBI's Gene Expression Omnibus (GEO) database 52, available through accession number GSE119987.