

Abstract
Accurate prediction of tumor metastatic potential would be helpful in treatment planning and in the design of agents that modify the tumor phenotype. We report that three methods that are potentially transferable to the clinic – dynamic contrast enhanced MRI (DCE MRI), T1ρ-weighted imaging and low temperature fluorescence imaging (that could be performed on biopsy specimens) – distinguished between relatively indolent (A375P) and aggressive (C8161) metastatic human melanoma xenografts in nude mice, whereas T1 and T2 relaxation time measurements did not. DCE MRI data analyzed by the BOLus Enhanced Relaxation Overview (BOLERO) method in conjunction with concurrent measurements of the arterial input function yielded a blood transfer rate constant (Ktrans) which measures perfusion/permeability, that was significantly higher in the core of the indolent tumor than in the core of the aggressive tumor. Histological staining indicated that aggressive tumors had more blood vascular structure but fewer functional vascular structure than indolent tumors. Indolent tumors exhibited T1ρ values that were significantly higher than those of aggressive tumors at spin-locking frequencies >500Hz. The mitochondrial redox ratio, Fp/(Fp+NADH), where Fp and NADH are the fluorescence of oxidized flavoproteins and reduced pyridine nucleotides, respectively, of aggressive tumors was much higher (more oxidized) than that of indolent tumors and often showed a bimodal distribution with an oxidized core and a reduced rim. These differences observed between these two types of tumors, one indolent and one aggressive, if generalizable, would be very valuable in predicting human melanoma metastatic potential.
Keywords: human melanoma, tumor xenograft, metastatic potential, Fp, NADH, redox ratio, DCE MRI, T1ρ
1. INTRODUCTION
Accurate prediction of tumor metastatic potential by imaging methods during or soon after diagnosis of cancer would provide valuable information for guiding the type and aggressiveness of therapeutic procedures. Such methods could also provide valuable insight about the characteristics of the disease that could be utilized in the design of novel therapeutic strategies. In addition, imaging can non-invasively provide information about tumor metabolic and physiological heterogeneity.
The Hendrix laboratory has assembled a collection of human melanoma cell lines for which clinical data were available on the aggressiveness of the disease in patients. In three-dimensional cell culture, the aggressive melanoma cells express endothelial cell- associated genes and form vasculogenic-like networks that are laminin-positive, which correspond to the laminin-rich patterned networks observed in patient tumors, correlating with a poor prognosis.1–3 This intriguing finding was called vasculogenic mimicry, and since its original description in aggressive melanomas, it has been independently confirmed in a variety of other tumor types.2 In addition, recent studies have shown that melanoma vasculogenic mimicry corresponds to an extravascular perfusion pathway within aggressive tumors which communicates with the host vasculature and permits the perfusion of fluid via the anti-coagulation interaction(s) of Tissue Factor-positive melanoma cells with Tissue Factor Pathway Inhibitor(s).4,5 We have evaluated the formation of melanoma tumors by dynamic contrast enhanced (DCE) MRI imaging and examination of pathology specimens. However, our principal objective was to evaluate imaging methods that could be applied in the clinic to distinguish between aggressive and indolent forms of this disease in the human patient. For this purpose we have established xenografts in athymic nude mice of the most aggressive human melanoma cell line (C8161) and the most indolent cell line (A375P). It has been previously demonstrated that the aggressive subline metastasizes within three weeks after subcutaneous inoculation while the indolent subline shows little sign of metastasis after implantation in SCID mice.6,7
As potential diagnostic imaging methods, we have chosen low temperature optical imaging or “redox scanning”,8 which can be clinically implemented with biopsy specimens and two clinically applicable noninvasive magnetic resonance imaging (MRI) techniques—dynamic contrast enhanced (DCE) MRI utilizing Gd-DTPA as the contrast agent and T1ρ−ΜRI. Low temperature optical imaging provides very high spatial resolution 3D images (~80–100 μm in-plane and ~10 μm slice thickness) of tumor heterogeneity and monitors the redox status of mitochondria by measuring relative levels of reduced pyridine nucleotides (NADH) and oxidized flavoproteins (Fp). Redox imaging also monitors hemoglobin saturation and, hence, the state of tumor vascular (chiefly venous) oxygenation. The MRI methods provide moderate spatial resolution (~250 to 500 μm in-plane; 1 mm slice thickness). Dynamic contrast enhancement is sensitive to tumor perfusion, vascular permeability and extracellular volume fraction, whereas T1ρ-weighted MRI is sensitive to macromolecular concentration and protein-water hydrogen exchange rates.
2. METHODS
2.1. Animal Models
Aggressive (C8161)7 and indolent (A375P)9 human melanoma cells were grown in RPMI medium supplemented with 10% fetal bovine serum. Melanoma cells (2×10⁶) were subcutaneously implanted on the back shoulders or in the thighs of 7–9 week old male athymic nude mice (NCr-nu/nu 01B74) obtained from National Cancer Institute, US. After 1–2 months, the mice were examined by MRI and then sacrificed for redox imaging. The tumor volumes ranged approximately 0.2–0.4 cm3, for C8161 and A375P xenografts, respectively, at the time of the experiments. For histological examination, excised tumors were fixed in formalin, embedded in paraffin, sectioned into 5 μm sections, fixed and stained with Factor VIII (DAKO, Carpinteria, CA) for detection of vascular endothelial cells and then counterstained with hematoxylin.
2.2. Rapid Tumor Freezing Procedure
Both types of the tumor bearing mice were anaesthetized by intraperitoneal injection of ketamine (100mg/kg) and acepromazine (10mg/kg), quickly frozen by immersion into liquid nitrogen (−196°C), and the subcutaneous tumors were not observed to exhibit cracks. Tumors were then surgically excised by saw, embedded in ethanol: glycerol: water mixture (1:3:6 by volume; freezing point, −30°C), and mounted for imaging.
2.3. Imaging of Tumors by Redox Scanning
The frozen tumor sample was milled flat and imaged every ~500 μm from the top surface to the bottom of the tumor. The light guide (fused silica, 50 μm core diameter) was stepped across the tissue surface at a distance of about 70 μm from the tissue surface. The excitation filter and the emission filter for detecting the fluorescent signals of each substance were designed on the basis of the absorption and emission spectra of each fluorophore and the emission spectrum of the mercury arc lamp. The fluorescent signals of Fp (filters: excitation 440DF20 (center wavelength 440 nm and band-pass width 20 nm); emission 520DF40), NADH (filters: excitation 365HT25, emission 455DF70), as well as the absorption of hemoglobin (Hb) at wavelength 546 nm (filter at emission: 546nm) and wavelength 578 nm (filter at emission: 578DF10) were imaged at each tumor depth. Scanning was performed in steps of 128 × 128 covering 1.0 × 1.0 cm2 or 1.3 × 1.3 cm2 of surface area with an in-plane resolution of 80 μm or 100 μm.
Using MATLAB™ data analysis programs developed in the Chance laboratory, the redox ratios Fp/(Fp+NADH) and NADH/(Fp+NADH) were calculated from the digitized signals of Fp and NADH, and the relative hemoglobin oxygenation map was calculated from the ratio of the signal intensity of Hb at 578 nm to its signal intensity at 546 nm.
2.4. DCE MRI of Melanoma Xenografts in vivo
Details of the procedure for performance of the DCE experiments and the methods for data analysis have been described in recent publications from the Zhou/Glickson laboratory.10 Briefly, studies were performed on melanoma xenografts implanted on the backs of nude mice in order to permit simultaneous imaging of the left-ventricle (ECG- gated at end-diastole) and the tumor in the same field of view. Studies were performed with a home-built birdcage coil on a Varian ANOVA spectrometer interfaced to a 4.7 T 30 cm bore magnet utilizing a 12 cm gradient insert capable of generating magnetic field gradients of 25 G/cm. Anesthesia with 1% isofluorane was administered through a nose cone (flow rate, 0.8 L/min) placed over the animal’s snout. Tumors (8–10 mm in diameter) were imaged with a T1-weighted pulse sequence at a rate of about 2 second/image, simultaneously with the acquisition of the arterial input function of Gd- DTPA, which was administered through a tail-vein catheter extending outside the magnet. An inversion-recovery pulse sequence was used to quantify T1 of arterial blood and the tumor tissue.
Data analysis was accomplished with the BOLERO algorithm11 that takes into account the rate of water exchange across the plasma membrane of the tumor cell relative to the difference in water relaxation rates in the intra- and extracellular compartments. Data modeling was performed using the average signal intensities of DCE images in two regions of interests, the tumor core and rim as described previously in Ref 10. Two- limiting conditions were evaluated: 1) the transcytolemmal water exchange rate was infinitely rapid compared to the difference in water relaxation rates between intra- and extracellular compartments (called the fast-exchange limit or FXL), and 2) the intra- extracellular water relaxation rate difference was comparable to the transcytolemmal water exchange rate when the large bolus of Gd-DTPA first reached the tumor (called the fast exchange regime or FXR), but was otherwise assumed to be infinitesimally small relative to the transcytolemmal water exchange rate. The first method that is commonly used by most workers in the field is called the “FXL-constrained method” and yields two parameters – the blood transfer rate constant Ktrans and the volume fraction of the extravascular extracellular space in tissue νe; the second method (called the “FXR- permitted method”) that was recently introduced by Springer’s laboratory11 utilizes the FXR equations to analyze data that satisfy this limit and otherwise utilizes the FXL equations. Data analysis with the FXR equations yields three fitting parameters – Ktrans, νe, and the intracellular life time τi (1/τi is the transcytolemmal water exchange rate). The difference between these assumptions is subtle, but the choice of modeling methods can have a profound effect on the values of parameters that are calculated.
2.5. MR T2 and T1ρ-weighted Imaging of Melanoma Xenografts
The water T1ρ relaxation time characterizes the relaxation process of hydrogen nuclear spins in a coordinate system that is rotating at the proton Larmor frequency. The T1ρ-weighted imaging pulse sequences utilize magnetization prepared by a fast spin-echo sequence as described by Reddy et al.12,13 Briefly, a non-selective 90° hard pulse rotates proton spin magnetization into the transverse plane. An on-resonance spin-locking radiofrequency pulse (SLP) then locks the spins in the transverse plane perpendicular to the static magnetic field B0. The SLP pulse has a duration of TSL (time of spin locking), during which time the spin magnetization relaxes with a time constant T1ρ. Six values of TSL have been used in the range of 16–125 ms. Then another 90° hard pulse rotates the magnetization back to the z-direction, and data acquisition ensues with a conventional fast spin-echo pulse sequence (TR 1 sec, echo spacing 6 msec, matrix 128×128, FOV 3~4 cm, slice thickness 2 mm, NEX = 2). Values of T1ρ depend on the strength of the magnetic field B1, which defines a spin-locking frequency, SLF = γB1 (where γ is the gyromagnetic ratio of nuclear spins). We performed T1ρ dispersion measurement by changing B1 from 300–4000 Hz. Imaging at each spin-locking frequency required about 2 minutes.
The signal (S) detected by MR T1ρ-weighted imaging is an exponential defined by S ∝ exp[-TSL/T1ρ]. By fitting the logarithm of S as a function of TSL utilizing customized software written in Interactive Data Language, we determined T1ρ for every image pixel at a specific frequency of the spin-locking pulse. We also obtained the mean value of T1ρ by fitting the average signal values in a region of interest drawn across a slice section of the tumor.
The T2-weighted images were acquired with a conventional spin-echo sequence with TR 500 ms and 6 TEs varying from 12 to 62 ms. Values of T2 were determined by fitting the T2- weighted imaging signal intensity to the exponential function, exp[-TE/T2].
3. RESULTS AND DISCUSSION
3.1. Optical Imaging
The ratio of Fp and NADH signals can approximate the oxidation-reduction ratio of the mitochondrial steady-state metabolism because: 1) the two signals represent the major fluorochromes in the mitochondrial matrix, and 2) the two chemicals are near oxidation- reduction equilibrium.14 Therefore, the Fp redox ratio, Fp/(Fp+NADH), is a sensitive metabolic index of mitochondrial respiration of the cell.
A number of distinct respiratory states can be distinguished on the basis of the redox ratio.15,16 State 1 corresponds to adequate oxygen and low levels of ADP and endogeneous substrates. This condition is indicative of low levels of oxidative metabolism accompanied by high NADH and low Fp, i.e., low Fp redox ratio. State 2, in which mitochondria are starved of substrate but have adequate oxygen and ADP, is characterized by very high levels of Fp and low levels of NADH, i.e., high Fp redox ratio. State 3, which corresponds to high levels of oxygen, ADP, and substrate and, hence, high levels of oxidative metabolism is also accompanied by a high Fp redox ratio, but not as high as State 2, and low NADH, but not as low as State 2. State 4 exhibits low mitochondrial activity with low ADP levels but with adequate supplies of substrate. This state exhibits high NADH redox ratio (NADH/(Fp+NADH)) but low Fp redox ratio.
Shown below are typical images of redox ratios of two sequential tissue slices of an aggressive C8161 xenograft versus an indolent A375P xenograft (Figure 1). The tissue optical penetration depth = 10 μm, slice depth 600 and 1200 μm beneath the skin. Distinct tumor heterogeneity in the spatial distribution of redox ratio Fp/(Fp+NADH) was observed in the 1200 μm depth image of the aggressive tumor. In the 600 μm tissue slice, on average, the aggressive C8161 xenograft was at least 2 times more oxidized (mean=0.66, STD=0.16) than the indolent A375P xenograft (mean=0.30, STD=0.12) at the same slice depth. We attribute this to State 2 metabolism in the aggressive tumor. State 3 might also yield similar redox ratios, but the low level of perfusion/permeability of this region of the tumor (see section 3.2) argues in favor of State 2. However, both tumors exhibited similar and relatively uniform levels of vascular oxygenation as indicated by their respective Hb ratio images (Figure 2).
Figure 1.
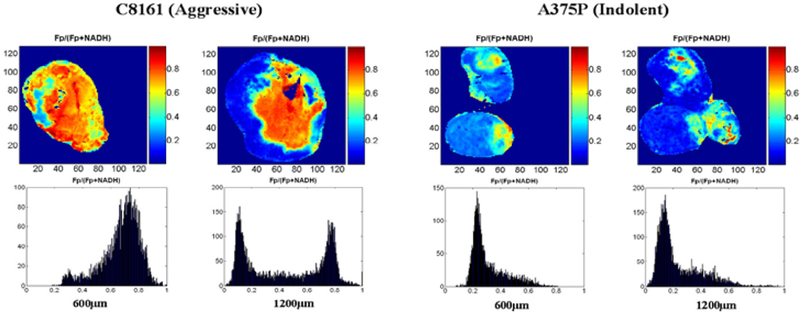
Typical images and histograms of redox ratios of two sequential tissue slices of C8161 versus A375P xenografts at depths of 600 μm (left) and 1200 μm (right).
Figure 2.
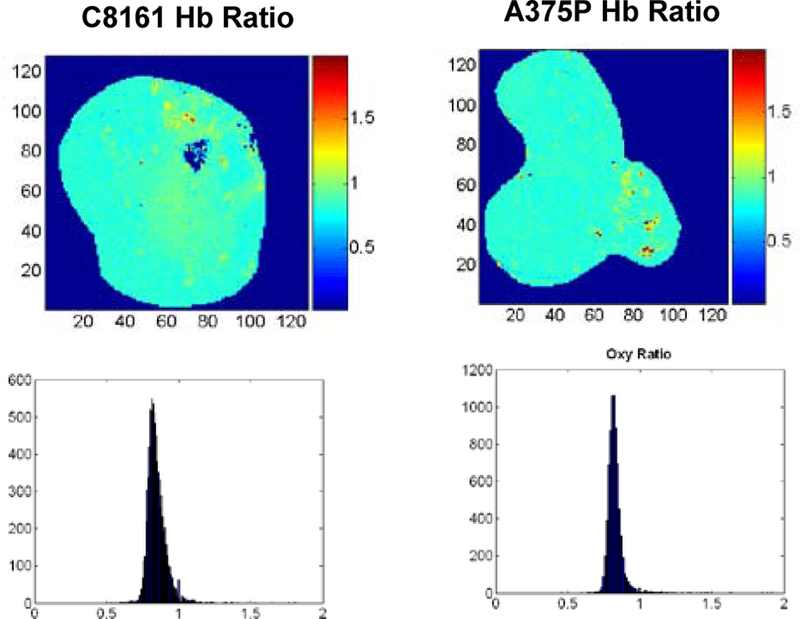
Images and histograms of Hb ratio of the aggressive (left) and indolent (right) melanoma xenografts at a slice depth of 1200 μm from the top surface of the tumors
An interesting bi-modal spatial distribution of redox ratios was observed in the deeper slices of the aggressive tumor, which was significantly more oxidized in the central core of the tumor (mean 0.70, STD 0.14) than in the outer rim (mean 0.15, STD 0.10) of the tumor (see the Fp redox ratio histogram of C8161 in Figure 1). We attribute this to State 2 respiration in the core and State 4 in rim (see section 3.2) of the aggressive tumor. This again reflects a relatively poorly perfused and metabolically less active core in the aggressive tumor, which is likely to generate VEGF that could contribute to a higher metastatic potential.
In comparison, the redox ratios of the mouse’s leg muscle demonstrated a different distribution pattern than melanomas, less heterogeneity as can be seen from the histogram (Figure 3). Its average Fp redox ratio (mean 0.34) was less than that of an A375P tumor (mean 0.45) and a C8161 tumor (mean 0.8) scanned in the same day with the same mercury light source. Since this was inactive muscle, we attribute this to State 4 metabolism. The Hb ratio image of the muscle (not shown) was uniform and similar to that of the two tumors.
Figure 3.
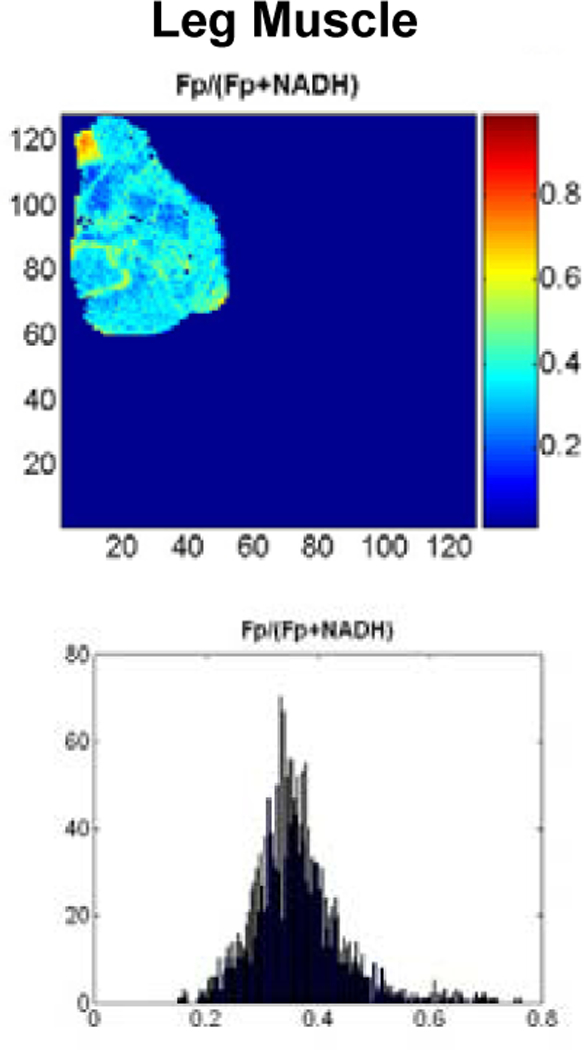
Redox ratios of normal resting mouse muscle at depth of 1600 μm.
3.2. DCE MRI
Dynamic contrast enhanced MRI studies were conducted on three aggressive (C8161) and four indolent (A375P) xenografts. Table 1 presents the results of an analysis of these data on the basis of the BOLERO algorithm. Data were analyzed by the FXL-constrained and the FXR-permitted methods described in Methods. The only statistically significant difference in the parameters that were obtained from this analysis was for Ktrans of the tumor cores obtained by the FXR-permitted method.
Table 1.
Summary of analysis of DCE MRI experiments on indolent (A375P) and aggressive (C8161) human melanoma xenografts. Data were analyzed by the BOLERO algorithm that utilized a fast exchange limit model (i.e., FXL-constrained model) or a fast exchange regime model (i.e., the FXR-permitted model) as described in Methods. Errors represent inter-tumor standard deviations.
| Tumor Center |
Tumor Rim |
|||
|---|---|---|---|---|
| Parameter | C8161 (n=3) | A375P (n=4) | C8161 (n=3) | A375P (n=4) |
| Ktrans(min−1) | 0.06±0.03 | 0.15±0.06* | 0.15±0.07 | 0.30±0.21 |
| νe | 0.14±0.12 | 0.31±0.08 | 0.36±0.25 | 0.36±0.25 |
| τi(s) | 0.4±0.4 | 2.1±1.7 | 1.8±0.2 | 1.8±0.4 |
Unpaired student t test p < 0.05.
Figure 4 compares values of Ktrans obtained by the FXL-constrained and FXR- permitted methods. This parameter was about twice as great in the indolent tumor as in the aggressive tumor (unpaired student t test p<0.05). The FXL-constrained analysis produced no significant difference between any of the parameters of the aggressive or indolent tumors and yielded a mean value of Ktrans for the indolent tumors that was about half the value obtained by the FXR-permitted method.
Figure 4.
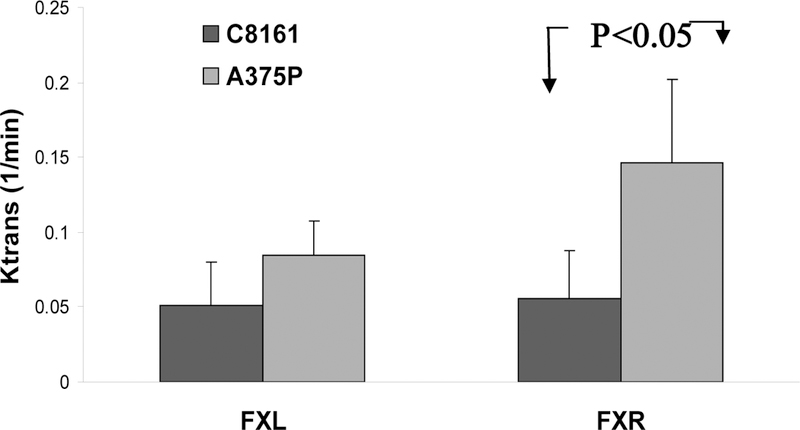
Mean Ktrans in tumor cores of indolent A375P melanomas (light gray) and aggressive C8161 melanomas (dark) as determined by the FXL-constrained (left) and FXR-permitted (right) methods. Statistical significant (p<0.05) difference between these two lines was only detected using the FXR-permitted method.
For small animal tumor data, the FXR-permitted method yielded better data fits than the FXL-constrained analysis.10 In addition, in a previous study of the RIF-1 tumor model the FXL-constrained analysis produced a spurious dependence of νe on the Gd- DTPA concentration (R. Zhou, J.D. Glickson, C.S. Springer, unpublished). Therefore, the FXR-permitted analysis is preferred.
On the basis of the vasculogenic mimicry concept, we would have expected to see a higher Ktrans in the aggressive than the indolent tumor. However, histological analysis (Figure 5) indicates that there is more blood vasculature in the aggressive tumor, but most of the vascularture appear collapsed and many of them are probably non-functional.
Figure 5.
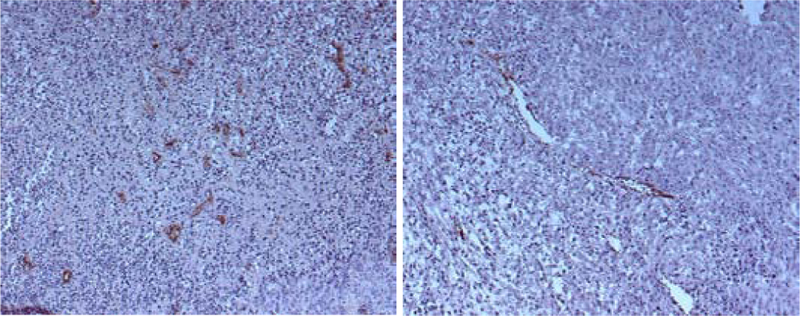
Histological slides of an aggressive C8161 melanoma tumor specimen (left) and indolent melanoma A375P tumor specimen (right). An anti-factor VIII stain has been applied to identify vascular endothelium.
Therefore, the aggressive tumor may produce more blood vasculature because of the ability of melanoma cells to generate vascular channels, but these blood vascular structures do not appear to lead to an overall improvement in the functional blood exchange of the aggressive tumor. Rather this tumor appears to be more poorly perfused and/or equipped with less leaky vasculature. In addition, the histological analysis revealed extensive regions of gross necrosis in the aggressive but not in the indolent tumor (not shown in Figure 5). This again is consistent with the assignment of the mitochondrial state of the tumor to State 2 (starved) rather than to State 3 (active and well supplied with substrate). However, we recognize that these paradoxical data may be explained by our protracted window of observation and the voluminous number of melanoma cells injected into the mice. Previous experiments, especially with the highly aggressive C8161 melanoma cells, have utilized half the number of tumor cells 1×10⁶ for subcutaneous implantation and observed metastasis within 2 weeks.7 Therefore, the necrosis seen in the current study, along with the associated malfunctional vasculature, may be a consequence of tumor cell overload and an artificially extended window of observation.
3.3. T1ρ MRI of Melanoma
We have observed significant differences between the average T1ρvalues of the indolent A375P and aggressive C8161 tumors at SLFs ranging from 490–4000Hz. Figure 6 displays a plot of mean T1ρ values versus spin locking frequency for twelve melanomas, six indolent A375P tumors and six aggressive C8161 tumors. When the SLF was above 800 Hz, T1ρ tended to increase with SLF, and the indolent tumor exhibited distinctly longer relaxation times than the aggressive tumor. When the SLF was below 800 Hz, the separation was still quite distinct, though a couple of data points overlapped.
Figure 6.
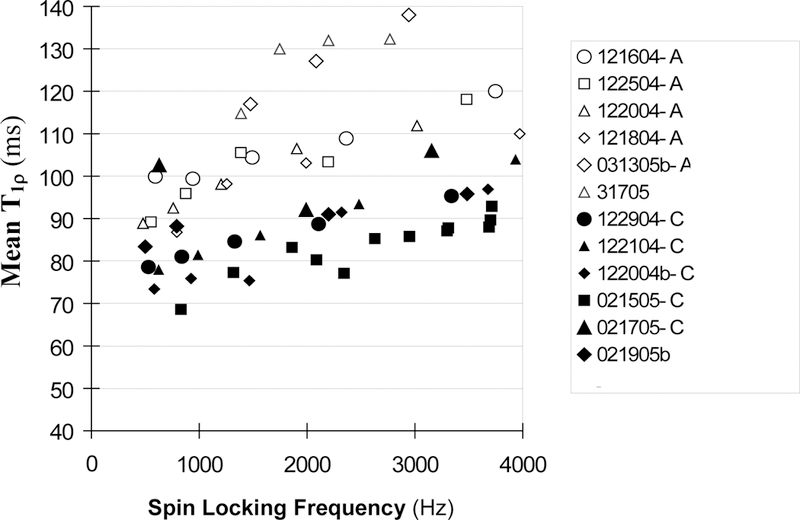
Mean T1ρ values versus the frequency of the spin locking pulse for indolent melanoma A375P (open markers, n=6) and aggressive C8161 melanoma (solid markers, n=6).
To determine if the differences between A375P and C8161 T1ρ values were statistically significant, the T1ρ data were divided into three subgroups according to their SLF values: 490–1499, 1500–2499, 2500–4000Hz. For each subgroup, the mean value and standard deviation of T1ρ were calculated for the A375P and C8161 tumors and are presented in Table 2. T-test analysis indicates that the differences were statistically significant with p<0.01 or lower (Note: although the data show that T1ρ had a moderate dependence on SLF, the trend of dependence was approximately linear and similar between the aggressive and indolent tumors. The SLF-dependent T1ρ variation was also significantly smaller than the inter-tumor variation. Therefore, on first order approximation, it was justified to perform the statistical comparison of the subinterval mean T1ρ difference between the two types of tumors, and the moderate dependence of T1ρ on SLF should not have caused significant errors in the t-test analysis). The average T2 values, 50±7 ms for the A375P tumors and 43±10 ms for C8161 tumors, were not significantly different on the basis of unpaired t-test analysis. Neither were the differences in tumor mean T1 values significant (p>0.1) (Table 2). Therefore only the T1ρ relaxation times were suitable for distinguishing between these aggressive and indolent tumors.
Table 2.
Comparison of mean T1ρ, T2, T1 between A375P and C8161 melanoma
| mean T1ρ±STD (ms) |
T2±STD (ms) |
T1±STD (s) |
|||
|---|---|---|---|---|---|
| SLF (Hz) | 490–1499 | 1500–2499 | 2500–3499 | - | - |
| A375P | n=6 | n=6 | n=4 | n=6 | n=4 |
| 103±10 | 113±12 | 125±12 | 53±7 | 2.07±0.03 | |
| C8161 | n=6 | n=6 | n=4 | n=6 | n=4 |
| 83±11 | 88.5±5 | 96±8 | 45±8 | 2.05±0.03 | |
| p (t-test) | <0.01 | <0.005 | <0.01 | >0.05 | >0.1 |
Increases in 1/T1ρ have been observed to correlate with the macromolecular concentration,17,18 which might be associated with the substantial necrosis noted in the aggressive tumor, although a correlation of decreased T1ρ with tissue necrosis is not well established in the literature. Another possibility is that the indolent tumor was more acidic than the aggressive tumor (due to more glycolysis in the indolent tumor). A decrease in proton exchange rate that would be expected in a more acidic environment could lead to an increase in T1ρ.
4. CONCLUSIONS
Three methods potentially applicable to human patients have been demonstrated to distinguish between aggressively metastatic and indolent human melanoma xenografts. One of these methods (optical imaging) can be applied to frozen biopsy specimens to obtain 3D high resolution images of tumor heterogeneities, whereas the other two can be utilized noninvasively in humans. The optical method also showed a marked increase in the Fp redox ratio in the core of the aggressive tumor. In some slices the rim of the aggressive tumor seems to have had a much lower redox ratio (higher NADH level). Since the DCE MRI data indicate lower functional blood exchange (perfusion/permeability) in the core of the aggressive tumor, the low Fp redox ratio was interpreted as indicative of State 2 mitochondrial metabolism – i.e., the core appears to have been depleted of substrate. A more poorly perfused core of the C8161 tumor would be expected to secrete VEGF and other cytokines that could facilitate metastasis.
Note that intertumor heterogeneity was quite high, as particularly indicated by the observations of DCE and optical imaging; thus, more studies are needed to confirm these preliminary observations. The effect of tumor mass and overall tumor body burden on the mitochondrial state, the perfusion characteristics and T1ρ relaxivity of these tumors needs to be examined in order to permit a meaningful comparison with human cancer that normally is associated with lower tumor body burden and, therefore, better perfusion than the murine models.
Three other melanoma cell lines with intermediate levels of metastatic potential in the human host have been obtained from Dr. Hendrix’s laboratory and will be examined as xenografts. Future work will be directed to comparison of xenografts of these sublines with those that have already been characterized. Additionally, extension to other forms of human cancer is contemplated. If the difference between an indolent and an aggressive melanoma observed in this study can be generalized to other cancer cell lines and correlated with the graded levels of tumor metastatic potential, these imaging techniques would provide valuable methods for cancer diagnosis. The availability of reliable methods for predicting the aggressiveness of human cancers would have enormous impact on the clinical management of this disease.
5. ACKNOWLEDGEMENT
This research was supported by NIH grant P01-CA56690–09A2 (D.B. Leeper, PI, J.D. Glickson, project director), P50-CA 093372 (M. Herlyn, PI), U01-CA105490 (L.A. Chodosh, PI). The T1ρ-weighted MRI was assisted by Dr. Ravinder Regatte and Dr. Ravinder Reddy. Mr. David Nelson in preparation of the manuscript is acknowledged.
Contributor Information
Lin Z.J. Li, Molecular Imaging Laboratory, Department of Radiology, Philadelphia, Pennsylvania 19104
Rong Zhou, Molecular Imaging Laboratory, Department of Radiology, Philadelphia, Pennsylvania 19104.
Tuoxiu Zhong, Department of Biochemistry & Biophysics, Johnson Research Foundation, University of Pennsylvania, Philadelphia, Pennsylvania 19104.
Lily Moon, Department of Biochemistry & Biophysics, Johnson Research Foundation, University of Pennsylvania, Philadelphia, Pennsylvania 19104.
Eun Ju Kim, Molecular Imaging Laboratory, Department of Radiology, Philadelphia, Pennsylvania 19104.
Hui Qiao, Molecular Imaging Laboratory, Department of Radiology, Philadelphia, Pennsylvania 19104.
Stephen Pickup, Molecular Imaging Laboratory, Department of Radiology, Philadelphia, Pennsylvania 19104.
Mary J. Hendrix, Children’s Memorial Research Center, Northwestern University, Evanston, IL 60208
Dennis Leeper, Department of Radiation Oncology, Thomas Jefferson University, Philadelphia, PA19107.
Britton Chance, Department of Biochemistry & Biophysics, Johnson Research Foundation, University of Pennsylvania, Philadelphia, Pennsylvania 19104.
Jerry D. Glickson, Molecular Imaging Laboratory, Department of Radiology, Philadelphia, Pennsylvania 19104.
6. REFERENCES
- 1.Folberg R, Hendrix MJ & Maniotis AJ. Vasculogenic mimicry and tumor angiogenesis. American Journal of Pathology 156(2), 361–381 (2000). [DOI] [PMC free article] [PubMed] [Google Scholar]
- 2.Hendrix MJ, Seftor EA, Hess AR & Seftor RE. Vasculogenic mimicry and tumour-cell plasticity: lessons from melanoma. Nature Reviews Cancer 3(6), 411–421 (2003). [DOI] [PubMed] [Google Scholar]
- 3.Maniotis AJ et al. Vascular channel formation by human melanoma cells in vivo and in vitro: vasculogenic mimicry. American Journal of Pathology 155(3), 739–752 (1999). [DOI] [PMC free article] [PubMed] [Google Scholar]
- 4.Maniotis AJ et al. Control of melanoma morphogenesis, endothelial survival, and perfusion by extracellular matrix. Laboratory Investigation 82(8), 1031–43 (2002). [DOI] [PubMed] [Google Scholar]
- 5.Ruf W et al. Differential role of tissue factor pathway inhibitors 1 and 2 in melanoma vasculogenic mimicry. Cancer Research 63(17), 5381–9 (2003). [PubMed] [Google Scholar]
- 6.Hendrix MJ et al. Coexpression of vimentin and keratins by human melanoma tumor cells: correlation with invasive and metastatic potential. Journal of the National Cancer Institute 84(3), 165–174 (1992). [DOI] [PubMed] [Google Scholar]
- 7.Welch DR et al. Characterization of a highly invasive and spontaneously metastatic human malignant melanoma cell line. International Journal of Cancer 47(2), 227–237 (1991). [DOI] [PubMed] [Google Scholar]
- 8.Quistorff B, Haselgrove JC & Chance B. High resolution readout of 3-D metabolic organ structure: An automated, low-temperature redox ratio-scanning instrument. Anal. Biochem 148389–400 (1985). [DOI] [PubMed]
- 9.Kozlowski JM, Hart IR, Fidler IJ & Hanna N. A human melanoma line heterogeneous with respect to metastatic capacity in athymic nude mice. Journal of the National Cancer Institute 72(4), 913–7 (1984). [PubMed] [Google Scholar]
- 10.Zhou R, Pickup S, Yankeelov TE, Springer CS & Glickson JD. Simultaneous measurement of arterial input function and tumor pharmacokinetics in mice by dynamic contrast enhanced imaging: effects of transcytolemmal water exchange. Magn. Reson. Med 52248–57 (2004). [DOI] [PubMed]
- 11.Yankeelov TE, Rooney WD, Li X & Springer CS Jr. Variation of the relaxographic “shutter-speed” for transcytolemmal water exchange affects the CR bolus-tracking curve shape. Magnetic Resonance in Medicine 50(6), 1151–69 (2003). [DOI] [PubMed] [Google Scholar]
- 12.Wheaton AJ et al. In vivo quantification of T1ρ using a multislice spin-lock pulse sequence. Magnetic Resonance in Medicine 52(6), 1453–1458 (2004). [DOI] [PubMed] [Google Scholar]
- 13.Borthakur A et al. In vivo measurement of T1ρ dispersion in the human brain at 1.5 tesla. Journal of Magnetic Resonance Imaging 19(4), 403–409 (2004). [DOI] [PubMed] [Google Scholar]
- 14.Chance B, Schoener B, Oshino R, Itshak F & Nakase Y. Oxidation-reduction ratio studies of mitochondria in freeze-trapped samples. NADH and flavoprotein fluorescence signals. Journal of Biological Chemistry 254(11), 4764–4771 (1979). [PubMed] [Google Scholar]
- 15.Chance B. in Flavins and Flavoproteins (ed. Slater EC) 498–510 (Elsevier, Amsterdam, 1966). [Google Scholar]
- 16.Chance B & Baltscheffsky H. Respiratory Enzymes in Oxidative Phosphorylation. J. Biol. Chem 233(2), 736–739 (1958). [PubMed] [Google Scholar]
- 17.Virta A, Komu M & Kormano M. T1rho of protein solutions at very low fields: dependence on molecular weight, concentration, and structure. Magnetic Resonance in Medicine 37(1), 53–57 (1997). [DOI] [PubMed] [Google Scholar]
- 18.Duvvuri U et al. Water magnetic relaxation dispersion in biological systems: the contribution of proton exchange and implications for the noninvasive detection of cartilage degradation. Proceedings of the National Academy of Sciences of the United States of America 98(22), 12479–12484 (2001). [DOI] [PMC free article] [PubMed] [Google Scholar]