Abstract
The perpetuation of inflammation is an important pathophysiological contributor to the global medical burden. Chronic inflammation is promoted by non-programmed cell death1,2; however, how inflammation is instigated, its cellular and molecular mediators, and its therapeutic value are poorly defined. Here we use mouse models of atherosclerosis—a major underlying cause of mortality worldwide—to demonstrate that extracellular histone H4-mediated membrane lysis of smooth muscle cells (SMCs) triggers arterial tissue damage and inflammation. We show that activated lesional SMCs attract neutrophils, triggering the ejection of neutrophil extracellular traps that contain nuclear proteins. Among them, histone H4 binds to and lyses SMCs, leading to the destabilization of plaques; conversely, the neutralization of histone H4 prevents cell death of SMCs and stabilizes atherosclerotic lesions. Our data identify a form of cell death found at the core of chronic vascular disease that is instigated by leukocytes and can be targeted therapeutically.
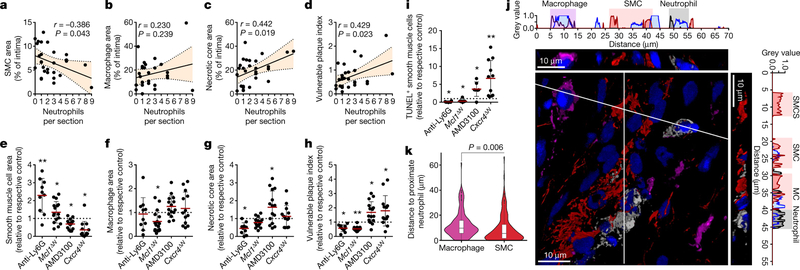
Neutrophils are readily available as part of the antimicrobial immune response and are irreplaceable during host defence, yet the same neutrophil-borne mediators can promote tissue injury and uphold inflammation. However, the mechanism by which neutrophils orchestrate collateral damage in nearby tissue is not well understood. Injury-triggered non-programmed cell death is a defining feature of chronic inflammation. Because excessive cell death is a hallmark of plaque destabilization, as exemplified by the importance of deceased SMCs3, here we studied the effect of lesional neutrophils on SMC survival. We generated advanced atherosclerotic lesions with features of instability in hypercholesterolemic mice4,5 (Extended Data Fig. 1a–f). Lesional neutrophils inversely correlated with SMA+ (smooth muscle actin) SMCs and fibrous cap thickness, while positively correlating with necrotic core area, lesion size and overall vulnerability (Fig. 1a–d, Extended Data Fig. 1g, h). Notably, no association was found between lesional neutrophils and collagen content (Extended Data Fig. 1i), lesional macrophages (Fig. 1b), endothelial cells and the activation status of macrophages and endothelial cells (Extended Data Fig. 1j–o). To establish causality between lesional neutrophil infiltration, SMC death and plaque stability, we induced sustained neutropenia by repeated injection of neutrophil-depleting antibodies or by genetic depletion of a neutrophil survival factor (Apoe−/−Ly6gcreMcl1flox/flox). Alternatively, we generated systemic neutrophilia by pharmacological inhibition of CXCR4 or by deletion of Cxcr4 in myeloid cells (Apoe−/−Lyz2creCxcr4flox/flox, Extended Data Fig. 2a). Neutropenia and neutrophilia diminished or enhanced, respectively, both circulating and lesional neutrophil counts (Extended Data Table 1, Extended Data Fig. 2b, c). Functionally, neutropenia increased SMC content and fibrous cap thickness—which resulted in lower overall plaque vulnerability—whereas the opposite was found in neutrophilic mice (Fig. 1e–h, Extended Data Fig. 2d–s). Alterations in the number of SMCs were associated with increased SMC death (Fig. 1i), but not with changes in cell proliferation (Extended Data Fig. 2t, u). Notably, human lesions that were infiltrated with higher numbers of neutrophils exhibited lower lesional SMC area and increased overall vulnerability (Extended Data Fig. 2v, w). Consistent with the observed neutrophil-based modulation of lesion-resident SMC numbers, intimal neutrophils were found in closer proximity to SMCs than were macrophages (Fig. 1j, k), which suggests a direct interaction between these two cell types.
Fig. 1 |. Neutrophils dictate plaque stability.
a–d, Advanced lesions were generated by insertion of a shear stress modifier around the carotid artery. Pearson correlation between lesional neutrophils and SMC area (SMA+, a), macrophage area (CD68+, b), necrotic core area (c), and overall vulnerability (d). n = 28 mice. Dotted line represents 95% confidence interval. e–i, Neutropenia (anti-Ly6G) or neutrophilia (AMD3100) were induced during the last 4 weeks of the experiment. Genetically neutropenic Apoe−/− mice (Ly6greMcl1flox/flox, Mcl1ΔN) were fed a high-fat diet for a total of 11 weeks and advanced atherosclerotic lesions were analysed in aortic roots. Genetic neutrophilia was established in Apoe−/− mice that were lethally irradiated and reconstituted with bone marrow from Lyz2cre mice or from Lyz2creCxcr4flox/flox (Cxcr4ΔN) mice. Antibody-induced neutropenic (anti-Ly6G, n = 10 mice (e–i), genetic neutropenic (Mcl1ΔN), n = 16 mice (e–h), n = 10 mice (i)), pharmacological neutrophilic (AMD3100, n = 15 mice (e–h), n = 7 mice (i)) and genetic neutrophilic (Cxcr4ΔN, n = 13 mice (e–h), n = 11 mice (i)) are compared with respective controls (isotype IgG, n = 10 mice (e–i), Ly6gcre, n = 18 mice (e–h), n = 10 mice (i), vehicle (n = 15 mice (e–h), n = 7 mice (i)), or Lyz2cre (n = 11 mice (e–h), n = 9 mice (i))), respectively, dashed line. Displayed is the quantification of the SMC (SMA+) area (e), macrophage area (CD68+, f), necrotic core area (g), and overall vulnerability (h). i, Dead SMCs were quantified as TUNEL+SMA+ cells. For the aMd3100 condition, a twosided Mann-Whitney test was used. j, Representative immunofluorescence micrograph showing lesional neutrophils (Ly6G+, grey), SMCs (SMA+, red), macrophages (CD68+, magenta) and nuclei (DAPI, blue). Dotted lines indicate cross-section views. The diagonal cross-section is shown at the top (xyz) and the vertical cross-section is shown on the right (yz). Intensity profiles of the indicated emission wavelengths are shown. k, Violin plot showing the distance of intimal neutrophils to macrophages (CD68+) (n = 148 cells) and SMCs (SMA+) (n = 171 cells). The median is represented by the horizontal line within the white box, and the boundaries of the box indicate the interquartile range. Two-sided unpaired t-tests were used unless otherwise stated; *P < 0.05; **P < 0.01; ***P < 0.001. Data are mean ± s.d.
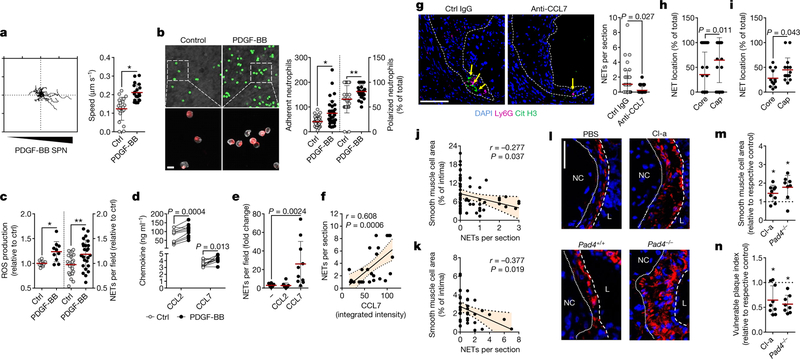
Phenotypic transition of arterial SMCs towards a pro-inflammatory, secretory phenotype mediates leukocyte infiltration and atherosclerosis6. Because neutrophils predominantly located in proximity to lesional SMCs, we investigated whether activated SMCs guide neutrophils towards them. Supernatants obtained from platelet-derived growth factor-BB (PDGF-BB)-activated SMCs evoked chemotactic attraction (Fig. 2a, Extended Data Fig. 3a, b), followed by enhanced neutrophil-SMC interaction and neutrophil polarization (Fig. 2b). Because chemokine signalling is a prerequisite for neutrophil activation and neutrophil extracellular trap (NET) release (NETosis)7, we investigated whether secretory products of activated SMCs trigger neutrophils to undergo NETosis. Neutrophils incubated with the supernatant of PDGF-BB-treated SMCs produced increased amounts of reactive oxygen species and released NETs (Fig. 2c). These supernatants were enriched in the CCR2 ligands CCL2 and CCL7 (Fig. 2d, Extended Data Fig. 3c, d). Notably, only recombinant CCL7 evoked NET release (Fig. 2e). Furthermore, intimal CCL7 positively correlated with lesional NETs (Fig. 2f) but not with lesional neutrophil numbers (Extended Data Fig. 3e), and its blockade resulted in reduced numbers of intimal NETs (Fig. 2g). Consistent with the idea that activated SMCs promote NET release within the atherosclerotic lesion, NET-releasing neutrophils in mouse and human atherosclerotic lesions were predominantly found in the SMC-rich fibrous cap (Fig. 2h, i). This observation raised the question of whether intimal NETosis might exert cytotoxic effects that account for the inverse relationship between the numbers of lesional neutrophils and SMCs. Consistent with this, intimal NETs in mouse (Fig. 2j) and human (Fig. 2k) atherosclerotic lesions inversely correlated with SMC content and resided in close proximity to dead SMCs (Extended Data Fig. 3f, g). Notably, such trap-DNA structures were found to be primarily of neutrophil origin (Extended Data Fig. 3h–j). To investigate the cytotoxic effect of NETs on SMCs, SMCs were incubated with phorbol myristate acetate (PMA)- or CCL7-induced NETs (Extended Data Fig. 3k, l), which resulted in reduced cell viability. Pharmacological (Cl-amidine treatment) or genetic (mice that lacked Pad4) blockade of NET release resulted in increased lesional SMC content and decreased overall plaque vulnerability (Fig. 2l–n, Extended Data Fig. 4, Extended Data Table 1).
Fig. 2 |. Activated smooth muscle cells trigger NETosis promoting atherosclerotic plaque vulnerability.
a, Tracks (left) and speed (right) of neutrophil migration towards the supernatant of PDGF-BB-activated SMCs. n = 20 ctrl; n = 19 PDGF-BB neutrophils. *P = 0.00001. b, Number of adherent neutrophils to SMCs (Ly6G, green; n = 39 ctrl, n = 35 PDGF-BB) and their CD62L polarization frequency (red; n = 26 ctrl, n = 28 PDGF-BB). Scale bar, 50 μm. *P = 0.0002; **P = 0.009. c, Reactive oxygen species (ROS) production (left, n = 9 ctrl; n = 10 PDGF-BB) and NET release (right, n = 22 ctrl; n = 25 PDGF-BB) of neutrophils exposed to supernatants of resting (ctrl) or PDGF-BB-activated SMCs. *P = 0.004; **P = 0.008. d, CCL2 and CCL7 levels in supernatants from PDGF-BB-activated SMCs. n = 10. Two-sided paired t-test. e, NET release by VCAM-1-bound neutrophils treated with vehicle, CCL2 or CCL7, compared to non-coated control. n = 10 fields. One-way ANOVA with Holm-Sidak correction. f, Pearson correlation between NETs and intimal CCL7 in advanced atherosclerotic lesions in mice. n = 28 sections. g, Apoe−/− mice with advanced atherosclerotic lesions were treated with anti-CCL7 or isotype IgG and lesional NETs were quantified. Representative micrographs are shown. Ly6G, magenta; citrullinated histone H3, green; DNA (DAPI), blue. Dashed line delineates intima. Scale bar, 100 μm. n = 44 sections IgG; n = 27 sections anti-CCL7. h, i, Percentage of NETing neutrophils present in the indicated compartments of mouse (h) or human (i) atherosclerotic lesions. n = 33 sections in h and n = 13 core and n = 16 cap in i. j, k, Pearson correlation between NETs and SMC (SMA+) area in mouse (j, n = 57 mice) and human (k, n = 38 sections) atherosclerotic lesions. l–n, Advanced lesions were generated by insertion of a shear stress modifier around the carotid artery. Pharmacologic (Cl-amidine, Cl-a, during last 4 weeks, n = 9 mice) or genetic (Apoe−/−Pad4−/−, n = 8 mice) inhibition of NET release and respective controls (PBS treatment, n = 8 mice, or Apoe−/− Pad4+/+, n = 6 mice). Representative immunostaining images (l) show SMC (SMA, red) and nuclei (DAPI, blue). The dotted line delineates SMCs from the necrotic core, the dashed line outlines the lumen. Scale bar, 50 μm. Quantification of SMC area (SMA+, m) and vulnerable plaque index (n). Tested against respective control. *P < 0.05. All data are presented as mean (red line) ± s.d. L, lumen; NC, necrotic core; SPN, supernatant. Dotted lines in f, j and k represent 95% confidence interval. Two-sided unpaired t-test; n indicates biological samples unless otherwise stated.
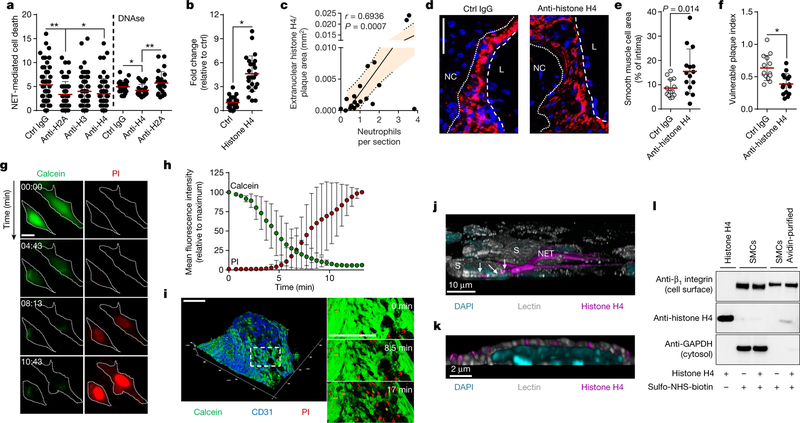
NETs are decorated with granule-derived and nuclear proteins that determine their functionality8. Antibody- and inhibitor-based blocking of abundant NET-resident granule proteins did not affect NET-evoked cytotoxicity (Extended Data Fig. 5a, b), whereas the neutralization of histone H2A and H4 significantly rescued SMC viability (Fig. 3a). Notably, NET structures disrupted by DNase treatment retained cytotoxicity capacity. However, under these conditions, the neutralization of H2A failed to block NET-mediated cytotoxicity, whereas the effect of histone H4 blockade was preserved (Fig. 3a). In addition, recombinant histone H4 potently induced cell death (Fig. 3b), which suggests that NET-bound and free histone H4 exhibit strong cytotoxicity (Extended Data Fig. 5c). As histone H4 was abundant in intimal NETs (Extended Data Fig. 5d) and because extranuclear histone H4 positively correlated with the number of intimal neutrophils (Fig. 3c, Extended Data Fig. 5e), we investigated the effect of histone H4 on the destabilization of atherosclerotic plaques. Antibody blockade of histone H4 in hypercholesterolemic mice with established lesions generated plaques with reduced vulnerability and increased lesional SMC content (Fig. 3d–f, Extended Data Fig. 6, Extended Data Table 1).
Fig. 3 |. NET-derived histone H4 induces SMC lysis and exacerbates plaque instability.
a, SMCs were treated with NETs pre-incubated with antibodies to histone isoforms and cell death was measured as propidium iodide positive (PI+) cells. n = 57 IgG; n = 58 anti-H2A; n = 59 anti-H3; n = 58 anti-H4 fields. One-way ANOVA with Tukey’s correction; *P = 0.014; **P = 0.007. Where indicated, NETs were treated with DNase before incubation with indicated antibodies. n = 24 fields. Two-sided unpaired t-test; *P = 0.044; **P = 0.007. b, Histone H4-induced SMC death quantified by PI uptake. n = 24 fields. Two-sided unpaired t-test, *P = 1.27 × 10⁻⁹. c, Pearson correlation between extranuclear histone H4 and neutrophils in intimas. n = 20 mice. Dotted line represents 95% confidence interval. d–f, Apoe−/− mice with advanced lesions were treated with isotype IgG (n = 14 mice) or anti-histone H4 (n = 15 mice) during the last 4 weeks of the experiment. d, Representative immunostaining for SMCs (SMA, red) and nuclei (DAPI, blue). The dotted line delineates SMCs from the necrotic core, the dashed line outlines the lumen. Scale bar, 50 μm. e, f, Quantification of SMC area (SMA+, e) and plaque vulnerability (f). Two-sided unpaired t-test. *P = 0.0009. g, h, Time-lapse microscopy of SMCs treated with histone H4 showing PI entry and calcein dispersion. g, Representative micrographs. Scale bar, 10 μm. h, Quantification over time. n = 15 cells. i, Time-lapse two-photon microscopy of whole-mount lesions stained with calcein (green) and anti-CD31 (blue) recorded in the presence of PI and histone H4. Scale bar, 100 μm. j, k, Visualization of cell membrane (lectin, white), histone H4 (magenta) and DNA (DAPI, cyan) in a SMC (S) and neutrophil co-culture (j) or in SMCs treated with recombinant histone H4 (k). White arrows indicate NET-derived histone H4 SMC plasma membrane interactions. l, SMCs treated with recombinant histone H4 were labelled with sulfo-NHS-SS-biotin. Western blot of non-purified lysates (SMCs) and plasma membrane fractions (SMCs avidin-purified) with indicated antibodies (for gel source data, see Supplementary Fig. 1). Data are mean ± s.d.
NET-derived histones can induce endothelial cell cytotoxicity through the activation of Toll-like receptors (TLRs)9. However, inhibition of TLR signalling did not affect NET-mediated SMC death (Extended Data Fig. 7a). Instead, histone H4 induced the ultra-rapid release of cytoplasmic calcein and uptake of propidium iodide in SMCs (Fig. 3g, h, Supplementary Video 1) and whole-mount atherosclerotic lesions (Fig. 3i), suggesting a non-programmed cell-death process. Guided by previous reports that suggested the membrane activity of histone H4 in bacteria10, we proposed that histone H4 interacts with the SMC plasma membrane to induce cell lysis. High-resolution imaging of SMCs with either NETing neutrophils (Fig. 3j, Extended Data Fig. 7b) or recombinant histone H4 (Fig. 3k, Extended Data Fig. 7c, Supplementary Video 2) revealed a direct interaction of histone H4 with the plasma membrane, a finding that was corroborated by biotin-assisted pull-down of membrane-bound proteins of SMCs (Fig. 3l). In accordance with a cell lysis mechanism, NETs or histone H4 induced SMC swelling and the release of ATP (Extended Data Fig. 7d–g). Given the cationic properties of histone H4 (ζ potential 26.64 ± 2.82 mV) and the anionic nature of the plasma membrane, we tested whether histone H4-membrane interaction was mediated by electrostatic forces. Manipulation of the SMC surface charge using oleylamine or cholesterol sulfate increased or decreased cationicity, respectively (Extended Data Fig. 7h), thus inhibiting or promoting histone H4-membrane anchorage (Extended Data Fig. 7i) and consequent cell death (Extended Data Fig. 7j).
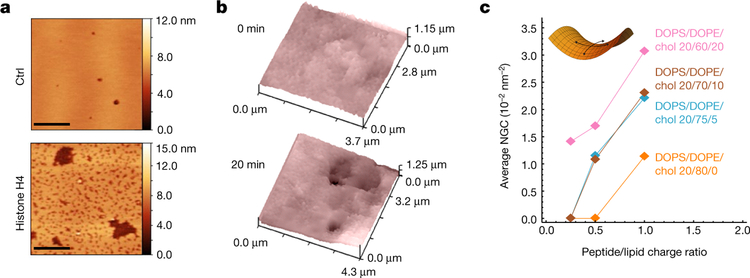
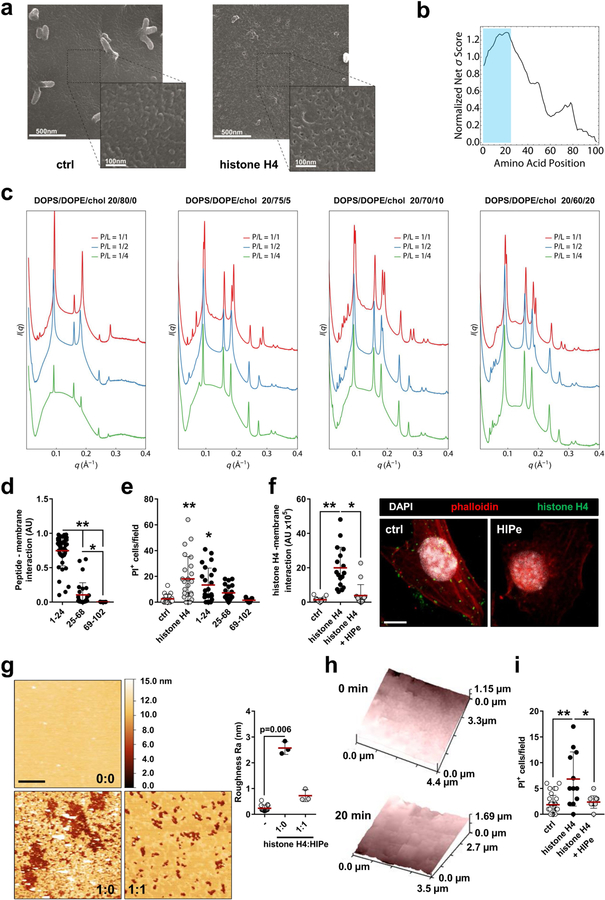
The apparent disruption of the integrity of the SMC plasma membrane and the rapid induction of death by histone H4 prompted us to investigate the biophysical basis of histone H4-mediated membrane permeation. Atomic force microscopy on artificially reconstituted membrane bilayers incubated with histone H4 showed the appearance of pores (Fig. 4a). Similarly, when SMCs were exposed to histone H4, alterations in the membrane were observed (Extended Data Fig. 8a) as a result of dynamic bending and pore formation (Fig. 4b). A machine-learning classifier that was trained to identify α-helical membrane-active sequences11 revealed high σ scores within the histone H4 N terminus (Extended Data Fig. 8b). Such scores correlate with the ability to generate negative Gaussian curvature in membranes required for pore formation, as shown for cell-penetrating polypeptides12,13. To validate this prediction we performed small-angle X-ray scattering on small unilamellar vesicles incubated with the histone H4 N terminus, and observed strong, dose-dependent membrane deformation rich in negative Gaussian curvature (Pn3m cubic phases). Gaussian curvature (〈K〉) values were comparable to those obtained from other membrane-remodelling proteins12; such remodelling is facilitated in cholesterol-containing membranes (Fig. 4c, Extended Data Fig. 8c). Consistent with this, the histone H4 N terminus interacted with SMC membranes (Extended Data Fig. 8d) and induced cell death (Extended Data Fig. 8e).
Fig. 4 |. Membrane-pore-forming activity of histone H4.
a, Atomic force microscopy images of reconstituted membrane lipid bilayers incubated with recombinant histone H4. Scale bar, 1 μm. b, Live scanning ion conductance microscopy of SMCs. Images represent the plasma membrane before (top) and after (bottom) incubation with histone H4. c, Small angle X-ray scattering data demonstrate that the N-terminal domain of histone H4 induces negative Gaussian curvature (NGC) in small unilamellar vesicles, with membrane compositions as indicated at increasing peptide:lipid ratios. The peptide induced Pn3m cubic phases, which are rich in NGC, and are indicative of membrane permeation. The plot shows the absolute value of NGC induced by histone H4 N terminus as a function of the protein:lipid charge ratio. Chol, cholesterol; DOPE, 1,2-dioleoyl-sn-glycero-3-phosphoethanolamine; DOPS, 1,2-dioleoyl-sn-glycero-3-phospho-l-serine.
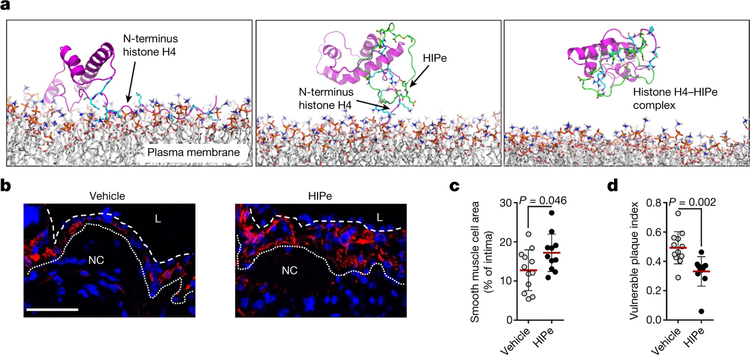
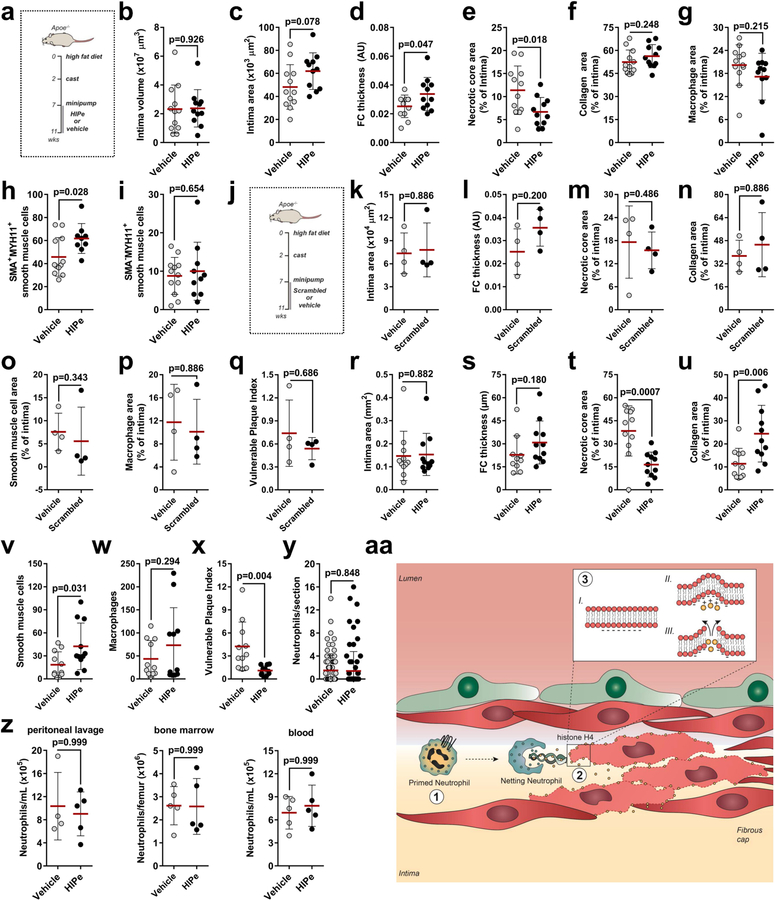
Owing to the importance of SMC death in the regulation of plaque vulnerability, we explored therapeutic strategies to prevent histone H4-driven cytotoxicity. Molecular dynamic simulation of histone H4 in the presence of membrane structures confirmed that the N-terminal region is responsible for the H4-membrane interaction (Fig. 5a). Consequently, we screened for peptides that were predicted to form stable complexes with the H4 N terminus. The cyclical peptide HIPe (histone inhibitory peptide) showed a potential ability to efficiently disturb histone H4-membrane interactions (Fig. 5a). Consistent with this prediction, HIPe prevented histone H4 from interacting with (Extended Data Fig. 8f) and altering (Extended Data Fig. 8g, h) membranes, and from inducing SMC death (Extended Data Fig. 8i). We next investigated the therapeutic benefits of HIPe on atherosclerotic plaque vulnerability. The continuous administration of HIPe to mice with pre-existing atherosclerotic lesions resulted in increased lesional SMC content, and generated lesions with increased stability traits both in carotid (Fig. 5b–d, Extended Data Fig. 9a–q, Extended Data Table 1) and brachiocephalic (Extended Data Fig. 9r–x) lesions without altering neutrophil recruitment (Extended Data Fig. 9y, z).
Fig. 5 |. Therapeutic disruption of the histone H4-plasma membrane interaction stabilizes atherosclerotic lesions.
a, Molecular dynamics simulations of the interaction between histone H4 (magenta) and the plasma membrane. The N-terminal domain of histone H4 (cyan) exhibits membrane activity (left). Histone inhibitory peptide (HIPe, green) binds to the N terminus of histone H4 (middle) and disrupts the interaction with the cell membrane (right). b–d, Hypercholesterolemic mice with established atherosclerotic lesions were implanted with osmotic minipumps delivering vehicle or HIPe for the last four weeks of the experiment. b, Representative immunostaining images for SMC (SMA, red) and nuclei (DAPI, blue) of atherosclerotic lesions. The dotted line delineates SMCs from the necrotic core, the dashed line outlines the lumen. Scale bar, 50 μm. c, d, Quantification of SMC area (SMA+, c) and overall lesion vulnerability (d). Two-sided unpaired t-test, n = 12 mice (vehicle) or n = 11 mice (HIPe).
The identification of new therapeutic strategies to inhibit cell death associated with chronic inflammation, as exemplified by cardiovascular diseases, is a major challenge in modern medicine. Here we identify a form of histone-induced death as a source of chronic inflammation within arterial walls that increases instability traits in atherosclerotic plaques. Histone H4 is released from neutrophils which are attracted and rendered prone to releasing histone-containing NETs by SMCs (Extended Data Fig. 9aa, Supplementary Video 3).
Upon danger, neutrophils rapidly infiltrate the inflammatory site and cause severe tissue injury as a collateral effect of their function. At the vascular site, rapid release of cytotoxic NETs exerts severe tissue damage, thereby reducing structural signs of stability of the atherosclerotic plaque. Luminal14 or abluminal deposition of NET-derived products may lead to death of endothelial cells or SMCs, respectively, and hence dictate diverse aetiologies of cardiovascular pathologies.
As well as the architectural function of histones in chromatin organization, histones released upon cell damage are noxious and induce tissue damage15,16. Our data indicate that histones—and in particular histone H4—that originate from intimal NETs and possibly necrotic cells induce rapid, receptor-independent cell death in SMCs via the formation of membrane pores, thus contributing to vascular tissue damage. Owing to the controversial antimicrobial effector function of NETs17, peptide-based histone H4 blockade could have potential as a therapeutic strategy for the prevention of damage to vascular as well as other types of tissue, without substantially compromising NETosis-mediated host defence.
METHODS
Ethics statement.
All mouse experiments were performed according to European guidelines for the Care and Use of Laboratory Animals. Protocols were approved by the Committee on the Ethics of Animal Experiments of the Academic Medical Center (DBC102939), Amsterdam and Regierung von Oberbayern (55.2-1-54-2532-159-2014).
Mouse procedures.
For mouse experiments, statistical power calculations were performed as described at http://www.stat.uiowa.edu/~rlenth/Power/ to determine sample size. Mice were assigned to groups randomly and data collection and analysis were performed blinded. Mice were housed according to institutional regulations with ad libitum access to food and water. All mice used were females in the C57BL/6J background. Apolipoprotein E-deficient mice (Apoe−/−) were purchased from The Jackson Laboratory. Ly6gcre mice (ref.18) (obtained from M.G., Institute for Experimental Immunology and Imaging, University Hospital, University Duisburg-Essen) were intercrossed with Apoe−/− and Mcl1flox/flox mice (ref.18) (obtained from Y.-W. He, Department of Immunology, Duke University Medical Center) to generate triple-mutant mice. Pad4−/− mice (obtained from K.A.M., The Scripps Research Institute) were intercrossed with Apoe−/− mice to generate double-mutant mice. Apoe−/− recipient mice were lethally irradiated and reconstituted with bone marrow obtained from Apoe−/− Lyz2creCxcr4flox/flox mice or Apoe−/− mice to generate mouse chimaeras. Vulnerable atherosclerotic lesions were induced as described in ref.4. In brief, eight-week-old mice were fed a high-fat diet (HFD; 21% fat and 0.15% cholesterol) for 11 weeks. Two weeks after the initiation of the HFD, a cast was placed around the left common carotid artery. To induce neutropenia, mice received anti-Ly6G (clone 1A8) or control IgG (2A3, 50 μg, every other day, BioXcell) intraperitoneally (i.p.). Neutrophilia was induced by daily subcutaneous injection of AMD3100 (5 mg kg−1, Tocris) or PBS as control. Pharmacological inhibition of NET release was performed by daily subcutaneous administration of Cl-amidine (10 mg kg−1, Essen Scientific). To block histone H4, mice were treated with intraperitoneal injection of anti-histone H4 (20 μg per day, Biorbyt, orb225483) or control IgG (Dianova). Administration of peptide HIPe or scrambled HIPe (sHIPe) was performed by using osmotic minipumps (4 mg per kg per day, Alzet, model 2004). All treatments were performed during the last 4 weeks of the experiment to therapeutically treat pre-established atherosclerotic plaques. For the model of spontaneous atheroprogresion, Apoe−/− mice were fed a HFD for 16 weeks. For in vivo blockade of CCL7, 18–24 week-old Apoe−/− mice were injected with anti-CCL7 or isotype IgG (5 μg i.p., 3 times) over the last two days before euthanasia. To assess the effect of HIPe on neutrophil recruitment and mobilization, mice receiving either vehicle control or HIPe (100 μg, i.v.) were subjected to peritonitis by administration of TNF (100 ng, i.p., 4 h). Neutrophil counts in peritoneum lavage, bone marrow and blood were quantified by flow cytometry.
Human carotid endarterectomy specimens.
Carotid endarterectomy (CEA) specimens were obtained from the vascular surgery department of the Academic Medical Center in Amsterdam. Immediately after removal, specimens were transferred to the Department of Pathology, fixed in 10% formalin and processed for paraffin embedding. Carotid atherosclerotic plaques were collected from all carotid endarterectomy surgeries performed at the Academic Medical Center in Amsterdam between 2008 and 2010. Specimens were collected according to the Code for Proper Secondary Use of Human Tissue in the Netherlands. This means that all personal information on age, use of medication, all underlying diseases is not available, and can indeed cause a potential bias. Informed consent as well as ethical approval are not required, as this is considered ‘waste material’ and can be used for science according to the Code for Proper Secondary Use of Human Tissue in the Netherlands.
Tissue processing.
Mice were euthanized by ketamine/xylazine overdose, the blood was collected by heart puncture after which the mice were flushed with 20 ml of ice-cold PBS-EDTA (5 mM EDTA). Subsequently, the left common carotid artery was embedded in Tissue Tek O.C.T. compound (Sakura Finetek) for analysis. Aortic arches and hearts were isolated, fixed with 4% PFA and embedded in paraffin and in Tissue Tek O.C.T. compound (Sakura Finetek), respectively.
Flow cytometry.
Blood was incubated with red blood cell lysis buffer (150 mM NH4Cl, 10 mM KHCO3, 0.1 mM Na2EDTA) for 5 min at room temperature. Leukocytes were stained with antibodies to CD45 (BioLegend, clone: 30-F11), CD11b (BioLegend, clone: M1/70), Ly6G (BioLegend, clone: 1A8), Ly6C (BioLegend, clone: Hk1.4), CD115 (eBioscience, clone: AFS98), Ly6B.2 (BIORAD, clone: 7/4) in staining buffer (20 min, 4 °C). Flow cytometry was performed using the LSR Fortessa (Beckton Dickinson) and data was analysed using FlowJo software (Beckton Dickinson). Haematologic counts were determined with the ScilVet ABC Plus analyser (scil animal care company GmbH).
Histology and immunofluorescence.
Carotid (7 μm) and aortic root (4 μm) cryosections or aortic arch paraffin sections (4 μm) were histologically stained with haematoxylin and eosin (H&E) in 70, 40, or 40 μm intervals, respectively. Total collagen content was assessed by Pricrosirius Red staining in consecutive sections. For immunofluorescence staining, cryosections were fixed with cold acetone followed by antigen blockade using 5% goat serum/phosphate buffered saline. Paraffin sections underwent antigen retrieval with citrate buffer (10 mM, pH 6.0) before antigen blockade using 5% goat serum/phosphate buffered saline. Next, sections were incubated overnight at 4 °C with the following primary antibodies: rabbit anti-mouse CD68 (Abcam, 1:200), rat anti-mouse Ly6G (BD, 1:200), mouse anti-mouse smooth muscle actin (SMA)-FITC or -Cy3 conjugated (Sigma, 1:500), rabbit anti-mouse histone H4 (Abcam, 1:200), rabbit anti-mouse histone H4 Alexa 488 conjugated (Abcam, 1:200), rabbit anti-mouse citrullinated histone H3 (Abcam, 1:200), rat anti-mouse CD31-Alexa 455 conjugated (BioLegend, 1:50), rat anti-mouse VCAM-1 (R&D, 1:100), Armenian hamster anti-mouse ICAM-1 (BD Biosciences, 1:100), rabbit anti-iNOS (Abcam,1:200), rat anti-mouse CD206-Fitc conjugated (BioLegend, 1:50), rabbit anti-mouse Ki67 (Thermo Fisher, 1:100), rabbit anti-mouse smooth muscle myosin heavy chain 11 (Abcam, 1:200), rabbit antimouse CCL7 (Biorbyt, 1:100). After extensive washing, sections were incubated with secondary antibodies conjugated with Dylight 488, DyLight 550 or DyLight 650 (Thermo Fisher, 1:500). Counterstain to visualize nuclei was performed by incubating with DAPI (Molecular Probes). Cell death (TUNEL+ cells) was detected using ApopTag Red in situ Apoptosis Detection Kit (Millipore) following the manufacturer’s instructions. For staining of plasma membranes, cells were incubated with Cytopainter Phalloidin Fluor 647 (Abcam, 1:1,000) or lectin-FITC conjugated (Triticum vulgaris, Sigma-Aldrich, 1:1,000). Biotinylated fragments of histone H4 were detected using streptavidin-PE (BioLegend, 1:100). Immunofluorescence sections were imaged using a Leica TCS SP8 (Leica Microsystems) equipped with a UV laser, a freely tunable, pulsed white light laser, hybrid detectors and a 63X1.40 oil objective. Raw pictures were deconvolved with Huygens Professional (v.16.10, Scientific Volume Imaging) and maximum intensity projections of deconvolved data were generated with the Leica Application Suite X (v.3.1 Leica Microsystems). Histological sections were quantified by computer-assisted morphometric analysis using ImageJ software (National Institutes of Health).
For human samples, plaque size and necrotic core area were quantified in 4 μm paraffin sections stained with H&E. Consecutive sections were used for histological analysis of neutrophils, neutrophil extracellular traps (NETs) and smooth muscle cells (SMCs). First, antigen retrieval was performed with Laboratory Vision citrate buffer (Thermo Fisher) and sections were blocked using Laboratory Vision Ultra V-Block (Thermo Fisher). Next, sections were incubated with antibodies against CD177 (Abnova, 1:2,000), citrullinated histone H3 (1:4,000) and smooth muscle actin (1:200), followed by secondary antibodies conjugated with alkaline phosphatase (Immunologic, 1:100) or poly-horseradish peroxidase (Southern Biotech, 1:100). Staining was developed by diaminobenzidine and Vector Blue substrate (Vector Laboratories), and counter-stained with nuclear red. Images were acquired by Philips Scanner (Philips).
To analyse extranuclear histone H4, we performed staining of nuclei (DAPI) and histone H4. Original pictures were converted into binary images (nuclei and histone H4) using ImageJ software. To obtain extranuclear histone H4, the signal from the nucleus was subtracted from the signal from histone H4.
Murine and human plaque analysis.
Plaque vulnerability was assessed as described in ref.4 (Extended Data Fig. 1a–f). In brief, intima, media and necrotic core area was analysed in H&E-stained sections. To assess lesion volumes, lesion area of sections was measured every 70 μm. To calculate the lesion volume, the volume of a cylinder with a different radius was calculated as:
where h is the distance between quantified sections of a mouse and n is the number of quantified sections.
The necrotic core (NC) was defined as the area devoid of nuclei underneath a formed fibrous cap. Collagen content and fibrous cap thickness were measured on Pricosirius Red-stained sections. Fibrous cap (FC) thickness was defined as the average of length measurements in the positions overlapping with the lines of a square-shaped grid. For atherosclerotic lesions from the carotid artery but not from the brachiocephalic artery or the aortic root, averaged FC were corrected by intima size. Vulnerability Plaque Index (VPI) was calculated as VPI = (% NC area + % CD68 area) / (% SMA area + % collagen area). Mice with carotid samples showing absence of lesion formation were excluded from this analysis. To process and analyse SMA+MYH11+CD68−, SMA−MYH11+CD68− and CD68+MYH11−SMA− cells, immunofluorescence pictures for SMA, MYH11 and CD68 were segmented by thresholding to create binary images. Binary images were mathematically combined to create cell masks of identified cell populations: SMA+ MYH11+CD68−, cell mask was created by subtracting CD68 signal from SMA-MYH11 co-localized a rea; SMA−MYH11+CD68− cell mask was created by subtracting SMA and CD68 signal from MYH11 and CD68+MYH11−SMA− cell mask was created by subtracting SMA and MYH11 signal from CD68 area. NETs were identified by combination of antibodies to Ly6G and CitH3 as well as by DAPI staining. Where stated, MPO and histone H4 were used as complementary markers (see Fig. 2g, Extended Data Figs. 3h, 5d).
For human atherosclerosis, H&E stained sections were scored blinded by two independent, experienced pathologists with little inter- and intra-observer variability. Plaques were classified as early, advanced and complicated lesions regarding Virmani histopathological classification19. Next, advanced lesions were divided into regions of FC, shoulders and core using ImageJ software. Lesions with discontinuous fibrous caps were not included in this study.
Lipid measurements.
Plasma cholesterol and triglycerides were determined by CHOD-PAP kit (Roche/Hitachi) and GPO-PAP kit (Roche/Hitachi) respectively, according to the manufacturer’s instructions.
Cell culture and activation.
Mouse vascular aorta/smooth muscle cells (MOVAS) (ATCC, CRL-2797) were cultured in complete medium (DMEM, Gibco) supplemented with 10% fetal bovine serum (Gibco), 0.2 mg ml−1 G418 (Invitrogen) and 5 mM sodium pyruvate (Sigma). All cells were maintained in an incubator at 37 °C, 5% CO2. To activate MOVAS, cells were cultured in complete medium supplemented with 10 ng ml−1 recombinant murine PDGF-BB (Peprotech) for 6 h. Subsequently cells were washed to remove the stimulus and maintained with fresh complete medium for 24 h. After this time, supernatants were recollected, centrifuged (300g, 5 min, 4 °C), and frozen until use. Thioglycollate-elicited macrophages and SVEC4–10 endothelial cells (ATCC) were cultured in complete medium (DMEM, Gibco) supplemented with 10% fetal bovine serum (Gibco). All cell lines were authenticated by ATCC and tested for mycoplasma contaminations.
Multiplex ELISA of smooth muscle cell supernatants.
Growth factors, cytokines and chemokines were measured in supernatants from activated SMCs using Luminex Multiplex-assays ELISA (Thermo Fisher) according to the manufacturer’s instructions.
Neutrophil isolation.
Human blood neutrophils were isolated from human blood using Polymorphprep (Axi-Shield) following the manufacturer’s instructions. Mouse bone-marrow-derived neutrophils were isolated from tibias and femurs from C57BL/6J mice by negative selection using the Neutrophil Isolation Kit (Miltenyi) according to the manufacturer’s instructions.
NET isolation.
Human blood neutrophils (2 × 10⁶) were seeded for 30 min and stimulated with 100 nM Phorbol 12-Myristate 13-Acetate (PMA) or 10 ng ml−1 of human recombinant CCL7 (Peprotech) in HBSS (Life Technologies) supplemented with 5 mM HEPES (Gibco) for 4 h. Next, neutrophils were washed and incubated for 30 min with DMEM containing 10 U ml−1 of restriction enzyme AluI (New England BioLabs). Supernatants containing the NET fragments were collected and centrifuged (5 min, 300g) to remove remaining cell debris. Quant-iT PicoGreen dsDNA Assay Kit (Thermo Fisher) was used to measure DNA concentration according to the manufacturer’s instructions.
Cell viability assays.
SMCs were incubated with indicated amounts of isolated NETs, histone H4 (Biomol), or equimolecular amounts of histone H4 fragments (Pepscan). Endothelial cells and macrophages were incubated with 50 μg ml−1 of histone H4 (Biomol). Cell viability was measured based on PI uptake. PI+ cells were visualized using a climate chamber fluorescence microscope (Leica, DMi8) and quantified by ImageJ software. In some experiments, SMC viability was measured using Vybrant MTT cell proliferation assay (Thermo Fisher) according to the manufacturer’s instructions and measured with a plate reader (Tecan, InfiniteF200Pro). For DNase I treatment, isolated NETs were incubated with DNase I (NE Biolabs) at 10 U ml−1 for 1 h before addition to SMCs.
Live imaging of cell death was performed on SMCs stained with Calcein AM (Thermo Fisher, 1:1,000). After adding 50 μg ml−1 of histone H4 or phosphate buffer (control) to the medium, images were acquired every 30 s for 30 min using a climate chamber fluorescence microscope to measure PI and calcein signal. PI influx and calcein efflux was measured using ImageJ software. For live imaging of cell death on atherosclerotic lesions, aortas of HFD-fed Apoe−/− mice were opened longitudinally and mounted en face on a silicone gel surface. Aortas were incubated with anti-CD31 conjugated to eFluor 450 (Thermo Fisher, 1:50) in combination with Calcein AM (1:1,000) for 1 h. Samples were imaged in z stacks, in intervals of 3 min for a period of 15 min using a LeicaSP5IIMP two-photon laser scanning microscope with a pre-chirped and pulsed Ti:Sapphire Laser (Spectra Physics MaiTai Deepsee) and a 20x NA1.00 (Leica) water dipping objective. Image acquisition and processing were performed using Las software (Leica).
Inhibition of NET or histone H4 cytotoxicity.
Before the addition to SMCs, NETs (500 ng ml−1) were incubated for 1 h with 50 ng ml−1 of the following antibodies: Ctrl IgG (Santa Cruz), anti-Myeloperoxidase (Merck), anti-LL37 (Santa Cruz), anti-Neutrophil Elastase (Biorbyt), anti-Cathepsin G (Biorbyt), anti-Proteinase 3 (Santa Cruz), anti-Histone H2A (Cell Signaling Technology), anti-Histone H3 (Abcam), or anti-Histone H4 (Cell Signaling Technology). For inhibition of serine protease activity in NETs, isolated NETs were incubated with 100 nM of Myeloperoxidase Inhibitor-1 (Millipore), Elastase Inhibitor IV (Millipore) or secretory leukocyte protease (SLPI) (R&D systems) for 1 h. For Toll-like receptor inhibition, SMCs were incubated 1 h before NET incubation with 1 μg ml−1 of TLR1/2, TLR3 and TLR4 inhibitors (Tocris). For inhibition of histone H4 cytotoxicity, recombinant histone H4 was incubated with 100 μg ml−1 of peptide HIPe for 1 h before addition to SMCs.
Histone H4-membrane interaction assays.
SMCs were incubated for 5 min at 4 °C to avoid internalization with 50 μg ml−1 histone H4 or equimolar amounts of biotinylated histone H4 fragments. For inhibition with HIPe, histone H4 was pre-treated with 100 μg ml−1 HIPe for 1 h before incubating with SMCs. Next, cells were extensively washed and fixed with 2% PFA. Co-cultures of SMCs and neutrophils were stimulated by 100 nM PMA for 2 h. After washing, cells were incubated for another 2 h and then fixed by 2% PFA. Interaction between plasma membranes (lectin) and histone H4 was visualized using confocal microscopy.
ATP measurement.
SMCs were incubated with 50 μg ml−1 of recombinant histone H4 for 1 h or 500 ng ml−1 of isolated NETs for 48 h. Supernatants were centrifuged (5 min, 300g) and extracellular ATP was measured using Cell Titer Glo (Promega) and Tecan plate reader according to the manufacturer’s instructions.
Surface charge alteration and ζ-potential measurement.
SMCs were treated for 30 min with 200 μM oleylamine or 200 μM sodium cholesterol sulfate and 1 μM STX64 sulfatase inhibitor (both purchased from Sigma). For cell viability or membrane interaction assays, cells were washed and incubated with 50 μg ml−1 histone H4 for 1 h at 37 °C or 5 min at 4 °C, respectively. Cell viability or membrane interaction was measured as describe above. For ζ-potential analysis, SMCs were resuspended in 10 mM sodium chloride and 270 mM sucrose solution. Recombinant histone H4 and BSA (control) were diluted to 0.1 mg ml−1 in a 16x diluted PBS (Gibco) containing 30 mM sucrose. 100 μl of the sample was injected in the bottom of a disposable folded capillary cell (DTS1070, Malvern), which was prefilled with 600 μl 10 mM NaCl solution. The ζ potential was measured at 37 °C using Zetasizer Nano (Malvern).
Neutrophil extracellular trap analysis.
Neutrophils (1 × 10⁵) were seeded and incubated with conditioned media obtained from control- or PDGF-BB-treated SMCs, CCL2 (10 ng ml−1) or CCL7 (10 ng ml−1) for 4 h. In CCL2 and CCL7 experiments, wells were coated with human recombinant VCAM-1 (1 μg ml−1, R&D systems). After washing, neutrophils were fixed with 4% PFA and stained with antimouse citrullinated histone H3, anti-mouse Ly6G and DAPI. Immunofluorescence signal was measured with a fluorescent microscope or using a plate reader (Tecan, InfiniteF200Pro).
Avidin-biotin pull-down of plasma membrane proteins.
SMCs cells were grown in 10-cm dishes upon 80% confluence. Cells were washed three times with PBS and subsequently incubated with 50 μg ml−1 H4 (diluted in PBS) or vehicle and incubated for 5 min at 4 °C. Then cells were washed 10 times with ice-cold PBS and subsequently labelled with 250 μg ml−1 sulfo-NHS-SS-biotin (Pierce) for 30 min on ice. The biotin-labelled cells were incubated with 150 mM glycine solution for 20 min to quench unlabelled free biotin followed by an ice-cold PBS wash. Cells were lysed in PBS Triton (1%) including complete protease inhibitor mixture (Roche), and the lysates were affinity-purified using immobilized NeutrAvidin beads (Thermo Scientific) for 3 h at 4 °C. Finally, the beads were washed with PBS Triton (1%) buffer followed by the addition of SDS-PAGE sample loading buffer and analysed by SDS-PAGE and western blotting using β1-integrin (antibody generated in the laboratory of R. Fässler, cell surface), H4 and GAPDH (Thermo Fisher, cytosol) antibodies.
Scanning electron microscopy.
SMCs were incubated with 50 μg ml−1 of recombinant histone H4 or phosphate buffer for 1 h. Next, cells were washed and the samples were fixed using 4% PFA plus 2.5% glutaraldehyde in PBS (2 h, 4 °C). Cells were then dehydrated by serial 5-min incubations in increasing concentrations of ethanol (30%, 50%, 70%, 80%, 90%, 100%). Samples were dried in an automated critical point dryer (Leica EM CDP 300) and then coated with chromium in a rotary-pumped coating system (Quorum Technologies Q150RS). Imaging was performed at 15 kV with a field emission microscope (JEOL 7600F).
Neutrophil (trans-)migration.
Migration assays were performed in Zigmond chambers according to the manufacturer. In brief, Ly6G-PE (1A8, BioLegend) labelled neutrophils were seeded (30 min) on a collagen-coated coverslip and mounted on a glass slide chamber. A gradient of PDGF-BB activated SMC vs non-activated SMC supernatants was created and images were acquired over 30 min in 30 s intervals using a climate chamber fluorescence microscope (20x dry objective, Leica, DMi8). Speed and displacement were calculated as previously described20.
To analyse transmigration, neutrophils (2 × 10⁵) were added to the top compartment of HTS transwell 96 well plates (Corning) with a 3-μm pore size. In the lower compartment, supernatants obtained from non-activated or PDGF-BB-activated SMCs were added. After incubation for 1 h at 37 °C, transmigrated neutrophils were analysed from the bottom compartment by flow cytometry.
Analysis of reactive oxygen species.
Bone marrow mouse neutrophils were incubated with 0.1 μM H2-DCF-DA (Thermo Fisher) in RPMI containing penicillin/streptomycin and 1% FCS for 30 min. After washing, neutrophils were incubated with supernatants from resting or PDGF-BB-activated SMCs for 30 min. Upon oxidation, H2-DCF-DA (chemically reduced version of fluorescein), is converted into its fluorescent form thereby acting as an indicator of the amount of reactive oxygen species present. The green fluorescence intensity generated by this dye was measured using flow cytometry.
Adhesion assay.
Monolayers of SMCs were treated with vehicle or PDGF-BB (24 h, 10 ng ml−1). After washing, bone marrow mouse neutrophils stained with Ly6G-APC (1A8) and CD62L-PE (MEL-14) (BioLegend) were added. After incubating for 15 min, cells were washed and fixed with 4% PFA. The number of adhered and polarized (CD62L clustering) neutrophils was analysed by fluorescence microscopy.
Histone H4-membrane molecular dynamics simulations and blocking peptide design.
The 3D structure of the histone H4 (chain F) was extracted from the X-ray structure of the nucleosome deposited in the Protein Data Bank (PDB code: 1KX5). The histone H4-membrane complex was constructed with assistance from the membrane builder module implemented in the CHARMM-GUI website21. Histone H4 was placed around 20 Å above the membrane layer which is composed of 251 DOPC lipids (upper layer) and 50 DOPS/200D DOPC lipids (lower layer). The complex was then solvated by adding water and NaCl to 0.15 M. The water thickness was set to 35 Å from the membrane layer which covers the whole histone H4-membrane complex structure.
The CHARMM36 force field was assigned for the prepared system (solvated histone H4-membrane complex). The complex was subjected to molecular dynamics (MD) simulations by AMBER16. Similar energy minimization and MD simulation protocols as previously described22 were applied. To relax the system, 2 consecutive steps of energy minimization were used; first 2,500 steps of steepest descent followed by 2,500 steps of conjugate gradient algorithm of energy minimization. During this step the histone H4 and membrane were partially fixed by application of soft position constraint (10 and 2.5 kcal mol−1 for histone H4 and membrane, respectively). Next, a position-restrained MD phase was carried out for 400 ps by slowly reducing the force constraint applied to constraint the protein (from 10 to 5, 2.5, 0.5, and 0.1 kcal mol−1, respectively) and membrane (from 2.5 to 1, 0.5, and 0.1, respectively) atoms. The temperature of the system was continuously increased from 0 to 303.15 K and remained at this temperature by application of Langevin dynamics with a collision frequency of 1 ps−1. After this step, free MD simulations were used for 50 ns and then accelerated molecular dynamics (aMD) were carried out from 50 to 200 ns. In these steps (free MD and aMD), the same protocols were applied; temperature and pressure were set and then kept constant at 303.15 K and 1 bar, respectively. A time step was set to 2 fs with application of a SHAKE algorithm. Electrostatic interactions were calculated by use of the particle-mesh Ewald method, and non-bonded interactions were computed by setting the cut-off at 12 Å with the force-based switching at 10 Å.
The histone H4-membrane MD simulations indicated that the N-terminal tail of histone H4 is the first and major part that interacts with the membrane, therefore a blocking peptide was produced against the N-terminal tail. The peptide sequence of histone acetyltransferase that binds and interacts with the N terminus of histone H4 was taken as a starting peptide. Several peptides were designed and the complex conformation of the designed peptides and histone H4 was predicted by protein-protein docking using the HADDOCK2.2 webserver23. The derived histone H4-peptide complexes were subjected to structure optimization (energy minimization and short MD simulations) and binding free energy (BFE) calculation to predict the binding strength of the designed peptides with histone H4 by using similar protocols and parameters as in previous studies22,24. Molecular mechanics/generalized Born surface area (MM/GBSA) approach using generalized Born model 8 with default parameters was applied to compute binding free energies and only enthalpy values were used to estimate the relative BFE22. HIPe-histone H4 complex gave the lowest binding free energy, thus HIPe was chosen for synthesis. The complex between HIPe-histone H4 and membrane was subjected to MD simulation.
Peptide synthesis.
Peptides used in this study were purchased and synthesized in high purity (>95% HPLC) using solid-phase synthesis (Pepscan). The following peptide sequences were synthesized:
Histone H4, N-terminus, aa1–24: H-SGRGKGGKGLGKGGAKRHRKVLRD-OH; Histone H4, N-terminus, biotinylated, aa1–24: H-SGRGKGGKGLGKGGAK RHRKVLRDK(Biotin)-NH2; Histone H4, α-helix, aa 25–68: H-NIQGITKPAIRR LARRGGVKRISGLIYEETRGVLKVFLENVIRD-OH; Histone H4, α-helix, biotinylated, aa 25–68: H-NIQGITKPAIRRLARRGGVKRISGLIYEE TRGVLKVFLENVIRKDK(Biotin)-NH2; Histone H4, C-terminus, aa 69–102: H-AVTYTEHAKRKTVTAMDVVYALKRQGRTLYGFGG-OH; Histone H4, C-terminus, biotinylated, aa 69–102: Biotin-Ahx-AV TYTEHAKRKTVTAMDVVYALKRQGRTLYGFGG-OH; HIPe: H-CEAENEEDE DEDSPPEAENEEDEDEDSC-OH, S-S bond between Cys at the N- and C-terminus; Scrambled HIPe: H-CDDDPSANEEEEDEEEEDPNASDEEEEC-OH.
Machine learning screen of histone H4.
Full details of the training and validation of the SVM-based machine learning classifier are described in previous studies11,25,26. The classifier is used here to identify membrane-active segments of histone H4. All sub-sequences of length 10–25 amino acids are generated with Python and screened with the classifier. σ scores are tabulated for each peptide alongside other physicochemical characteristics such as net charge and mean hydrophobic moment. Top hits (σ > ~0.8) are sorted by decreasing σ values and cross-referenced with both secondary structure predictions27 and known secondary structure from crystallographic data (Uniprot ID: P62805). To generate a ‘heat map’ for segments of H4 that contain a high probability of membrane activity, all ‘hit’ sub-sequences with σ > 0 are aligned with the entire H4 sequence. A normalized net σ score is assigned to each residue, equal to the sum of all σ scores corresponding to peptide ‘hits’ in which that residue appears, divided by the number of times that amino acid appears in a ‘hit’. This ensures that residues are weighted by the magnitude of σ, which is proportional to the likelihood of membrane activity. The subsequence of amino acids that envelop the global maximum (threshold σ > 0.8) is the most likely membrane-active segment.
To isolate the membrane-active domains of histone H4, we carried out a moving window scan of 10–25 amino acids along the entire 103 amino acid length of the protein (Uniprot ID: P62805) using the membrane activity prediction tool. Out of a total of 1,368 enumerated sequences, 260 were found to have very high σ scores (σ > 1), and the majority were localized towards the N terminus of H4. Since histone H4 contains several helical domains, we correlated the machine learning results with the known secondary structure of H4. We created a visual heat map to locate the most probable membrane-active domains of H4 based on sequence alignments of sub-sequences and aggregate normalized σ scores. Notably, the top consensus sequence contains the first 24 amino acids of H4 and forms a partial helix with a charge of +8.03 and a hydrophobic moment of 0.247 (SGRGKGGKGLGKGGAKRHRKVLRD, σ = 1.266) (Extended Data Fig. 8b).
Small -angle X-ray scattering.
Small unilamellar vesicles (SUVs) were prepared as previously described28. In brief, lyophilized DOPS (sodium salt), DOPE and cholesterol were purchased from Avanti Polar Lipids. Lipids were dissolved in chloroform to 20 mg ml−1 stock solutions. The following lipid compositions were made: DOPS/DOPE/cholesterol = 20/80/0, 20/75/5, 20/70/10 and 20/60/20. Chloroform was evaporated under nitrogen gas and the lipids were further dried overnight under vacuum. Dried lipids were resuspended in 140 mM NaCl + 10 mM HEPES at pH 7.4 to a final concentration of 20 mg ml−1. Aqueous lipid solutions were incubated overnight at 37 °C. SUVs were prepared by sonication of resuspended lipids until clear (3 × 10 min). Monodispersity in size was obtained via extrusion through a 0.2 μm filter. The size of the SUVs used in the SAXS experiments is about 200 nm in diameter with a bilayer thickness of around 4 nm, consistent with known studies of lipid bilayers and previous studies of SUVs with dynamic light scattering. The SUVs were stored at 4 °C until use.
Before use, peptides were solubilized in nuclease-free water, mixed together with SUVs in fixed peptide-to-lipid charge ratios and equilibrated at room temperature overnight. Precipitated peptide-lipid complexes were loaded into 1.5 mm glass quartz capillaries and hermetically sealed with an oxygen torch. SAXS experiments were conducted at the Stanford Synchrotron Radiation Lightsource (BL 4–2) with monochromatic X-rays of energy 9 keV. Samples were incubated at 37 °C and centrifuged before measurement. Scattered radiation was collected using a Rayonix-MX225-HE detector (pixel size 73.2 μm). The 2D powder diffraction patterns were azimuthally integrated into 1D patterns using the Nika 1.76 package29 for Igor Pro 7.04 (Wavemetrics) and FIT2D30. For all samples, multiple measurements were taken at different times to ensure consistency.
To determine the phases present in each sample, the integrated scattering intensity I(q) vs. q was plotted using Mathematica. The q-measurements corresponding to peak positions were obtained and their ratios were compared to the permitted reflections for different liquid-crystalline lipid phases (for example, lamellar, hexagonal, cubic). Lamellar phases index to integer ratios of 1:2:3 and hexagonal phases index to ratios of √1:√3:√4:√7:√9. Cubic phases observed in our experiments belonged to the Pn3m space group, which permits reflections at ratios of √2:√3:√4:√6:√8:√9. Measured q positions for the Bragg peak reflections were fitted to the equation qmeasured = 2π√(h2+k2+l2)/a, where hkl are the Miller indices and a is the lattice parameter. The curvature-generating ability of the peptides were determined by calculating the lattice parameter a for the measured cubic phases. The quantity of induced NGC was calculated as the average NGC per unit cell volume using the equation 〈K〉 = 2πχ/A0a2, where χ is the Euler characteristic and A0 is the surface area per cubic unit cell for each phase. Parameter values are χ = −2 and A0 = 1.919 for Pn3m cubic phases.
Atomic force microscopy.
EggPC (Avanti Polar Lipids) was purchased as a solution in chloroform (25 mg ml−1). Cholesterol (Avanti Polar Lipids) was purchased as a lyophilized powder of 500 mg. A stock solution was prepared by adding 1 ml of chloroform to 25 mg of cholesterol. All stock solutions were stored at −20 °C.
The lipid bilayers were prepared by fusion of lipid vesicles. SUVs (diameter ≤ 100 nm) containing various compositions of lipids were obtained by the extrusion method. Lipid solutions were prepared in glass tubes using 40 μl of each lipid: EggPC:Cholesterol (80%:20%) (w/w). Chloroform was evaporated under a gas stream and lipids were dried overnight using a vacuum pump. Suspensions of multilamellar vesicles (1 mg ml−1) were obtained by resuspending the lipids in 1 ml in 20 mM CaCl2, 20 mM NaCl, 20 mM HEPES. Buffers were filtered through 0.22-μm Millipore membranes. The suspensions were vigorously stirred for 3 min. Four freeze-thaw cycles were performed to enhance the engulfment of the buffer inside the vesicles. Afterwards, the suspensions were brought to room temperature, stirred, then extruded using LiposoFast-Basic and LiposoFast-Stabilizer (Avestin) through Nucleopore filters (polycarbonate membranes). The two filter supports and the polycarbonate membranes were soaked in the resuspension buffer whereas the two syringes were carefully washed using the buffer. Each lipid suspension was extruded 5 times using the 200 nm filter and 19 times using the 100 nm filter. The SUVs were characterized by dynamic light scattering (DynaPro NanoStar, Wyatt Technology).
The excess of unbound vesicles was removed by exchanging the solution covering the mica with the deposition buffer (3 times) not containing CaCl2 using a volume of 20 μl. Histone H4 (1 mg ml−1) was diluted in the deposition buffer and deposited onto the mica surface for 15 min except stated otherwise. Loosely bound proteins were gently washed off 3 times by removing 15 μl of the solution and replacing it by the same volume of buffer.
AFM measurements were performed at room temperature in buffer using the peak force-tapping mode with a Multimode 8 and a Nanoscope V controller (Bruker). We used SCAN ASYST-Fluid cantilevers (triangular silicon nitride, f0 = 150 kHz, k = 0.7 N m−1 and a 20 nm tip radius, Bruker probes). The imaging parameter was: loading force ranged from 250 to 700 pN, scanning rate of 1 Hz, 512 pixels per line and 512 lines. Each membrane used in our studies was imaged before the addition of any protein to ensure integrity of the membranes.
All images were processed using Gwyddion 2.45 software31. When needed, stripe noise was removed with DeStripe32. Data were levelled by a mean-plane subtraction, rows were aligned using various methods and for some images few horizontal scares were corrected. The roughness average (arithmetical mean deviation) of the surfaces within the definition area (Ra) was calculated using the Statistical Quantities tool of Gwyddion. This value is calculated as the standard deviation of all pixel values from the mean pixel value .
Cell membrane imaging using scanning ion conductance microscopy.
To generate topographic images of the live smooth muscle cell membrane we used scanning ion conductance microscopy (SICM) as previously described33,34. SICM is a non-optical method using an electrolyte-filled glass nanopipette as a scanning probe fixed on a three-axis piezo-actuator stage mounted on the Nikon Eclipse Ti inverted fluorescence microscope. The piezo stage is driven by a high-voltage amplifier connected to ICnano scanner controller (Ionscope Ltd). The current in pipette electrode was monitored by Patch clamp EPC 10 (HEKA). Scanning was done with resolution equal to the inner diameter of the pipette which is approximately 50–70 nm. The nanopipettes were made from 1.00 mm outer diameter, 0.58 mm inner diameter borosilicate glass capillaries with inner filament on a laser-based puller P-2000 (both from Sutter Instrument Co.). The measured nanopipette resistance was approximately 100 MΩ. The data acquisition and analysis software are produced by Ionscope. In all experiments, nanopipettes and the bath solution contained the same buffer (144 mM NaCl, 5.4 mM KCl, 1 mM MgCl2, 1 mM CaCl2 and 10 mM HEPES, pH = 7.3). All experiments were performed at room temperature.
Statistics.
Statistical analysis was performed using GraphPad Prism 7 software (GraphPad Software). The ROUT outlier function was used to exclude statistical outliers (Q = 1%). Normal distribution of the data was assessed using the D’Agostino-Pearson omnibus test for normality. Normally distributed data was tested by two-tailed unpaired t-test (one variable) or one-way ANOVA with Tukey or Dunnet’s correction (>2 variables). When 2 factors were analysed, data was analysed using two-way ANOVA with Tukey’s correction. For data that was not normally distributed, the Mann-Whitney test (one variable) or Kruskal-Wallis test with Dunn’s correction (>2 variables) was used. In all tests a 95% confidence interval was used, for which P < 0.05 was considered a significant difference. All experiments were replicated at least twice independently. All data are represented as mean ± s.d. Violin Plots were generated by using R.
Reporting summary.
Further information on research design is available in the Nature Research Reporting Summary linked to this article.
Data availability
The data that support the findings of this study are available from the corresponding authors upon reasonable request.
Extended Data
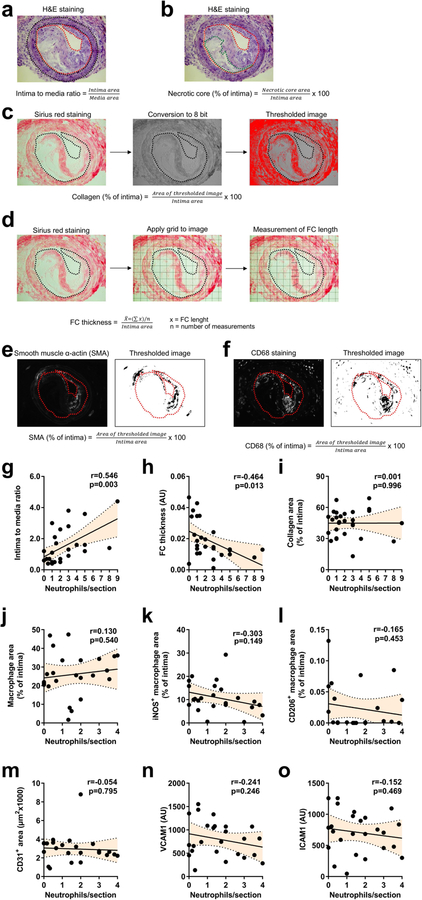
Extended Data Fig. 1 |. Lesional neutrophils do not correlate with macrophage or endothelial phenotype.
a–f, Methodology used to analyse advanced atherosclerotic lesions. a, b, Representative pictures of H&E staining. a, Intima to media ratio was calculated as the quotient of intima area and media area. Red and black dotted lines delineate intima and media, respectively. b, Necrotic core area was quantified as the percentage of necrotic core area over the intima area. Red and green dotted lines delineate intima and necrotic core, respectively. c, d, Representative pictures of Sirius red staining. c, Sirius red pictures were converted into 8-bit images and segmented by thresholding hence generating binary images. Collagen area was quantified as the percentage of collagen area over the intima area. The black dotted line delineates the intima. d, Fibrous cap thickness was analysed as the average of lengths measurements in the positions overlapping with the lines of a square-shaped grid. Averaged fibrous cap thickness was corrected by the intima area. e, f, Representative pictures of smooth muscle cell actin (SMA, e) and CD68 (f) staining. Immunofluorescence images were segmented by thresholding to convert fluorescence signal into a binary image. SMA/CD68 area was quantified as the percentage of SMA/CD68 area over the intima area. The red dotted line delineates the intima. g–o, Advanced atherosclerotic lesions were generated in the carotid artery of Apoe−/− mice. Pearson correlation between lesional neutrophils and lesion size (n = 28 mice, g), fibrous cap thickness (n = 28 mice, h), collagen area (n = 28 mice, i), macrophage area (CD68+, n = 24 mice, j), pro-inflammatory macrophages (CD68+iNOS+, n = 24 mice, k), anti-inflammatory macrophages (CD68+CD206+, n = 23 mice, l), endothelial cell area (CD31+, n = 25 mice, m), VCAM1 expression on endothelial cells (n = 25 mice, n) and ICAM1 expression on endothelial cells (n = 25 mice, o). Dotted line represents 95% confidence interval. Note that data in g–i and j–o were generated in a different set of lesions due to a shortage of sections from mice displayed in g–i.
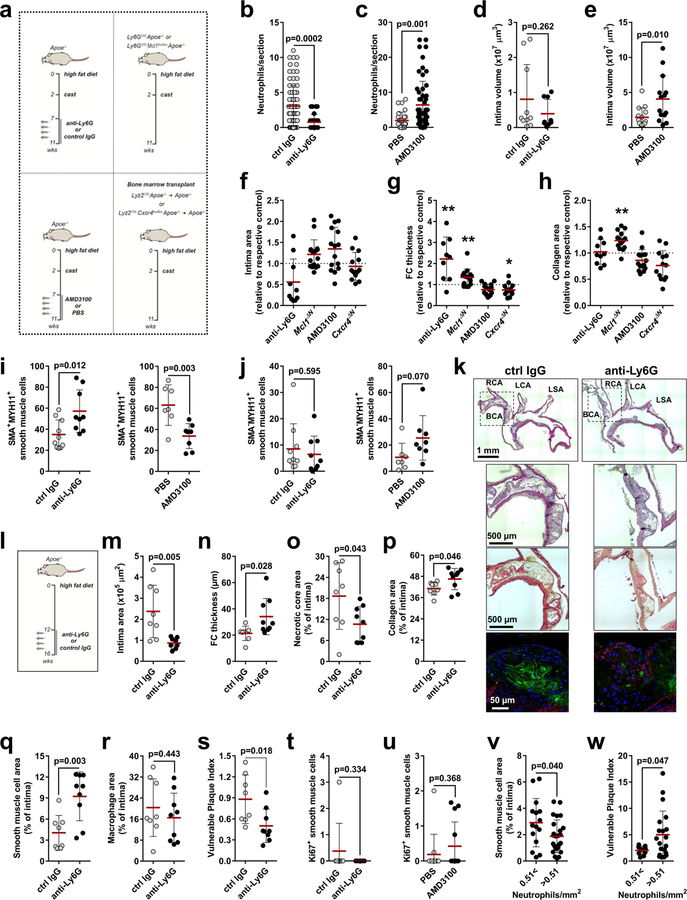
Extended Data Fig. 2 |. Modulation of lesional neutrophil counts alters lesion stability.
a, Models of neutropenia and neutrophilia. b, c, Quantification of lesional neutrophils in indicated treatments. n = 79 sections (ctrl IgG), n = 25 sections (anti-Ly6G), n = 27 sections (PBS), n = 58 sections (AMD3100). Two-sided unpaired t-test. d, e, Lesion volumes of mice with induced neutropenia (d) or induced neutrophilia (e). n = 10 mice (ctrl IgG), n = 9 mice (anti-Ly6G), n = 15 mice (PBS), n = 14 mice (AMD3100). Two-sided unpaired t-test. f–h, Lesion characteristics of mice with antibody-induced neutropenia (anti-Ly6G, n = 10 mice, except in (g) n = 9 mice), genetic neutropenia (Ly6gcreMcl1flox/flox, Mcl1ΔN, n = 16 mice), induced neutrophilia (AMD3100, n = 15 mice) and genetic neutrophilia (Lyz2creCxcr4flox/flox, Cxcr4ΔN, n = 13 mice) compared with respective controls (isotype IgG (n = 10 mice), Ly6gcre (n = 18 mice), vehicle (n = 15 mice) or Lyz2cre (n = 11 mice)), (dashed line). Two-sided unpaired t-test; *P < 0.05; **P < 0.01. Displayed is the quantification of lesion size (f), fibrous cap (FC) thickness (g) and collagen area (h). i, j, Analysis of SMA+MYH11+ (i) and SMA−MYH11+ (j) SMCs in indicated treatments. n = 10 mice (ctrl IgG), n = 9 mice (anti-Ly6G), n = 7 mice (PBS), n = 8 mice (AMD3100). Two-sided unpaired t-test. k–s, Antibody-induced neutropenia generates atherosclerotic lesions with reduced signs of vulnerability in the brachiocephalic artery in Apoe−/−mice fed a HFD for 16 weeks. k, Representative micrographs showing the aortic arch of isotype IgG (ctrl-IgG) and anti-Ly6G-treated mice stained with H&E (top), Sirius red (middle) and antibodies (bottom) to SMA (red), CD68 (green). l, Experimental scheme. m–s, Analyses of lesion characteristics. Displayed are quantification of intima area (m), fibrous cap (FC) thickness (n), necrotic core area (o), collagen area (p), SMC area (SMA+, q), macrophage area (CD68+, r), and plaque vulnerability (s). n = 8 mice (ctrl IgG), n = 9 mice (anti-Ly6G) except for panel (m) n = 8 mice. Two-sided unpaired t-test. t, u, Proliferating SMCs (Ki67+SMA+) in lesions of indicated treatments. n = 8 mice (ctrl IgG), n = 8 mice (anti-Ly6G), n = 12 mice (PBS), n = 13 mice (AMD3100). Two-sided unpaired t-test. v, w, Percentage of SMC area (SMA+, n = 15 sections for 0.51<, n = 25 sections for >0.51, v) and overall vulnerability (n = 10 sections for 0.51<, n = 20 sections >0.51, w) of human atherosclerotic specimens grouped by the number of lesional neutrophils per mm2. Two-sided unpaired t-test. Data are mean ± s.d. BCA, brachiocephalic artery; ctrl, control; SMA, smooth muscle actin; LCA, left carotid artery; LSA, left subclavian artery; MYH11, Myosin heavy chain 11; RCA, right carotid artery.
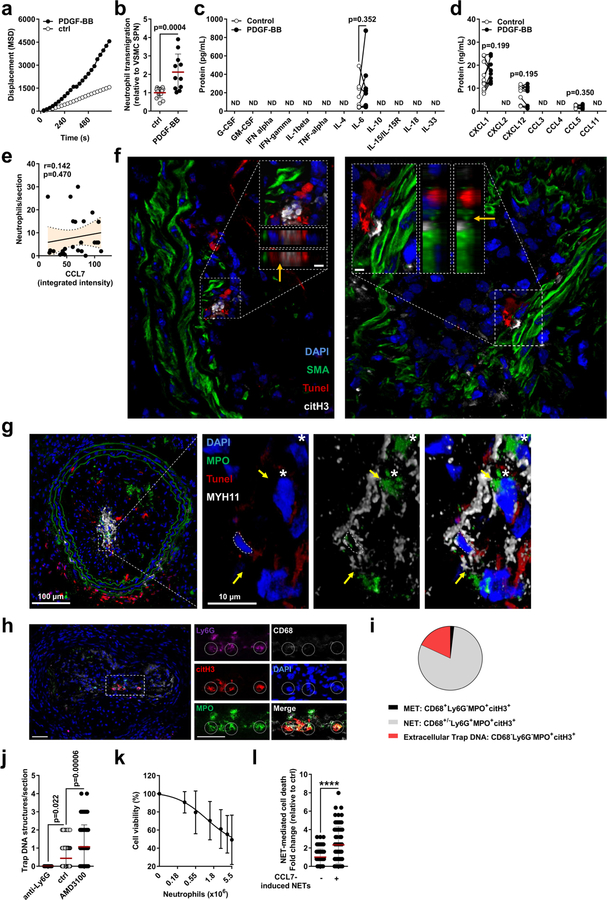
Extended Data Fig. 3 |. Activated SMCs induce neutrophil chemotaxis and induce NET-mediated SMC death.
a, Neutrophil displacement in gradient of supernatant obtained from PDGF-BB-activated or resting SMCs (ctrl). n = 20 neutrophils (ctrl), n = 18 neutrophils (PDGF-BB). Two-way ANOVA. P = 1 × 10⁻¹⁵ (ctrl vs PDGF-BB). MSD, mean square displacement. b, Neutrophils transmigrated towards supernatants obtained from PDGF-BB-activated or resting SMCs (ctrl). n = 14 replicates (ctrl), n = 11 replicates (PDGF-BB). Two-sided unpaired t-test. c, d, Multiplex ELISA of indicated growth factors and cytokines (c) and chemokines (d) in cell-free supernatants from SMCs treated with PDGF-BB or vehicle. n = 9 replicates (IL-6, CXCL12), n = 10 replicates (CXCL1, CCL5). Two-sided paired t-test. e, Pearson correlation between neutrophils and intimal CCL7 in mouse advanced atherosclerotic lesions, n = 28 sections. Dotted line represents 95% confidence interval. f, Representative micrographs of mouse atherosclerotic lesions showing SMCs (SMA, green), nuclei (blue), dead cells (TUNEL, red), and NETs (citrullinated histone H3, white). Dashed lines indicate cross-section views. Scale bar, 20 μm. Close-ups represent xz (left) and yz (right) cross-sections. Scale bar, 4 μm. Orange arrows indicate points of interactions between dead SMCs and NETs. g, Micrographs of mouse atherosclerotic lesions showing SMCs (MYH11, white), nuclei (blue), dead cells (TUNEL, red), and MPO (green). Yellow arrows indicate points of interactions between dead SMCs and NETs. Asterisks indicate intact MPO+ cells. h–j, Advanced atherosclerotic lesions in the carotid artery were stained with antibodies to Ly6G, CD68, myeloperoxidase (MPO), and citrullinated H3 (citH3) and counterstained with DAPI. h, Representative images. Scale bar, 50 μm. i, Pie chart showing distribution of macrophage extracellular traps (METs, 1.86%), NETs (80.05%), and extracellular trap DNA (18.09%) based on marker analysis defined underneath, n = 35 sections from 8 mice. j, Extracellular trap DNA structures in carotid artery sections from neutropenic mice (anti-Ly6G, n = 13 sections), mice with intact white blood cell count (vehicle treated, n = 96 sections), or neutrophilic mice (AMD3100, n = 57 sections). Two-sided unpaired t-test. k, Percentage of viable SMCs after exposure to PMA-induced NETs isolated from indicated number of neutrophils. n = 16 biological samples (0, 2.75 × 10⁶ neutrophils), n = 13 biological samples (0.275106, 0.55 × 10⁶, 1.375 × 10⁶, 4.125 × 10⁶ neutrophils), n = 11 biological samples (5.5 × 10⁶ neutrophils). l, Cell death of SMCs incubated with NETs isolated from neutrophils treated with recombinant CCL7. n = 67 fields (−), n = 72 fields (+). Two-sided unpaired t-test, ****P = 0.000002. Data are mean ± s.d. MPO, myeloperoxidase; ND, not detected.
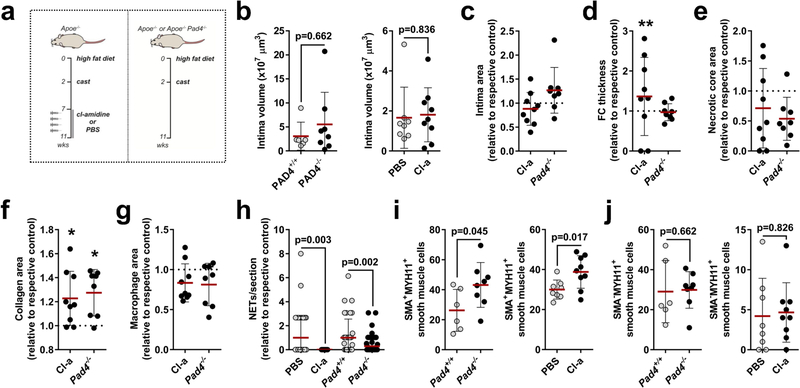
Extended Data Fig. 4 |. Pharmacological and genetic inhibition of NET release reduces traits of atherosclerotic plaque vulnerability.
a, Experimental scheme. b–g, Quantification of lesion characteristics. Displayed are lesion volumes (b), lesion size (c), fibrous cap (FC) thickness (d), necrotic core area (e), collagen area (f) and macrophage area (CD68+, g). Cl-amidine-treated (Cl-a, n = 9 mice) and Apoe−/−Pad4−/− (Pad4−/−, n = 8 mice) are compared to respective controls (PBS, n = 8 mice), Apoe−/− (Pad4+/+, n = 6 mice). Two-sided unpaired t-tests (PBS vs Cl-a) or two-sided Mann-Whitney tests (Pad4+/+ vs Pad4−/−) were used. h, Quantification of NETs per section of indicated mice. n = 40 sections (PBS), n = 31 sections (Cl-a), n = 35 sections (Apoe−/−), n = 68 sections (Apoe−/−Pad4−/−). Two-sided unpaired t-test. i, j, Analysis of SMA+MYH11+ (i) and SMA−MYH11+(j) SMCs in indicated mice. Two-sided unpaired t-test (PBS vs Cl-a) or two-sided Mann-Whitney test (Pad4+/+ vs Pad4−/−) were used. PBS (n = 8 mice), Cl-amidine (Cl-a, n = 9 mice), Apoe−/− (Pad4+/+, n = 6 mice), Apoe−/−Pad4−/− (Pad4−/−, n = 8 mice). *P < 0.05; **P < 0.01. Data are mean ± s.d.
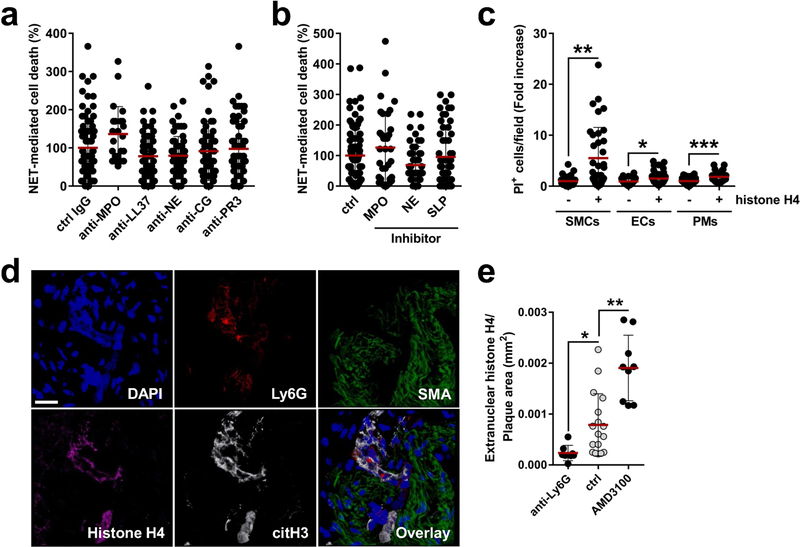
Extended Data Fig. 5 |. NET-derived histone H4 induces cell toxicity.
a–c, Analysis of cell death (propidium iodide uptake). a, NETs were pre-incubated with indicated antibodies for 1 h before addition to SMCs. MPO, myeloperoxidase; NE, neutrophil elastase; CG, cathepsin G; PR3, proteinase 3. n = 79 IgG, n = 23 MPO, n = 60 LL37, n = 60 NE, n = 58 CG and n = 60 PR3 fields. One-way ANOVA with Dunnet’s correction. P = 0.105 (MPO), P = 0.219 (LL37), P = 0.270 (NE), P = 0.925 (CG), P = 0.999 (PR3). All conditions were compared against control (ctrl). b, NETs were pre-incubated with inhibitors to myeloperoxidase (MPO), neutrophil elastase (NE), or secretory leukocyte protease (SLP) for 1 h before their addition to SMCs. n = 96 ctrl, n = 35 MPO, n = 58 NE, n = 58 SLP fields. One-way ANOVA with Dunnet’s correction. P = 0.299 (MPO), P = 0.085 (NE), P = 0.978 (SLP). All conditions were compared against control (ctrl). c, SMCs, endothelial cells (ECs) and peritoneal macrophages (PMs) were incubated with recombinant histone H4. Cell death was assessed by PI uptake. n = 36 and n = 36 for SMCs, n = 35 and n = 36 for ECs, n = 47 and n = 39 for PMs. Two-sided unpaired t-test, *P = 0.029; **P = 3.847 × 10⁻⁵; ***P = 8.775 × 10⁻⁶. d, Representative confocal immunofluorescence of advanced atherosclerotic lesions to visualize DNA (DAPI, blue), neutrophils (Ly6G, red), SMCs (SMA, green), histone H4 (magenta), and citrullinated histone H3 (white). Scale bar, 20 μm. e, Quantification of extranuclear histone H4 per section of indicated treatments. n = 17 ctrl, n = 8 anti-Ly6G, n = 9 AMD3100. One-way ANOVA with Dunnet’s correction, *P = 0.02; **P = 0.0002. Data are mean ± s.d. ctrl, control; SMA, smooth muscle actin.
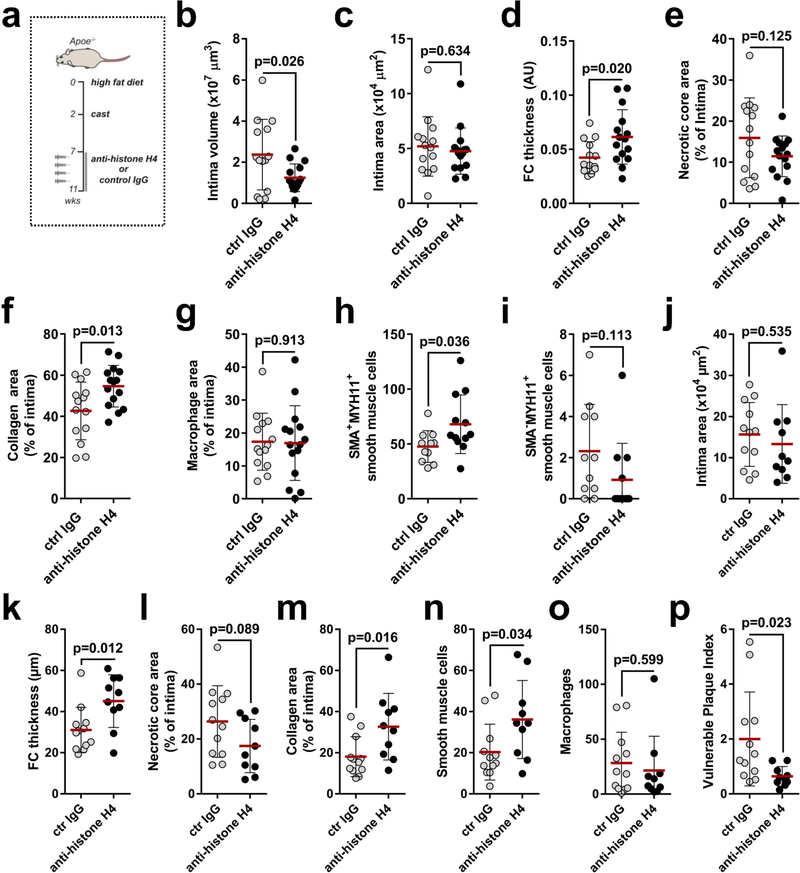
Extended Data Fig. 6 |. Neutralization of histone H4 stabilizes atherosclerotic lesions.
a, Experimental scheme. b–i, Quantification of lesion characteristics of the carotid artery. Displayed are lesion volume (b), lesion size (c), fibrous cap (FC) thickness (d), necrotic core area (e), collagen area (f), macrophage area (CD68+, g), SMA+MYH11+ cells (h) and SMA−MYH11+ cells (i). n = 14 mice (ctrl IgG) except for (h, i) n = 11 mice; n = 15 mice (anti-histone H4) except for (h, i) n = 12 mice. Two-sided unpaired t-test. j–p, Quantification of lesion characteristics on the brachiocephalic artery. Displayed are lesion size (j), fibrous cap (FC) thickness (k), necrotic core area (l), collagen area (m), SMCs (SMA+, n), macrophages (CD68+, o) and overall vulnerability (p). Two-sided unpaired t-test, n = 12 mice (ctrl IgG) or 10 mice (anti-histone H4). Data are mean ± s.d.
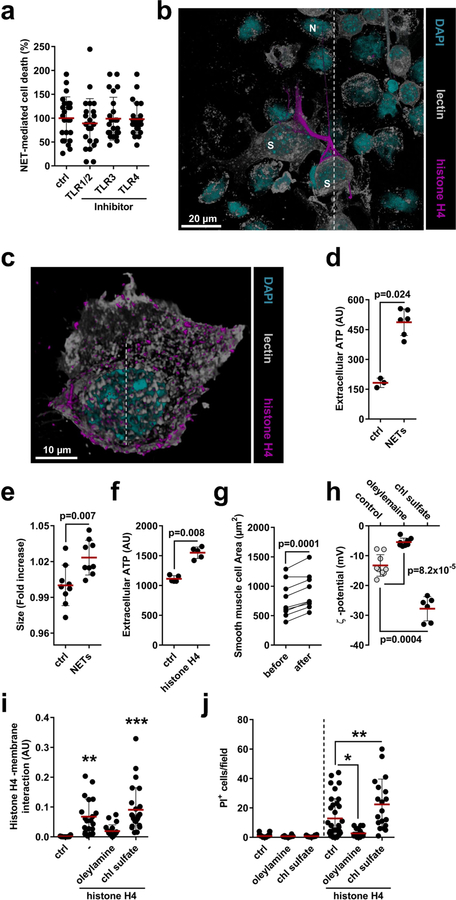
Extended Data Fig. 7 |. NET-derived histone H4 interaction with cell membranes is surface charge dependent and induces a lytic cell death.
a, SMCs were pre-incubated with indicated inhibitors before NET treatment. Cell death was assessed by PI uptake. n = 24 fields, except TLR4, n = 23 fields. One-way ANOVA with Dunnet’s correction, P = 0.729 (TLR1/2), P = 0.999 (TLR3), P = 0.995 (TLR4). All conditions were compared against control (ctrl). b, Representative high-resolution confocal microscopy images were used to visualize cell membrane (lectin, white), histone H4 (magenta) and DNA (DAPI, cyan) in a SMC (S) and neutrophil (N) co-culture. Dashed lines indicate cross-section views represented in Fig. 3j. c, Confocal immunofluorescence micrograph to visualize cell membrane (lectin, white), histone H4 (magenta) and DNA (DAPI, cyan). The dashed line indicates the cross-section view represented in Fig. 3k. d, e, SMCs were incubated with NETs. d, Extracellular ATP. n = 3 biological replicates (crtl), n = 6 biological replicates (NETs). Twosided Mann-Whitney test. e, Flow cytometry analysis of cell size. n = 9 biological replicates. Two-sided unpaired t-test. f, g, SMCs were incubated with histone H4. f, Extracellular ATP. n = 5 biological replicates. Two-sided Mann-Whitney test. g, Time-lapse microscopy images were used to measure SMC area before and after incubation with histone H4. n = 9 cells. Two-sided paired t-test. h, Analysis of the ζ potential of SMCs incubated with oleylamine or cholesterol sulfate (chl sulfate). n = 9 biological replicates (ctrl), n = 8 biological replicates (oleylamine), n = 6 biological replicates (chl sulfate). Two-sided Mann-Whitney test. i, j, SMCs were incubated with recombinant histone H4 after preincubation with oleylamine or cholesterol sulfate (chl sulfate). i, Confocal microscopy was used to detect histone H4 and plasma cell membrane (phalloidin). Peptide-membrane interaction quantified as the ratio of histone H4-fragment signal and plasma membrane area. n = 10 cells (ctrl), n = 20 cells (histone H4, –), n = 20 cells (oleylamine), n = 25 cells (chl sulfate). One-way ANOVA with Dunnet’s correction. **P = 0.007; ***P = 0.0001 vs ctrl. j, Quantification of PI incorporation. n = 54 fields, n = 8 fields, n = 10 fields, n = 34 fields, n = 21 fields and n = 19 fields for each condition represented. One-way ANOVA with Tukey’s correction, *P = 0.001; **P = 0.004. Data are mean ± s.d.
Extended Data Fig. 8 |. Membrane pore-forming activity of histone H4.
a, Scanning electron micrographs of SMCs incubated with recombinant histone H4 or vehicle. b, Machine learning screen of full-length sequence histone H4 predicts potent membrane activity at the N terminus (residues 1–24 highlighted in blue). c, SAXS data demonstrates that N-terminal domain of histone H4 induces negative Gaussian curvature (NGC) in cell membranes at the indicated peptide:lipid (P/L) ratios. The histone H4 N terminus was incubated with indicated membrane compositions and the resulting structures were measured with SAXS. The peptide induced Pn3m cubic phases, which are rich in NGC, and are indicative of membrane permeation. d, SMCs were incubated with biotinylated histone H4 fragments (1–24: N terminus; 25–68: α-helix; 69–102: C terminus). Confocal microscopy was used to detect histone H4 fragments and plasma cell membrane. Peptide-membrane interaction was quantified as the ratio of histone H4 fragment signal and plasma membrane area. n = 44 cells (1–24), n = 28 cells (25–68), n = 33 cells (69–102). One-way ANOVA with Tukey’s correction; *P = 0.049; **P = 4 × 10⁻¹⁴. e, PI incorporation in SMCs treated with histone H4 fragments or the full-length protein. n = 19 fields (ctrl), n = 24 fields (histone H4), n = 24 fields (1–24), n = 21 fields (25–68), n = 19 fields (69–102). One-way ANOVA with Dunnet’s correction; *P = 0.005; **P = 0.0001 vs control. f, Histone H4 was preincubated with HIPe or vehicle and added to SMCs. Confocal microscopy was used to visualize interaction of histone H4 (green) with plasma cell membrane (phalloidin, red). n = 20 cells (ctrl), n = 17 cells (histone H4), n = 15 cells (histone H4+HIPe). One-way ANOVA with Tukey’s correction; *P = 9.243 × 10⁻⁷; **P = 6.239 × 10⁻⁹. Scale bar, 20 μm. g, Atomic force microscopy studies of lipid membranes treated with the indicated histone H4:HIPe ratio. Scale bar, 1 μm. Membrane disruption was quantified as membrane roughness. n = 13 membranes (ctrl), n = 3 membranes (1:0), n = 3 (1:1). Kruskal-Wallis test with Dunn’s correction. h, Live scanning ion conductance microscopy of SMCs. Images represent the plasma membrane before and after incubation with histone H4 and HIPe. i, PI incorporation in SMCs treated with recombinant histone H4 in the presence or absence of HIPe. n = 33 fields (ctrl), n = 12 fields (histone H4), n = 11 fields (histone H4 + HIPe). One-way ANOVA with Tukey’s correction; *P = 0.001; **P = 8.844 × 10⁻⁶. Data are mean ± s.d.
Extended Data Fig. 9 |. Disruption of histone H4-cell membrane interaction prevents pore formation and stabilizes atherosclerotic lesions.
a, Experimental scheme. b–i, Lesion characteristics in the carotid artery. Displayed are lesion volume (b), lesion size (c), fibrous cap (FC) thickness (d), necrotic core area (e), collagen area (f), macrophage area (CD68+, g), SMA+MYH11+ (h) and SMA−MYH11+ (i) SMCs. n = 12 mice (vehicle), n = 11 mice (HIPe) except for (h) n = 9 mice and (i) n = 10 mice. Two-sided unpaired t-test. j, Experimental scheme. k–q, Assessment of lesion characteristics. Displayed is quantification lesion size (k), fibrous cap (FC) thickness (l), necrotic core area (m), collagen area (n), SMC area (SMA+, o), macrophage area (p) and overall vulnerability (q). n = 4 mice (vehicle), n = 4 mice (sHIPe). Two-sided Mann-Whitney test. r–x, Assessment of lesion characteristics in the brachiocephalic artery of mice treated as described in a. Displayed is quantification lesion size (r), fibrous cap (FC) thickness (s), necrotic core area (t), collagen area (u), SMCs (SMA+, v), macrophages (CD68+, w) and overall vulnerability (x). n = 11 mice (vehicle), n = 11 mice (HIPe), except for (s) Vehicle n = 10. Two-sided unpaired t-test, y, Number of lesional neutrophils per section of vehicle- (n = 82 cells) or HIPe- (n = 83 cells) treated mice. Two-sided unpaired t-test. z, Mice were treated with TNF and received either vehicle control or HIPe. Neutrophils were quantified in the peritoneum (left, n = 4 (vehicle), n = 5 (HIPe)), the bone marrow (middle, n = 5 (vehicle), n = 5 (HIPe)), and the blood (right, n = 5 (vehicle), n = 5 (HIPe)). aa, Scheme summarizing the cytotoxic activity of neutrophils during atherosclerotic plaque vulnerability. The interaction of lesional SMCs with neutrophils induces NETosis (1) which acts as a carrier of cytotoxic histone H4 (2). The cationicity of the N-terminal domain of histone H4 induces plasma membrane bending and pore formation leading to SMC lysis (3). SMC death contributes to fibrous cap thinning and increased plaque instability. Data are mean ± s.d.
Extended Data Table 1 |.
Neutrophil counts, weight and lipid levels in mouse experiments
| Neutrophils (x106) | Weight (g) | Cholesterol (mg/dL) | Triglycerides (mg/dL) | |
|---|---|---|---|---|
| ctrl lgG (n=7–10) | 0,34±0.14 | 22.45±0.73 | 1856.68±372.52 | 163.27±51.95 |
| Anti-Ly6G (n=7–10) | 0.18±0.08 | 22.64±0.96 | 1593.50±403.13 | 149.49±28.73 |
| p-value | 0.038 | 0.716 | 0.167 | 0.494 |
| Ly6GCRE (n=10) | 0.71±0.35 | 26.40±1.80 | 1019.20±244.60 | 142.90±73.30 |
| Ly6GCREMcl1flox/flox (n=8) | 0.12±0.05 | 23.50±1.70 | 587.80±187.70 | 187.70±79.30 |
| p-value | 0.0002 | 0.003 | 0.0008 | 0.233 |
| PBS (n=15) | 0.73±0.32 | 24.44±2.53 | 1323.28±488.85 | 400.12±134.55 |
| AMD3100 (n=15) | 1.56±0.58 | 24.56±2.46 | 1338.96±460.15 | 397.30±81.62 |
| p-value | 0.00007 | 0.895 | 0.931 | 0.947 |
| Lyz2CRE (n=11) | 0.609±0.29 | 25.10±1.80 | 986.50±107.00 | 107.20±39.80 |
| Lyz2CRECxcr4flox/flox (n=13) | 2.250±0.97 | 26.50±1.10 | 1006.20±245.40 | 111.80±26.70 |
| p-value | 0.00002 | 0.031 | 0.808 | 0.741 |
| PBS (n=8) | 1.03±0.21 | 23.75±0.67 | 2326±220.20 | 302.40±19.24 |
| CI-amidine (n=9) | 1.19±0.28 | 23.33±0.78 | 2575±135.20 | 241.30±24.38 |
| p-value | 0.199 | 0.696 | 0.338 | 0.072 |
| Pad4+/+ (n=6) | 0.67±0.22 | 28.33±3.39 | 1357.68±267.15 | 148.78±63.26 |
| Pad4−/− (n=8) | 0.72±0.22 | 25.50±1.60 | 1583.12±287.77 | 134.11±37.51 |
| p-value | 0.852 | 0.094 | 0.215 | 0.922 |
| ctrl lgG (n=14) | 0.64±0.17 | 25.00±2.32 | 1064.44±357.92 | 144.76±57.79 |
| anti-histone H4 (n=15) | 0.69±0.27 | 25.27±1.33 | 981.43±260.28 | 144.00±41.94 |
| p-value | 0.519 | 0.781 | 0.479 | 0.968 |
| Vehicle (n=12) | 0.60±0.36 | 26.17±2.13 | 1204.84±433.08 | 175.05±103.30 |
| HIPe (n=11) | 0.41±0.23 | 28.00±1.18 | 1313.49±260.41 | 120.24±36.22 |
| p-value | 0.166 | 0.020 | 0.479 | 0.111 |
Hypercholesterolemic mice were treated as outlined in Extended Data Fig. 2a, Extended Data Fig. 4a, Extended Data Fig. 6a and Extended Data Fig. 9a. Neutrophil count, body weight as well as plasma lipid levels were assessed upon euthanasia. Two-sided unpaired t-test except for Pad4+/+ vs Pad4−/−, where two-sided Mann-Whitney test was used. All data are presented as mean ± s.d.
Supplementary Material
Acknowledgements
The study was supported by the DFG (SFB914 TP B8, SFB1123 TP A6, B5, Z1, SO876/6–1, SO876/11–1, AN372/14–3, AN372/24–1, INST409/97–1FUGG and INST409/150–1FUGG), the EKFS (2016_A118, 2017_A13), the NWO (VIDI project 91712303), the Leducq foundation, and the Vetenskapradet. Funding was also provided by grants SAF2015–65607-R to A.H., BES-2013–065550 to J.M.A., and Severo Ochoa Center of Excellence (award SEV-2015–0505) to CNIC, all from the Ministerio de Ciencia, Innovacion y Universidades. We thank O. Schengel for mouse genotyping and V. Lavilla for generating video animations. This work used the platforms of the Grenoble Instruct-ERIC Center (ISBG: UMS 3518 CNRS-CEA-UGA-EMBL) with support from FRISBI (ANR-10 INSB-05–02) and GRAL (ANR-10-LABX-49–01). E.Y.L. acknowledges support from the Systems and Integrative Biology Training Program (T32GM008185), the Medical Scientist Training Program (T32GM008042), and the Dermatology Scientist Training Program (T32AR071307) at UCLA. E.Y.L. and G.C.L.W. acknowledge an Early Career Research Grant and a Discovery Grant, respectively, from the National Psoriasis Foundation. G.C.L.W. also acknowledges support from NIH R56AI125429–01A1.
Reviewer information Nature thanks Peter Libby and the other anonymous reviewer(s) for their contribution to the peer review of this work.
Footnotes
Online content
Any methods, additional references, Nature Research reporting summaries, source data, statements of data availability and associated accession codes are available at https://doi.org/10.1038/s41586-019-1167-6.
Competing interests The authors declare no competing interests.
Extended data is available for this paper at https://doi.org/10.1038/s41586-019-1167-6.
Supplementary information is available for this paper at https://doi.org/10.1038/s41586-019-1167-6.
Publisher’s note: Springer Nature remains neutral with regard to jurisdictional claims in published maps and institutional affiliations.
References
- 1.Kolb JP, Oguin TH III, Oberst A & Martinez J Programmed cell death and inflammation: winter is coming. Trends Immunol. 38, 705–718 (2017). [DOI] [PMC free article] [PubMed] [Google Scholar]
- 2.Tabas I Macrophage death and defective inflammation resolution in atherosclerosis. Nat. Rev. Immunol 10, 36–46 (2010). [DOI] [PMC free article] [PubMed] [Google Scholar]
- 3.Clarke MCH et al. Apoptosis of vascular smooth muscle cells induces features of plaque vulnerability in atherosclerosis. Nat. Med 12, 1075–1080 (2006). [DOI] [PubMed] [Google Scholar]
- 4.Hartwig H et al. Atherosclerotic plaque destabilization in mice: a comparative study. PLoS ONE 10, e0141019 (2015). [DOI] [PMC free article] [PubMed] [Google Scholar]
- 5.Silvestre-Roig C et al. Atherosclerotic plaque destabilization: mechanisms, models, and therapeutic strategies. Circ. Res 114, 214–226 (2014). [DOI] [PubMed] [Google Scholar]
- 6.Bennett MR, Sinha S & Owens GK Vascular smooth muscle cells in atherosclerosis. Circ. Res 118, 692–702 (2016). [DOI] [PMC free article] [PubMed] [Google Scholar]
- 7.Rossaint J et al. Synchronized integrin engagement and chemokine activation is crucial in neutrophil extracellular trap-mediated sterile inflammation. Blood 123, 2573–2584 (2014). [DOI] [PubMed] [Google Scholar]
- 8.Papayannopoulos V Neutrophil extracellular traps in immunity and disease. Nat. Rev. Immunol 18, 134–147 (2018). [DOI] [PubMed] [Google Scholar]
- 9.Kumar SV et al. Neutrophil extracellular trap-related extracellular histones cause vascular necrosis in severe GN. J. Am. Soc. Nephrol 26, 2399–2413 (2015). [DOI] [PMC free article] [PubMed] [Google Scholar]
- 10.Tagai C, Morita S, Shiraishi T, Miyaji K & Iwamuro S Antimicrobial properties of arginine- and lysine-rich histones and involvement of bacterial outer membrane protease T in their differential mode of actions. Peptides 32, 2003–2009 (2011). [DOI] [PubMed] [Google Scholar]
- 11.Lee EY, Fulan BM, Wong GC & Ferguson AL Mapping membrane activity in undiscovered peptide sequence space using machine learning. Proc. Natl Acad. Sci. USA 113, 13588–13593 (2016). [DOI] [PMC free article] [PubMed] [Google Scholar]
- 12.Schmidt NW et al. Criterion for amino acid composition of defensins and antimicrobial peptides based on geometry of membrane destabilization. J. Am. Chem. Soc 133, 6720–6727 (2011). [DOI] [PMC free article] [PubMed] [Google Scholar]
- 13.Schmidt NW & Wong GC Antimicrobial peptides and induced membrane curvature: geometry, coordination chemistry, and molecular engineering. Curr. Opin. Solid State Mater. Sci 17, 151–163 (2013). [DOI] [PMC free article] [PubMed] [Google Scholar]
- 14.Franck G et al. Roles of PAD4 and NETosis in experimental atherosclerosis and arterial injury: implications for superficial erosion. Circ. Res 123, 33–42 (2018). [DOI] [PMC free article] [PubMed] [Google Scholar]
- 15.Saffarzadeh M et al. Neutrophil extracellular traps directly induce epithelial and endothelial cell death: a predominant role of histones. PLoS ONE 7, e32366 (2012). [DOI] [PMC free article] [PubMed] [Google Scholar]
- 16.Xu J et al. Extracellular histones are major mediators of death in sepsis. Nat. Med 15, 1318–1321 (2009). [DOI] [PMC free article] [PubMed] [Google Scholar]
- 17.Menegazzi R, Decleva E & Dri P Killing by neutrophil extracellular traps: fact or folklore? Blood 119, 1214–1216 (2012). [DOI] [PubMed] [Google Scholar]
- 18.Hasenberg A et al. Catchup: a mouse model for imaging-based tracking and modulation of neutrophil granulocytes. Nat. Methods 12, 445–452 (2015). [DOI] [PubMed] [Google Scholar]
- 19.Dzhagalov I, St John A & He YW The antiapoptotic protein Mcl-1 is essential for the survival of neutrophils but not macrophages. Blood 109, 1620–1626 (2007). [DOI] [PMC free article] [PubMed] [Google Scholar]
- 20.Virmani R, Kolodgie FD, Burke AP, Farb A & Schwartz SM Lessons from sudden coronary death: a comprehensive morphological classification scheme for atherosclerotic lesions. Arterioscler. Thromb. Vasc. Biol. 20, 1262–1275 (2000). [DOI] [PubMed] [Google Scholar]
- 21.Gorelik R & Gautreau A Quantitative and unbiased analysis of directional persistence in cell migration. Nat. Protoc 9, 1931–1943 (2014). [DOI] [PubMed] [Google Scholar]
- 22.Lee J et al. CHARMM-GUI input generator for NAMD, GROMACS, AMBER, OpenMM, and CHARMM/OpenMM simulations using the CHARMM36 additive force field. J. Chem. Theory Comput. 12, 405–413 (2016). [DOI] [PMC free article] [PubMed] [Google Scholar]
- 23.Wichapong K et al. Structure-based design of peptidic inhibitors of the interaction between CC chemokine ligand 5 (CCL5) and human neutrophil peptides 1 (HNP1). J. Med. Chem 59, 4289–4301 (2016). [DOI] [PubMed] [Google Scholar]
- 24.van Zundert GCP et al. The HADDOCK2.2 web server: user-friendly integrative modeling of biomolecular complexes. J. Mol. Biol 428, 720–725 (2016). [DOI] [PubMed] [Google Scholar]
- 25.Alard JE et al. Recruitment of classical monocytes can be inhibited by disturbing heteromers of neutrophil HNP1 and platelet CCL5. Sci. Transl. Med 7, 317ra196 (2015). [DOI] [PubMed] [Google Scholar]
- 26.Lee EY, Lee MW, Fulan BM, Ferguson AL & Wong GCL What can machine learning do for antimicrobial peptides, and what can antimicrobial peptides do for machine learning? Interface Focus 7, 20160153 (2017). [DOI] [PMC free article] [PubMed] [Google Scholar]
- 27.Lee EY, Wong GCL & Ferguson AL Machine learning-enabled discovery and design of membrane-active peptides. Bioorg. Med. Chem 26, 2708–2718 (2018). [DOI] [PMC free article] [PubMed] [Google Scholar]
- 28.McGuffin LJ, Bryson K & Jones DT The PSIPRED protein structure prediction server. Bioinformatics 16, 404–405 (2000). [DOI] [PubMed] [Google Scholar]
- 29.Schmidt NW, Mishra A, Wang J, DeGrado WF & Wong GC Influenza virus A M2 protein generates negative Gaussian membrane curvature necessary for budding and scission. J. Am. Chem. Soc. 135, 13710–13719 (2013). [DOI] [PMC free article] [PubMed] [Google Scholar]
- 30.Ilavsky J Nika: software for two-dimensional data reduction. J. Appl. Crystallogr 45, 324–328 (2012). [Google Scholar]
- 31.Hammersley AP FIT2D: a multi-purpose data reduction, analysis and visualization program. J. Appl. Crystallogr 49, 646–652 (2016). [Google Scholar]
- 32.Necas D & Klapetek P Gwyddion: an open-source software for SPM data analysis. Cent. Eur. J. Phys 10, 181–188 (2012). [Google Scholar]
- 33.Chen SW & Pellequer JL DeStripe: frequency-based algorithm for removing stripe noises from AFM images. BMC Struct. Biol 11, 7 (2011). [DOI] [PMC free article] [PubMed] [Google Scholar]
- 34.Korchev YE et al. Specialized scanning ion-conductance microscope for imaging of living cells. J. Microsc 188, 17–23 (1997). [DOI] [PubMed] [Google Scholar]
Associated Data
This section collects any data citations, data availability statements, or supplementary materials included in this article.
Supplementary Materials
Data Availability Statement
The data that support the findings of this study are available from the corresponding authors upon reasonable request.


