Proteasome inhibitors (PI) have evolved as the central backbone of treatment for multiple myeloma (MM), with first-in-class bortezomib and second-and third-generation PI, carfilzomib and ixazomib, having been approved for this indication.1 Proteasome inhibition disrupts the unfolded protein response to resolve excessive endoplasmic reticulum stress, but also leads to massive metabolic changes manifested by the induction of amino acid biosynthesis, an anti-oxidant response, lipogenesis and an increase in protein folding.2,3 In this sense, PI represent a unique class of drugs targeting cancer cell metabolism by affecting the balance between protein biosynthesis, folding and destruction. However, the adaptive changes in MM cell metabolism may provide the basis of resistance to PI, as high glycolytic activity or rewiring glucose metabolism is associated with bortezomib resistance in MM.4,5
The biology of PI resistance in MM is poorly understood and established treatment options for PI-refractory MM are lacking. Our recent quantitative proteomic analysis of the AMO-1 MM cell line and its derivatives resistant to bortezomib (AMO-BTZ) and carfilzomib (AMO-CFZ) suggested that the PI-resistance phenotype is characterized in particular by massive alterations in cellular metabolism and high oxidative phosphorylation.6 Herein we directly substantiated this by mass spectrometry-based, whole metabolome profiling demonstrating that AMO-BTZ and AMO-CFZ show similar patterns of metabolic changes in global pathways that fuel synthesis and regeneration of glutathione, NAD(P)H and the tricarboxylic acid cycle. These changes functionally lead to increased antioxidant capacity and preferential oxidative phosphorylation, which ultimately supports more effective protein folding that results in a decreased proteasome load of misfolded proteins in PI-resistant cells. Moreover, PI-resistant cells show structurally altered mitochondria and a massive lipid class switch from lysolipids to sphingomyelins. Based on the highly specialized metabolism of bortezomib-and carfilzomib-resistant MM, we propose that these unique metabolic characteristics may offer new “vulnerable spots” that can be therapeutically exploited, e.g. with agents that target protein folding, energy supply, mitochondria biology or lipid homeostasis, to overcome PI resistance.
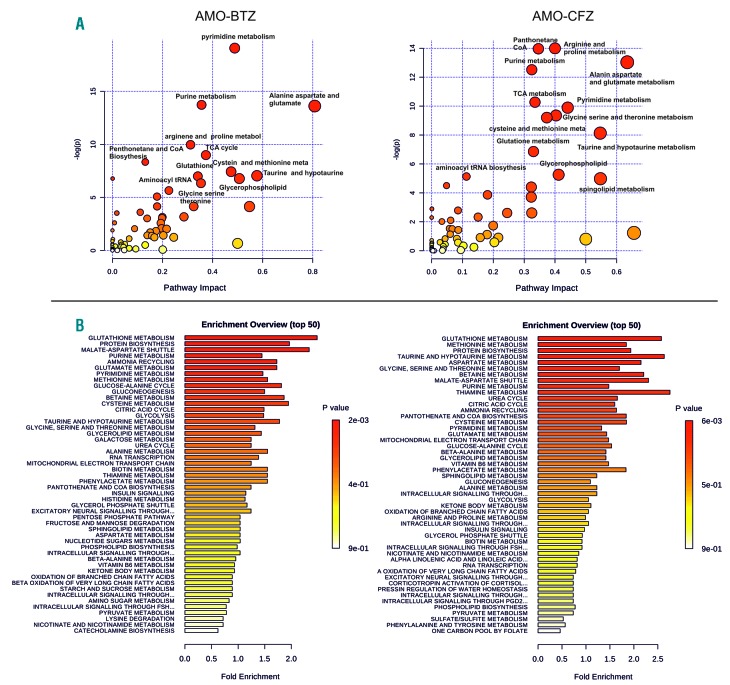
The targeted metabolomic profiling was performed in PI-resistant AMO-BTZ and AMO-CFZ cells, bulk culture and single-cell derived colonies, as well as in PI-sensitive AMO-1 control cells as described elsewhere,6 and revealed 534 metabolic intermediates of known identity that were quantitatively significantly changed in PI-resistant cells (Online Supplementary Table S1). Principal component analysis, supported by hierarchical cluster analysis, revealed strong segregation of the three cell lines based on global biochemical profiles of each cell line, suggesting distinct metabolic changes in bortezomib and carfilzomib adaptation (Online Supplementary Figure S1A,B). We observed strong concordance in the metabolic changes between bulk-cultures of PI-resistant cells and single cell-derived populations, confirming consistency of the metabolic changes. Metabolic set enrichment analysis revealed a strong concordance between AMO-BTZ and AMO-CFZ in overall deregulated processes and metabolites involved in protein biosynthesis, glutathione metabolism, the malate/aspartate shuttle, metabolism of purines, pyrimidines, amino acids and the tricarboxylic acid cycle (Figure 1A). Comparative pathway analysis confirmed the results of the metabolic set enrichment analysis, indicating highly deregulated metabolism of purines/pyrimidines, alanine/aspartate/glutamate, arginine/proline, pantothenate/coenzyme A, and cysteine, along with significant changes in the tricarboxylic acid cycle in the PI-resistant cell lines (Figure 1B). The most prominent changes in glutathione and NAD(P)+/NAD(P)H in AMO-BTZ and AMO-CFZ were further validated using individual assays that confirmed increased glutathione, NADP+ and NADPH in the PI-resistant cells, whereas the NADP+/NADPH ratio in the cells remained constant (Online Supplementary Figure S2). Graphical visualization of the most important metabolic changes in AMO-BTZ and AMO-CFZ in the key pathways driving glutathione synthesis and NAD(P)+/NAD(P)H production as well as increased levels of coenzyme A to fuel the tricarboxylic acid cycle and ATP production are summarized in Online Supplementary Figure S3. The data highlight increased antioxidant capacity, higher redox homeostasis and NAD+ levels as the key metabolic changes in PI-resistance and are consistent with findings from earlier models including our own proteomic data.5–13
Figure 1.
Pathway analysis and metabolite set enrichment analysis of proteasome inhibitor-adapted multiple myeloma cells (AMO-BTZ and AMO-CFZ). (A) Metabolite pathway analysis of deregulated metabolites in AMO-BTZ (aBTZ) and AMO-CFZ (aCFZ) cells compared to AMO-1 cells. The metabolic pathways are represented as circles, according to their scores from enrichment (y axis) and topology analyses (pathway impact, x axis) using MetaboAnalyst 3.0. Darker red colors indicate more significant changes of metabolites in the corresponding pathway. The size of the circle corresponds to the pathway impact score and is correlated with the centrality of the involved metabolites. (B) Metabolite set enrichment analysis pathway overview in AMO-BTZ and AMO-CFZ, in comparison with AMO-1 proteasome inhibitor-sensitive cells obtained by MetaboAnalyst 3.0. Over-representation analysis was implemented to evaluate whether a particular metabolite set was represented (fold enrichment) more than expected by chance within the given compound list. One-tailed P values are provided after adjusting for multiple testing. TCA: tricarboxylic acid; CoA: coenzyme A.
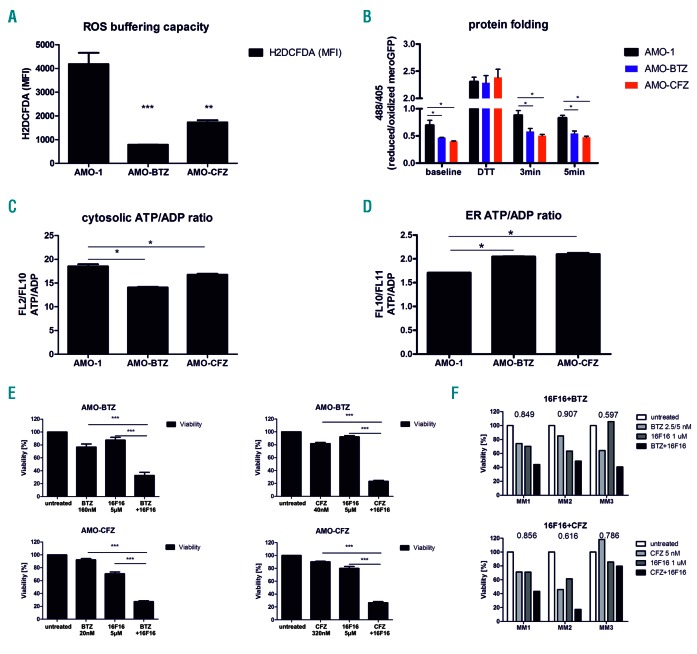
We functionally validated the increased capacity of PI-resistant cells to buffer the formation of reactive oxygen species (ROS), demonstrating 2- to 4-fold lower ROS levels in these cells than in PI-sensitive cells, confirming a significantly higher antioxidant capacity (Figure 2A). Consistent with this, PI-resistant cells are more resistant than PI-sensitive cells to H2O2–induced cytotoxicity (Online Supplementary Figure S4, Online Supplementary Table S2). In order to compare protein folding capacity directly between PI-resistant and PI-sensitive viable MM cells, the cells were equipped with mero-GFP, which enables quantitative real-time monitoring of functional protein folding based on the formation of disulfide bonds in the endoplasmic reticulum.14 PI-adapted cells showed significantly higher amounts of the folded, oxidized form of mero-GFP already at steady state level, reflecting a higher protein folding capacity through more effective disulfide bond formation. Upon short 5 min pulse treatment with the reducing agent dithiotreitol, mero-GFP is converted into its unfolded, fully reduced state in all types of cells. The reconstitution of the folded, fully oxidized state of mero-GFP was observed already 3 min after wash-out of dithiotreitol in PI-adapted MM, in contrast to PI-sensitive MM, directly demonstrating the increased activity of the protein folding machinery in PI-resistant MM cells (Figure 2B). Chaperones involved in protein folding are highly ATP-dependent. We therefore addressed whether metabolically adapted, PI-resistant MM show a higher rate of ATP production in the endoplasmic reticulum, which could drive more effective protein folding. To this end the cells were equipped with an ATP/ADP ratiometric construct that is selectively targeted to the cytosol or the endoplasmic reticulum. This construct allows assessment of changes in the ATP/ADP ratio in live cells in the endoplasmic reticulum versus the cytosol through quantitative fluorescence imaging. Both AMO-BTZ and AMO-CFZ showed a significantly reduced ATP/ADP ratio in the cytosol, compared to that of PI-sensitive cells, but significantly increased ATP/ADP ratio in the endoplasmic reticulum (Figure 2C,D). These results directly indicated a selective accumulation of ATP in the endoplasmic reticulum of PI-resistant MM cells, consistent with the high ATP demand for chaperone-driven protein folding.
Figure 2.
Functional changes in antioxidant capacity, protein folding and ATP capacity in the endoplasmic reticulum of proteasome inhibitor-resistant cells. (A) Reactive oxygen species (ROS) buffering capacity in proteasome inhibitor (PI)-sensitive AMO-1 and PI-resistant AMO-BTZ and AMO-CFZ cells evaluated by short-term exposure of cells to 0.08% H2O2 and subsequent ROS measurement. (B) Protein folding in PI-sensitive AMO-1 and PI-resistant AMO-BTZ and AMO-CFZ cells evaluated by disulfide bond formation of the endoplasmic reticulum (ER)-localized mero-GFP construct. (C, D) ATP/ADP ratio in the cytosol (C) and ER (D) of AMO-1, AMO-BTZ and AMO-CFZ cells evaluated by specific ratiometric constructs localized in the cytoplasm or ER. (E) Cytotoxicity of 16F16, bortezomib (BTZ) or carfilzomib (CFZ) and the combination of 16F16 with BTZ or CFZ in AMO-BTZ and AMO-CFZ cells. Data represent the mean ± standard error of mean of three independent measurements. (F) Cytotoxicity of BTZ (MM1: 5 nM, MM2: 2.5 nM, MM3: 5 nM), CFZ (all 5 nM), 1 μM 16F16 and their combinations in primary malignant plasma cells. The coefficient of drug interaction (CDI) is indicated. A CDI <1 indicates a synergistic effect, a CDI = 1 indicates an additive effect, and a CDI >1 indicates an antagonistic effect. Statistical significance is depicted with asterisks: *P<0.05, **P<0.01, ***P<0.001.
The functional importance of protein folding for the PI-resistant phenotype was validated using specific inhibitors: the protein disulfide isomerase inhibitor 16F16 and the disulfide bond-disrupting agent TCyDTDO (for more information see the Online Supplement), which both, in combination with PI, significantly sensitized PI-adapted MM cell lines and primary MM cells derived from patients resistant to bortezomib or carfilzomib (Figure 2E,F, Online Supplementary Figure S5; the patients’ characteristics are included in Online Supplementary Table S3). Targeting protein disulfide isomerase in MM in vitro and in vivo has been suggested as a promising therapeutic strategy in combination with bortezomib.15
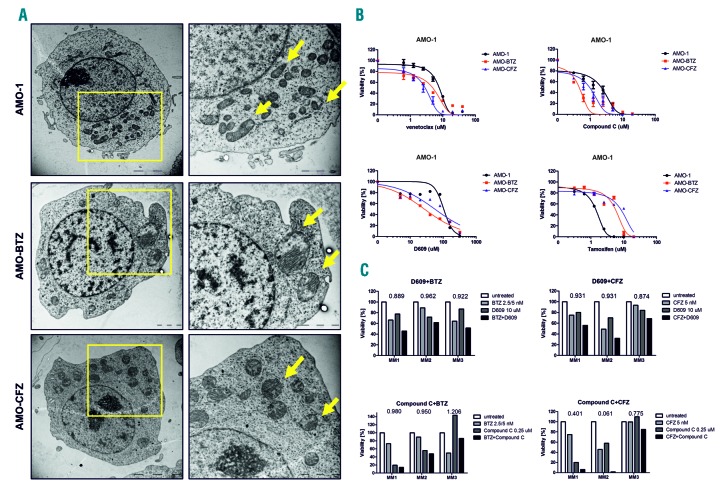
Mitochondria serve as a major source of ATP through oxidative phosphorylation (OXPHOS). Increased ATP levels in PI-resistant cells are consistent with increased activity of the tricarboxylic acid cycle and the metabolic shift towards OXPHOS observed previously in these cells.6 To further highlight the key role of ATP supply and mitochondria in PI-resistant MM we conducted a morphological analysis using transmission electron microscopy. While mitochondria in PI-sensitive AMO-1 cells were a normal shape and size, delimited by double membranes that enclosed the matrix compartment, mitochondria in PI-resistant AMO-BTZ and AMO-CFZ cells were enlarged, round, and contained a much larger matrix compartment (Figure 3A). To our knowledge, this is the first demonstration of morphological changes in drug-resistant MM. The functional importance of these changes was assessed using mitochondria-targeting drugs: venetoclax (a BCL2 inhibitor) and compound C (an AMPK inhibitor). Strikingly, compared to PI-sensitive cells, PI-resistant cells were more sensitive to venetoclax and compound C (Figure 3B, Online Supplementary Figure S6, Online Supplementary Table S2). Moreover, compound C showed synergistic effects with carfilzomib in primary cells from MM patients (Figure 3C, Online Supplementary Figure S6). This suggests that the highly adapted metabolic machinery in PI-resistant MM may, in turn, render these cells particularly sensitive to drugs that target mitochondria function or metabolic activity.
Figure 3.
Changes in mitochondria morphology, energy demand and lipid composition in proteasome inhibitor-resistant cells. (A) The mitochondria in proteasome inhibitor (PI)-resistant AMO cells show prominent changes. The panels on the left show transmission electron microscopy images of whole cells, whereas those on the right are zoomed-in areas of the cell in the left panel with mitochondria indicated by the arrows. (B) Dose-response curves of PI-sensitive and PI-resistant AMO-1 cells (BTZ = bortezomib, CFZ = carfilzomib) to drugs targeting mitochondria, energy metabolism and lipid homeostasis: a BCL2 inhibitor (venetoclax), an AMPK inhibitor (compound C), a sphingomyelin synthase inhibitor (D609) and a sphingolipid metabolism inhibitor (tamoxifen). The half maximal inhibitory concentration (IC50) values are presented in Online Supplementary Table S3. Data represent the mean ± standard error of mean of three independent measurements. (C) Primary malignant plasma cells were exposed for 48 h to bortezomib (BTZ; MM1: 5 nM, MM2: 2.5 nM, MM3: 5 nM) and carfilzomib (CFZ; all 5 nM) alone or in combination with 0.25 μM compound C or 10 μM D609.
Consistent with the increased energy production described above and changes in the metabolism of coenzyme A, we observed a lipid class switch from lysolipids to sphingomyelins, accompanied by accumulation of mono-acylglycerols in PI-resistant AMO-BTZ and AMO-CFZ cells (Online Supplementary Table S4). The role of sphingolipid synthesis in PI-resistance was evaluated using D609 (an inhibitor of sphingomyelin synthase) and tamoxifen (a sphingomyelin transferase inhibitor). D609 was more cytotoxic in PI-resistant cells than in PI-sensitive cells, in contrast to tamoxifen, which showed the opposite effect, supporting the functional importance of sphingolipid synthesis in PI resistance (Figure 3B, Online Supplementary Table S2) and likewise identifying the sphingomyelin biosynthesis pathway as a potential therapeutic target in PI-resistant MM. Consistently, the combination of D609 with bortezomib or carfilzomib showed synergistic effects in primary MM cells (Figure 3C). In conclusion, we present here a global metabolic analysis of bortezomib-and carfilzomib-resistant MM cells and elucidate the most prominent changes in two PI-resistant MM cell lines on the functional level, especially in redox and energy homeostasis. Although the cell lines differed in some aspects, they both contained a highly complex signature of metabolic changes that were consistent with the predictions made from proteomic profiling,6 implicating a general pattern of adaptation to proteasome inhibiting drugs as being likely involved in cross-resistance between individual drugs. We suggest targeting the downstream pathways of high energy supply driven by mitochondria in PI-resistant cells, such as more effective protein folding or lipid homeostasis, as a promising strategy to selectively target the adaptive features of these PI-resistant MM cells. Our data support previous reports about high energy demand in PI-resistant cells16 and highlight global metabolic mitochondrial changes leading to increased protein folding and lipid rewiring as major drivers of adaptation towards PI, and at the same time identify vulnerable spots in cellular homeostasis specifically in PI-resistant MM. The key findings are summarized in the hierarchical model for the metabolic adaptation of PI-resistant MM (Online Supplementary Figure S7).
Acknowledgments
The authors would like to thank Gregory A. Michelotti and Kirk Pappan from Metabolon Company, Inc. for their determination and analysis of the metabolic profile. Dobromila Klemova and Ladislav Ilkovics are acknowledged for expert technical assistance with the TEM analysis.
Footnotes
Funding: this research was supported by Krebsliga Schweiz (KFS-3567-02-2015), Wilhelm Sander-Stiftung (2016.104.1), Promedica Stiftung (1438/M) and a Swiss National Foundation grant (SNF 310030_182492).
Information on authorship, contributions, and financial & other disclosures was provided by the authors and is available with the online version of this article at www.haematologica.org.
References
- 1.Rajkumar SV. Myeloma today: disease definitions and treatment advances. Am J Hematol. 2016;91(1):90–100. [DOI] [PMC free article] [PubMed] [Google Scholar]
- 2.Lee AH, Iwakoshi NN, Anderson KC, Glimcher LH. Proteasome inhibitors disrupt the unfolded protein response in myeloma cellsLee. Proc Natl Acad Sci U S A. 2003;100(17):9946–9951 [DOI] [PMC free article] [PubMed] [Google Scholar]
- 3.Pluquet O, Pourtier A, Abbadie C. The unfolded protein response and cellular senescence. A review in the theme: cellular mechanisms of endoplasmic reticulum stress signaling in health and disease. Am J Physiol Cell Physiol. 2015;308(6):C415–425. [DOI] [PubMed] [Google Scholar]
- 4.Maiso P, Huynh D, Moschetta M, et al. Metabolic signature identifies novel targets for drug resistance in multiple myeloma. Cancer Res. 2015;75(10):2071–2082. [DOI] [PMC free article] [PubMed] [Google Scholar]
- 5.Zaal EA, Wu W, Jansen G, Zweegman S, Cloos J, Berkers CR. Bortezomib resistance in multiple myeloma is associated with increased serine synthesis. Cancer Metab. 2017;5:7. [DOI] [PMC free article] [PubMed] [Google Scholar]
- 6.Soriano GP, Besse L, Li N, et al. Proteasome inhibitor-adapted myeloma cells are largely independent from proteasome activity and show complex proteomic changes, in particular in redox and energy metabolism. Leukemia. 2016;30(11):2198–2207. [DOI] [PMC free article] [PubMed] [Google Scholar]
- 7.Thompson RM, Dytfeld D, Reyes L, et al. Glutaminase inhibitor CB-839 synergizes with carfilzomib in resistant multiple myeloma cells. Oncotarget. 2017;8(22):35863–35876. [DOI] [PMC free article] [PubMed] [Google Scholar]
- 8.Riz I, Hawley TS, Marsal JW, Hawley RG. Noncanonical SQSTM1/p62-Nrf2 pathway activation mediates proteasome inhibitor resistance in multiple myeloma cells via redox, metabolic and translational reprogramming. Oncotarget. 2016;7(41):66360–66385. [DOI] [PMC free article] [PubMed] [Google Scholar]
- 9.Dytfeld D, Luczak M, Wrobel T, et al. Comparative proteomic profiling of refractory/relapsed multiple myeloma reveals biomarkers involved in resistance to bortezomib-based therapy. Oncotarget. 2016;7(35):56726–56736. [DOI] [PMC free article] [PubMed] [Google Scholar]
- 10.Zheng Z, Fan S, Zheng J, et al. Inhibition of thioredoxin activates mitophagy and overcomes adaptive bortezomib resistance in multiple myeloma. J Hematol Oncol. 2018;11(1):29. [DOI] [PMC free article] [PubMed] [Google Scholar]
- 11.Nerini-Molteni S, Ferrarini M, Cozza S, Caligaris-Cappio F, Sitia R. Redox homeostasis modulates the sensitivity of myeloma cells to bortezomib. Br J Haematol. 2008;141(4):494–503. [DOI] [PubMed] [Google Scholar]
- 12.Starheim KK, Holien T, Misund K, et al. Intracellular glutathione determines bortezomib cytotoxicity in multiple myeloma cells. Blood Cancer J. 2016;6(7):e446. [DOI] [PMC free article] [PubMed] [Google Scholar]
- 13.Cagnetta A, Cea M, Calimeri T, et al. Intracellular NAD(+) depletion enhances bortezomib-induced anti-myeloma activity. Blood. 2013;122(7):1243–1255. [DOI] [PMC free article] [PubMed] [Google Scholar]
- 14.Kanekura K, Ishigaki S, Merksamer PI, Papa FR, Urano F. Establishment of a system for monitoring endoplasmic reticulum redox state in mammalian cells. Lab Invest. 2013;93(11):1254–1258. [DOI] [PMC free article] [PubMed] [Google Scholar]
- 15.Robinson RM, Reyes L, Duncan RM, et al. Inhibitors of the protein disulfide isomerase family for the treatment of multiple myeloma. Leukemia. 2019;33(4):1011–1022. [DOI] [PMC free article] [PubMed] [Google Scholar]
- 16.Zaal EA, Berkers CR. The Influence of metabolism on drug response in cancer. Front Oncol. 2018;8:500. [DOI] [PMC free article] [PubMed] [Google Scholar]


