

Abstract
Objective
Growth differentiation factors (GDFs) and bone-morphogenic proteins (BMPs) are members of the transforming growth factor β (TGFβ) superfamily and are known to play a central role in the growth and differentiation of developing tissues. Accumulating evidence, however, demonstrates that many of these factors, such as BMP-2 and -4, as well as GDF15, also regulate lipid metabolism. GDF10 is a divergent member of the TGFβ superfamily with a unique structure and is abundantly expressed in brain and adipose tissue; it is also secreted by the latter into the circulation. Although previous studies have demonstrated that overexpression of GDF10 reduces adiposity in mice, the role of circulating GDF10 on other tissues known to regulate lipid, like the liver, has not yet been examined.
Methods
Accordingly, GDF10−/− mice and age-matched GDF10+/+ control mice were fed either normal control diet (NCD) or high-fat diet (HFD) for 12 weeks and examined for changes in liver lipid homeostasis. Additional studies were also carried out in primary and immortalized human hepatocytes treated with recombinant human (rh)GDF10.
Results
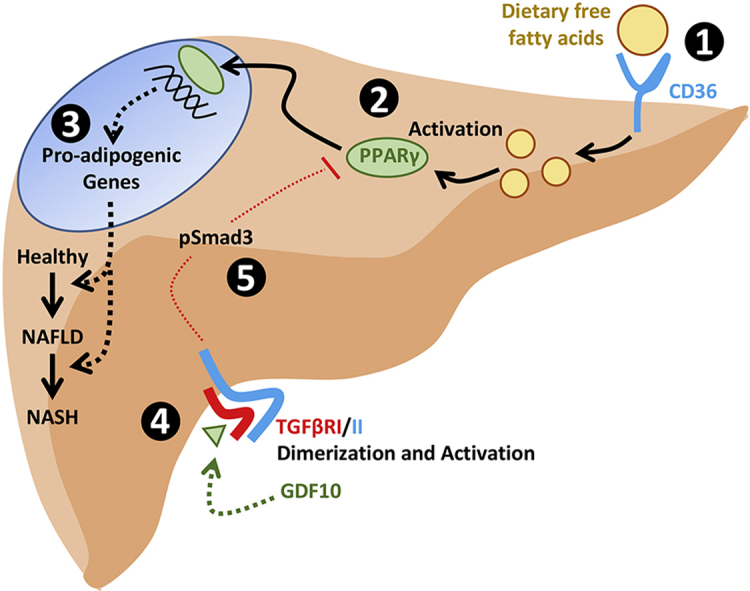
Here, we show that circulating GDF10 levels are increased in conditions of diet-induced hepatic steatosis and, in turn, that secreted GDF10 can prevent excessive lipid accumulation in hepatocytes. We also report that GDF10−/− mice develop an obese phenotype as well as increased liver triglyceride accumulation when fed a NCD. Furthermore, HFD-fed GDF10−/− mice develop increased steatosis, endoplasmic reticulum (ER) stress, fibrosis, and injury of the liver compared to HFD-fed GDF10+/+ mice. To explain these observations, studies in cultured hepatocytes led to the observation that GDF10 attenuates nuclear peroxisome proliferator-activated receptor γ (PPARγ) activity; a transcription factor known to induce de novo lipogenesis.
Conclusion
Our work delineates a hepatoprotective role of GDF10 as an adipokine capable of regulating hepatic lipid levels by blocking de novo lipogenesis to protect against ER stress and liver injury.
Keywords: BMP-3b, ER stress, Hepatic steatosis, HFD, NAFLD, NASH, TGFβ
Graphical abstract
Highlights
-
•
The activation of PPARγ in hepatocytes is antagonized by GDF10.
-
•
GDF10 attenuates lipid accumulation in cultured hepatocytes.
-
•
GDF10−/− mice develop diet-induced obesity and severe hepatic steatosis.
-
•
HFD-fed GDF10−/− mice exhibit hepatic ER stress, fibrosis and injury.
-
•
GDF10 is a novel hepatoprotective member of the TGFβ superfamily.
Abbreviations
- ANGPTL4
angiopoietin-like 4
- ACOX1
acyl-coenzyme A oxidase 1
- ACOT2
acyl-coenzyme A thioesterase 2
- ACADM
acyl-coenzyme A dehydrogenase, C-4 to C-12 straight chain
- ATF4
activating transcription factor 4
- ATF6
activating transcription factor 6
- ALT
alanine-L transaminase
- BMP
bone morphogenic protein
- BAT
brown adipose tissue
- BSA
bovine-serum albumin
- C/EBPα
CCAAT-enhancer-binding protein α
- CD36
cluster of differentiation 36
- CGTZ
ciglitizone
- CLAMS
Columbus Instruments Comprehensive Lab Animal Monitoring System
- CRTC2
CREB-regulated transcription cofactor 2
- CHOP
C/EBP homologous protein
- DMEM
Dulbecco's Modified Eagle's Medium
- ER
endoplasmic reticulum
- FBS
fetal bovine serum
- FATP5
fatty acid transport protein 5
- FSP27
fat-specific protein 27
- FOXO1
forkhead box protein O1
- FN1
fibronectin 1
- FFPE
formalin-fixed paraffin-embedded
- GDF10
growth differentiation factor 10
- GAT
gonadal adipose tissue
- GRP78
glucose-regulated protein of 78 kDa
- GRP94
glucose-regulated protein of 94 kDa
- β-HB
β-hydroxybutyrate
- HFD
high-fat diet
- IHC
immunohistochemistry
- IAT
inguinal adipose tissue
- IRE1α
inositol-requiring 1α
- LPL
lipoprotein lipase
- IL1β
interleukin 1β
- LDH
lactate dehydrogenase
- NAFLD
non-alcoholic fatty liver disease
- NASH
non-alcoholic steatohepatitis
- NCD
normal control diet
- ORO
Oil Red O
- OA
oleate
- PFA
paraformaldehyde
- PPARγ/α
peroxisome proliferator-activated receptor γ/α
- PGC1β
peroxisome proliferator-activated receptor gamma coactivator 1-β
- PPRE
peroxisome proliferator response element
- PSR
Picrosirius red
- PDK4
pyruvate dehydrogenase lipoamide kinase isozyme 4
- PERK
protein kinase RNA (PKR)-like ER kinase
- PA
palmitate
- PCK1
phosphoenolpyruvate carboxykinase 1
- PBS
phosphate-buffered saline
- rhGDF10
recombinant human growth differentiation factor 10
- si
small interfering
- STAT3
signal transducer and activator of transcription 3
- SREBP-1/-2
sterol regulatory element-binding protein-1/-2
- TGFβ
transforming growth factor β
- TGFβR1
TGFβ receptor subtype-1
- TG
thapsigargin
- TM
tunicamycin
- TNFα
tumor necrosis factor alpha
- UPR
unfolded protein response
- XBP1
X-box-binding protein 1
1. Introduction
Obesity is considered by many as the epidemic of the 21st century, affecting over 2 billion individuals worldwide and still increasing in frequency [1]. Although obesity is commonly thought of as a disease characterized by excess adipose tissue, other hallmark characteristics are also common in obese individuals. Non-alcoholic fatty liver disease (NAFLD) affects approximately 75% of obese individuals and contributes to other comorbidities associated with obesity, such as type 2 diabetes mellitus, hypertension, heart disease and ischemic stroke [2], [3]. NAFLD is defined as an accumulation of triglyceride in the liver in excess of 5% of total liver weight and is commonly referred to as steatosis. Simple steatosis is largely benign; however, NAFLD can progress to life-threatening non-alcoholic steatohepatitis (NASH) or liver cirrhosis. Although the precise mechanism of progression remains poorly understood, the well-accepted multiple-hits hypothesis suggests that cellular events including oxidative stress, lipid peroxidation, Kupffer cell activation, and adipocytokine alterations play a central role [1], [4]. Numerous studies have also demonstrated that ER stress plays a key role in the development of NAFLD and NASH by promoting Kupffer cell activation, oxidative stress and mitochondrial dysfunction [5], [6], [7].
Given that secretory cells like adipocytes and hepatocytes are rich in ER, the role of ER stress has become a topic of considerable interest in the development of metabolic diseases. ER stress is characterized by an overwhelming of ER-resident chaperones by misfolded de novo polypeptides in the ER lumen. This event triggers the unfolded protein response (UPR) in order to increase ER protein folding capacity and restore homeostatic conditions. The signaling cascades of the UPR are comprised of (a) the activating transcription factor 6 (ATF6) pathway, which modulates sterol regulatory element-binding protein (SREBP)-2 mediated de novo lipogenesis [8]; (b) the highly conserved inositol-requiring 1α (IRE1α) - X-box-binding protein 1 (XBP1) pathway, which is required for the regulation of hepatic lipids during conditions of stress [9]; as well as (c) the protein kinase RNA (PKR)-like ER kinase (PERK) - activating transcription factor 4 (ATF4) pathway capable of regulating de novo lipogenesis via fatty acid synthase and SREBP-1 [10]. Previous studies have also demonstrated that ATF4 can induce the expression and activation of PPARγ, a transcription factor known to promote the expression of pro-adipogenic mediators including fatty acid transport protein 5 (FATP5), angiopoietin-like 4 (ANGPTL4), lipoprotein lipase (LPL), Perilipin, cluster of differentiation 36 (CD36) and fat-specific protein 27 (FSP27) [11], [12]. Clinical studies have also characterized increased PPARγ expression in the livers of patients with NAFLD [13]. Although pro-survival at its core, chronic or severe ER stress can induce the expression of lipid-regulatory genes that promote de novo lipogenesis, as well as drive inflammation, fibrosis, and apoptosis in the liver [14].
GDF10, also known as BMP-3b, is an atypical member of the TGFβ superfamily capable of inhibiting osteoblast differentiation by antagonizing BMP-2 and -4 -mediated osteogenesis [15]. To date, over 30 members of the superfamily have been described, and all share common features. They are synthesized as precursor proteins containing N-terminal signal peptide sequences and pro-regions. Once secreted, the mature, biologically active molecule is believed to consist of a homodimer originating from proteolytically-cleaved precursors [16]. In recent years, accumulating evidence has shown that these factors play a central role in the regulation of energy balance and homeostasis. BMP-2 and -4 promote white adipogenesis while BMP-7 promotes brown adipogenesis [17], [18], [19]. Studies have also demonstrated that in vitro knockdown of GDF10 enhances adipogenesis and that transgenic mice overexpressing GDF10 are protected against diet-induced obesity and insulin resistance [20], [21]. GDF15 has also been shown to regulate feeding and fatty acid oxidation and to protect against steatosis, insulin resistance, obesity, and ER stress in the livers of mice fed a HFD [22], [23], [24].
It is well-established that adipokines can modulate obesity and a variety of its comorbidities, including NAFLD [25]. However, little is known about the role of circulating GDF10 on liver health/function and injury in the face of diet-induced obesity. Here, we report that pharmacologic and diet-induced ER stress increases the expression of GDF10 in cultured pre-adipocytes and in white adipose tissue. We also show that GDF10−/− mice exhibit increased nuclear PPARγ expression and activity coupled with hepatic steatosis on the NCD and develop a severe NASH-like phenotype on the HFD. Collectively, our findings suggest that circulating GDF10 plays a critical role as a regulator of hepatic PPARγ during conditions of dietary stress and that GDF10 is capable of attenuating the progression of steatosis to NASH.
2. Materials and methods
2.1. Animal studies
GDF10−/− mice were a generous gift from Dr. Se-Jin Lee (Johns Hopkins University) [16]. Animals were housed in 12 h light cycles and controlled temperature and humidity conditions and had access to standard NCD (2918, Envigo) and water ad libitum (n = 10). In experiments designed to study diet-induced hepatic steatosis, male GDF10−/− mice and age-matched GDF10+/+ controls were provided with HFD (60% Kcal; TD.06414, Envigo) ad libitum starting at 6 weeks of age for an additional 12 weeks prior to sacrifice (n = 5). Measurements of metabolic parameters were performed using the Columbus Instruments Comprehensive Lab Animal Monitoring System (CLAMS) one week prior to sacrifice. A cohort of 12-week-old male C57BL/6J mice were also treated with phosphate-buffered saline (PBS) vehicle control or with the ER stress-inducing agent, tunicamycin (TM; 500 μg/kg), for 24 h via intraperitoneal injection in the left flank (n = 5). All mice were fasted for 6 h and anesthetized using isoflurane prior to sacrifice. Experimental procedures were approved by the McMaster University Animal Research Ethics Board.
2.2. Cell culture and treatment
Huh7 and HepG2 immortalized human hepatocyte cell lines as well as primary human hepatocytes were maintained in 5% CO2 at 37 °C and cultured in Dulbecco's Modified Eagle's Medium (DMEM) or Willams' E medium, supplemented with 10% v/v fetal bovine serum (FBS), 100 IU/ml penicillin and 100 μg/ml streptomycin. For experimental procedures designed to examine the effect of GDF10 on lipid accumulation, cells were pre-treated with rhGDF10 (250 ng/mL, R&D Systems) for 24 h and then treated with agents known to stimulate lipid droplet accumulation, such as oleate (OA; 200 μM, Sigma–Aldrich), palmitate (PA; 200 μM, Sigma–Aldrich), thapsigargin (TG; 100 nM, Sigma–Aldrich) and TM (2 μg/mL, Sigma–Aldrich) for an additional 24 h. Similarly, for studies examining the effect of GDF10 on PPARγ-mediated lipid accumulation, hepatocytes were pre-treated with rhGDF10 and then treated with PPARγ agonist, ciglitizone (CGTZ; 10 μM, Tocris Bioscience), for 24 h prior to analysis. For experiments designed to examine the effect of GDF10 on PPARγ cellular localization and promoter binding, cells were pre-treated with rhGDF10 for 24 h, and subsequently treated with CGTZ for 1 h prior to analysis. All cell culture experiments were repeated a minimum of 3 times. To block Smad3 expression, siGENOME SMARTpool siRNA targeted against Smad3 (UCAAGAGCCUGGUCAAGAA, GAGUUCGCCUUCAAUAUGA, GGACGCAGGUUCUC-CAAAC, GGACGAGGUCUGCGUGAAU) was purchased from Dharmacon (SO-2782081G). 100 nM of siRNA targeted against Smad3 or scrambled siRNA control was transfected using RNAiMAX (ThermoFisher Scientific) as described previously [26].
2.3. Cell fractionation and transcriptional activity studies
Huh7 and HepG2 cells were seeded into 100 mm dishes and allowed to grow to confluency of 80%. Following treatment, nuclear and cytosolic fractions were isolated using an extraction kit (Abcam) according to the manufacturer's instructions. For experiments designed to examine the effect of GDF10 on PPARγ transcriptional activity, HepG2 cells were pre-treated with rhGDF10 for 24 h, and subsequently treated with CGTZ for 1 h prior to cellular fractionation. PPARγ transcription factor assay kit (Abcam) was carried out according to manufacturer's instructions. Briefly, 120 μg of protein isolated from nuclear extracts was added to each well of a 96-well plate coated with a double-stranded DNA sequence containing peroxisome proliferator response element (PPRE). Following an over-night incubation, anti-PPARγ primary antibody was added, followed by an HRP-conjugated secondary antibody. PPARγ binding to the PPRE was detected using a spectrophotometer at a wavelength of 450 nm.
2.4. Histological and immunohistochemical staining
Histological analysis was carried out in formalin-fixed paraffin-embedded (FFPE) tissues that were cut into 4 μm thick sections. Gross pathological changes were first examined with hematoxylin and eosin (H&E) and collagen accumulation was examined using Mason's Trichrome (Sigma–Aldrich). Analysis of intracellular triglyceride accumulation was carried out in OCT-embedded liver sections (10 μm) and in cultured cells fixed in 4% paraformaldehyde (PFA) using Oil Red O (ORO). The ORO content of isopropanol extracts was measured using a spectrophotometer (Molecular Devices) at a wavelength of 520 nm [27]. Immunohistochemical (IHC) staining was also carried out in 4 μm thick FFPE sections. Briefly, deparaffinized sections were blocked in 5% serum, incubated in primary antibody for 18 h at 4 °C, and exposed to biotin-labeled secondary antibody (Vector Laboratories; for a complete list of antibodies and working dilutions, please refer to Supplemental Table 1). Streptavidin-labeled HRP solution (Vector Laboratories) and the developing solution (Vector Laboratories) were used to visualize staining. Slides were examined using a Nikon microscope and images were quantified using ImageJ Software (NIH).
2.5. Quantitative real time PCR
Total RNA was isolated using RNA purification kits (ThermoFisher Scientific). A total of 2 μg of RNA was reverse transcribed to cDNA using the High-Capacity cDNA Reverse Transcription Kit (Applied Biosystems). PCR amplification was performed using the Fast SYBRGreen PCR master mix (Applied Biosystems) according to the manufacturer's instructions. All primer sequences are listed in Supplemental Table 2.
2.6. Immunoblots
Whole cell and tissue lysates were prepared using SDS lysis buffer containing a protease inhibitor cocktail (Roche), and protein concentration was measured as described previously [26]. The samples were resolved using SDS-PAGE and subsequently transferred to nitrocellulose membranes. Nitrocellulose membranes were then incubated in 5% w/v skimmed milk and primary antibody followed by the respective secondary antibody. The signal was detected using a Konica Minolta X-Ray film processor.
2.7. Immunofluorescent staining
Following treatment, Huh7 and primary human hepatocytes were fixed in 4% PFA and permeabilized in 0.025% Triton X-100 for 15 min. After blocking in 5% bovine-serum albumin (BSA), cells were stained with primary antibody, washed, and subsequently stained with fluorescently-labeled secondary antibodies and DAPI nuclear stain. Slides were then mounted using an aqueous mounting medium (ThermoFisher Scientific) and visualized using the EVOS FL (ThermoFisher Scientific) imaging system.
2.8. Plasma β-hydroxybutyrate (β-HB), ELISA, lactate dehydrogenase (LDH) and alanine-L transaminase (ALT) assays
Plasma levels of the ketone body β-HB were measured using a colorimetric assay (Cayman). Circulating GDF10 levels were measured using a mouse GDF10 ELISA kit (Elabscience). Plasma ALT was measured using a commercially available colorimetric assay (Abcam). Cytotoxicity was examined using a LDH colorimetric assay kit (Roche). All assays were performed according to the manufacturer's instructions.
2.9. Quantification of plasma, hepatic, and fecal lipid
Equal amounts of liver tissues were lysed in a mixture of hexane/2-propanol and incubated on an orbital shaker at 37 °C for 5 h. Samples were then subjected to centrifugation for 5 min (12,000 rpm) in order to isolate the lipid-containing liquid phase. Lipid content was quantified using a colorimetric triglyceride assay (Wako Diagnostics) according to the manufacturer's instructions. In a similar manner, fecal cholesterol content was measured directly from feces normalized to dry weight. Hepatic cholesterol content was measured using a commercially available colorimetric kit (Abcam) according to the manufacturer's instructions.
2.10. Statistical analysis
Data are reported as the mean ± SD. Statistical analysis was performed using GraphPad Prism. For comparison between two groups, an unpaired two-tailed Student's t-test was used. For analysis of three or more groups, a one-way ANOVA followed by Tukey's HSD multiple comparison test was performed. Differences between groups were considered statistically significant when p < 0.05.
3. Results
3.1. GDF10−/− mice exhibit increased body weight gain and adiposity
Increased body weight gain in our GDF10−/− mouse colony was among our initial observations and was consistently observed in mice fed NCD (Figure 1A,B; *, p < 0.05, n = 5). Following this observation, adiposity was examined via IHC staining for the adipocyte marker, perilipin, as well as H&E of the gonadal adipose tissue (GAT). Consistent with gross morphological observations, GDF10−/− mice had increased mean adipocyte size (Figure 1C,D; *, p < 0.05, n = 5) and weight of the inguinal adipose tissue (IAT), GAT and brown adipose tissue (BAT) (Figure 1E; *, p < 0.05, n = 5). BAT from GDF10−/− mice also appeared lighter in color and revealed increased lipid droplets compared to BAT from control mice (Figure 1F,G and H; *, p < 0.05, n = 5). GDF10 knockout was confirmed in these mice via real time PCR in GAT (Figure 1I; *, p < 0.05) and immunoblot (Figure 1J). Immunoblot analysis also revealed that GDF10 is expressed in GAT, but not in the livers of healthy wild-type mice (Figure 1J).
Figure 1.

GDF10−/− mice have increased body weight and adiposity. (A) Macroscopic appearance and (B) body weights of 30 week old GDF10+/+ and GDF10−/− mice fed NCD (n = 5). (C) IHC staining of the adipocyte marker perilipin and H&E staining of the GAT. (D) Average adipocyte size in GAT. (E) Weights of the IAT, GAT, and BAT. (F) H&E staining of the BAT. (G) Quantification of lipid droplets in BAT using ImageJ software. (H) Macroscopic appearance of the BAT from GDF10+/+ and GDF10−/− mice at 30 weeks of age. (I) Real time PCR analysis of mRNA abundance of GDF10 in the GAT to confirm knockout (n = 5). (J) Immunoblots of the liver and GAT from GDF10+/+ and GDF10−/− mice. Scale bars, 100 μm. All data are shown as the mean ± S.D. *, p < 0.05 by unpaired two-tailed Student's t-test.
3.2. GDF10−/− mice exhibit hepatic lipid accumulation
Given that steatosis is commonly observed in obese patients as well as in rodent models of obesity [1], [4], we next examined the livers of GDF10−/− mice fed NCD and HFD. Consistent with our observations in adipose tissue, liver weight was increased in GDF10−/− mice compared to controls on the NCD (Figure 2A; *, p < 0.05, n = 5). Analysis of hepatic triglyceride and cholesterol content yielded findings that were consistent with liver weights (Figure 2B; *, p < 0.05, n = 5). Similarly, H&E, perilipin and ORO staining also revealed increased lipid accumulation in the livers of NCD- and HFD-fed GDF10−/− mice compared to wild-type counterparts (Figure 2C). To confirm our visual observations, perilipin and ORO staining was quantified using ImageJ software (Figure 2D; *, p < 0.05, n = 5). In line with increased hepatic lipid accumulation, an increase in plasma triglyceride content was also observed in GDF10−/− compared to GDF10+/+ mice (Figure 2E; *, p < 0.05). The ability of GDF10 to modulate lipid droplet accumulation was then examined in immortalized human HepG2 cells. Consistent with in vivo findings, exogenously added rhGDF10 markedly reduced lipid accumulation in hepatocytes, resulting from exposure to the fatty acid, PA, and to the ER stress-inducing agent, TG (Fig. S1A; *, p < 0.05). Exogenously added rhGDF10 also reduced cytotoxicity resulting from the treatment of cells with ER stress-inducing agents known to cause de novo lipogenesis [28], TG and TM (Fig. S1B; *, p < 0.05).
Figure 2.

GDF10 deficiency leads to hepatic lipid accumulation. (A) Weights and macroscopic appearance of the livers from NCD-fed GDF10+/+ and GDF10−/− mice (n = 5). (B) Hepatic triglyceride and cholesterol content (n = 5). (C) H&E, perilipin and ORO staining of livers from GDF10+/+ and GDF10−/− mice fed NCD or HFD. (D) Quantification of perilipin and ORO staining using ImageJ Software (n = 5). (E) Serum triglyceride content. Scale bar, 100 μm. All data are shown as the mean ± S.D. *, p < 0.05 by unpaired two-tailed Student's t-test or one-way ANOVA.
3.3. GDF10 reduces PPARγ expression via the TGFβR1-Smad3 pathway in hepatocytes
Given the abundance of triglyceride observed in the livers of GDF10−/− mice, we next assessed the expression of established modulators of de novo lipogenesis and lipid uptake.
Previous studies have demonstrated that mouse models of steatosis exhibit increased PPARγ expression and activity [29]; thus, it was among the first markers examined. It is also well-known that naturally occurring derivatives of long-chain polyunsaturated fatty acids, including palmitic, linoleic, linolenic, and arachidonic acids, can activate PPAR receptor transcriptional activity [30], [31]. Upon assessment of these mice, IHC staining revealed an increase in PPARγ expression in the livers of NCD- and HFD-fed GDF10−/− mice compared to controls. The expression of pro-adipogenic PPARγ-responsive proteins, including C/EBPα and CD36, were also increased (Figure 3A,B; *, p < 0.05, n = 5). Immunoblot analysis of nuclear fractions from the livers of NCD- and HFD-fed mice revealed consistent findings, whereby an increase in PPARγ and C/EBPα was observed in GDF10−/− compared to GDF10+/+ mice (Figure 3C; n = 3). The mRNA transcript abundance of PPARγ and C/EBPα was also increased in the livers of NCD- and HFD-fed GDF10−/− (Figure 3D; *, p < 0.05, n = 5), as was the expression of CD36 and other PPARγ-responsive targets including FATP5, ANGPTL4, LPL, Perilipin and FSP27 (Figure 3E; *, p < 0.05, n = 5). Further examination of PPARγ using an ELISA-based transcription factor assay [32], [33] revealed a concomitant increase in the binding of PPARγ to its PPRE, indicative of increased transcriptional activity in the livers of GDF10−/− mice compared to controls (Figure 3F; *, p < 0.05, n = 5). Given its established role in the regulation of feeding and metabolism, circulating leptin was also examined in a cohort of 30 week old NCD-fed GDF10−/− mice and age-matched controls. Consistent with previous reports in which PPARγ activation was inversely correlated with leptin, we observed leptin levels to be approximately 2-fold lower in GDF10−/− mice (Fig. S2; *, p < 0.05; n = 7) [34].
Figure 3.

GDF10 deficiency increases the nuclear abundance of hepatic PPARγ and C/EBPα. (A) IHC staining of PPARγ, C/EBPα and CD36 in the livers of mice fed NCD or HFD. (B) Quantification of indicated histological staining. (C) Immunoblots of the nuclear subcellular fraction from livers of the mice fed NCD or HFD. (D) Real time PCR analysis of hepatic mRNA abundance of PPARγ, C/EBPα and (E) mRNA abundance of PPARγ-regulated genes. (F) PPARγ transcription factor activity assay. Scale bar, 100 μm. All data are shown as the mean ± S.D. *, p < 0.05 by one-way ANOVA.
To substantiate our findings on the inhibitory effect of GDF10 on PPARγ-mediated lipid droplet accumulation, cultured HepG2 and Huh7 immortalized human hepatocytes were pre-treated with rhGDF10 and exposed to CGTZ, an established glitazone agonist of PPARγ. Representative images of HepG2 cells, as well as quantification of ORO isopropanol extracts of HepG2 and Huh7 cells, demonstrate that GDF10 reduced cellular lipid content in response to CGTZ treatment (Figure 4A,B; *, p < 0.05).
Figure 4.

GDF10 modulates PPARγ nuclear abundance and transcriptional activity. (A) ORO staining and (B) extract quantification of HepG2 cells treated with PPARγ agonist, CGTZ (10 μM), or rhGDF10 (250 ng/mL) for 24 h. (C) Immunoblots of the nuclear and cytosolic subcellular fractions of Huh7 cells treated with CGTZ or rhGDF10. (D) PPARγ transcription factor activity assay after treatment with rhGDF10 or CGTZ for 1 h. (E) Immunoblots of HepG2 cells treated with IN1130 (100 nM) or rhGDF10. (F) PPARγ transcription factor activity assay in HepG2 cells transfected with either siRNA targeted against Smad3 or scrambled control siRNA and subsequently treated with CGTZ or rhGDF10. (G) Immunofluorescent staining of PPARγ and C/EBPα in Huh7 cells transfected with siRNA targeted against Smad3 and treated with rhGDF10 or CGTZ. (H) Morphology of the Huh7 cells was examined using a light microscope. (I) Immunoblots of HepG2 cells transfected with either siRNA targeted against Smad3 or scrambled control siRNA to confirm knock-down. Scale bars, 50 μm. All data are shown as the mean ± S.D. *, p < 0.05 by one-way ANOVA.
To follow up with our in vivo observations, we next examined the ability of GDF10 to modulate the nuclear abundance of C/EBPα as well as PPARγ in Huh7 cells. Consistent with the livers of GDF10−/− mice, immunoblot analysis of subcellular fractions in cultured hepatocytes revealed that GDF10 blocked the CGTZ-mediated nuclear localization of C/EBPα, and abundance of PPARγ (Figure 4C). In line with subcellular fraction data, immunofluorescent staining of HepG2 and primary human hepatocytes also demonstrated that GDF10 blocked the CGTZ-mediated nuclear localization of these transcription factors (Fig. S3A,S3B). Finally, the antagonistic effect of GDF10 on PPARγ transcriptional activity was also confirmed in HepG2 cells using the transcription factor activity assay (Figure 4D; *, p < 0.05).
We next utilized this cultured hepatocyte model to determine the mechanism by which GDF10 affects PPARγ expression and activity. Importantly, previous studies have demonstrated that (a) signaling of TGFβ through TGFβ receptor subtype-1 (TGFβR1) induces the phosphorylation of Smad3, which (b) leads to the suppression of PPARγ expression and activity [35], [36]. Furthermore, recent studies have also shown that (c) in a manner similar to TGFβ, GDF10 induces the phosphorylation of Smad3 [35]. Similar to previous studies, we observed that exogenously-added rhGDF10 induced the phosphorylation of Smad3, but only in the absence of the TGFβR1 antagonist, IN1130. Also consistent with previous studies, rhGDF10 and/or IN1130 did not affect the phosphorylation of Smad1/5/9 (Figure 4E). Using the PPARγ transcription factor assay, we next observed that rhGDF10 failed to antagonize CGTZ-mediated PPARγ activity in cells transfected with small interfering (si)RNA targeted against Smad3 (siSmad3; Figure 4F; *, p < 0.05). This observation was also confirmed via immunofluorescent staining of PPARγ and C/EBPα in Huh7 cells (Figure 4G). No marked change in cytotoxicity or cell morphology was observed in these cells (Figure 4H) and effective knockdown of Smad3 was confirmed via immunoblotting (Figure 4I). Finally, in line with these findings, we also observed that IN1130 attenuated the lipid-lowering effect of rhGDF10 in the presence of CGTZ (Fig. S4). Taken together, our results indicate that GDF10 acts to oppose PPARγ-mediated lipid accumulation in cultured hepatocyte models via TGFβR1-induced Smad3 phosphorylation.
3.4. GDF10−/− mice exhibit compensatory changes in fatty acid oxidation
Other parameters known to contribute to fatty liver and/or obesity, such as changes in lipid oxidation, biliary cholesterol excretion, energy expenditure and food consumption were also examined in GDF10−/− mice. To examine the possibility of lipid accumulation occurring as a result of reduced fatty acid oxidation, the ketogenic marker β-HB, was measured in the plasma. Interestingly, the elevated levels of β-HB observed in NCD-fed GDF10−/− mice are indicative of increased global fatty acid oxidation (Figure 5A; *, p < 0.05), likely working as a compensatory mechanism to oppose further lipid accumulation. Consistent with this result, increased hepatic mRNA transcript levels of a number of known drivers of fatty acid oxidation, including acyl-coenzyme A oxidase (ACOX1), peroxisome proliferator-activated receptor gamma coactivator 1- β (PGC1β), acyl-coenzyme A thioesterase 2 (ACOT2), peroxisome proliferator-activated receptor α (PPARα), pyruvate dehydrogenase lipoamide kinase isozyme 4 (PDK4) and acyl-coenzyme A dehydrogenase, C-4 to C-12 straight chain (ACADM) were also observed in the livers of NCD-fed GDF10−/− mice (Figure 5B; *, p < 0.05). However, no difference in respiratory exchange ratio and heat production was detected between GDF10+/+ and GDF10−/− mice (Figure 5C,D. *, p < 0.05). In addition, no difference in food consumption was observed between GDF10+/+ and GDF10−/− mice (Figure 5E. *, p < 0.05). Increased fecal cholesterol content was also observed in the GDF10−/− mice, suggesting heightened biliary cholesterol excretion (Figure 5F; *, p < 0.05). Collectively, these data suggest that despite increased liver fat content observed in GDF10−/− mice, a variety of compensatory mechanisms act in tandem to attenuate further lipid accumulation.
Figure 5.

GDF10−/− mice exhibit compensatory changes in lipid homeostasis. (A) Plasma β-HB content (n = 5). (B) Real time PCR analysis of hepatic mRNA abundance of the indicated genes. (C) Respiratory exchange ratio (D) heat production and (E) food consumption in GDF10+/+ and GDF10−/− mice fed NCD (n = 5). (F) Biliary cholesterol excretion in GDF10+/+ and GDF10−/− mice fed NCD. All data are shown as the mean ± S.D. *, p < 0.05 by unpaired two-tailed Student's t-test.
3.5. GDF10−/− mice exhibit increased UPR activation, fibrosis and liver injury
ER stress is a well-established early initiator of hepatic steatosis and is known to contribute to the progression of liver disease [7], [37], [38]. Therefore, our next aim was to assess the expression of ER stress markers in the livers of NCD- and HFD-fed GDF10−/− mice. Consistent with the observed increase in hepatic triglyceride levels, histological analysis revealed increased expression of ER stress markers, glucose regulated protein of 78 and 94 kDa (GRP78, GRP94) as well as phosphorylated (p)PERK in response to a HFD in the livers GDF10−/− mice (Figure 6A,B; *, p < 0.05). Thioflavin-S staining of misfolded protein amyloid, known to occur as a result of prolonged ER stress [9]was also increased in HFD-fed GDF10−/− mice compared to controls. Further assessment of the livers via IHC staining of fibronectin and Masson's Trichrome also revealed increased fibrosis in HFD-fed GDF10−/− mice (Figure 6A,B; *, p < 0.05, n = 5). Increased fibrosis in the livers of HFD-fed GDF10−/− mice was also independently confirmed via Picrosirius red (PSR) staining of fibrotic collagen deposition (Fig. S5A). Although a marked increase in ER stress and fibrosis markers was observed in the livers of HFD-fed GDF10−/− mice, no substantial difference was observed in the NCD-fed cohort. mRNA transcript abundance of ER stress, fibrotic, inflammatory, and apoptotic markers was also examined by real time PCR and yielded consistent findings with histological analysis (Figure 6C, D and Fig. S5B; *, p < 0.05, n = 5).
Figure 6.

Livers from GDF10−/− mice exhibit increased UPR activation, fibrosis, and inflammation. (A) IHC staining of GRP78, GRP94, pPERK and fibronectin, as well as Masson's Trichrome and Thioflavin-S in the livers of NCD- and HFD-fed mice. (B) Quantification of indicated histological staining (n = 5). Real time PCR analysis of hepatic mRNA abundance of the indicated genes involved in (C) ER stress, (D) inflammation, and fibrosis. (E) Analysis of serum ALT activity, a marker of liver injury (n = 8). Scale bars, 100 μm. All data are shown as the mean ± S.D. *, p < 0.05 by one-way ANOVA.
Hepatic insulin resistance represents another hallmark feature of liver disease. Thus, markers of hepatic gluconeogenesis were assessed via real time PCR. Interestingly, the gluoconeogenic markers induced in the livers GDF10−/− mice, including signal transducer and activator of transcription 3 (STAT3), CREB-regulated transcription cofactor 2 (CRTC2), forkhead box protein O1 (FOXO1) and phosphoenolpyruvate carboxykinase 1 (PCK1) are also known to be upregulated by conditions of ER stress (Fig. S5C; *, p < 0.05) [39]. Finally, the enzymatic activity of circulating ALT was increased in the HFD-fed GDF10−/− mice compared to NCD-fed controls, which is indicative of liver injury (Figure 6E; *, p < 0.05). Collectively, these data provide compelling evidence of heightened ER stress in the livers GDF10−/− mice and highlight the ability of GDF10 to attenuate diet-induced liver injury.
3.6. ER stress increases circulating and adipose GDF10 levels
Given the role of GDF10 in the regulation of hepatic triglyceride levels and injury, our final aim was to assess the effect of diet-induced stress on GDF10 expression in GDF10+/+ mice. Similar to findings demonstrating a positive correlation between circulating GDF15 levels and hepatic ER stress [24], we also observed increased plasma GDF10 levels in HFD-fed GDF10+/+ and in wild-type mice injected with the ER stress-inducing agent, TM (Figure 7A; *, p < 0.05, n = 7). Because GDF10 is primarily expressed in adipose tissue, we also examined whether TM affects GDF10 expression in 3T3-L1 adipocytes at day 10 of differentiation (Fig. S6; *, p < 0.05, n = 5) and in GAT from HFD-fed mice (Figure 7B; n = 7). Similar to secreted levels, an increase in GDF10 expression was observed in response to TM in 3T3-L1 adipocytes and in the GAT from HFD-fed GDF10+/+ mice. We also report the surprising finding that GAT-resident macrophages in HFD-fed mice express abundant levels of GDF10 (Figure 7B); an observation that was not present in GAT from NCD-fed mice. Collectively, these data suggest that during conditions of diet-induced stress, adipose tissue promotes the expression of GDF10 to attenuate further triglyceride accumulation in the liver as a response to injury.
Figure 7.

ER stress increases GDF10 abundance in GAT and in circulation. (A) Plasma content of circulating GDF10 in mice fed NCD or HFD for 12 weeks (n = 5), and mice treated with a bolus injection of TM (250 μg/kg - 24 h; n = 5). (B) IHC staining of GRP78, GRP94 and GDF10 in the GAT of mice fed NCD or HFD. Scale bars, 100 μm. A and M indicate adipocytes and macrophages, respectively. All data are shown as the mean ± S.D. *, p < 0.05 by one-way ANOVA.
4. Discussion
A growing body of evidence suggests that GDF10, in addition to being a key modulator of osteogenesis, also plays a critical role in adipose lipid metabolism [20], [21]. To the best of our knowledge, however, the functional importance of GDF10 in liver lipid metabolism has not yet been evaluated. Here, we demonstrate that GDF10−/− mice exhibit increased adiposity, as well as increased body weight and hepatic triglyceride and cholesterol levels; an early feature in the development of diet-induced liver disease [3]. We also observed that severe lipid accumulation in the livers of HFD-fed GDF10−/− mice was associated with a substantial induction of a variety of ER stress markers and concomitant liver injury. Additional hallmark characteristics of liver disease, such as apoptosis, inflammation, fibrosis and changes in gluconeogenic gene expression, were also observed in the livers of HFD-fed GDF10−/− mice.
To explain these findings, we examined a number of metabolic parameters and expression of genes known to alter lipid metabolism. Despite elevated body weight and adiposity, an increase in global fatty acid oxidation was observed in GDF10−/− mice. Given that this finding is in mechanistic contrast to the obese phenotype in the mice, these findings suggest that heightened fatty acid oxidation likely occurred as a compensatory response to attenuate further fat accumulation. In line with these data, an increase in biliary cholesterol excretion was also identified. To this end, we observed an increase in the expression of key modulators of adipogenesis and well-known drivers of NAFLD, such as PPARγ and C/EBPα, in the livers of GDF10−/− mice. Upon further analysis using cultured hepatocytes, exogenously added rhGDF10 reduced the abundance and transcriptional activity of PPARγ, and also blocked PPARγ agonist-driven lipid accumulation. Lastly, we have also demonstrated that GDF10 inhibits PPARγ transcriptional activity via the conventional TGFβR1-Smad3 signaling cascade. Collectively, these data suggest that GDF10 is a potent antagonist of PPARγ and can protect from diet-induced hepatic steatosis.
Several groups have recently demonstrated the involvement of multiple TGFβ superfamily members in the pathogenesis of obesity-related diseases such as type 2 diabetes and NAFLD [40], [41], [42]. In clinical studies, GDF15 expression correlates with a variety of metabolic disorders, including obesity, insulin resistance and the risk of cardiovascular events [43]. GDF15−/− mice also exhibit increased body weight and peripheral lipid accumulation following a metabolic challenge, whereas overexpression of this protein led to reduced body weight and improved metabolic parameters [44], [45]. Similar to GDF15−/− mice, GDF10−/− mice have increased body weight and adiposity, a phenotype that unlike GDF15−/− mice, does not require a metabolic stimulus such as a HFD. Our findings are also consistent with studies in which overexpression of GDF10 in mice led to a reduction in adiposity and improved metabolic outcomes [21].
Activation of the TGFβ signaling cascade has been shown to differentially modulate the expression of lipogenic markers, based on tissue/cell-specific expression, and unique molecular interactions with a variety of inhibitory molecules and receptor–ligand complexes. TGFβ signaling has been shown to induce lipogenesis, inflammation and cell death via Smad2/3 [42], while also blocking PPARγ expression, activity and lipogenesis in a manner dependent on β-catenin [46]. Overexpression of Smad3 and its partner Smad4 has been shown to reduce PPARγ promoter activity in aortic smooth muscle cells [47]. Furthermore, TGFβ suppresses PPARγ expression and activity via Smad3/4 binding to the inhibitory element in the PPAR promoter region in lung fibroblasts [36]. Given that GDF10 can induce the phosphorylation and activation of Smad3, but also block the transcriptional activation of PPARγ, our data suggest that in a manner similar to TGFβ, GDF10 reduces PPARγ activity in a Smad3-dependent manner.
PPARγ activation is necessary and sufficient to induce adipocyte differentiation. Studies have demonstrated that (a) selective ablation of PPARγ, using a tamoxifen-dependent recombination system in mice, led to the death of adipocytes only a few days following treatment [48], and (b) AAV-mediated hepatic overexpression of PPARγ2 in mice promoted an adipose-like phenotype in hepatocytes by inducing the expression of pro-adipogenic mediators, such as adipsin, adiponectin, and aP2, which resulted in severe steatosis [49]. Moreover, previous studies have also demonstrated that hepatic PPARγ is robustly induced in the livers of patients, as well as in pre-clinical models of NAFLD [13], [49]. Conversely, PPARγ deletion in mouse hepatocytes has been shown to attenuate intracellular lipid accumulation [50]. Consistent with our studies, it is also well-established that exposure of mice to a HFD promotes the expression of hepatic PPARγ and a variety of its downstream targets [51]. In addition to PPARγ, we also observed increased expression and nuclear localization of C/EBPα in the livers of GDF10−/− mice compared to the GDF10+/+ controls. C/EBPα is also known to play a crucial role in adipocyte differentiation, and similar to PPARγ, its expression is both necessary and sufficient for adipogenesis [52]. Studies also demonstrate that C/EBPα can directly regulate PPARγ promoter activity [53] and has been described as a critical and obligate regulator of PPARγ expression [54]. Furthermore, PPARγ and C/EBPα mutually induce each other's expression in order to promote adipogenesis [53], [55], [56] Given the cross-talk that occurs between these two master regulators of adipogenesis, it remains unclear which of the two, or whether both are directly affected by GDF10.
In summary, we demonstrate that GDF10 is an essential modulator of hepatic lipid homeostasis and is crucial for the maintenance of hepatic lipid turnover. GDF10 knockout leads to hepatic steatosis in NCD-fed mice, as well as severe steatosis, inflammation, fibrosis, and ER stress in response to a HFD. Given that most diet-induced models of liver disease fail to recapitulate fibrosis, a key marker of NASH, in this report we also describe a new genetic model for the study of liver disease. Furthermore, conditions that cause hepatic and/or adipocyte lipid accumulation also induced a compensatory increase in circulating GDF10 levels in GDF10-expressing control mice. Additional tissue-specific knockdown studies, however, are required to confirm the origin of circulating GDF10 in the context of diet-induced NAFLD. Future studies examining the correlation between polymorphisms in the GDF10 gene and the prevalence of obesity and/or NAFLD may also yield interesting findings. Overall, we identify circulating GDF10 as a novel regulator of liver lipid metabolism and demonstrate that in a manner similar to GDF15, this adipokine could be utilized for the management of metabolic disorders.
Financial support
This work was supported in part by research grants to Richard C. Austin from the Heart and Stroke Foundation of Canada (G-13-0003064 and G-15-0009389) and the Canadian Institutes of Health Research (74477, 111239). Financial support from the Research Institute of St. Joe’s Hamilton is acknowledged. Richard C. Austin is a Career Investigator of the Heart and Stroke Foundation of Ontario and holds the Amgen Canada Research Chair in the Division of Nephrology at St. Joseph's Healthcare Hamilton and McMaster University. Kenneth N. Maclean gratefully acknowledges financial support from the William R. Hummel Homocystinuria Research Fund and holds the Ehst-Hummel-Kaufmann Family Endowed Chair in Inherited Metabolic Disease.
Author contributions
KP, PL, and RCA conceived the studies and wrote the manuscript. KP, PL, JHB, SVP, EAD, MEM, and AMB performed all of the in vitro and in vivo studies. The manuscript was revised by KNM and JCK.
Footnotes
Supplementary data to this article can be found online at https://doi.org/10.1016/j.molmet.2019.06.021.
Conflict of interest
The authors declare that they have no conflicts of interest with the contents of this article.
Appendix A. Supplementary data
The following is the Supplementary data to this article:
References
- 1.Gonzalez-Muniesa P., Martinez-Gonzalez M.A., Hu F.B., Despres J.P., Matsuzawa Y., Loos R.J.F. Obesity. Nature Reviews Disease Primers. 2017;3:17034. doi: 10.1038/nrdp.2017.34. [DOI] [PubMed] [Google Scholar]
- 2.Perry R.J., Samuel V.T., Petersen K.F., Shulman G.I. The role of hepatic lipids in hepatic insulin resistance and type 2 diabetes. Nature. 2014;510:84–91. doi: 10.1038/nature13478. [DOI] [PMC free article] [PubMed] [Google Scholar]
- 3.Brunt E.M., Wong V.W., Nobili V., Day C.P., Sookoian S., Maher J.J. Nonalcoholic fatty liver disease. Nature reviews Disease primers. 2015;1:15080. doi: 10.1038/nrdp.2015.80. [DOI] [PubMed] [Google Scholar]
- 4.Angulo P. Nonalcoholic fatty liver disease. New England Journal of Medicine. 2002;346:1221–1231. doi: 10.1056/NEJMra011775. [DOI] [PubMed] [Google Scholar]
- 5.Kim J.Y., Garcia-Carbonell R., Yamachika S., Zhao P., Dhar D., Loomba R. ER stress drives lipogenesis and steatohepatitis via caspase-2 activation of S1P. Cell. 2018;75:133–145 e115. doi: 10.1016/j.cell.2018.08.020. [DOI] [PMC free article] [PubMed] [Google Scholar]
- 6.Ashraf N.U., Sheikh T.A. Endoplasmic reticulum stress and oxidative stress in the pathogenesis of non-alcoholic fatty liver disease. Free Radical Research. 2015;49:1405–1418. doi: 10.3109/10715762.2015.1078461. [DOI] [PubMed] [Google Scholar]
- 7.Puri P., Mirshahi F., Cheung O., Natarajan R., Maher J.W., Kellum J.M. Activation and dysregulation of the unfolded protein response in nonalcoholic fatty liver disease. Gastroenterology. 2008;134:568–576. doi: 10.1053/j.gastro.2007.10.039. [DOI] [PubMed] [Google Scholar]
- 8.Zeng L., Lu M., Mori K., Luo S., Lee A.S., Zhu Y. ATF6 modulates SREBP2-mediated lipogenesis. The EMBO Journal. 2004;23:950–958. doi: 10.1038/sj.emboj.7600106. [DOI] [PMC free article] [PubMed] [Google Scholar]
- 9.Zhou H., Liu R. ER stress and hepatic lipid metabolism. Frontiers in Genetics. 2014;5:112. doi: 10.3389/fgene.2014.00112. [DOI] [PMC free article] [PubMed] [Google Scholar]
- 10.Bobrovnikova-Marjon E., Hatzivassiliou G., Grigoriadou C., Romero M., Cavener D.R., Thompson C.B. PERK-dependent regulation of lipogenesis during mouse mammary gland development and adipocyte differentiation. Proceedings of the National Academy of Sciences of the United States of America. 2008;105:16314–16319. doi: 10.1073/pnas.0808517105. [DOI] [PMC free article] [PubMed] [Google Scholar]
- 11.Matsusue K., Kusakabe T., Noguchi T., Takiguchi S., Suzuki T., Yamano S. Hepatic steatosis in leptin-deficient mice is promoted by the PPAR gamma target gene Fsp27. Cell Metabolism. 2008;7:302–311. doi: 10.1016/j.cmet.2008.03.003. [DOI] [PMC free article] [PubMed] [Google Scholar]
- 12.Lee Y.J., Ko E.H., Kim J.E., Kim E., Lee H., Choi H. Nuclear receptor PPARγ-regulated monoacylglycerol O-acyltransferase 1 (MGAT1) expression is responsible for the lipid accumulation in diet-induced hepatic steatosis. Proceedings of the National Academy of Sciences of the United States of America. 2012;109:13656–13661. doi: 10.1073/pnas.1203218109. [DOI] [PMC free article] [PubMed] [Google Scholar]
- 13.Pettinelli P., Videla L.A. Up-regulation of PPAR-γ mRNA expression in the liver of obese patients: an additional reinforcing lipogenic mechanism to SREBP-1c induction. Journal of Clinical Endocrinology & Metabolism. 2011;96:1424–1430. doi: 10.1210/jc.2010-2129. [DOI] [PubMed] [Google Scholar]
- 14.Zhang X.Q., Xu C.F., Yu C.H., Chen W.X., Li Y.M. Role of endoplasmic reticulum stress in the pathogenesis of nonalcoholic fatty liver disease. World Journal of Gastroenterology. 2014;20:1768–1776. doi: 10.3748/wjg.v20.i7.1768. [DOI] [PMC free article] [PubMed] [Google Scholar]
- 15.Matsumoto Y., Otsuka F., Hino J., Miyoshi T., Takano M., Miyazato M. Bone morphogenetic protein-3b (BMP-3b) inhibits osteoblast differentiation via Smad2/3 pathway by counteracting Smad1/5/8 signaling. Molecular and Cellular Endocrinology. 2012;350:78–86. doi: 10.1016/j.mce.2011.11.023. [DOI] [PubMed] [Google Scholar]
- 16.Zhao R., Lawler A.M., Lee S.J. Characterization of GDF-10 expression patterns and null mice. Developmental Biology. 1999;212:68–79. doi: 10.1006/dbio.1999.9326. [DOI] [PubMed] [Google Scholar]
- 17.Tseng Y.H., Kokkotou E., Schulz T.J., Huang T.L., Winnay J.N., Taniguchi C.M. New role of bone morphogenetic protein 7 in brown adipogenesis and energy expenditure. Nature. 2008;454:1000–1004. doi: 10.1038/nature07221. [DOI] [PMC free article] [PubMed] [Google Scholar]
- 18.Schulz T.J., Tseng Y.H. Emerging role of bone morphogenetic proteins in adipogenesis and energy metabolism. Cytokine & Growth Factor Reviews. 2009;20:523–553. doi: 10.1016/j.cytogfr.2009.10.019. [DOI] [PMC free article] [PubMed] [Google Scholar]
- 19.Zamani N., Brown C.W. Emerging roles for the transforming growth factor-β superfamily in regulating adiposity and energy expenditure. Endocrine Reviews. 2011;32:387–403. doi: 10.1210/er.2010-0018. [DOI] [PMC free article] [PubMed] [Google Scholar]
- 20.Hino J., Miyazawa T., Miyazato M., Kangawa K. Bone morphogenetic protein-3b (BMP-3b) is expressed in adipocytes and inhibits adipogenesis as a unique complex. International Journal of Obesity. 2012;36:725–734. doi: 10.1038/ijo.2011.124. [DOI] [PMC free article] [PubMed] [Google Scholar]
- 21.Hino J., Nakatani M., Arai Y., Tsuchida K., Shirai M., Miyazato M. Overexpression of bone morphogenetic protein-3b (BMP-3b) in adipose tissues protects against high-fat diet-induced obesity. International Journal of Obesity. 2017;41:483–488. doi: 10.1038/ijo.2017.15. [DOI] [PubMed] [Google Scholar]
- 22.Chrysovergis K., Wang X., Kosak J., Lee S.H., Kim J.S., Foley J.F. NAG-1/GDF-15 prevents obesity by increasing thermogenesis, lipolysis and oxidative metabolism. International Journal of Obesity. 2014;38:1555–1564. doi: 10.1038/ijo.2014.27. [DOI] [PMC free article] [PubMed] [Google Scholar]
- 23.Li D., Zhang H., Zhong Y. Hepatic GDF15 is regulated by CHOP of the unfolded protein response and alleviates NAFLD progression in obese mice. Biochemical and Biophysical Research Communications. 2018;498:388–394. doi: 10.1016/j.bbrc.2017.08.096. [DOI] [PubMed] [Google Scholar]
- 24.Tsai V.W.W., Husaini Y., Sainsbury A., Brown D.A., Breit S.N. The MIC-1/GDF15-GFRAL pathway in energy homeostasis: implications for obesity, cachexia, and other associated diseases. Cell Metabolism. 2018;28:353–368. doi: 10.1016/j.cmet.2018.07.018. [DOI] [PubMed] [Google Scholar]
- 25.Polyzos S.A., Kountouras J., Mantzoros C.S. Adipokines in nonalcoholic fatty liver disease. Metabolism Clinical and Experimental. 2016;65:1062–1079. doi: 10.1016/j.metabol.2015.11.006. [DOI] [PubMed] [Google Scholar]
- 26.Lebeau P., Platko K., Al-Hashimi A.A., Byun J.H., Lhotak S., Holzapfel N. Loss-of-function PCSK9 mutants evade the unfolded protein response sensor GRP78 and fail to induce endoplasmic reticulum stress when retained. Journal of Biological Chemistry. 2018;293:7329–7343. doi: 10.1074/jbc.RA117.001049. [DOI] [PMC free article] [PubMed] [Google Scholar]
- 27.Lebeau P.F., Byun J.H., Platko K., MacDonald M.E., Poon S.V., Faiyaz M. Diet-induced hepatic steatosis abrogates cell-surface LDLR by inducing de novo PCSK9 expression in mice. Journal of Biological Chemistry. 2019;294:9037–9047. doi: 10.1074/jbc.RA119.008094. [DOI] [PMC free article] [PubMed] [Google Scholar]
- 28.Lee J.S., Zheng Z., Mendez R., Ha S.W., Xie Y., Zhang K. Pharmacologic ER stress induces non-alcoholic steatohepatitis in an animal model. Toxicology Letters. 2012;211:29–38. doi: 10.1016/j.toxlet.2012.02.017. [DOI] [PMC free article] [PubMed] [Google Scholar]
- 29.Gross B., Pawlak M., Lefebvre P., Staels B. PPARs in obesity-induced T2DM, dyslipidaemia and NAFLD. Nature Reviews Endocrinology. 2017;13:36–49. doi: 10.1038/nrendo.2016.135. [DOI] [PubMed] [Google Scholar]
- 30.Bocos C., Göttlicher M., Gearing K., Banner C., Enmark E., Teboul M. Fatty acid activation of peroxisome proliferator-activated receptor (PPAR) The Journal of Steroid Biochemistry and Molecular Biology. 1995;53:467–473. doi: 10.1016/0960-0760(95)00093-f. [DOI] [PubMed] [Google Scholar]
- 31.Krey G., Braissant O., L'Horset F., Kalkhoven E., Perroud M., Parker M.G. Fatty acids, eicosanoids, and hypolipidemic agents identified as ligands of peroxisome proliferator-activated receptor by coactivator-dependent receptor ligand assay. Molecular Endocrinology. 1997;6:779–791. doi: 10.1210/mend.11.6.0007. [DOI] [PubMed] [Google Scholar]
- 32.Ahmad I., Mui E., Galbraith L., Patel R., Tan E.H., Salji M. Sleeping beauty screen revealed pparg activation in metastatic prostate cancer. Proceedings of the National Academy of Sciences. 2016;29:8290–8295. doi: 10.1073/pnas.1601571113. [DOI] [PMC free article] [PubMed] [Google Scholar]
- 33.Jiang Y., Thakran S., Bheemreddy R., Ye E.A., He H., Walker R.J. Pioglitazone normalizes insulin signaling in the diabetic rat retina through reduction in tumor necrosis factor α and suppressor of cytokine signaling 3. Journal of Biological Chemistry. 2014;289:26395–26405. doi: 10.1074/jbc.M114.583880. [DOI] [PMC free article] [PubMed] [Google Scholar]
- 34.De Vos P., Lefebvre A.M., Miller S.G., Guerre-Millo M., Wong K., Saladin R. Thiazolidinediones repress ob gene expression in rodents via activation of peroxisome proliferator-activated receptor gamma. Journal of Clinical Investigation. 1996;98:1004–1009. doi: 10.1172/JCI118860. [DOI] [PMC free article] [PubMed] [Google Scholar]
- 35.Upadhyay G., Yin Y., Yuan H., Derynch R., Glazer R.I. Stem cell antigen-1 enhances tumorigenicity by disruption of growth differentiation factor-10 (GDF10)-dependent TGF-β signaling. Proceedings of the National Academy of Sciences of the United States of America. 2011;108:7820–7825. doi: 10.1073/pnas.1103441108. [DOI] [PMC free article] [PubMed] [Google Scholar]
- 36.Lakshmi S.P., Reddy A.T., Reddy R.C. Transforming growth factor β suppresses peroxisome proliferator-activated receptor γ expression via both SMAD binding and novel TGF- β inhibitory elements. Biochemical Journal. 2017;474:1531–1546. doi: 10.1042/BCJ20160943. [DOI] [PMC free article] [PubMed] [Google Scholar]
- 37.Wang D., Wei Y., Pagliassotti M.J. Saturated fatty acids promote endoplasmic reticulum stress and liver injury in rats with hepatic steatosis. Endocrinology. 2006;147:943–951. doi: 10.1210/en.2005-0570. [DOI] [PubMed] [Google Scholar]
- 38.Bashiri A., Nesan D., Tavallaee G., Sue-Chu-Lam I., Chien K., Maguire G.F. Cellular cholesterol accumulation modulates high fat high sucrose (HFHS) diet-induced ER stress and hepatic inflammasome activation in the development of non-alcoholic steatohepatitis. Biochemica et Biophysica Acta. 2016;1861:594–605. doi: 10.1016/j.bbalip.2016.04.005. [DOI] [PubMed] [Google Scholar]
- 39.Kim O.K., Jun W., Lee J. Mechanism of ER Stress and inflammation for hepatic insulin resistance in obesity. Annals of Nutrition & Metabolism. 2015;67:218–227. doi: 10.1159/000440905. [DOI] [PubMed] [Google Scholar]
- 40.Yadav H., Quijano C., Kamaraju A.K., Gavrilova O., Malek R., Chen W. Protection from obesity and diabetes by blockade of TGF-β/Smad3 signaling. Cell Metabolism. 2011;14:67–79. doi: 10.1016/j.cmet.2011.04.013. [DOI] [PMC free article] [PubMed] [Google Scholar]
- 41.Margoni A., Fotis L., Papavassiliou A.G. The transforming growth factor-beta/bone morphogenetic protein signalling pathway in adipogenesis. The International Journal of Biochemistry & Cell Biology. 2012;44:475–479. doi: 10.1016/j.biocel.2011.12.014. [DOI] [PubMed] [Google Scholar]
- 42.Yang L., Roh Y.S., Song J., Zhang B., Liu C., Loomba R. Transforming growth factor beta signaling in hepatocytes participates in steatohepatitis through regulation of cell death and lipid metabolism in mice. Hepatology. 2014;59:483–495. doi: 10.1002/hep.26698. [DOI] [PMC free article] [PubMed] [Google Scholar]
- 43.Kempf T., Guba-Quint A., Torgerson J., Magnone M.C., Haefliger C., Bobadilla M. Growth differentiation factor 15 predicts future insulin resistance and impaired glucose control in obese nondiabetic individuals: results from the XENDOS trial. European Journal of Endocrinology. 2012;167:671–678. doi: 10.1530/EJE-12-0466. [DOI] [PubMed] [Google Scholar]
- 44.Macia L., Tsai V.W., Nguyen A.D., Johnen H., Kuffner T., Shi Y.C. Macrophage inhibitory cytokine 1 (MIC-1/GDF15) decreases food intake, body weight and improves glucose tolerance in mice on normal & obesogenic diets. PLoS One. 2012;7:e34868. doi: 10.1371/journal.pone.0034868. [DOI] [PMC free article] [PubMed] [Google Scholar]
- 45.Kim J.M., Kosak J.P., Kim J.K., Kissling G., Germolec D.R., Zeldin D.C. NAG-1/GDF15 transgenic mouse has less white adipose tissue and a reduced inflammatory response. Mediators of Inflammation. 2013;2013:641851. doi: 10.1155/2013/641851. [DOI] [PMC free article] [PubMed] [Google Scholar]
- 46.Qian J., Niu M., Zhai X., Zhou Q., Zhou Y. Beta-catenin pathway is required for TGF-β1 inhibition of PPARγ expression in cultured hepatic stellate cells. Pharmacological Research. 2012;66:219–225. doi: 10.1016/j.phrs.2012.06.003. [DOI] [PubMed] [Google Scholar]
- 47.Fu M., Zhang J., Lin Y., Zhu X., Zhao L., Ahmad M. Early stimulation and late inhibition of peroxisome proliferator-activated receptor gamma (PPAR gamma) gene expression by transforming growth factor beta in human aortic smooth muscle cell: role of early growth-response factor-1 (Egr-1), activator protein 1 (AP1) and Smads. Biochemical Journal. 2003;370:1019–1025. doi: 10.1042/BJ20021503. [DOI] [PMC free article] [PubMed] [Google Scholar]
- 48.Imai T., Takakuwa R., Marchand S., Dentz E., Bornert J.M., Messaddeq N. Peroxisome proliferator-activated receptor gamma is required in mature white and brown adipocytes for their survival in the mouse. Proceedings of the National Academy of Sciences of the United States of America. 2004;101:4543–4547. doi: 10.1073/pnas.0400356101. [DOI] [PMC free article] [PubMed] [Google Scholar]
- 49.Yu S., Matsusue K., Kashireddy P., Cao W.Q., Yeldandi V., Yeldandi A.V. Adipocyte-specific gene expression and adipogenic steatosis in the mouse liver due to peroxisome proliferator-activated receptor γ1 (PPARγ1) overexpression. Journal of Biological Chemistry. 2003;278:498–505. doi: 10.1074/jbc.M210062200. [DOI] [PubMed] [Google Scholar]
- 50.Moran-Salvador E., Lopez-Parr M., Garcia-Alonso V., Titos E., Martinez-Clemente M., Gonzalez-Periz A. Role of PPARγ in obesity-induced hepatic steatosis as determined by hepatocyte- and macrophage-specific conditional knockouts. Federation of American societies of Experimental Biology. 2011;25:2538–2550. doi: 10.1096/fj.10-173716. [DOI] [PubMed] [Google Scholar]
- 51.Inoue M., Ohtake T., Motomura W., Takahashi N., Hosoki Y., Miyoshi S. Increased expression of PPARγ in high fat diet-induced liver steatosis in mice. Biochemical and Biophysical Research Communications. 2005;336:215–222. doi: 10.1016/j.bbrc.2005.08.070. [DOI] [PubMed] [Google Scholar]
- 52.Lane M.D., Tang Q.Q., Jiang M.S. Role of the CCAAT enhancer binding proteins (C/EBPs) in adipocyte differentiation. Biochemical and Biophysical Research Communications. 1999;3:677–683. doi: 10.1006/bbrc.1999.1885. [DOI] [PubMed] [Google Scholar]
- 53.Clarke S.L., Robinson C.E., Gimble J.M. CAAT/enhancer binding proteins directly modulate transcription from the peroxisome proliferator-activated receptor γ2 promoter. Biochemical and Biophysical Research Communications. 1997;1:99–103. doi: 10.1006/bbrc.1997.7627. [DOI] [PubMed] [Google Scholar]
- 54.Madsen M.S., Siersbaek R., Boergesen M., Nielsen R., Mandrup S. Peroxisome proliferator-activated receptor gamma and C/EBPalpha synergistically activate key metabolic adipocyte genes by assisted loading. Molecular and Cellular Biology. 2014;34:939–954. doi: 10.1128/MCB.01344-13. [DOI] [PMC free article] [PubMed] [Google Scholar]
- 55.Wu Z., Rosen E., Brun R., Hauser S., Adelmant G., Troy A. Cross regulation of C/EBPα and PPARγ controls the transcriptional pathway of adipogenesis and insulin sensitivity. Molecular Cell. 1999;3:151–158. doi: 10.1016/s1097-2765(00)80306-8. [DOI] [PubMed] [Google Scholar]
- 56.Elberg G., Gimble J., Tsai S. Modulation of the murine peroxisome proliferator-activated receptor γ2promoter activity by CCAAT/enhancer-binding proteins. Journal of Biological Chemistry. 2000;275:27815–27822. doi: 10.1074/jbc.M003593200. [DOI] [PubMed] [Google Scholar]
Associated Data
This section collects any data citations, data availability statements, or supplementary materials included in this article.