Abstract
Colorectal cancer (CRC) is the third most common cancer and a leading cause of cancer-associated mortality globally. Increasing evidence has indicated that structural maintenance of chromosomes 1 (SMC1) may serve an important role in solid tumors as a tumor enhancer. In the present study, it was identified via reverse transcription-quantitative PCR and western blot analyses that expression of SMC1 was significantly upregulated in CRC cell lines (SW480, HCT-116 and SW620) compared with NCM460 normal epithelial cells. To determine the potential involvement of SMC1 in the malignant phenotypes of CRC cells, SMC1 was knocked down in SW620 cells and SMC1 was overexpressed in SW480 cells in vitro. As a result, cell viability, proliferation, invasion and migration were suppressed in transduced SW620 cells but enhanced in SW480 cells, as determined using MTT, colony formation and Transwell assays; conversely, flow cytometric analysis revealed that cell apoptosis was increased in SW620 cells and inhibited in SW480 cells following lentiviral infection. In addition, an in vivo mouse xenograft model revealed that knocking down SMC1 suppressed tumor growth and increased apoptosis; however, overexpressing SMC1 enhanced tumor growth and suppressed apoptosis. Further experiments demonstrated that the role of SMC1 on CRC may involve downregulation of the NF-κB-associated signaling pathway. Finally, the present data from clinical CRC tumor samples showed that increased expression of SMC1 was significantly associated with distant metastasis, higher TNM stage, primary tumor size, lymph node metastasis and worse overall survival. Collectively, the present results suggested that SMC1 served an important role in the development of CRC and may be a predictive prognostic biomarker in patients with CRC.
Keywords: colorectal cancer, structural maintenance of chromosomes 1, proliferation, apoptosis, NF-κB
Introduction
Colorectal cancer (CRC) is one of the most common malignant tumors globally, with >1 million new cases diagnosed annually (1). The 5-year survival rate for patients at the early stage of CRC is 90.3%, but the survival rate drops to 50–70.4% once metastasis occurs (2). Various genetic alterations have been reported to promote the initiation and progression of CRC; however, the molecular mechanisms leading to CRC development and progression remain unclear (3). Exploring molecular and genetic changes in CRC and the underlying oncogenic mechanisms has attracted increasing attention in tumor research. Genomic instability is widely regarded as the hallmark of cancer, and is considered to decrease the viability of cells, permit genetic changes and lead to cancer cells evading immune surveillance (4,5). Genomic instability has various causes, of which chromosomal instability (CIN) and microsatellite instability have received the most focus (6). In CRC, CIN is the most common form of genomic instability, which occurs in nearly 80–85% of patients with CRC (7). Current research in the field is focused on elucidating the molecular basis of CIN, including the possible roles of defects in the spindle checkpoint and other regulators of mitosis. CIN has been reported to be crucial in precancerous development as well as cancer evolution (8). It is also associated with the prognosis of CRC (9). A recent study demonstrated that CIN affected the efficacy of chemotherapy and immunotherapy in CRC (10); however, the mechanisms underlying CIN in CRC are yet to be elucidated. Therefore, exploring the molecular mechanisms of CIN for the development of novel tumor markers and therapeutic targets is a high priority.
The structural maintenance of chromosomes 1 (SMC1) gene is a member of the SMC family that serves critical roles in organizing and stabilizing chromosomal segregation during mitosis, and is considered to be a component of the signaling network involved in the maintenance of genome stability (11). The SMC1 protein is an evolutionarily-conserved multifunctional protein known for its role in sister chromatid cohesion (12), DNA recombination and repair (13), and cell cycle checkpoint activation by ionizing radiation (14), ultraviolet light and other genotoxic agents (15). SMC1 forms a heterodimeric cohesion complex with SMC3 that encircles and mediates sister chromatid cohesion DNA replication in S phase until chromosome separation, which occurs in anaphase (16). Cohesin-associated genes have been reported to be potential drivers of tumor genomic instability; progression and mutations in various subunits of cohesin have been identified in sarcoma, melanoma, colon and glioblastoma tumors (17). Kitagawa et al (18) demonstrated that the expression of SMC1 was significantly increased in triple-negative breast cancer, and SMC1 binding with BRCA1 is proposed to be important for genomic stability, regulating tumor development and progression; however, the significance and the underlying mechanisms responsible for the aberrant expression of SMC1 in CRC remain unknown.
In the present study, it was demonstrated that SMC1 was significantly upregulated in CRC cell lines. The role of knocking down or overexpressing SMC1 was tested by cell proliferation and apoptosis assays in CRC cells. The present results provided evidence that abnormal SMC1 expression may serve a direct role in carcinoma progression and could be used for predicting therapeutic outcomes of CRC.
Materials and methods
Cell culture
The colon cancer cell lines, SW480, SW620 and HCT116, the human normal colonic epithelial cells NCM460, and 293T cells were obtained from The Cell Bank of Shanghai Institute of Biochemistry and Cell Biology, Chinese Academy of Sciences. The cells were routinely maintained in DMEM (Gibco; Thermo Fisher Scientific, Inc.) supplemented with 10% FBS (Gibco; Thermo Fisher Scientific, Inc.) and 1% penicillin/streptomycin, and incubated at 37°C in an atmosphere of 95% air and 5% CO2.
Cell viability assay
Cell viability was measured by an MTT assay. Cells were seeded in 96-well plates at a density of 3,000-5,000 cells/well and cultured overnight. For the assay, 20 µl MTT solution (5 mg/ml; Sigma-Aldrich; Merck KGaA) was added to each well and incubated for a further 2–4 h at 37°C. Then, the medium was discarded and 100 µl DMSO was added to dissolve the resulting formazan crystals. For the colorimetric analysis, the optical density (OD) value at 490 nm was measured using a Multiskan Spectrum UV/visible Microplate Reader (Thermo Fisher Scientific, Inc.).
Lentiviral vector construction and transfection
The SMC1 short hairpin RNA (shRNA; shSMC1) and the negative control shRNA (shCont) were synthesized (Shanghai GeneChem Co., Ltd.): shSMC1 sequence, 5′-TAGGAGGTTCTTCTGAGTACA-3′; shCont sequence, 5′-GGAGGTTCTTCTGAGTACA-3′. They were inserted into a pGCSIL-GFP vector (Shanghai GeneChem Co., Ltd.) using AgeI and EcoRI restriction sites, and then transfected into 293T cells (30–50% confluence) together with lentiviral helper plasmid pHelper1.0 and pHelper2.0 using Lipofectamine® 2000 (Invitrogen; Thermo Fisher Scientific, Inc.), according to the manufacturer's protocol. Recombinant lentiviruses containing shSMC1 or the shCont were prepared and titrated to 1×10⁷ TU/ml for transfection. SW620 cells (60% confluence) were plated and infected with lentiviruses expressing shSMC1/shCont for 48 h using Lipofectamine 2000, followed by puromycin selection (6 µg/ml). Fluorescence microscopy (Eclipse E600; Nikon Corporation), reverse transcription-quantitative PCR (RT-qPCR) and western blot analyses were performed to verify knockdown efficiency, and cells were allocated for different assays.
For SMC1 overexpression, a pTango-SMC1 plasmid was purchased from Synbio Technologies LLC. Then, primers targeting SMC1 fragments for PCR amplification were designed, and NheI and SwaI restriction sites were added to the 5′ and 3′ ends of the primers, respectively. The primer sequences for PCR were forward, 5′-AGGCTAGCGGAGCAGCAGCAGATTGAG-3′ and reverse, 5′-GGATTTAAATTCTCTTCTTCCATCCGTTCTTC-3′, and PCR amplification was performed using pTango-SMC1 plasmid (200 ng) as a PCR template and Taq DNA polymerase (Vazyme Biotech) under the following conditions: 94°C for 3 min, then 34 cycles of 94°C for 15 sec, 56°C for 30 sec and 72°C for 90 sec, with a final elongation at 72°C for 5 min. The amplification products were visualized by 2% agarose gel electrophoresis and purified using a gel extraction kit (Omega Bio-Tek, Inc.), then digested by NheI and SwaI restriction enzymes (Fermentas Inc.) and cloned by T4 DNA ligase (Takara Biotechnology Co., Ltd.) into a pCDH-puro lentiviral vector (Shanghai GeneChem Co., Ltd.). Then, the pCDH-puro-SMC1 plasmid was packaged into lentivirus via the same method as described for the shRNA vectors. SW680 cells (~50% confluence) were plated and infected with pCDH-puro (negative control) or pCDH-puro-SMC1 (titrated to 1×10⁷ TU/ml) for 48 h, followed by puromycin selection (6 µg/ml).
Small interfering RNA (siRNA) and plasmid construction and transfection
siRNAs [siSMC1-1 sequence: 5′-CCAACATTGATGAGATCTATA-3′; siSMC1-2 sequence: 5′-CGGCGTATTGATGAAATCAAT-3′; si-negative control (si-NC) sequence: 5′-TTCTCCGAACGTGTCACGT-3′] were provided by Shanghai GenePharma Co., Ltd. After reaching 30% confluence, SW620 cells were transfected with siRNAs at a final concentration of 50 nM, and Lipofectamine 2000 reagent according to the manufacturer's protocol. Knockdown efficiency was tested via western blotting after 48 h transfection.
An pcDNA3.1-NF-κB p65 plasmid was obtained from Synbio Technologies LLC. The plasmid vectors were prepared for transfection using DNA Midiprep kits (E.Z.N.A Endo-Free Plasmid Mini kit II; Omega Bio-Tek, Inc.). After reaching >70-80% confluence, the SW620 cells were transfected with 2 µg plasmid and Lipofectamine 2000 reagent according to the manufacturer's protocol. Empty pcDNA3.1 vector was used as the negative control.
RT-qPCR
Total RNA was extracted from cultured cells with TRIzol® reagent (Invitrogen; Thermo Fisher Scientific, Inc.), according to the manufacturer's protocol. RT reactions were performed using a Super cDNA First-Strand Synthesis kit (Beijing CoWin Biotech Co., Ltd.). The 15 µl reaction mixtures were incubated in a 96-well Thermal Cycler (Applied Biosystems; Thermo Fisher Scientific, Inc.) for 40 min at 42°C and 5 min at 85°C. The resulting cDNA was used for RT-PCR using SYBR Green Master PCR Mix (Applied Biosystems; Thermo Fisher Scientific, Inc.) in triplicates and a TP800 Thermal Cycler Dice™ Real Time System (Takara Biotechnology Co., Ltd.). The primer sequences for qPCR for SMC1 were forward, 5′-GGAGCAGCAGCAGATTGAG-3′ and reverse, 5′-TCTCTTCTTCCATCCGTTCTTC-3′. Primers for the control GAPDH were forward, 5′-TGACTTCAACAGCGACACCCA-3′ and reverse, 5′-ACCCTGTTGCTGTAGCCAAA-3′. The 25 µl reactions were incubated at 94°C for 1 min, followed by 30 cycles at 94°C for 30 sec, annealing at 50°C for 30 sec, and elongation at 72°C for 45 sec, followed by a final elongation step at 72°C for 5 min. All PCR reactions were run in triplicate. The relative mRNA levels of SMC1 were compared with those of GAPDH, which was amplified as an internal control and calculated using the comparative 2−ΔΔCq method (19).
Western blot analysis
The expression levels of various proteins were detected via western blot analysis, as previously described (20–22). Additionally, cytoplasmic and nuclear extracts were isolated with a nuclear extraction kit (Beyotime Institute of Biotechnology) according to the manufacturer's protocol. Western blotting assays were conducted using antibodies against SMC1 (1:1,000; cat. no. ab9262; Abcam), GAPDH (1:5,000; cat. no. AP0063; Bioworld Technology, Inc.), caspase-3 (1:1,000; cat. no. 9662; Cell Signaling Technology, Inc.), β-actin (1:5,000; cat. no. A5441; Sigma-Aldrich; Merck KGaA), cleaved caspase-3 (1:1,000; cat. no. 9664; Cell Signaling Technology, Inc.), Bcl-2 (1:1,000; cat. no. 4223; Cell Signaling Technology, Inc.), Bax (1:1,000; cat. no. 5023; Cell Signaling Technology, Inc.), inhibitor of nuclear factor-κB subunit β (IKKβ; 1:1,000; cat. no. ab124957; Abcam), phosphorylated (p)IKKβ (Ser177; 1:1,000; cat. no. ab194528; Abcam), inhibitor of nuclear factor-κB subunit α (IκBα; 1:1,000; cat. no. ab32518; Abcam), pIκBα (Ser32; 1:1,000; cat. no. ab92700; Abcam), NF-κB p65 (1:10,000; cat. no. ab16502; Abcam), pNF-κB p65 (Ser536; 1:1,000; cat. no. ab86299; Abcam) and Lamin B1 (1:10,000; cat. no. ab133741; Abcam). Horseradish peroxidase (HRP)-conjugated anti-rabbit IgG (1:5,000; cat. no. 7074; Cell Signaling Technology, Inc.) or anti-mouse IgG (1:5,000; cat. no. 7076; Cell Signaling Technology, Inc.) was used as secondary antibody.
Colony formation assay
Colony formation assays were performed to evaluate the long-term proliferative potential of SW620 and SW480 cells. SW620 cells were transfected with LV-shCont or LV-shSMC1 and SW480 cells were transfected with LV-SMC1 or empty overexpression vector (LV-NC). Cells (800 cells/well) were seeded into 6-well plates and incubated at 37°C with 5% CO2 for 10 days. The cells were fixed with 4% paraformaldehyde at 4°C for 15 min and stained using Giemsa at room temperature for 30 min. Then, the number of stained colonies that contained ≥50 cells was manually counted under a light microscope (magnification, ×4).
Cell viability assay
Cell viability was measured via an MTT assay. To examine the effects of SMC1 knockdown on SW620 cell viability, SW620 cells infected with LV-Cont or LV-shSMC1 were plated into 96-well plates at a density of 2×10³ cells/well and cultured overnight at 37°C. Thereafter, 20 µl MTT solution (5 mg/ml; Sigma-Aldrich; Merck KGaA) was added to each well to incubate for 2–4 h at 37°C. Then, the medium was discarded and 200 µl DMSO was added to dissolve the resulting formazan crystals. For colorimetric analysis, the OD value at 490 nm was measured by a Multiskan Spectrum UV/visible Microplate Reader (Thermo Fisher Scientific, Inc.). Data from three independent experiments were analyzed.
Flow cytometric analysis of cell cycle
The effects of SMC1 knockdown in SW620 cells and SMC1 overexpression in SW480 cells on the cell cycle were determined by flow cytometry analysis. For cell cycle analysis, transfected cells were harvested and fixed with ice-cold methanol at 4°C for a minimum of 30 min, and then washed twice with ice-cold 0.01 M PBS (pH 7.2). Then, the cells were resuspended in PBS containing propidium iodide (PI) solution (Sigma-Aldrich; Merck KGaA) at a final concentration of 10 µg/ml at room temperature for 20 min. The cell samples were subjected to flow cytometric analysis on a BD FACScan flow cytometer (BD Biosciences). Cells in each phase of the cell cycle were analyzed using FlowJo 10.0 (FlowJo LLC). The ratio of cells in the G0/G1, S and M phases of the cell cycle was determined by their DNA content.
Cell invasion and migration assay
Cell invasive and migratory abilities were detected with a Transwell system using Transwell plates from Costar (Corning, Inc.) with 8.0-µm diameter pores. For invasion assays, plates were coated with 40 µl diluted Matrigel before assays. In total, 1×10⁴ cells in 300 µl serum-free medium were added into the upper chamber of Transwell plates, and 10% FBS-containing medium was added to the lower chamber. Following incubation for 24 or 48 h (for the migration and invasion assays, respectively), the number of cells that had migrated were counted after removing the cells on the upper side of the filter. The cells were fixed with 4% paraformaldehyde at 4°C for 20 min and stained using hexamethylpararosaniline at room temperature for 15 min. The number of cells were counted using an IX70 inverted fluorescence microscope (magnification, ×400; Olympus Corporation), and cells were scored in four randomly selected fields per sample. All the experiments were performed in triplicate.
Tumorigenicity assay in vivo
Male BALB/c nude mice (4 weeks old; 17–20 g; n=24) were ordered from Beijing Vital River Laboratory Animal Technology, Co., Ltd., and housed in a specific pathogen-free environment (12-h light/dark cycle at 25°C and 60% relative humidity; the mice were provided with food and water ad libitum in the animal research center of Nanjing Medical University). Mice were randomly divided into two groups (6 mice/group), and the previously established LV-SMC1 SW480 cells (1×10⁶) or LV-shSMC1 SW620 cells (1×10⁶) were suspended in 0.1 ml serum-free DMEM and subcutaneously injected into the right axillary fossa of each nude mouse for the experimental group. The same vector control cells (LV-NC and LV-shCont, respectively) were used as the blank control. When palpable tumors arose, the tumor sizes were measured using vernier calipers every 3 days. The mice were monitored daily for health and weighed twice weekly. After 21 days (the diameter of the largest tumor in the control mice reached ~1.0 cm), mice were euthanized by CO2 asphyxiation with a 25% volume/min gas displacement flow rate until all animals stopped breathing, then the tumors were dissected and weighed. The tumor size was calculated using the formula V = (width2xlength/2). The tumors were fixed at 4°C for 24 h in 4% paraformaldehyde and were evaluated by immunohistochemistry, and apoptosis in paraffin-embedded tumor sections was detected using a TUNEL assay kit, according to the manufacturer's protocol. All animal experiments were performed following the guidelines of The Institutional Animal Care and Use Committee of The Affiliated Huai'an No. 1 People's Hospital of Nanjing Medical University, which approved the present study (approval no. IACUC-1810008).
Cell apoptosis assay
SW620 cells infected with LV-shControl or LV-shSMC1 and SW480 cells infected with LV-NC or LV-SMC1 (1×10⁵) were cultured, and an Alexa Fluor® 488 Annexin V/Dead Cell Apoptosis kit (Invitrogen; Thermo Fisher Scientific, Inc.) was used for apoptosis analysis, according to the manufacturer's protocol. Cells were collected and resuspended in staining solution at room temperature for 15 min in the dark, and the samples were then subjected to flow cytometric analysis and analyzed using FlowJo 10.0. The percentage of early + late apoptotic cells was analyzed to calculate the apoptotic rate.
TUNEL analysis
An In Situ Apoptosis Detection kit (Abcam) was used to detect apoptosis in tumor tissues. Briefly, sections (4 µm) were deparaffinized in xylene and hydrated using a graded alcohol series. Sections were treated with 0.3% H2O2 peroxidase for 15 min. Then, apoptotic cells were labeled with terminal deoxynucleotidyl transferase at 4°C overnight, followed by incubation with streptavidin-HRP conjugate at room temperature for 2 h. The signal was detected using 3,3′-diaminobenzidine (DAB) substrate at room temperature for 15 min, and the nuclei were stained by hematoxylin for 15 sec at room temperature. The number of apoptotic cells was counted using an IX70 inverted fluorescence microscope (magnification, ×200) and cells were scored in eight randomly selected fields per sample.
Patients and human tissue specimens
A total of 51 samples (tumors and adjacent normal tissues) were collected from January 2010 to March 2013 at the Affiliated Huai'an No. 1 People's Hospital of Nanjing Medical University. The CRC diagnosis was confirmed by at least two pathologists. All patients were classified according to a TNM staging system using the Union for International Cancer Control (UICC) (23). A total of 51 patients with CRC were enrolled (35 male and 16 female) with a median age of 63 years (range, 37–87 years). None of the 51 patients received any preoperative anticancer treatments. Informed consent was obtained from every patient, and the use of the specimens was approved by the Ethics Committee of The Affiliated Huai'an No. 1 People's Hospital of Nanjing Medical University.
Immunohistochemistry analysis
Human tissues were fixed in 4% paraformaldehyde at 4°C for 48 h and then embedded in paraffin. Sections (4 µm) were deparaffinized in xylene and hydrated using a graded alcohol series. Antigen retrieval was performed in antigen unmasking solution at 100°C for 15 min. Then, sections were treated with 0.3% H2O2 peroxidase for 15 min and blocked with 5% BSA (Sigma-Aldrich; Merck KGaA) for 1 h at room temperature. Sections were incubated with an anti-SMC1 antibody (1:200; cat. no. ab9262; Abcam) overnight at 4°C and then incubated with SignalStain® HRP-conjugated Rabbit IHC detection reagent (1:5,000; cat. no. 8114; Cell Signaling Technology, Inc.) for 1 h at 37°C. The immunoreactive cells were visualized using DAB, and the nuclei were stained by hematoxylin for 15 sec at room temperature. The cells were counted using an IX70 inverted fluorescence microscope (magnification, ×200) and cells were scored in eight randomly selected fields per sample. The staining intensity was graded as follows: i) Negative - (0–15% positive); ii) positive + (16–50%); and iii) positive ++ (51–100%). Patients with ‘negative’ expression were classed as exhibiting low expression, whereas those with ‘positive’ expression were classed as exhibiting high expression.
Mouse tumor tissues were embedded in paraffin, and immunohistochemistry was performed as previously described for human tissues. Following 0.3% H2O2 treatment, the sections (4 µm) were incubated with primary antibodies against SMC1 (1:200; cat. no. ab9262; Abcam) and NF-κB p65 (1:2,000; cat. no. ab16502; Abcam), followed by incubation with HRP-conjugated detection reagent (1:200; cat. no. 8114; Cell Signaling Technology, Inc.) for 1 h at 37°C. The number of positive cells were counted using an IX70 inverted fluorescence microscope (magnification, ×400), and cells were scored in eight randomly selected fields per sample.
Statistical analysis
All data in this study are presented as means ± SD. All statistical analyses were performed using SPSS 17.0 software (SPSS, Inc.). Pearson's χ2 test was used to compare qualitative variables, and comparisons among different groups were performed using one-way ANOVA followed by Bonferroni test. Student's t-test was used to analyze the statistical significance between two groups. Kaplan-Meier survival analysis was used to assess the association between SMC1 expression and CRC prognosis. The Wilcoxon signed-rank test was used to analyze differences in expression between CRC tissue and adjacent normal tissue. P<0.05 was considered to indicate a statistically significant difference. All experiments were performed at least three independent times.
Results
SMC1 is upregulated in CRC cell lines
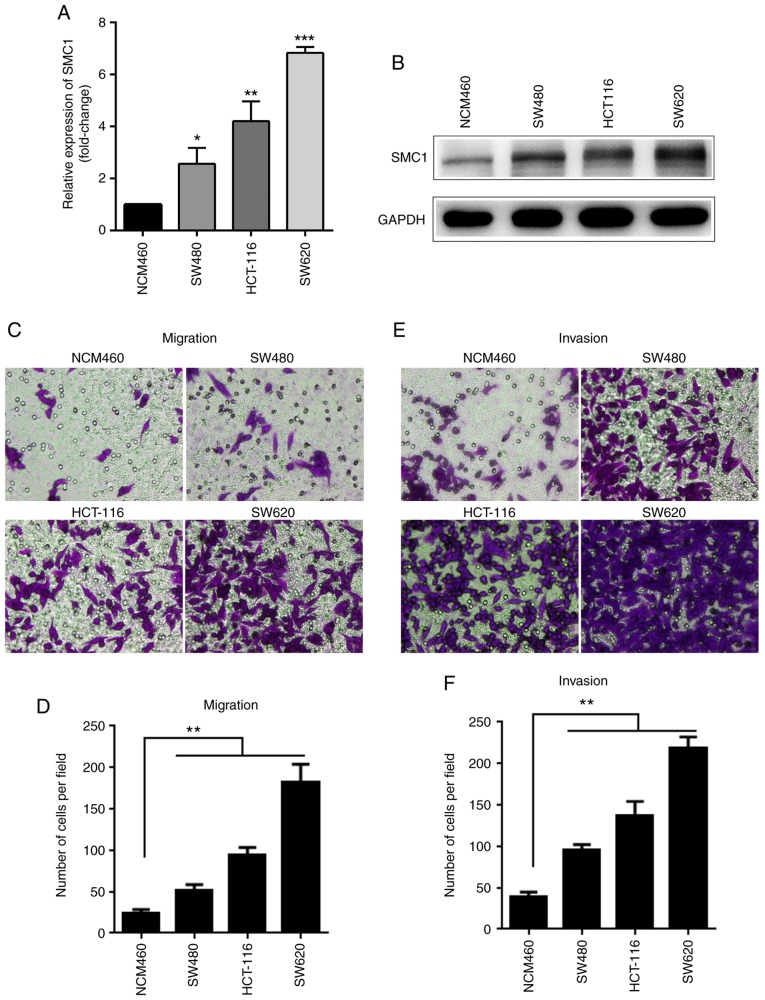
RT-qPCR analysis was used to detect the mRNA expression of SMC1 in colon cancer cell lines and normal cells. As presented in Fig. 1A, the expression of SMC1 in the CRC cell lines (SW480, HCT-116 and SW620) was 2.56±0.50, 4.21±0.62 and 6.83±0.19 times higher, respectively, compared with in the normal NCM460 colonic epithelial cells (P<0.05). Western blot analysis also showed that protein expression of SMC1 in the CRC cell lines (SW480, HCT-116 and SW620) was higher than NCM460 cells (Fig. 1B); the highest SMC1 expression levels for both mRNA and protein were observed in the SW620 cells among the three CRC cells (Fig. 1A and B). SW620 cells also exhibited the highest migratory and invasive abilities in Transwell assays compared with the other cancer and normal cells (Fig. 1C-F).
Figure 1.
SMC1 is upregulated in CRC cell lines. (A) mRNA expression levels of SMC1 in three CRC cell lines (SW620, HCT-116, SW480) and a normal colon epithelial cell line (NCM460) as determined via reverse transcription-quantitative PCR analysis. (B) Western blot analysis of SMC1 expression levels in the cell lines; GAPDH was used as the loading control. (C and D) Migratory abilities of CRC and normal colonic cells were determined using Transwell assays. Migrated cells were counted under a light microscope in 4 random fields (magnification, ×400). (E-F) Invasive abilities of CRC and normal colonic cells were determined using Matrigel invasion assays. Data are presented as the mean ± SD of triplicate experiments. *P<0.05, **P<0.01, ***P<0.005 vs. NCM460. CRC, colorectal cancer; SMC1, structural maintenance of chromosomes 1.
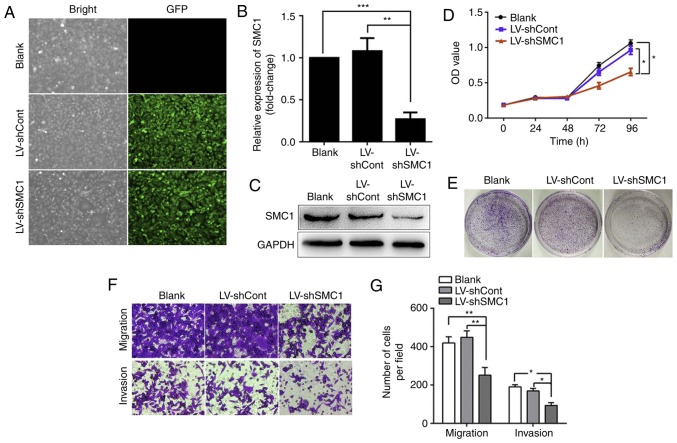
Knockdown of SMC1 inhibits malignant phenotypes and induces apoptosis in SW620 cells. As is shown in Fig 1A-B, the SMC1 expression is highest in SW620 cells. To determine whether SMC1 expression is associated with malignant phenotypes of SW620 cells, LV-shSMC1 was used to knockdown SMC1 expression. As presented in Fig. 2A, the efficacy of transfection was ≤90%. After 48 h transfection with LV-shSMC1, RT-qPCR and western blot analysis were used to detect SMC1 expression. The present data revealed that SMC1 expression was not significantly different between the LV-shCont and blank groups (P>0.05; Fig. 2B). In the LV-shSMC1 group, the mRNA and protein expression levels of SMC1 were 0.26±0.06 and 0.45±0.01, respectively, compared with the LV-shCont group, (P<0.05; Fig. 2B and C). To determine the potential involvement of SMC1 in the proliferation of CRC cells, MTT and colony formation assays were conducted. As presented in Fig. 2D and E, cell viability and colony formation were markedly reduced in the LV-shSMC1 group compared with the LV-shCont and blank groups (P<0.05). Transwell assays revealed that the numbers of migrating cells were 93±12, 190±9 and 169±10 in the LV-shSMC1, LV-shCont and blank groups, respectively; meanwhile, Matrigel invasion assays revealed that the numbers of invading cells were 251±33, 419±25 and 448±28 in the LV-shSMC1, LV-shCont and blank groups, respectively (P<0.01; Fig. 2F and G); indicating that knocking down SMC1 reduced the invasive and migratory abilities of SW620 cells.
Figure 2.
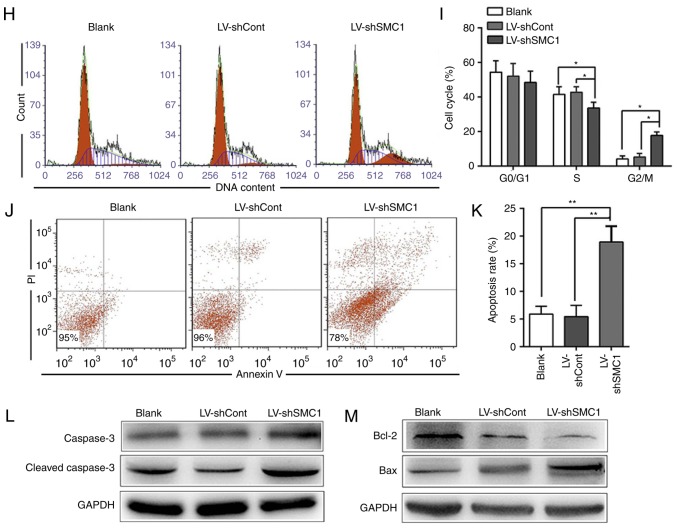
Knockdown of SMC1 inhibits malignant phenotypes and induces apoptosis in SW620 cells. (A) LV infection efficiency in SW620 cells. (B) Reverse transcription-quantitative PCR analysis of SMC1 mRNA levels in SW620 cells. (C) Western blot analysis of SMC1 protein levels in SW620 cells. (D) In vitro growth curves of SW620 cells transfected with lentivirus. Cell viability was determined by MTT assays, and the OD was detected at 450 nm. (E) Colony formation of SW620 cells following lentiviral transduction. (F and G) Migratory and invasive abilities of SW620 cells following SMC1 knockdown were determined by Transwell assays. Cells were counted in 4 random fields (magnification, ×400). (H) Knockdown of SMC1 induced cell cycle arrest in the G2/M phase in SW620 cells. (I) Quantitative analysis of the cell cycle distribution of SW620 cells. (J and K) Apoptosis of SW620 cells following SMC1 knockdown was measured via flow cytometry. (L and M) Western blot analysis of the expression of apoptosis-associated molecules, including caspase-3, cleaved caspase-3 and Bcl-2/Bax. Data are presented as the mean ± SD of three independent experiments. *P<0.05, **P<0.01, ***P<0.001. Cont, control; LV, lentivirus; OD, optical density; PI, propidium iodide; sh, short hairpin (RNA); SMC1, structural maintenance of chromosomes 1.
In a cell cycle assay, as presented in Fig. 2H and I, the percentage of S phase cells (33.73±3.21%) was reduced, whereas that of G2/M phase cells (17.81±1.99%) was increased in the LV-shSMC1 group compared with the LV-shCont and blank groups (P<0.05). In addition, an Annexin V-PI assay revealed that the apoptotic rate was significantly increased in the LV-shSMC1 group (18.9±2.9%) compared with in the LV-shCont and blank groups (5.89±1.42 and 5.43±2.01%, respectively; P<0.01; Fig. 2J and K). Western blot analysis revealed that the expression levels of cleaved caspase-3 and Bax were increased, whereas the expression of Bcl-2 was reduced in LV-shSMC1 SW620 cells compared with the control (Fig. 2L and M).
Different siRNAs (si-NC, siSMC1-1 and siSMC1-2) were used to knockdown SMC1 expression in SW620 cells (Fig. S1A). As with the lentiviral knockdown, siRNA-mediated downregulation of SMC1 significantly inhibited SW620 cell proliferation, as determined by an MTT assay (Fig. S1B), suppressed cell migration and invasion, observed with Transwell and Matrigel assays (Fig. S1C and D), and promoted apoptosis (Fig. S1E and F).
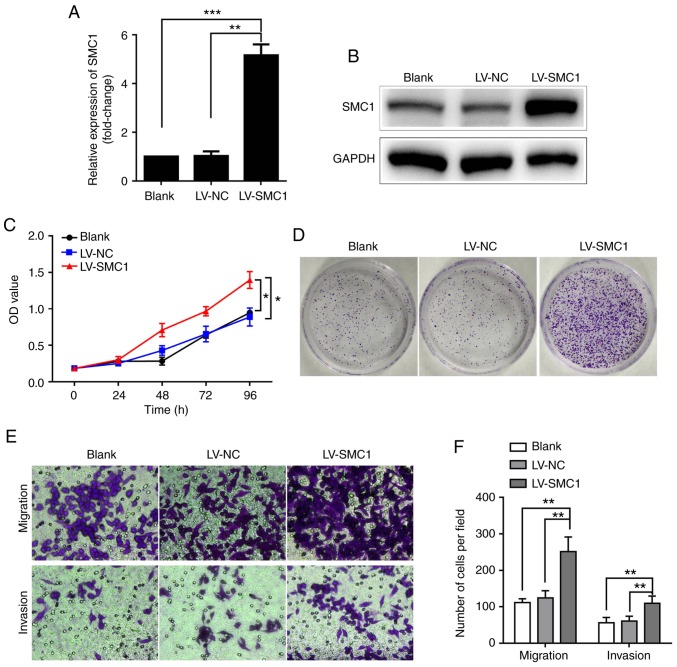
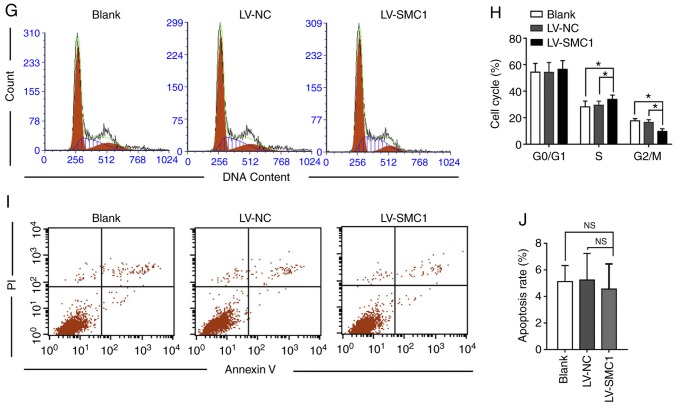
SMC1 overexpression promotes the proliferation, migration and invasion of SW480 cells. To further investigate the effects of SMC1 expression on malignant phenotypes in CRC cells, an SMC1 overexpression lentivirus, LV-SMC1, was transfected into SW480 cells, which exhibited the lowest SMC1 expression out of the three CRC cell lines tested in the present study. As hypothesized, the mRNA and protein expression levels of SMC1 were notably increased in the LV-SMC1 group after transfection of pCDH-puro-SMC1 plasmids compared with the control and blank groups (P<0.01; Fig. 3A and B). An MTT assay revealed significantly increased viability of SW480 cells following overexpression of SMC1 compared with the vector control cells (P<0.05; Fig. 3C). A colony formation assay also showed markedly increased colony numbers in the LV-SMC1 group (Fig. 3D). In addition, a Transwell assay showed that the number of migratory cells (251±3) was increased in the LV-SMC1 compared with the LV-NC and blank groups (111±9 and 122±16, respectively); meanwhile, a Matrigel assay demonstrated significantly increased numbers of invasive cells (109±16) in the LV-SMC1 group compared with the LV-NC and blank groups (56±12 and 64±11, respectively; P<0.01; Fig. 3E and F). A cell cycle assay indicated a significantly increased percentage of S phase cells (33.83±2.11%) in the LV-SMC1 group compared with in both the LV-NC and blank groups (28.14±5.35, 29.41±4.12%); with a lower ratio of G2/M phase cells (9.63±1.79%) compared with the blank and negative controls (17.59±1.38 and 16.36±3.42%, respectively; P<0.05; Fig. 3G and H). Of note, there was no difference in the rate of apoptosis between the SMC1-overexpressing and control SW480 cells (Fig. 3I and J). These results further demonstrated that overexpression of SMC1 promoted the proliferation, migration and invasion of CRC cells.
Figure 3.
Upregulation of SMC1 promotes the proliferation, migration and invasion of SW480 cells. (A) SW480 cell lines were transfected with LV-SMC1, and SMC1 mRNA levels were detected via reverse transcription-quantitative PCR analysis. (B) Western blot analysis of SMC1 protein levels in SW480 cells. (C) In vitro growth curves of SW480 cells following overexpression of SMC1. Cell viability was determined using an MTT assay. (D) Colony formation of SW480 cells following overexpression of SMC1. (E and F) Migratory and invasive abilities of SW480 cells as determined by Transwell assays. Cells were counted in 4 random fields (magnification, ×400). (G and H) Cell cycle distribution of SW480 cells following overexpression of SMC1. (I and J) Apoptosis of SW480 cells following SMC1 overexpression as determined via flow cytometry. Data are presented as the mean ± SD of three independent experiments. *P<0.05, **P<0.01, ***P<0.001. LV, lentivirus; NC, negative control; NS, not significant; OD, optical density; PI, propidium iodide; SMC1, structural maintenance of chromosomes 1.
SMC1 promotes CRC cell proliferation and apoptosis in vivo
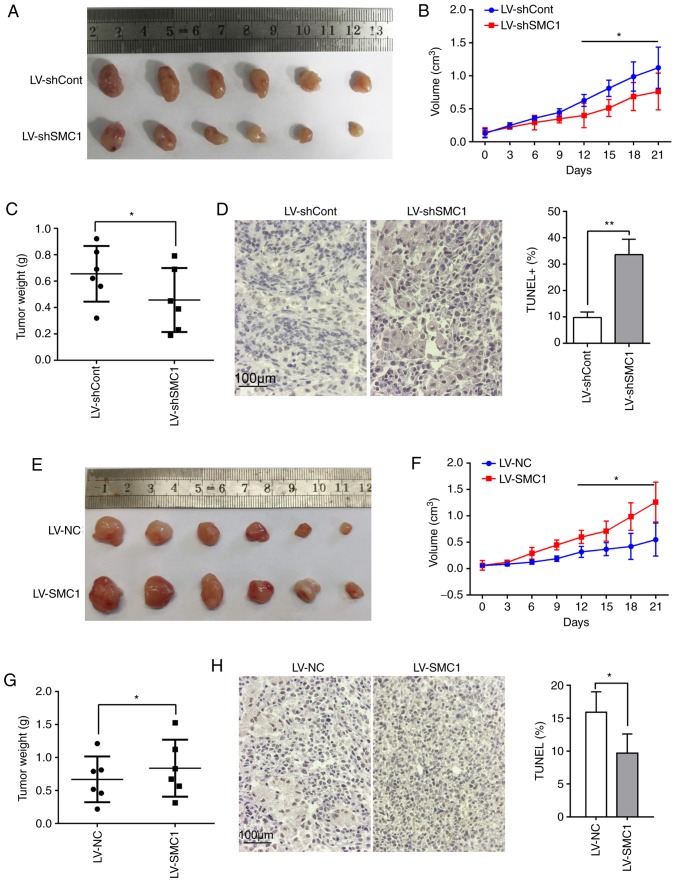
To investigate whether SMC1 has functional effects on CRC progression in vivo, a SW620 CRC cell xenograft mouse model was established. It was observed that tumor growth in the LV-shSMC1-infected group was reduced compared with the LV-shCont group at 21 days after subcutaneous inoculation (Fig. S2A; Fig. 4A and B). As presented in Fig. 4C, the weight of the tumor mass from the LV-shSMC1 group was significantly decreased compared with the LV-shCont group (P<0.05). A TUNEL assay revealed that apoptotic cell numbers were significantly higher in the LV-shSMC1 group (33.59±5.90) compared with in the LV-shCont group (9.80±2.10; P<0.05; Fig. 4D).
Figure 4.
SMC1 promotes cell proliferation in vivo. (A) Final tumor volume of SW620 cell xenografts. The largest tumor (upper left) has a diameter of 13 mm. (B) Tumor growth curves of xenograft nude mice. Tumor volume was measured every 3 days. (C) After 21 days, the tumor weight was calculated. (D) TUNEL staining of the tumors. The apoptotic index as determined by the percentage of TUNEL-stained nuclei was calculated. (E) Final tumor volume of SW480 cell xenografts. The largest tumor (lower left) has a diameter of 14 mm. (F) Tumor growth curves of xenograft nude mice. Tumor volume was measured every 3 days. (G) After 21 days, tumor weight was calculated. (H) TUNEL staining of the tumors. The apoptotic index as determined by the percentage of TUNEL-stained nuclei was calculated. Data are presented as the mean ± SD from separate experiments. *P<0.05, **P<0.01. Cont, control; LV, lentivirus; NC, negative control; sh, short hairpin (RNA); SMC1, structural maintenance of chromosomes 1.
To support these observations, another xenograft mouse model was established using SMC1-overexpressing SW480 CRC cells. It was revealed that tumor growth in mice inoculated with LV-SMC1-infected SW480 CRC cells was increased compared with those inoculated with LV-NC-infected SW480 cells (Fig. S2B; Fig. 4E and F). The weight of the tumor mass from the LV-SMC1 group was also significantly increased compared with the LV-NC group (P<0.05; Fig. 4G). The rate of apoptosis in tumor tissue was lower in the LV-SMC1 group (9.7±2.90%) compared with the LV-NC group [15.90±3.10%; P<0.05; Fig. 4H]. Collectively, these results indicated that SMC1 promoted CRC cell proliferation and inhibited apoptosis in vivo.
SMC1 is associated with NF-κB signaling in CRC cells
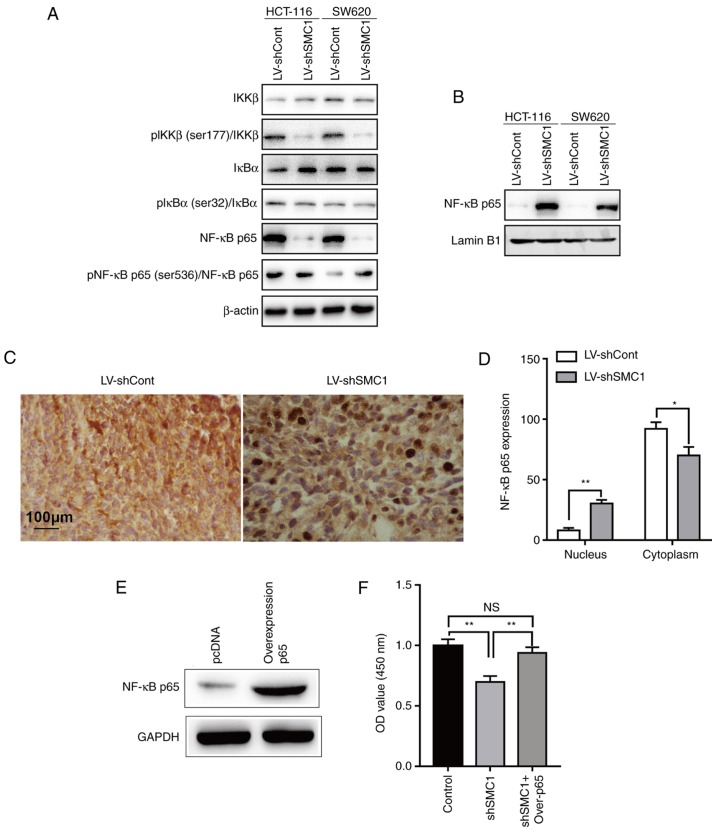
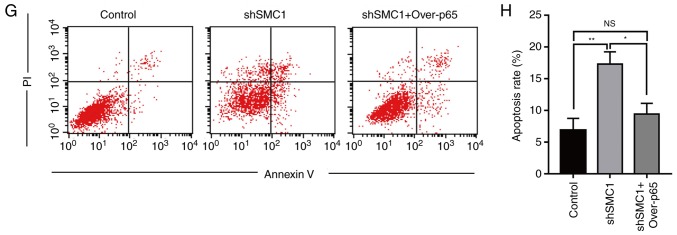
NF-κB is a nuclear transcription factor that regulates the expression of a large number of genes that are critical for the regulation of various biological processes, including cell apoptosis, viral replication, tumorigenesis, inflammation and various autoimmune diseases (24). To determine whether NF-κB is involved in the SMC1-mediated regulation of proliferation and apoptosis in CRC cells, the phosphorylation of IKKβ (at Ser177), IκBα (at Ser32) and NF-κB p65 (at Ser536) were determined by western blotting after knocking down SMC1. A marked decrease in the phosphorylation of IKKβ and IκBα was observed (Fig. 5A). Conversely, an increased level of phosphorylation of NF-κB p65 was observed (Fig. 5A). In addition, cell localization of NF-κB p65 altered after knocking down SMC1; the protein accumulated from the cytoplasm to the nucleus (Fig. 5B). Similarly, it was identified that knocking down SMC1 promoted NF-κB p65 translocation from the cytoplasm to the nucleus in vivo (Fig. 5C and D). Subsequently, the expression of p65 was ectopically reversed in SMC1-knocked down SW620 cells. It was revealed that in p65-overexpressing SW620 cells (Fig. 5E), the reduced cell proliferation (Fig. 5F) and increased apoptosis (Fig. 5G and H) induced by knockdown of SMC1 were partly reversed. This suggested that the effects of SMC1 on the proliferation and apoptosis of CRC cells are mediated at least partially via the NF-κB signaling pathway.
Figure 5.
Effects of SMC1 expression on the activity of the NF-κB signaling pathway in colorectal cancer cells. (A) Protein expression was examined in cytoplasmic cells lysates via western blotting. (B) Protein expression was examined in nuclear cells lysates by western blotting. (C and D) NF-κB p65 expression in xenograft tissue was determined via immunohistochemistry analysis. (E) SW620 cells were transfected with p65-overexpression plasmids, and NF-κB p65 protein levels were detected via western blotting. (F) Viability of SW620 cells at 96 h after knockdown of SMC1 and overexpression of p65. Cell viability was determined using an MTT assay. (G and H) Apoptosis was determined via flow cytometry in SW620 cells at 48 h following SMC1 knockdown and p65 overexpression. *P<0.05, **P<0.01. Cont, control; IκBα, inhibitor of nuclear factor-κB subunit α; IKKβ, inhibitor of nuclear factor-κB subunit β; LV, lentivirus; NC, negative control; NS, not significant; OD, optical density; Over-p65, overexpression of p65; p, phosphorylated; PI, propidium iodide; sh, short hairpin (RNA); SMC1, structural maintenance of chromosomes 1.
SMC1 expression and pathologic parameters in patients with CRC
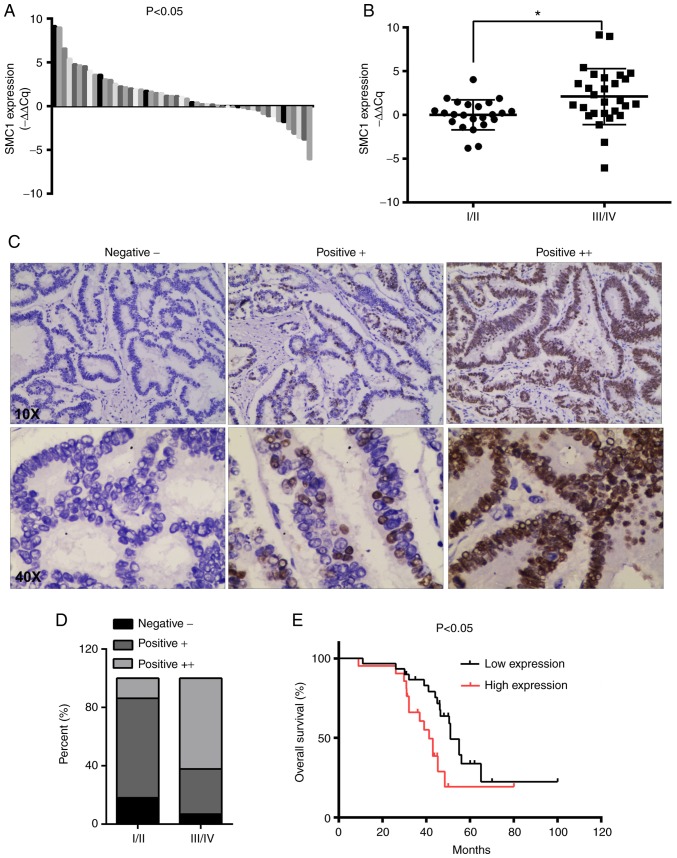
Potential associations between SMC1 expression levels in CRC tumor tissues and clinicopathological characteristics were analyzed in patients. The collected clinical data indicated that SMC1 was upregulated in CRC tissues compared with matched adjacent normal tissues, as determined via RT-qPCR analysis (Fig. 6A). Furthermore, increased expression of SMC1 was positively associated with advanced TNM stage (P<0.05; Fig. 6B). The associations between SMC1 expression and clinicopathological parameters are presented in Table I. Higher expression of SMC1 was significantly associated with advanced TNM stage (P=0.007), primary tumor size (P=0.035) and lymph node metastasis (P=0.017). In the present study, no significant associations were observed between SMC1 expression and sex, age, tumor location, tumor differentiation and vascular invasion (P>0.05). Representative images of SMC1 expression in tissue are presented in Fig. 6C. There were more strongly positive (++) SMC1 cells in advanced-stage (III/IV) compared with early-stage tissue (I/II; Fig. 6D). As presented in Fig. 6E, high SMC1 expression was significantly associated with worse overall survival in patients with CRC (P<0.05; Fig. 6E).
Figure 6.
Association between SMC1 expression and clinicopathologic parameters in patients with CRC. (A) Transcriptional expression of SMC1 in CRC tissues compared with matched adjacent normal tissues as determined by reverse transcription-quantitative PCR analysis (Wilcoxon signed-rank test). Relative expression is shown as a log2 value of the adjacent value. (B) SMC1 expression in early-stage and advanced-stage CRC tissues. (C and D) Protein expression of SMC1 in CRC tissues as determined via immunohistochemistry. (E) Kaplan-Meier analysis of overall survival of patients with CRC based on SMC1 expression. *P<0.05. CRC, colorectal cancer; SMC1, structural maintenance of chromosomes 1.
Table I.
Associations between SMC1 expression in cancer tissue and clinicopathological characteristics in patients with colorectal cancer.
| SMC1 expression [N (%)] | |||||
|---|---|---|---|---|---|
| Clinicopathological characteristic | N | Low expression | High expression | χ2 | P-value |
| Total number | 51 | 22 | 29 | ||
| Sex | 0.448 | 0.503 | |||
| Male | 35 | 14 (63.64) | 21 (72.41) | ||
| Female | 16 | 8 (36.36) | 8 (27.59) | ||
| Age (years) | 0.015 | 0.903 | |||
| <65 | 25 | 11 (50.00) | 14 (48.28) | ||
| ≥65 | 26 | 11 (50.00) | 15 (51.72) | ||
| Location | 0.019 | 0.889 | |||
| Rectal cancer | 18 | 8 (36.36) | 10 (34.48) | ||
| Colon cancer | 33 | 14 (63.64) | 19 (65.52) | ||
| Cell differentiation | 3.960 | 0.138 | |||
| Well | 5 | 2 (9.09) | 3 (10.34) | ||
| Moderate | 20 | 12 (54.55) | 8 (27.59) | ||
| Poor | 26 | 8 (36.36) | 18 (62.07) | ||
| TNM | 7.322 | 0.007b | |||
| I/II | 26 | 16 (72.73) | 10 (34.48) | ||
| III/IV | 25 | 6 (27.27) | 19 (65.52) | ||
| Primary tumor size | 4.469 | 0.035a | |||
| T1-2 | 23 | 14 (63.64) | 9 (31.03) | ||
| T3-4 | 28 | 8 (36.36) | 20 (68.97) | ||
| Lymph node metastasis | 5.685 | 0.017a | |||
| N0 | 25 | 15 (68.18) | 10 (34.48) | ||
| N1-2 | 26 | 7 (31.82) | 19 (65.52) | ||
| Vascular invasion | 0.292 | 0.589 | |||
| No | 30 | 12 (54.55) | 18 (62.07) | ||
| Yes | 21 | 10 (45.45) | 11 (37.93) | ||
P<0.05
P<0.01. SMC1, structural maintenance of chromosomes 1.
Discussion
CRC is one of the most common malignant diseases globally (1). Recently, the function of SMC1 in CRC has attracted increasing attention, with evidence suggesting that the cohesin multiprotein complex is implicated in several diseases, including colorectal cancer (25–27). The cohesin multiprotein complex includes four major subunits: SMC1, SMC3, sister chromatid cohesion (SCC) protein 1 and SCC3. The cohesin multiprotein complex plays an important role in the regulation of transcription and development (28,29). SMC1 is an X-linked gene that can escape X-inactivation in humans, but is subject to X-inactivation in mice (30). Several mutations have been identified in the SMC1 gene, all of which are missense or small deletion mutations (12,20). Although SMC1 mutations have been reported in CRC (21,22), the role of SMC1 in CRC remains unclear. Therefore, elucidating how SMC1 is involved in CRC is of great importance.
In the present study, it was demonstrated that SMC1 was significantly upregulated in CRC cell lines compared with colonic epithelial cells. SMC1 overexpression contributed to an increase in the proliferation, and a reduction in the apoptosis of CRC cells in vitro and in vivo. Further evidence indicated that the effects of SMC1 on cell proliferation involved the regulation of the cell cycle. Additionally, it was demonstrated that SMC1 knockdown affected the balance of Bcl-2/Bax, indicating that SMC1 serves an antiapoptotic role in CRC.
NF-κB is a nuclear transcription factor involved in various biological events (31). The activation of NF-κB is considered to be part of a stress response, as it is usually activated by a variety of stimuli that include growth factors, cytokines, lymphokines, UV, pharmacological agents and stress (32). In its inactive form, NF-κB is sequestered in the cytoplasm and bound by members of the IκB family of inhibitor proteins (33). In the present study, it was demonstrated that knocking down SMC1 promoted NF-κB p65 translocation from the cytoplasm to the nucleus in vitro and in vivo. The present data demonstrated that SMC1 knockdown promoted cell apoptosis, which could be reversed by overexpressing p65, suggesting that the roles of SMC1 in cell proliferation and apoptosis are mediated by the NF-κB signaling pathway. However, details regarding the mechanisms of action require further investigation.
The significance of SMC1 in CRC was also supported by clinical evidence. In the present study, it was demonstrated that the expression of SMC1 in CRC tissues was higher compared with adjacent normal tissues. Patients with high SMC1 expression had larger tumors, and increased incidence of distant and local metastasis; it was suggested that high SMC1 expression was an independent prognostic predictor for patients with advanced CRC stage, and was associated with overall survival. These results suggested that SMC1 may have an important role in the development of CRC and be a predictive biomarker in patients with CRC. The inhibition of SMC1 may serve as a promising therapeutic strategy for human CRC.
In conclusion, the present data demonstrated a role of SMC1 as a tumor-promoting biomarker in CRC. The present data also demonstrated a novel mechanism for the regulation of CRC cells, as SMC1 promoted proliferation and inhibited apoptosis, potentially via the NF-κB signaling pathway. To the best of our knowledge, this is the first study to demonstrate that targeting SMC1 may be a potential therapeutic strategy in CRC.
Supplementary Material
Acknowledgements
Not applicable.
Funding
This study was supported by the Nanjing Medical University Foundation of Jiangsu Province, China (grant no. NMUB 2018149), the Science and Technology Bureau project of Huai'an (grant no. HAS2015001) and the National Natural Science Foundation of China (grant no. 91229125).
Availability of data and materials
All data generated or analyzed during this study are included in this published article and its supplementary information files.
Authors' contributions
JL, YS and JZ designed the study. JL, JH and YW performed the experiments. JL and JH analyzed the data. JL and JZ discussed the project. JL and JH drafted, and JZ proofread and revised the manuscript. All authors read and approved the final manuscript.
Ethics approval and consent to participate
All animal treatment protocols were approved by the Institutional Animal Care and Use Committee of The Affiliated Huai'an No. 1 People's Hospital of Nanjing Medical University. Informed consent was obtained from every patient, and the use of human specimens was approved by the Ethics Committee of The Affiliated Huai'an No. 1 People's Hospital of Nanjing Medical University.
Patient consent for publication
Not applicable.
Competing interests
The authors declare that they have no competing interests.
References
- 1.Siegel RL, Miller KD, Fedewa SA, Ahnen DJ, Meester RG, Barzi A, Jemal A. Colorectal cancer statistics, 2017. CA Cancer J Clin. 2017;67:177–193. doi: 10.3322/caac.21395. [DOI] [PubMed] [Google Scholar]
- 2.Jemal A, Ward EM, Johnson CJ, Cronin KA, Ma J, Ryerson B, Mariotto A, Lake AJ, Wilson R, Sherman RL, et al. Annual report to the nation on the status of cancer, 1975–2014, featuring survival. J Natl Cancer Inst. 2017;109 doi: 10.1093/jnci/djx030. [DOI] [PMC free article] [PubMed] [Google Scholar]
- 3.Harrison S, Benziger H. The molecular biology of colorectal carcinoma and its implications: A review. Surgeon. 2011;9:200–210. doi: 10.1016/j.surge.2011.01.011. [DOI] [PubMed] [Google Scholar]
- 4.Peters U, Bien S, Zubair N. Genetic architecture of colorectal cancer. Gut. 2015;64:1623–1636. doi: 10.1136/gutjnl-2013-306705. [DOI] [PMC free article] [PubMed] [Google Scholar]
- 5.Fiedler D, Heselmeyer-Haddad K, Hirsch D, Hernandez LS, Torres I, Wangsa D, Hu Y, Zapata L, Rueschoff J, Belle S, et al. Single-cell genetic analysis of clonal dynamics in colorectal adenomas indicates CDX2 gain as a predictor of recurrence. Int J Cancer. 2019;144:1561–1573. doi: 10.1002/ijc.31869. [DOI] [PMC free article] [PubMed] [Google Scholar]
- 6.Barresi V, Castorina S, Musso N, Capizzi C, Luca T, Privitera G, Condorelli DF. Chromosomal instability analysis and regional tumor heterogeneity in colon cancer. Cancer Genet. 2017;210:9–21. doi: 10.1016/j.cancergen.2016.11.001. [DOI] [PubMed] [Google Scholar]
- 7.Librelotto CS, Simon D, de Souza AP, Alvares-da-Silva MR, Dihl RR. Chromosomal instability and cytotoxicity induced by ribavirin: Comparative analysis in cell lines with different drug-metabolizing profiles. Drug Chem Toxicol. 2019;42:343–348. doi: 10.1080/01480545.2017.1405970. [DOI] [PubMed] [Google Scholar]
- 8.McClelland SE. Role of chromosomal instability in cancer progression. Endocrine-Related Cancer. 2017;24:T23–T31. doi: 10.1530/ERC-17-0187. [DOI] [PubMed] [Google Scholar]
- 9.Sideris M, Papagrigoriadis S. Molecular biomarkers and classification models in the evaluation of the prognosis of colorectal cancer. Anticancer Res. 2014;34:2061–2068. [PubMed] [Google Scholar]
- 10.Marginean EC, Melosky B. Is there a role for programmed death ligand-1 testing and immunotherapy in colorectal cancer with microsatellite instability? Part I-colorectal cancer: Microsatellite instability, testing, and clinical implications. Arch Pathol Lab Med. 2018;142:17–25. doi: 10.5858/arpa.2017-0040-RA. [DOI] [PubMed] [Google Scholar]
- 11.Hirano T. At the heart of the chromosome: SMC proteins in action. Nat Rev Mol Cell Biol. 2006;7:311–322. doi: 10.1038/nrm1909. [DOI] [PubMed] [Google Scholar]
- 12.Huber RG, Kulemzina I, Ang K, Chavda AP, Suranthran S, Teh JT, Kenanov D, Liu G, Rancati G, Szmyd R, et al. Impairing cohesin Smc1/3 head engagement compensates for the lack of Eco1 function. Structure. 2016;24:1991–1999. doi: 10.1016/j.str.2016.09.001. [DOI] [PubMed] [Google Scholar]
- 13.Schar P, Fasi M, Jessberger R. SMC1 coordinates DNA double-strand break repair pathways. Nucleic Acids Res. 2004;32:3921–3929. doi: 10.1093/nar/gkh716. [DOI] [PMC free article] [PubMed] [Google Scholar]
- 14.Bauerschmidt C, Woodcock M, Stevens DL, Hill MA, Rothkamm K, Helleday T. Cohesin phosphorylation and mobility of SMC1 at ionizing radiation-induced DNA double-strand breaks in human cells. Exp Cell Res. 2011;317:330–337. doi: 10.1016/j.yexcr.2010.10.021. [DOI] [PMC free article] [PubMed] [Google Scholar]
- 15.Luo Y, Deng X, Cheng F, Li Y, Qiu J. SMC1-mediated intra-S-phase arrest facilitates bocavirus DNA replication. J Virol. 2013;87:4017–4032. doi: 10.1128/JVI.03396-12. [DOI] [PMC free article] [PubMed] [Google Scholar]
- 16.Laugsch M, Seebach J, Schnittler H, Jessberger R. Imbalance of SMC1 and SMC3 cohesins causes specific and distinct effects. PLoS One. 2013;8:e65149. doi: 10.1371/journal.pone.0065149. [DOI] [PMC free article] [PubMed] [Google Scholar]
- 17.Yi F, Wang Z, Liu J, Zhang Y, Wang Z, Xu H, Li X, Bai N, Cao L, Song X. Structural maintenance of chromosomes protein 1: Role in genome stability and tumorigenesis. Int J Biol Sci. 2017;13:1092–1099. doi: 10.7150/ijbs.21206. [DOI] [PMC free article] [PubMed] [Google Scholar]
- 18.Kitagawa R, Bakkenist CJ, McKinnon PJ, Kastan MB. Phosphorylation of SMC1 is a critical downstream event in the ATM-NBS1-BRCA1 pathway. Genes Dev. 2004;18:1423–1438. doi: 10.1101/gad.1200304. [DOI] [PMC free article] [PubMed] [Google Scholar]
- 19.Livak KJ, Schmittgen TD. Analysis of relative gene expression data using real-time quantitative PCR and the 2(-Delta Delta C(T)) method. Methods. 2001;25:402–408. doi: 10.1006/meth.2001.1262. [DOI] [PubMed] [Google Scholar]
- 20.Musio A, Selicorni A, Focarelli ML, Gervasini C, Milani D, Russo S, Vezzoni P, Larizza L. X-linked Cornelia de lange syndrome owing to SMC1L1 mutations. Nat Genet. 2006;38:528–530. doi: 10.1038/ng1779. [DOI] [PubMed] [Google Scholar]
- 21.Wang J, Yu S, Cui L, Wang W, Li J, Wang K, Lao X. Role of SMC1A overexpression as a predictor of poor prognosis in late stage colorectal cancer. BMC Cancer. 2015;15:90. doi: 10.1186/s12885-015-1085-4. [DOI] [PMC free article] [PubMed] [Google Scholar]
- 22.Li J, Feng W, Chen L, He J. Downregulation of SMC1A inhibits growth and increases apoptosis and chemosensitivity of colorectal cancer cells. J Int Med Res. 2016;44:67–74. doi: 10.1177/0300060515600188. [DOI] [PMC free article] [PubMed] [Google Scholar]
- 23.Brierley JD, Gospodarowicz MK, Wittekind C. TNM classification of malignant tumours, 8th edition. Hoboken. 2016:Wiley–Blackwell. [Google Scholar]
- 24.Bharti AC, Aggarwal BB. Chemopreventive agents induce suppression of nuclear factor-κB leading to chemosensitization. Ann NY Acad Sci. 2002;973:392–395. doi: 10.1111/j.1749-6632.2002.tb04671.x. [DOI] [PubMed] [Google Scholar]
- 25.van Ruiten MS, Rowland BD. SMC Complexes: Universal DNA looping machines with distinct regulators. Trends Genet. 2018;34:477–487. doi: 10.1016/j.tig.2018.03.003. [DOI] [PubMed] [Google Scholar]
- 26.Alt A, Dang HQ, Wells OS, Polo LM, Smith MA, McGregor GA, Welte T, Lehmann AR, Pearl LH, Murray JM, Oliver AW. Specialized interfaces of Smc5/6 control hinge stability and DNA association. Nat Commun. 2017;8:14011. doi: 10.1038/ncomms14011. [DOI] [PMC free article] [PubMed] [Google Scholar]
- 27.Mannini L, Liu J, Krantz ID, Musio A. Spectrum and consequences of SMC1A mutations: The unexpected involvement of a core component of cohesin in human disease. Hum Mutat. 2010;31:5–10. doi: 10.1002/humu.21129. [DOI] [PMC free article] [PubMed] [Google Scholar]
- 28.Misulovin Z, Pherson M, Gause M, Dorsett D. Brca2, Pds5 and Wapl differentially control cohesin chromosome association and function. PLoS Genet. 2018;14:e1007225. doi: 10.1371/journal.pgen.1007225. [DOI] [PMC free article] [PubMed] [Google Scholar]
- 29.Kakui Y, Uhlmann F. SMC complexes orchestrate the mitotic chromatin interaction landscape. Curr Genet. 2018;64:335–339. doi: 10.1007/s00294-017-0755-y. [DOI] [PMC free article] [PubMed] [Google Scholar]
- 30.Gdula MR, Nesterova TB, Pintacuda G, Godwin J, Zhan Y, Ozadam H, McClellan M, Moralli D, Krueger F, Green CM, et al. The non-canonical SMC protein SmcHD1 antagonises TAD formation and compartmentalisation on the inactive X chromosome. Nat Commun. 2019;10:30. doi: 10.1038/s41467-018-07907-2. [DOI] [PMC free article] [PubMed] [Google Scholar]
- 31.Mussbacher M, Salzmann M, Brostjan C, Hoesel B, Schoergenhofer C, Datler H, Hohensinner P, Basílio J, Petzelbauer P, Assinger A, Schmid JA. Cell type-specific roles of NF-κB linking inflammation and thrombosis. Front Immunol. 2019;10:85. doi: 10.3389/fimmu.2019.00085. [DOI] [PMC free article] [PubMed] [Google Scholar]
- 32.Kang I, Yoon DW, Braun KR, Wight TN. Expression of versican V3 by arterial smooth muscle cells alters tumor growth factor β (TGFβ)-, epidermal growth factor (EGF)-, and nuclear factor κB (NFκB)-dependent signaling pathways, creating a microenvironment that resists monocyte adhesion. J Biol Chem. 2014;289:15393–15404. doi: 10.1074/jbc.M113.544338. [DOI] [PMC free article] [PubMed] [Google Scholar]
- 33.Meng F, Zhang S, Song R, Liu Y, Wang J, Liang Y, Wang J, Han J, Song X, Lu Z, et al. NCAPG2 overexpression promotes hepatocellular carcinoma proliferation and metastasis through activating the STAT3 and NF-κB/miR-188-3p pathways. EBioMedicine. 2019;44:237–249. doi: 10.1016/j.ebiom.2019.05.053. [DOI] [PMC free article] [PubMed] [Google Scholar]
Associated Data
This section collects any data citations, data availability statements, or supplementary materials included in this article.
Supplementary Materials
Data Availability Statement
All data generated or analyzed during this study are included in this published article and its supplementary information files.


