Abstract
A gas‐phase investigation of the d‐fructose dehydration reaction in the presence of base has been performed by the joint application of mass spectrometric techniques and theoretical calculations. Protonated addition products of d‐fructose and base were generated in the gas phase by electrospray ionization using several bases of different proton affinity. The intermediates, products and decomposition channels were investigated by ion trap mass spectrometry. Electronic structure calculations allowed the identification of the ionic intermediates and products of a selected system containing NH3, helping to rationalize the observed reaction pathways. The obtained results show that the final product, the protonated 5‐hydroxymethyl‐2‐furaldheyde [5‐HMF]H+, is better formed using selected bases and only if these remain clustered until the end of the dehydration process.
Keywords: green chemistry, density functional calculations, gas-phase reactions, mass spectrometry, reactions mechanism
1. Introduction
The transition from a linear to a circular economy requires the development of efficient processes for the production of chemicals and fuels from sustainable feedstocks.1 Lignocellulosic biomass is the largest natural source of carbon2 and the hydrolysis of its cellulosic and hemicellulosic components produces sugars that can be subsequently converted to important furanic compounds such as 5‐hydroxymethyl‐2‐furaldehyde (5‐HMF) and 2‐furaldehyde (2‐FA).3
Among chemical intermediates issued from renewable carbon, 5‐HMF is probably the top building block. It has been named “the sleeping giant”, being the precursor of a large variety of chemicals, pharmaceuticals and furan‐based polymers currently derived from petroleum.4 In solution, the formation of 5‐HMF occurs from the acid‐catalyzed triple dehydration of hexoses; by far, the highest 5‐HMF yields were obtained from d‐fructose dehydration, a multistep process, object of many experimental and theoretical studies.5, 6, 7, 8, 9, 10, 11, 12, 13, 14, 15 However, nowadays, 5‐HMF is not yet produced on an industrial scale, mainly owing to high production costs16 deriving from a series of side‐reactions that strongly influence the efficiency of the process, such as the rehydration into levulinic and formic acids, polymerization or cross‐polymerization processes.
In water, the proper solvent for carbohydrates and products, the selectivity of d‐fructose dehydration to 5‐HMF is usually low. In fact, water promotes the formation of levulinic and formic acids more than organic media.17 In a non‐aqueous system, such as DMSO, the rehydration reaction of 5‐HMF can be suppressed, whereas the formation of polymeric substances remains.18 Furthermore, the formation of different sulfur‐containing side‐products and the difficult 5‐HMF extraction preclude the application of DMSO in a large scale.18 Nevertheless, in DMSO high 5‐HMF selectivity is achieved due to the preferential stabilization of the furanoid tautomer of fructose.15
Nowadays, the most promising results for the d‐fructose to 5‐HMF conversion have been obtained in ionic liquids (ILs),19, 20 used either as solvents or as catalysts.21 Recently, a one‐ pot hydrolysis/dehydration of polysaccharides into 2‐FA or 5‐HMF in the presence of ILs was reported.22 Caprolactam hydrogen sulfate [CPL][HSO4], a relatively cheap and scarcely toxic IL, was proposed for the efficient production of 5‐HMF through sugar dehydration.23
Interestingly, also substituted ammonium salts have been reported to catalyze the selective d‐fructose dehydration to 5‐HMF.24, 25 Tetraethylammonium chloride (TEAC) was found to be the most efficient solvent/catalyst allowing 81,3 % 5‐HMF yields; 24 more recently, a poly‐benzylic ammonium chloride resin was developed as a highly efficient catalyst for dehydration of carbohydrates into 5‐HMF.25
Insights into the kinetically significant steps of fructose dehydration have been previously obtained from theoretical calculation using high level quantum chemical methods with the explicit water solvent.8, 10 The computed potential energy surface is found to be much more favourable for the reaction in acidic media, and water was found to mediate the intramolecular proton transfer.
Despite the great efforts devoted to the search for new synthetic strategies, a few experimental studies are aimed at understanding the reaction mechanism. In this context, we investigated the gas‐phase d‐fructose dehydration to 5‐HMF, in the presence of bases containing ammonium, amide or amino functional groups, by mass spectrometric techniques and theoretical methods. In fact, gas‐phase studies can provide a mechanistic picture only determined by the intrinsic chemical properties of reactant species, and not influenced by environmental effects such as the nature of the solvent and the presence of counter ions. The dehydration reaction has been studied by collisional activation of suitable gaseous precursor ions, intermediates and final products.26, 27, 28, 29, 30, 31 This approach was previously used to investigate the dehydration of protonated d‐xylose to 2‐FA27 and of protonated d‐glucose and d‐fructose to 5‐HMF.28, 29 These gas‐phase studies can offer a useful benchmark for the comprehension of the biomass conversion in solution and for the optimization of catalytic strategies relevant to green sustainable routes to these processes.
2. Results and Discussion
2.1. Gaseous Precursor Ions
The electrospray ionization of an equimolar solution of d‐fructose and a base leads to the formation of gaseous products, formally denoted as [m ⋅ H ⋅ B]+ where m is the mass of d‐fructose (180 Da) or its dehydration/decomposition products. As an example, the adduct containing d‐fructose is denoted as [180 ⋅ H ⋅ B]+ and those containing the mono‐dehydrated (162 Da), doubly‐dehydrated (144 Da) and triply‐dehydrated (126 Da) d‐fructose are denoted as [162 ⋅ H ⋅ B]+, [144 ⋅ H ⋅ B]+ and [126 ⋅ H ⋅ B]+, respectively.
The possible reaction pathways from different addition products [180 ⋅ H ⋅ B]+ to the various intermediates and final products were investigated step by step by MSn mass spectrometry: the ions having a specific m/z are selected, isolated and dissociated by collisional activated dissociation (CAD), and the so formed product ions are in turn trapped and fragmented sequentially in time. This process can be repeated a number of times, resulting in a series of MSn spectra where n represents the number of times the isolation and fragmentation cycle has been carried out.
2.2. Ionic Intermediates
The decompositions of the adducts [180 ⋅ H ⋅ B]+ and their dehydration products are reported in Tables 2–3. The salient results are the following.
Table 2.
Dissociations of the dehydration product [162 ⋅ H ⋅ B]+ of the protonated adducts of Table 1.a
| Base | Products distribution | ||||||
|---|---|---|---|---|---|---|---|
| −H2O [144 ⋅ H ⋅ B]+ | −162 [B ⋅ H]+ | −B [162 ⋅ H]+ | −2 H2O [126 ⋅ H ⋅ B]+ | −H2O, ‐B [144 ⋅ H]+ | −2H2O, −B [126 ⋅ H]+ | −2H2O, −CH2O [96 ⋅ H ⋅ B]+ | |
| HCONH2 | 16.8 | 34.0 | 8.4 | 3.9 | 7.3 | 29.6 | |
| NH3 | 5.0 | 52.0 | 1.6 | 35.0 | 3.7 | 2.7 | |
| CH3CONH2 | 24.1 | 8.8 | 1.0 | 13.9 | 0.7 | 7.3 | 44.2 |
| NH2CONH2 | 28.1 | 8.4 | 18.1 | 0.8 | 6.0 | 38.4 | |
| 4‐F‐C6H4NH2 | 2.0 | 70.0 | 10.0 | 14.0 | 4.0 | ||
| Uracil | 6.0 | 46.0 | 2.4 | 3.8 | 3.8 | 11.1 | 26.5 |
| C6H5NH2 | 1.8 | 91.3 | 2.9 | 4.0 | |||
| NH2CH2COOH | 3.0 | 91.5 | 1.5 | 1.6 | 2.4 | ||
| C6H5CONH2 | 100 | ||||||
| (CH3)NHCONH2 | 13.5 | 65.6 | 7.3 | 13.6 | |||
| Valerolactam | 100 | ||||||
| Caprolactam | 100 | ||||||
| Imidazole | 93.7 | 6.3 | |||||
Table 3.
Dissociations of the dehydration product [144 ⋅ H ⋅ B]+ of the monodehydrated ions of Table 2.a
| Base | Products distribution | ||||
|---|---|---|---|---|---|
| −H2O [126 ⋅ H ⋅ B]+ | −144 [B ⋅ H]+ | −B [144 ⋅ H]+ | −H2O, −CH2O [96 ⋅ H ⋅ B]+ | −H2O, −B [126 ⋅ H]+ | |
| HCONH2 | 12.6 | 34.0 | 36.4 | 17.0 | |
| NH3 | 10.4 | 0.5 | 45.3(3.8) b | 40.0 | |
| CH3CONH2 | 16.2 | 11.0 | 0.4 | 65.2 | 7.2 |
| NH2CONH2 | 14.0 | 13.0 | 70.0 | 3.0 | |
| 4‐F‐C6H4NH2 | |||||
| Uracil | 10.5 | 35.1 | 49.5 | 4.9 | |
| C6H5NH2 | |||||
| NH2CH2COOH | |||||
| C6H5CONH2 | |||||
| (CH3)NHCONH2 | 1.3 | 46.7 | 52.0 | ||
| Valerolactam | |||||
| Caprolactam | |||||
| Imidazole | |||||
a In italics the systems reported in Figures 1 and 2. b In parentheses the intensity of the [96 ⋅ H]+ ion.
The [180 ⋅ H ⋅ B]+ ion undergoes dehydration to [162 ⋅ H ⋅ B]+ and formation of BH+, the latter being not observed with bases such as HCONH2, NH3, CH3CONH2 and NH2CONH2 (Table 1). Notably, any possible dissociation into NH4 + (m/z 18) could not be observed due to the low mass limit of the ion trap. In some cases, minor peaks corresponding to further dehydration to [144 ⋅ H ⋅ B]+ or also to concomitant loss of water and B are observed and mainly attributed to the consecutive dissociation of abundant [162 ⋅ H ⋅ B]+ products.
The most representative channels of the mono‐dehydrated ion [162 ⋅ H ⋅ B]+ are (Table 2): dehydration to [144 ⋅ H ⋅ B]+, formation of BH+ and loss of the neutral base B. Their abundance depends on the base, i. e. the dehydration is not observed with some bases like C6H5CONH2, imidazole and lactams, the formation of BH+ is significant starting from 4‐F‐C6H4NH2 as also observed for [180 ⋅ H ⋅ B]+ (Table 1), the loss of B is significant in the case of ammonia and formamide. Other peaks corresponding to further dehydration and base loss are also observed. Finally, a peak corresponding to the CH2O loss from the doubly‐dehydrated product is especially intense in the case of HCONH2, CH3CONH2, NH2CONH2 and uracil.
The doubly‐dehydrated ion, [144 ⋅ H ⋅ B]+, again gives dehydration to [126 ⋅ H ⋅ B]+, formation of BH+ and B loss. The losses of H2O/B and H2O/CH2O lead to the final products [126 ⋅ H]+ and [96 ⋅ H]+, the latter only observed from the dissociation of isolated [96 ⋅ H ⋅ B]+ ions with the exception of NH3.
-
A word of mention is deserved by the [162 ⋅ H]+ ion formed from the [180 ⋅ H ⋅ B]+→[162 ⋅ H ⋅ B]+→[162 ⋅ H]+ sequence (Table 2), relevant to the investigated reactions as illustrated in the following. The MS3 spectrum of this ion and the CAD spectrum of the m/z 163 ion directly obtained from the acid‐catalyzed dehydration of D‐fructose, in independent experiments, are much the same and give the dehydrated ions [144 ⋅ H]+ and [126 ⋅ H]+ (Figure 1
Figure 1.
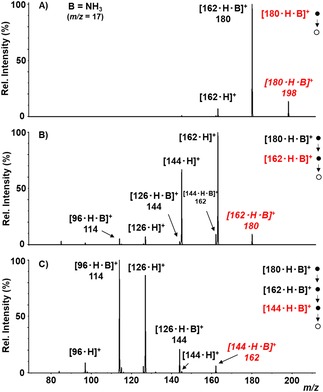 IT‐MSn mass spectra of the [180 ⋅ H ⋅ NH3]+ ions. A) MS2 spectrum of [180 ⋅ H ⋅ NH3]+ at m/z=198; B) MS3 of the dehydrated ion [162 ⋅ H ⋅ NH3]+ at m/z=180 selected from the ion at m/z=198; C) MS4 of the ion [144 ⋅ H ⋅ NH3]+ at m/z=162 from the sequential isolation 198→180→162. In red the parent ions. Note that, due to the isobaric H2O and NH4 moieties, the molecular mass of the mono‐ and doubly‐ dehydrated ions, [162 ⋅ H ⋅ NH3]+ and [144 ⋅ H ⋅ NH3]+, happens to be 180 and 162 Da, respectively.
S in the Supporting Information).
Table 1.
Dissociations of the protonated adducts of d‐fructose with selected bases B [180 ⋅ H ⋅ B]+.a
| Base | Products distribution | |||
|---|---|---|---|---|
| −H2O [162 ⋅ H ⋅ B]+ | −180 [B ⋅ H]+ | −2H2O [144 ⋅ H ⋅ B]+ | −H2O, −B [162 ⋅ H]+ | |
| HCONH2 | 100 | |||
| NH3 | 93.0 | 7.0 | ||
| CH3CONH2 | 98.0 | 2.0 | ||
| NH2CONH2 | 97.6 | 2.4 | ||
| 4F‐C6H4NH2 | 50.0 | 46.0 | 4.0 | |
| Uracil | 98.0 | 2.0 | ||
| C6H5NH2 | 37.0 | 63.0 | ||
| NH2CH2COOH | 88.0 | 12.0 | ||
| C6H5CONH2 | 65.0 | 35.0 | ||
| (CH3)NHCONH2 | 91.2 | 6.5 | 2.0 | |
| Valerolactam | 38.0 | 62.0 | ||
| Caprolactam | 21.0 | 79.0 | ||
| Imidazole | 6.0 | 94.0 | ||
a In italics the systems reported in Figures 1 and 2.
As an example of the investigated systems, Figures 1 and 2 report some sequential MSn spectra of [180 ⋅ H ⋅ NH3]+ and [180 ⋅ H ⋅ NH2CONH2]+, respectively. As shown, the most abundant fragment in the CAD spectrum of [180 ⋅ H ⋅ NH3]+ (Figure 1A, Table 1) is the dehydration product [162 ⋅ H ⋅ NH3]+, whereas in the CAD of [162 ⋅ H ⋅ NH3]+ the most intense peak is the [162 ⋅ H]+ ion formed by B loss (Figure 1B, Table 2). Also abundant in the latter is the [144 ⋅ H]+ ion, coming from the subsequent dehydration of [162 ⋅ H]+. Notably, minor peaks corresponding to [144 ⋅ H ⋅ NH3]+ and [126 ⋅ H ⋅ NH3]+ indicate that some dehydration also occurs from [162 ⋅ H ⋅ NH3]+ maintaining the base B. Finally, the most abundant ions in the CAD of [144 ⋅ H ⋅ NH3]+ (Figure 1C) are the [126 ⋅ H]+ and [96 ⋅ H ⋅ NH3]+ products, coming from the loss of B and CH2O from [126 ⋅ H ⋅ NH3]+, respectively (Table 3).
Figure 2.
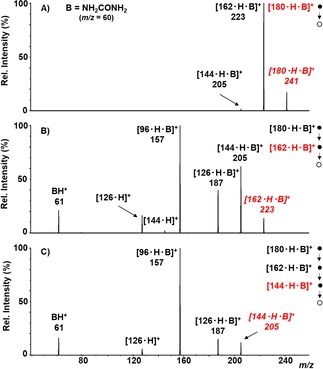
IT‐MSn mass spectra of the [180 ⋅ H ⋅ NH2CONH2]+ ions. A) MS2 spectrum of the [180 ⋅ H ⋅ NH2CONH2]+ ion at m/z=241; B) MS3 of the dehydrated ion [162 ⋅ H ⋅ NH2CONH2]+ at m/z=223 selected from the ion at m/z=241; C) MS4 of the [144 ⋅ H ⋅ NH2CONH2]+ ion at m/z=205 from the sequential isolation 241→223→205. In red the parent ions.
Different from the [180 ⋅ H ⋅ NH3]+ ion, the spectra of the [180 ⋅ H ⋅ NH2CONH2]+ adduct (Figure 2A) and its dehydration products [162 ⋅ H ⋅ NH2CONH2]+ and [144 ⋅ H ⋅ NH2CONH2]+ (Figure 2B–2 C) show all peaks corresponding to the sequential dehydration processes to the [126 ⋅ H ⋅ NH2CONH2]+ ion that has lost three water molecules, whereas the loss of B is negligible or absent.
Based on the above, three reaction pathways can be identified (Scheme 1).
Scheme 1.

Dissociation reaction sequences of protonated adducts of D‐fructose and bases B.
Path 1 (red line) is the D‐fructose dehydration assisted by the base, that remains coordinated till to [126 ⋅ H ⋅ B]+ which eventually either loses the base B giving the [126 ⋅ H]+ ion, or loses CH2O and B giving [96 ⋅ H ⋅ B]+ and [96 ⋅ H]+.
Path 2 (blue line) is the simple dissociation into BH+.
Path 3 (green line) is the alternative dehydration route that is observed from the mono‐dehydrated ion [162 ⋅ H ⋅ B]+, that first loses the B moiety giving [162 ⋅ H]+, and then sequentially loses two molecules of water leading to the ion [126 ⋅ H]+.
2.3. Final Products
Both paths 1 and 3 lead to the formation of the [126 ⋅ H]+ ion, by loss of base and three molecules of water. To investigate the structure of this product, the CAD spectra of the ions at m/z 127 obtained from the two paths were compared to that of a standard obtained by protonation of 5‐HMF. Figure 3 reports the CAD spectra of the [126 ⋅ H]+ ions obtained (A) from path 1, (B) from path 3, (C) by protonation of a standard sample of 5‐HMF. As shown, the CAD spectrum of the protonated 5‐HMF (Figure 3C) is characterized by the only fragment at m/z 109, arising from the loss of a water molecule. The CAD spectrum of the [126 ⋅ H]+ ions formed by path 1 (Figure 3A), that is the base‐assisted dehydration, is superimposable with that of protonated 5‐HMF. By contrast, the CAD of the [126 ⋅ H]+ ions arising from path 3 (Figure 3B) significantly differs from that of the standard.
Figure 3.
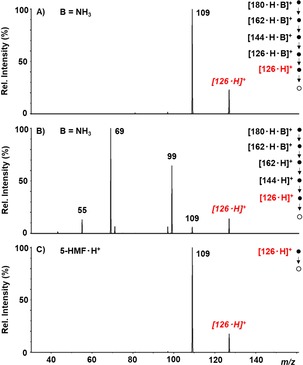
CAD mass spectra of the ions at m/z 127 obtained (A) from path 1, (B) from path 3 and (C) by protonation of 5‐HMF. In red the parent ions.
As for the [96 ⋅ H]+ ion, formed by path 1, the CAD spectrum of the ion obtained from the reaction sequences that start from [180 ⋅ H ⋅ B]+ cannot unfortunately be recorded, due to the low final signal. However, when isolated in the full‐scan mass spectrum, the CAD of [96 ⋅ H]+ is superimposable with that of the standard protonated 2‐furaldehyde ([2‐FA]H+) (Figure 2S).
2.4. Electronic Structure Calculations
The base‐assisted D‐fructose dehydration has been theoretically investigated at the B3LYP/6‐31G(2df,p) level of theory, by choosing the system containing NH3. The structures of the minima identified on the potential energy surface are reported in Figures 4 and 5. In particular, Figure 4 reports the structures of the precursor ion A, namely the protonated D‐fructose‐NH3 adduct, the mono‐dehydrated intermediate B1 and its isomers B2 and B3, the doubly and triply‐ dehydrated intermediates C and D, and the final product E that has lost NH3. Figure 5 reports the structures of the intermediates identified upon NH3 loss from B2: the isomers b and b1, corresponding to protonated forms of mono‐dehydrated D‐fructose, the doubly‐dehydrated intermediate c and its isomer c1, and the final product E1 formed by loss of the last water molecule.
Figure 4.
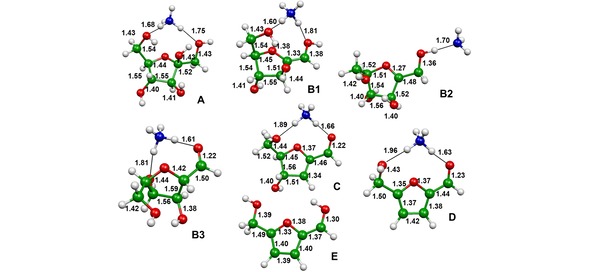
Optimized geometries at the B3LYP/6‐31G(2df,p) level of theory of the minima identified on the potential energy surface of the protonated d‐fructose dehydration assisted by ammonia. Bond lengths in Å.
Figure 5.
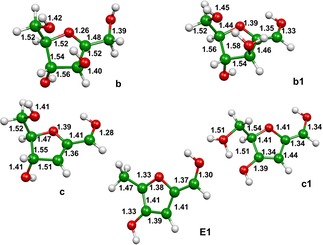
Optimized geometries at the B3LYP/6‐31G(2df,p) level of theory of the minima identified on the potential energy surface of the protonated D‐fructose dehydration after ammonia loss from the B2 intermediate (see Figure 4). Bond lengths in Å.
The energy profile of Figure 6 shows that the dehydration of A branches off after the formation of the mono‐dehydrated D‐fructose‐NH3 protonated adduct B2. The path to the product E (red line) involves the dehydration of intermediates all containing the NH3 moiety (Figure 4), whereas the path to the product E1 (green line) involves the dehydration of intermediates that have lost the NH3 moiety (Figure 5). These results are in good agreement with the experimental evidence (Scheme 1) that, after the loss of the first water molecule, has identified the path 1 occurring by loss of two water molecules followed by NH3 loss, and path 3 occurring by the preliminary loss of NH3 followed by the loss of two water molecules.
Figure 6.
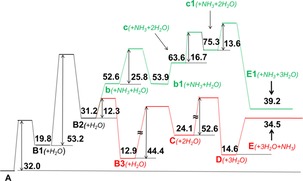
Energy profile (▵H° in kcal mol−1) of the protonated D‐fructose‐NH3 adduct dehydration computed at the B3LYP/6‐31G(2df,p) level of theory. Red line, dehydration path through NH3‐bound intermediates (Figure 4). Green line, dehydration path by preliminary loss of NH3 (Figure 5).
The whole process is described in detail in Schemes 2–4. Scheme 2 reports the mechanism of the A→B1→B2 reaction sequence common to the paths 1 and 3. According to the theory, the precursor ion A is characterized by an ammonium ion coordinated by two hydrogen bonds to the O6H and O1H groups of D‐fructose, having the length of 1.68 and 1.75 Å, respectively. The latter bond increases the acidity of the hydrogen atom bound to C1, and hence a proton shift from C1 to O2 occurs. Accordingly, the first dehydration step of A, characterized by an energy barrier of 32.0 kcal mol−1, involves the D‐fructose tertiary O2H group and causes the shortening of the C1‐C2 bond of B1 from 1.52 Å to 1.33 Å, consistent with a double‐bond character. The isomerization of B1 to B2 involves a proton transfer from the ammonium moiety to the C1 atom, with an energy barrier of 53.2 kcal mol−1, likely due to the loss of coordination and to an unfavored proton transfer. In addition, passing from B1 to B2, the coordination changes from O−HNH3 to OH−NH3 with a H−N bond of 1.70 Å. Once formed, B2 can give rise to B3 through path 1 or to b through path 3 (Figure 6, Scheme 1). These routes are described in Schemes 3 and 4.
Scheme 2.

Mechanism of the dehydration sequence A‐B2.
Scheme 4.
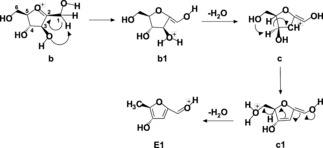
Mechanism of the dehydration sequence b‐E1.
Scheme 3.
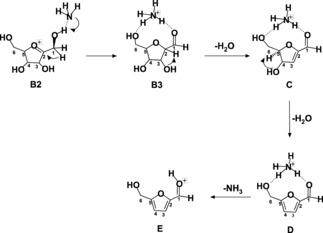
Mechanism of the dehydration sequence B2‐E.
The path of Scheme 3 begins with the B2 →B3 isomerization, where the ammonium group is reformed by proton transfer from the O1 atom to the ammonia; likewise, the double coordination of the ammonium group with the O6H and O1H groups is reestablished. The next dehydration steps to C and D occur by elimination of H2O from the O3H and O4H groups, respectively. By NH3 loss, the last step leads to the final product E corresponding to [5‐HMF]H+, that is indeed the experimentally observed product from path 1. No route has been instead identified by calculations to the other experimentally observed product [2‐FA]H+.
Scheme 4 describes the alternative route beginning from the intermediate b that has lost NH3. As anticipated, b corresponds to a protonated form of mono‐dehydrated D‐fructose, having lost H2O and NH3 from the precursor ion A. Since protonated D‐fructose cannot be experimentally observed,29 due to the prompt elimination of H2O, it is evident that the reaction path from b overlaps with the acid‐catalyzed D‐fructose dehydration. Through this path, b1 is formed from b by proton transfer from C1 to O3H, and then a water molecule is lost from b1 forming c. The ion c then undergoes further isomerization to c1 by proton transfer from C4 to O6H. c1 eventually loses the last water molecule giving the final product E1, having the structure of protonated 5‐methyl‐4‐hydroxy‐2‐furaldehyde i. e. an isomer of [5‐HMF]H+. Again, this finding agrees with the experimental evidence that the product of path 3 has not the structure of [5‐HMF]H+. Notably, an alternative path leading to [5‐HMF]H+ has been found from ion c, that however involves an energy barrier of 56.7 kcal mol−1 far higher than the 16.7 kcal mol−1 barrier required for the c→c1 isomerization.
2.5. Role of the Base in the Gas‐Phase Dehydration of Protonated d‐Fructose
While it is not possible in the gas phase to experimentally observe free protonated D‐fructose, unstable towards the first dehydration,29, 32 the present results demonstrate that it is possible to trap protonated D‐fructose in a cluster in the presence of base. Protonated adducts [180 ⋅ H ⋅ B]+ have been indeed observed with all the investigated bases. The theoretically computed reaction paths of the adducts containing ammonia cannot of course be extended to all the investigated bases, nonetheless they can be a useful guide to interpret the experimental results. Interestingly enough, consistent with the experimental evidence, the first dehydration of [180 ⋅ H ⋅ NH3]+ is characterized by a kinetic barrier of 32.0 kcal mol−1, whereas no kinetic barrier has been found by theory for the dehydration of protonated D‐fructose, the only barrier being the endothermicity of the process (20.1 kcal mol−1). The experimental and theoretical results thus indicate that the interaction of the base with D‐fructose is the crucial feature influencing the 1–3 reaction pathways.
In order to rationalize the whole results, Table 4 reports the proton affinities of the investigated bases33, 34, 35, 36 and the intensities of the CAD ions attributed to each path, i. e. the column denoted as −H2O reports the intensity of the dehydrated intermediates containing B and their products, the column denoted as ‐B reports the intensity of the dehydrated intermediates without B and their products. Starting from the 1–2 reaction pathways, it is evident that the formation of BH+ increases with the proton affinity of the base which has therefore a major role in addressing the dehydration process. For example, in the case of imidazole, the base having the highest PA, the path 1 represents only 6 %. A reasonable exception can be offered by methyl urea, the polyfunctional structure of which may likely account for the low intensity of the BH+ ion. The path 3 is significant only for bases of lower proton affinity, like ammonia and formamide, that fail to maintain the coordination with the dehydrated fructose.
Table 4.
Proton affinities of the selected bases B and products distribution of the [180 ⋅ H ⋅ B]+, [162 ⋅ H ⋅ B]+ and [144 ⋅ H ⋅ B]+ ions dissociating along the 1, 2 and 3 pathways.
| Base | PAa (kcal mol−1) | Pathways distribution (%) | |||||||
|---|---|---|---|---|---|---|---|---|---|
| [180 ⋅ H ⋅ B]+ | [162 ⋅ H ⋅ B]+ | [144 ⋅ H ⋅ B]+ | |||||||
| 1 | 2 | 1 | 2 | 3 | 1 | 2 | 3 | ||
| −H2O | B ⋅ H+ | −H2O | B ⋅ H+ | −B | −H2O | B ⋅ H+ | −B | ||
| HCONH2 | 196.5 | 100 | 54.8b | 45.2c | 49.0d | 51.0c | |||
| NH3 | 204.0 | 100e | 9.3b | 90.7c | 59.5d | 40.5c | |||
| CH3CONH2 | 206.4 | 100c | 82.2b | 8.8 | 9.0c | 81.4d | 11.0 | 7.6c | |
| NH2CONH2 | 207.6f | 100c | 84.6b | 8.4 | 7.0c | 84.0d | 13.0 | 3.0c | |
| 4F‐C6H4NH2 | 208.3 | 54.0e | 46.0 | 2.0 | 70.0 | 28.0c | |||
| Uracil | 208.6 | 98.0 | 2.0 | 36.3b | 46.0 | 17.3c | 60.0 | 35.1 | 4.9c |
| C6H5NH2 | 210.9 | 37.0 | 63.0 | 1.8 | 91.3 | 6.9c | |||
| NH2CH2COOH | 211.9 | 88.0 | 12.0 | 4.6b | 91.5 | 3.9c | |||
| C6H5CONH2 | 213.2 | 65.0 | 35.0 | 100 | |||||
| (CH3)NHCONH2 | 215.2g | 93.0c | 7.0 | 34.4b | 65.6 | 53.3d | 46.7 | ||
| Caprolactam | 218.6h | 21.0 | 79.0 | 100 | |||||
| Valerolactam | >218.6h | 38.0 | 62.0 | 100 | |||||
| Imidazole | 225.3 | 6.0 | 94.0 | 93.7 | 6.3 | ||||
a Unless stated otherwise, PA values were taken from ref. 33; b Consecutive loss of H2O and H2O/CH2O included. c Consecutive loss of one or two H2O molecules included. d Consecutive loss of CH2O included. e Consecutive loss of B from [162 ⋅ H ⋅ B]+ included (NH3, 7 %; 4F‐C6H4NH2, 4 %). f Ref. 34; g Ref. 35; h Ref. 36.
In the specific case of NH3, theory shows that the path 3 efficiently competes with path 1 likely because entropic factors largely favor the B2→b dissociation with respect to the B2→B3 isomerization. In addition, the subsequent dehydration is characterized by high energetic barriers. In this case, the structural analysis does not assign the final product the structure of [5‐HMF]H+, in agreement with what previously observed in the gas‐phase acid‐catalysed dehydration of D‐fructose.29 Conversely, in the other cases where the dehydration occurs in the presence of base, through path 1, this leads to a pure ionic population of protonated 5‐HMF.
With this regard, taking the protonated D‐fructose‐NH3 system as a model, the electronic structure calculations can help identifying the origin of the different products E and E1, only the former having the structure of [5‐HMF]H+. To this end, it is particularly telling the comparison of the processes occurring in ion C in the presence of base, with those occurring in ion c that has lost the base. In C the interaction of the base with the O6H moiety prevents the water loss from O6H, thus maintaining the CH2OH group of 5‐HMF. In contrast, in ion c the O6H group is free and hence it can be lost as water forming a methyl group on the furan ring. As a result, the only way to obtain [5‐HMF]H+ is the dehydration within the cluster containing the base, whereas, as long as the base is lost, the dehydration produces a mixture of different by‐products.
Finally, it is important to underline the formation of furfural by the same path 1 leading to [5‐HMF]H+, thus showing that the same bases that promote formation of [5‐HMF]H+ also allow the observation of [2‐FA]H+. This finding in the gas phase may unravel a new route to 2‐FA, observed in solution only as a minor product from the D‐fructose decomposition.
In summary, the obtained picture indicates that the bases with the highest PA form BH+ and those with the lowest PA lose B, thus bracketing between 206 and 208 kcal mol−1 the PA range suitable to obtain the important platform molecules [5‐HMF]H+ and [2‐FA]H+.
3. Conclusion
The experimental and theoretical investigation of the dehydration of protonated D‐fructose in the presence of different bases shows that these address the reaction to the formation of protonated 5‐HMF. Conversely, when the base is lost at the beginning of the process, this mimics the dehydration of protonated D‐fructose that forms an isomer or mixture of isomers of 5‐HMF. A correlation has been found between the behaviour of the investigated adducts and the proton affinity of the bases used. On this basis, it can be inferred that in the gas phase the interaction of the basic site with D‐fructose plays a crucial role in determining the fate of the adducts through different pathways, thus preventing dehydration on the hydroxymethyl group.
Experimental Section
Mass Spectrometric Experiments
Full scan and MSn mass spectra were acquired by using an AmaZon SL ion trap instrument operating in the positive ion mode (Bruker, Germany). Electrospray source conditions were as follows: capillary −4000/−4500 V, end plate offset −400/−450 V, nebulizer 5.0 psi, dry gas 2.5 L/min, dry temperature 200 °C. Experiments were performed by direct infusion of 10−3 M solutions of D‐fructose and a base in methanol/water (1 : 1, V/V) with a 10 μL/min flow rate. NH4Cl was used to obtain the D‐fructose/ammonia adducts. Full scan mass spectra were acquired from m/z 50 to m/z 500 and represent the average of 50 scans.
MSn experiments were performed by isolating the reactant ions with a width of 1 m/z and subjected them to dissociation. Typical dissociation energies were in the range of 10–20 volt for a time of 30 ms and a fragmentation delay of 10 ms. Subsequent steps of isolation and fragmentation of the initial fragment ions were inserted into the scan sequence to prove each fragmentation channel. The same parameters were employed for any further isolation/fragmentation cycles. When the m/z values of any of the fragment ions were lower than 27 % of that of the precursor ion, the cut‐off parameter was changed accordingly, so to prevent the loss of low‐mass fragment ions. The standard deviation in the measure of peak intensities is usually evaluated at 10 %. All chemicals were obtained from Sigma‐Aldrich Ltd (St. Louis, Mo, USA) and used as received.
Computational Methods
The potential energy surfaces of the system of interest were investigated by locating the lowest stationary points at the B3LYP37 level of theory in conjunction with the 6–31G(2df,p) basis set.38 At the same level of theory we have computed the harmonic vibrational frequencies in order to check the nature of the stationary points, i. e. minimum if all the frequencies are real, saddle point if there is one, and only one, imaginary frequency. The assignment of the saddle points was performed using intrinsic reaction coordinate (IRC) calculations.39 The B3LYP energies were corrected to 298.15 K by adding the zero point energy correction computed using the scaled harmonic vibrational frequencies evaluated at B3LYP level. All calculations were done using Gaussian 0940 while the analysis of the vibrational frequencies was performed using Molekel.41
Conflict of interest
The authors declare no conflict of interest.
Supporting information
As a service to our authors and readers, this journal provides supporting information supplied by the authors. Such materials are peer reviewed and may be re‐organized for online delivery, but are not copy‐edited or typeset. Technical support issues arising from supporting information (other than missing files) should be addressed to the authors.
Supplementary
Acknowledgements
Financial support by Sapienza University of Rome and by “L. Vanvitelli” University of Campania (the latter through Regional Law n. 5‐2007) are gratefully acknowledged.
A. Troiani, G. de Petris, F. Pepi, S. Garzoli, C. Salvitti, M. Rosi, A. Ricci, ChemistryOpen 2019, 8, 1190.
Contributor Information
Dr. Anna Troiani, Email: anna.troiani@uniroma1.it.
Prof. Dr. Andreina Ricci, Email: andreina.ricci@unicampania.it.
References
- 1.
- 1a. Sheldon R. A., ACS Sustainable Chem. Eng. 2018, 6, 32–48; [Google Scholar]
- 1b. Murray A., Skene K., Haynes K., J. Business Ethics 2017, 140, 369–380. [Google Scholar]
- 1c. Glavic P., Lukman R., J. Cleaner Prod. 2007, 15, 1875–1885. [Google Scholar]
- 2. Ragauskas A. J., Williams C. K., Davison B. H., Britovsek G., Cairney J., Eckert C. A., W. J. Frederick Jr , Hallett J. P., Leak D. J., Liotta C. L., Mielenz J. R., Murphy R., Templer R., Tschaplinski T., Science 2006, 311, 484–489. [DOI] [PubMed] [Google Scholar]
- 3. Corma A., Iborra S., Velty A., Chem. Rev. 2007, 107, 2411–2502. [DOI] [PubMed] [Google Scholar]
- 4. Gandini A, Polym. Chem. 2010, 1, 245–251. [Google Scholar]
- 5. Caratzoulas S., Davis M. E., Gorte J. R., Gounder R., Lobo R. F., Nikolakis V., Sandler S. I., Snyder M. A., Tsapatis M., Vlachos D. G., J. Phys. Chem. C 2014, 118, 22815–22833. [Google Scholar]
- 6. Harris D. W., Feather M. S., Carbohydr. Res. 1973, 30, 359–365. [Google Scholar]
- 7. Antal M. J., Mok W. S. L., Richards G. N., Carbohydr. Res. 1990, 199, 91–109. [DOI] [PubMed] [Google Scholar]
- 8. Vlachos S. Caratzoulas D. G., Carbohydr. Res. 2011, 346, 664–672. [DOI] [PubMed] [Google Scholar]
- 9. Assary R. S., Redfern P. C., Hammond J. R., Greeley J., Curtiss L.A, J. Phys. Chem. B 2010, 114, 9002–9009. [DOI] [PubMed] [Google Scholar]
- 10. Assary R. S., Redfern P. C., Greeley J., Curtiss L. A., J. Phys. Chem. B 2011, 115, 4341–4349. [DOI] [PubMed] [Google Scholar]
- 11. Yang G., Pidko E. A., Hensen E. J. M. J. Catal. 2012, 295, 122–132. [Google Scholar]
- 12. Akien G. R., Qi L., Horvath I. T., Chem. Commun. 2012, 48, 5850–5852. [DOI] [PubMed] [Google Scholar]
- 13. Jadhav H., Pedersen C. M., Sølling T., Bols M., ChemSusChem 2011, 4, 1049–1051 [DOI] [PubMed] [Google Scholar]
- 14. Zhang J., Weitz E., ACS Catal. 2012, 2, 1211–1218. [Google Scholar]
- 15. Amarasekara A. S., Williams L. D., Ebede C. C., Carbohydr. Res. 2008, 343, 3021 [DOI] [PMC free article] [PubMed] [Google Scholar]
- 16. Van Putten J. C. van der Waal R. J., de Jong E., Rasrendra C. B., Heeres H. J., de Vries J. G., Chem. Rev. 2013, 113, 1499–1597. [DOI] [PubMed] [Google Scholar]
- 17. VanDam H. E., Kieboom A. P. G., Van Bekkum H., Starch 1986, 38, 3, 95–101. [Google Scholar]
- 18.
- 18a. Musau R. M., Munavu R. M., Biomass 1987, 13, 67–74. [Google Scholar]
- 19.E. Malgorzata, E. Zakrzewska, E. Bogel-Lukasik, R. Bogel-Lukasik, Chem. Rev 2011, 111, 397–417 and references therein; [DOI] [PubMed]
- 20. Yong G., Zhang Y., Ying J. Y., Angew. Chem. Int. Ed. 2008, 47, 9345. [DOI] [PubMed] [Google Scholar]
- 21. Lansalot-Matras C., Moreau C., Catal. Commun. 2003, 4, 517–520. [Google Scholar]
- 22. Lima S., Neves P., Pillinger M. M., Nikolai I., Valente A. A, Appl. Catal. A 2009, 363, 93–99. [Google Scholar]
- 23. Huang P., Gu A., Wang J., Res. Chem. Intermed. 2015, 41, 5311–5321. [Google Scholar]
- 24. Cao Q., Guo X., Guan J., Mu X, Zhan D., Appl. Catal. A 2011, 403, 98–103. [Google Scholar]
- 25. Teong S. P., Yi G., Cao X., Zhang Y., ChemSusChem 2014, 7, 2120–2126. [DOI] [PubMed] [Google Scholar]
- 26. Eberlin M. N., Eur. J. Mass Spectrom. 2007, 13, 19–29. [DOI] [PubMed] [Google Scholar]
- 27. Ricci A., Piccolella S., Pepi F., Garzoli S., Giacomello P., J. Am. Soc. Mass Spectrom. 2013, 24, 1082–1089. [DOI] [PubMed] [Google Scholar]
- 28. Ricci A., Di Rienzo B., Pepi F., Troiani A., Garzoli S., Giacomello P. , J. Mass Spectrom. 2015, 50, 228–234. [DOI] [PubMed] [Google Scholar]
- 29. Pepi F., Ricci A., Garzoli S., Troiani A., Salvitti C., Di Rienzo B., Giacomello P., Carbohydr. Res. 2015, 413, 145–150. [DOI] [PubMed] [Google Scholar]
- 30. Ricci A., Garzoli S., Antonini L., Troiani A., Salvitti C., Giacomello P., Ragno R., Patsilinakos A., Di Rienzo B., Pepi F., Carbohydr. Res. 2018, 458, 19–28. [DOI] [PubMed] [Google Scholar]
- 31. Cimino P., Troiani A., Pepi F., Garzoli S., Salvitti C., Di Rienzo B., Barone V., Ricci A., Phys. Chem. Chem. Phys. 2018, 17132–17140. [DOI] [PubMed] [Google Scholar]
- 32. Madhusudanam K. P., J. Mass Spectrom. 2006, 41, 1096–1104. [DOI] [PubMed] [Google Scholar]
- 33. Hunter E. P., Lias S. G., J. Phys. Chem. Ref. Data 1998, 27, 413–656. [Google Scholar]
- 34. Zheng X., Cooks R. G., J. Phys. Chem. A 2002, 106, 9939–9946. [Google Scholar]
- 35. Kallies B., Mitzner R., J. Mol. Struct. 1998, 428, 267–282. [Google Scholar]
- 36. Bouchoux G., Mass Spectrom. Rev. 2015, 34, 493–53. [DOI] [PubMed] [Google Scholar]
- 37.
- 37a. Becke A. D., J. Phys. Chem. 1993, 98, 5648; [Google Scholar]
- 37b. Stephens P. J., Devlin F. J., Chablowski C. F., Frisch M., J. Phys. Chem. 1994, 98, 11623. [Google Scholar]
- 38.
- 38a. Krishman R., Binkley J. S., Seeger R., Pople J. A., J. Chem. Phys. 1980, 72, 650; [Google Scholar]
- 38b.T. Clark, J. Chandrasekhar, G. W. Spitznagel, P. Schleyer v. R, J. Comput. Chem 1983, 4, 294;
- 38c. Frish M. J., Pople J. A., Binkley J. S., J. Chem. Phys. 1984, 80, 3265 and references therein. [Google Scholar]
- 39.
- 39a. Gonzales C., Schlegel H. B., J. Chem. Phys. 1989, 90, 2154; [Google Scholar]
- 39b. J. Phys. Chem. 1990, 94, 5523. [Google Scholar]
- 40.Gaussian 09, Revision A.02, M. J. Frisch, G. W. Trucks, H. B. Schlegel, G. E. Scuseria, M. A. Robb, J. R. Cheeseman, G. Scalmani, V. Barone, B. Mennucci, G. A. Petersson, H. Nakatsuji, M. Caricato, X. Li, H. P. Hratchian, A. F. Izmaylov, J. Bloino, G. Zheng, J. L. Sonnenberg, M. Hada, M. Ehara, K. Toyota, R. Fukuda, J. Hasegawa, M. Ishida, T. Nakajima, Y. Honda, O. Kitao, H. Nakai, T. Vreven, J. A. Montgomery Jr., J. E. Peralta, F. Ogliaro, M. Bearpark, J. J. Heyd, E. Brothers, K. N. Kudin, V. N. Staroverov, R. Kobayashi, J. Normand, K. Raghavachari, A. Rendell, J. C. Burant, S. S. Iyengar, J. Tomasi, M. Cosi, N. Rega, J. M. Milla, M. Klene, J. E. Knox, J. B. Cross, V. Bakken, C. Adamo, J. Jaramillo, R. Gomperts, R. E. Stratmann, O. Yazyev, A. J. Austin, R. Cammi, C. Pomelli, J. W. Ochterski, R. L. Martin, K. Morokuma, V. G. Zakrzewski, G. A. Voth, P. Salvador, J. J. Dannenberg, S. Dapprich, A. D. Daniels, O. Farkas, J. B. Foresman, J. V. Ortiz, J. Cioslowski, D. J. Fox, Gaussian, Inc., Wallingford CT (2009).
- 41.
- 41a. MOLEKEL 4.3, P. Flükiger, H. P. Lüthi, S. Portmann, J. Weber, Swiss Center for Scientific Computing, Manno (Switzerland), 2000–2002;
- 41b. Portmann S., Lüthi H. P., Chimia 2000, 54, 766. [Google Scholar]
Associated Data
This section collects any data citations, data availability statements, or supplementary materials included in this article.
Supplementary Materials
As a service to our authors and readers, this journal provides supporting information supplied by the authors. Such materials are peer reviewed and may be re‐organized for online delivery, but are not copy‐edited or typeset. Technical support issues arising from supporting information (other than missing files) should be addressed to the authors.
Supplementary


