

SUMMARY
Phase transitions involving biomolecular liquids are a fundamental mechanism underlying intracellular organization. In the cell nucleus, liquid-liquid phase separation of disordered proteins (IDPs) is implicated in assembly of the nucleolus, as well as transcriptional clusters, and other nuclear bodies. However, it remains unclear whether and how physical forces associated with nucleation, growth, and wetting of liquid condensates can directly restructure chromatin. Here we use CasDrop, a novel CRISPR/Cas9-based optogenetic technology, to show that various IDPs phase separate into liquid condensates that mechanically exclude chromatin as they grow, and preferentially form in low-density, largely euchromatic regions. A minimal physical model explains how this stiffness sensitivity arises from lower mechanical energy associated with deforming softer genomic regions. Targeted genomic loci can nonetheless be mechanically pulled together through surface tension-driven coalescence. Nuclear condensates may thus function as mechano-active chromatin filters, physically pulling-in targeted genomic loci, while pushing-out non-targeted regions of the neighboring genome.
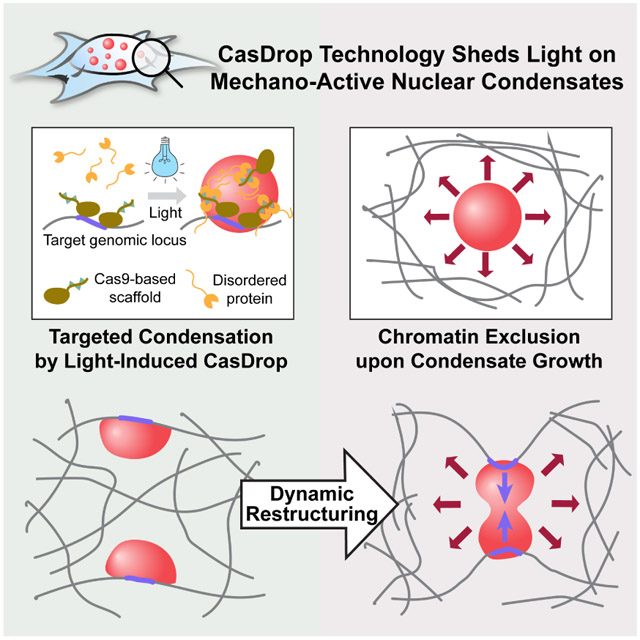
Graphical Abstract
INTRODUCTION
Liquid-liquid phase separation (LLPS) is a fundamental mechanism for organizing the contents of living cells (Banani et al., 2017; Shin and Brangwynne, 2017). LLPS is now recognized as important for driving assembly of a wide range of membrane-less condensates, including cytoplasmic structures such as germ (P) granules (Brangwynne et al., 2009), stress granules (Wippich et al., 2013), miRISC assemblies (Sheu-Gruttadauria and MacRae, 2018), and synaptic scaffolds (Milovanovic et al., 2018; Zeng et al., 2016). LLPS also appears to underlie nuclear body biogenesis, including nucleoli (Brangwynne et al., 2011; Feric et al., 2016; Mitrea et al., 2016), and likely many others (Zhu and Brangwynne, 2015). Associated liquid-to-solid phase transitions are also implicated in various diseases of pathological protein aggregation (Molliex et al., 2015; Murakami et al., 2015; Patel et al., 2015; Weber and Brangwynne, 2012). Intracellular phase transitions arise from weak, multivalent interactions, often mediated by intrinsically disordered proteins/regions (IDPs/IDRs), which are closely related to low complexity sequences and prion-like domains (Brangwynne et al., 2015; Elbaum-Garfinkle et al., 2015; Kato et al., 2012; Li et al., 2012; Nott et al., 2015).
Phase transitions within the nucleus are particularly interesting, since nuclear condensates must directly interact with chromatin, and thus potentially control its organization and gene expression. Consistent with this, the assembly and dynamics of nuclear condensates such as Cajal bodies, nucleoli, and speckles appear to impact chromatin architecture (Pombo and Dillon, 2015; Quinodoz et al., 2018; Wang et al., 2016). Recent studies suggest that phase separation of heterochromatin protein 1 (HP1) underlies formation of the heterochromatin domain, which is characterized as having higher chromatin density and contains mostly transcriptionally silent regions of the genome (Larson et al., 2017; Strom et al., 2017). Phase separation is also linked to active parts of the genome, with other phase separated bodies often associated with euchromatic regions of lower chromatin density. For example, nucleoli assemble at transcriptionally active ribosomal DNA loci, in a transcription-dependent manner (Berry et al., 2015; Falahati et al., 2016). Phase separation has also been recently implicated in driving gene activation through nanoscale transcriptional condensates assembled at enhancer-rich gene clusters (Cho et al., 2018; Chong et al., 2018; Sabari et al., 2018).
Despite the growing number of studies suggesting the importance of phase separation for nuclear organization, the biophysics of these processes remains mysterious. From a biophysical perspective, the genome is a complex viscoelastic polymer matrix (Stephens et al., 2017), whose 3D architecture and mechanics are key factors governing gene expression (Dekker and Mirny, 2016). On the one hand, gene activation through transcriptional condensates has been proposed to arise from droplets pulling together distal regions of the genome, through a still uncharacterized mechanism (Hnisz et al., 2017). This could be important for promoting enhancer-promoter interactions, that in some cases may be many kilobases away from one another (Chen et al., 2018), or even reside on different chromosomes (Lim et al., 2018). Surprisingly, this is conceptually similar to the proposed function of HP1, which may drive heterochromatin formation by condensing distal regions of the genome into compact, transcriptionally silent foci. In any case, it is unclear how phase separation could give rise to mechanical forces capable of restructuring the genome, while providing the specificity required to coordinate associated gene activity. Moreover, the way in which the mechanics of the genome may in turn impact phase separation, as a potential feedback mechanism for controlling gene expression, is still completely unknown.
These fundamental questions underscore the need for a quantitative understanding of the forces at play in mediating interactions between condensates and specific regions of the genome, and their consequences for the dynamics of phase separation and chromatin organization. One of the key challenges to addressing this problem is the lack of tools for controlling phase transitions in living cells. Recently, we and colleagues introduced a suite of optogenetic tools that allow for spatiotemporally controlling the assembly and disassembly of intracellular condensates (Bracha et al., 2018; Dine et al., 2018; Shin et al., 2017). However, these tools have not yet been combined with gene targeting approaches, and instead have relied on random nucleation of condensates, or used light to direct phase separation to spatially defined regions within the nucleus. There is thus an urgent need for new approaches to quantitatively probe the relationship between the mechanics of phase separation and heterogeneous chromatin structure, particularly for functionally relevant condensates targeted to specific genomic loci.
Here we introduce CasDrop, a novel CRISPR/Cas9-based optogenetic technology, and use it to show that IDRs from various nuclear proteins including BRD4, FUS, and TAF15 phase separate into liquid condensates that preferentially form in low-density genomic regions, and mechanically exclude chromatin as they grow. The condensates cannot be driven to form within dense satellite heterochromatin, nor do they mix with heterochromatic telomeres, but when specifically targeted to these regions, can cause them to be mechanically pulled together through surface tension-driven coalescence. A minimal physical model explains this preference for droplet condensation within low density chromatin, due to the lower mechanical energy cost of droplets deforming softer genomic regions. These findings suggest that nuclear condensates can function as mechano-active chromatin filters, causing distal targeted genomic elements to be pulled together, while mechanically excluding non-specific background components of the genome.
RESULTS
Design of CasDrop, a system for controlled liquid phase condensation at specific genomic loci
To study phase behavior within the nucleus, we have developed an optogenetic platform termed CasDrop, which can induce localized condensation of liquid droplets at specific genomic loci. Inspired by the way native subnuclear assemblies form, we sought to control the local concentration of transcriptional regulators and other nuclear proteins, by programmable seeding (Figure 1A). To achieve this, the CasDrop system is modularized with three components that allow for (1) pre-seeding, (2) optogenetic molecular assembly and (3) oligomerization-based phase separation (Figure 1A). Taking advantage of well-characterized CRISPR-Cas9 technology for programmable targeting to specific genomic loci, we build the first piece of our system from enzymatically dead Cas9 (dCas9) fused to SunTag (ST) (Tanenbaum et al., 2014). The second construct linking genomic pre-seeding to optogenetic assembly involves single-chain variable fragment (scFv) antibody, cognate for the ST, fused to superfolder GFP (sfGFP) and the optogenetic dimerization protein iLID (Guntas et al., 2015). When co-expressed in cells, these two constructs can self-assemble into a multimeric protein complex (hereafter referred to as dCas9-ST-GFP-iLID) allowing for visualization of seeded sites, at the same time providing light-inducible binding scaffolds for recruiting various protein components, including proteins that contain intrinsically disordered regions (IDRs).
Figure 1.

The CasDrop system enables liquid condensation of transcriptional regulators at target loci.
(A) Transcriptional regulators (TRs) are often enriched at regulatory DNA elements near genes and may facilitate local liquid-liquid phase separation. The CasDrop system is designed to function similarly yet with added genome-targeting programmability and optogenetic controllability. The modular components of the CasDrop include dCas9-ST, scFv-sfGFP-iLID and TR-mch-sspB.
(B) Pre-seeding at telomeres in a HEK293 cell by expressing dCas9-ST, scFv-sfGFP-iLID and sgRNA for telomeres. In the absence of the telomere-targeting sgRNA, punctate fluorescence signals are not observed.
(C) HEK293 cells expressing dCas9-ST, scFv-sfGFP-iLID and mch-sspB fused to different transcriptional regulators (TR) are activated with blue light. A control without expressing the dCas9-ST scaffold shows no clustering.
(D) Time lapse images of BRD4 CasDrop in a HEK293 cell showing rapid condensation followed by frequent coalescence between droplets (white arrowheads).
(E) (Left) Fluorescence images of a NIH3T3 cell expressing dCas9-ST, scFv-sfGFP-iLID, BRD4ΔN-mCh-sspB, miRFP670-TRF1 and sgRNA for telomeres. Images show localization patterns of each construct prior to blue light activation. (Right) Time lapse images of the same cell during blue light illumination.
See also Figure S1
We use IDRs from a number of nuclear proteins to examine their phase behaviors (Figure S1A). Of particular interest are transcriptional regulators including BRD4, TAF15 and FUS; BRD4 has received much recent attention, as it contains a long IDR (BRD4ΔN), is highly enriched in enhancer clusters, and is thought to play an important role in transcriptional activation as well as elongation (Lovén et al., 2013; Kanno et al., 2014). We hypothesized that by expressing these IDRs fused to the protein sspB, binding between iLID and sspB upon blue light activation will lead to formation of IDR oligomers at the target genomic loci, which would in turn drive localized liquid-liquid phase separation (Figure 1A).
We sequentially demonstrate the capacity of each CasDrop module targeted to telomeres, repetitive heterochromatic DNA elements found at the end of chromosomes. When dCas9-ST-sfGFP-iLID is expressed, several fluorescent puncta appear in the nucleus in a manner dependent on the expression of single guide RNA (sgRNA) cognate for telomeres (Figure 1B). We then examined light-induced phase separation of the CasDrop system in the absence of any sgRNA. Prior to blue light activation, both dCas9-ST-GFP-iLID and IDR-mCh-sspB show diffuse fluorescent signals in the nucleus (Figure 1C). Upon blue light exposure, formation of IDR oligomers through dCas9-ST-GFP-iLID scaffolds leads to rapid clustering of liquid-like protein assemblies enriched with the CasDrop components; these assemblies, including FUS, TAF15, and BRD4 IDRs, are highly dynamic, reversible and undergo frequent droplet coalescence events (Figures 1C, 1D, S1B and S1C). Among the three examined IDRs, BRD4ΔN appears to form droplets most easily using the same activation protocol. In control experiments without the presence of either dCas9-ST or IDR, no condensates are observed upon light activation, confirming the role of IDR oligomers as a driver for phase separation (Figures 1C and S1D). Hereafter, we focus our efforts mainly on CasDrop incorporating BRD4ΔN, considering its known role in gene regulation as well as super-enhancer formation.
The effects of pre-seeding and activation protocol on the localization of BRD4 CasDrop
We next ask how locus-specific targeting with sgRNA can alter the way phase separation proceeds. When the CasDrop system is co-expressed with sgRNA for telomeres, bright GFP foci are observed to colocalize with telomeric repeat-binding factor TRF1, indicating successful scaffold targeting (Figure 1E). Upon blue light activation, BRD4ΔN-mCh-sspB liquid droplets nucleate and grow at the seeded telomeres (Figure 1E). Interestingly, the number of droplets that are nucleated away from telomeres depends sensitively on the activation protocol: for a rapid increase in blue light, many droplets nucleate throughout the nucleoplasm, while for a light intensity ramping protocol, droplets nucleate almost exclusively at the telomere loci (Figures 2A and 2B, and Supplementary Video 1). This behavior is consistent with the classic physics of nucleation barriers for phase separation (Ōnuki, 2002): for rapid activation, the system becomes deeply supersaturated in a short time, lowering the nucleation barrier to form many condensate nuclei that are not genomically-targeted. For the incremental activation, on the other hand, initially the supersaturation level is low, allowing for preferential condensation at the seeded sites and then in later stages, existing droplets keep growing rather than forming energetically costly new condensate nuclei. Simulations of the CasDrop system (Figure 2C and Supplementary Video 2) confirm this picture (see STAR Methods for details). Control experiments without sgRNA for telomeres show that BRD4 droplets appear in an apparently random manner irrespective of telomeres (Figure 2A). Collectively, these results indicate that droplet localization during intracellular phase separation can be dynamically controlled by preseeding and the rate of supersaturation. The CasDrop system thus functions to localize a nucleating scaffold, thereby driving phase separation at the genomic location defined by the sgRNA.
Figure 2.

The effects of pre-seeding and activation protocol on the localization pattern of BRD4 CasDrop.
(A) Two different activation protocols are applied to the same NIH3T3 cell expressing dCas9-ST, scFv-sfGFP-iLID, BRD4ΔN-mCh-sspB, miRFP670-TRF1 and sgRNA for telomeres. Fluorescence images of the cell before and after activation protocols are shown. When the ramping protocol is applied on a cell without telomere-targeting sgRNA, assembled droplets exhibited apparently random droplet localization irrespective of telomeres.
(B) For each BRD4 droplet, a distance from the droplet boundary to the nearest telomere is measured. Each red dot represents a single droplet. Fractions of droplets whose distances to the nearest telomere are smaller than 0.2 μm (black dashed line) are given in percentage.
(C) Simulations of our mechanical droplet exclusion model demonstrating that during CasDrop nucleation and growth in the presence of pre-seed sites (white circles denote stiff seed cores, light blue halos denote surrounding regions of enhanced concentration, φA) targeted droplet localization improves with decreasing activation rate. Rapid and slow activation protocols are shown in the upper and lower rows, respectively, with time increasing from left to right. Fractions of droplets overlapping with a pre-seed site at the final time shown are given in percentage.
See also Supplementary Videos 1-2
Preferential growth of IDR-driven condensates in regions of low chromatin density
In our studies of the off-target nucleation of CasDrops, we noticed that droplets appear to form in regions of relatively low chromatin density. To quantify this, we examined cells not expressing condensate-targeting guide RNA, and determined where droplets form relative to the chromatin distribution prior to droplet condensation, using H2B-miRFP670 as a proxy for chromatin density (Figure S2A). We find that the distribution of H2B intensity in regions where droplets do form is shifted to significantly lower H2B intensity compared with the H2B distribution in the entire nucleus (Figures 3A and 3B). Dividing these two distributions reveals that the propensity for droplet formation is a strong function of normalized H2B intensity, with droplets exhibiting a significant preference for regions of low chromatin density (Figure 3C). Notably, the observed trend is not due merely to variations in the concentrations of CasDrop components, as similar analysis does not show biased distributions of the components (Figure S2C). We find a similar tendency for droplet growth in low-density chromatin for different IDRs driven to phase separate using the optoDroplet system we previously developed (Figure S3A) (Shin et al., 2017).
Figure 3.

IDR-driven condensates prefer growing at regions of low chromatin density.
(A) Schematic of experiment and analysis for (b) and (c). U2OS cells expressing dCas9-ST, scFv-sfGFP-iLID, BRD4ΔN-mCh-sspB, and H2B-miRFP670 are activated with blue light. Clusters of CasDrop are identified at various time (Δt = 3 to 30 s after activation starts) using mCh fluorescence signal. The resulting binary mask is then applied to pre-activation (0 s) image marking pixels where droplets will form; H2B intensity of these pixels is analyzed in (B) and (C).
(B) Probability distribution of normalized H2B intensity for nucleoplasmic pixels. After normalization, pixels where droplets form are plotted as a separate probability distribution (red) which is shifted to the left compared to all pixels in nucleoplasm (black). Data points in between −2σ and +2σ are shown and are plotted as mean ± s.d. (N = 6 cells) See Figure S2B for cumulative probability distributions.
(C) Propensity for CasDrop condensation at various H2B intensities is calculated as ratio of probability of group CasDrop (red in (B)) and probability of group nucleoplasm (black in (B)). Data points in between −2σ and +2σ are shown and are plotted as mean ± s.e. (N = 6 cells) See Figure S2C for average intensity of protein in other channels at each H2B intensity level.
(D) Simulations of droplet growth within a spatially heterogeneous elastic material (elastic modulus varies sinusoidally, with an egg carton pattern, shown in the left panel). Mechanical deformation energy drives preferential growth within and droplet migration toward soft regions, leading to their localization in soft regions, and absence from stiff regions.
See also Figure S2 and Supplementary Video 3.
Chromatin exclusion from synthetic and endogenous condensates
We also examined the chromatin density after droplets have formed. Remarkably, we find that as the droplets grow chromatin is significantly pushed out (Figures 4A-4C), creating easily visualized “holes” (Figure 4B). Chromatin exclusion is not an artifact of optogenetic scaffolding, as we see similar behavior for condensates formed with a variety of YFP-tagged IDR-containing full length proteins overexpressed in cells (Figures 4D and S3B) (Nott et al., 2016). These findings are consistent with the observation that several endogenous nuclear condensates, including nucleoli, Cajal bodies (CBs), PML bodies, nuclear speckles, and paraspeckles are also associated with particularly low-density chromatin (Figure 4E); see also e.g. (Mao et al., 2011). Thus, condensates assembled from IDRs exhibiting a broad spectrum of sequence features (Table S1) not only preferentially nucleate in low density chromatin regions, but upon nucleation and growth they also physically exclude chromatin.
Figure 4.

Synthetic and endogenous IDR-driven condensates exclude bulk chromatin.
(A) Intensity density of BRD4ΔN and H2B channels over integrated CasDrop clusters in same cell type as analyzed in Figure 3. CasDrop clusters are identified at each time point (line-connected dots) or over CasDrop mask obtained from the closest time point where droplets can be identified (disconnected dots).
(B) Fluorescence images of a U2OS cell expressing dCas9-ST, scFv-sfGFP-iLID, BRD4ΔN-mCh-sspB, and H2B-miRFP670, before, during, and after local stimulation using blue light focused in region circled by dashed line.
(C) Fluorescent intensity profiles along a line passing through the CasDrop cluster shown in (B) at different time points in H2B and BRD4ΔN channel.
(D) A panel of YFP-tagged proteins with diverse amino acid sequence properties (Table S1), functions, and expected subnuclear localization was co-expressed with H2B-miRFP670 in HEK293 cells. All proteins that formed droplets visible by bright field (selected examples shown in Figure S3B) excluded chromatin (select examples shown).
(E) Immunocytochemistry against protein markers of well characterized nuclear condensates was performed in HEK293 cells expressing H2B-miRFP670. All condensates are associated with decreased local chromatin density.
Minimal model of mechanical exclusion of chromatin by condensate formation
To gain physical insight into why droplets that tend to exclude chromatin would preferentially grow in regions of low chromatin density, we mathematically model the mechanical interplay of condensates with the deformable chromatin network. We reasoned that by excluding chromatin, growing droplets would give rise to mechanical stresses; indeed, in non-biological systems, phase separated droplets are known to be strongly impacted by the presence of a surrounding elastic network (Style et al., 2018). We developed a minimal model to describe droplet formation in chromatin as an expanding sphere creating a cavity in an elastic matrix (Zimberlin et al., 2007). A simplified expression for the free energy cost ΔF of droplet nucleation is given by:
where R is the radius of the droplet, γ is the surface tension of the droplet, Δμ is the chemical potential difference between molecules in the supersaturated solution and in the droplet phase, cdrop is the saturated bulk concentration of molecules inside the droplet, and G is the elastic (Young’s) modulus of the deformed surrounding matrix. The first two terms reflect classical nucleation theory (Ōnuki, 2002), while the third term reflects a mechanical energy contribution from the chromatin elasticity. Using estimates of the key parameters of surface tension, molecular interaction energy, and stiffness of euchromatin and heterochromatin (Feric et al., 2016; Ou et al., 2017; Stephens et al., 2017) (See STAR methods), the model predicts that small droplets can nucleate in both low and high chromatin density regions, but that droplet growth to an optically resolvable scale will be most probable in mechanically soft regions of the lowest chromatin density. Simulations of the mechanical model using a sinusoidally-varying chromatin stiffness show clear droplet preference for minima in the stiffness landscape (Figure 3D, and Supplementary Video 3).
Mechanical exclusion of CasDrop condensates from heterochromatin
A prediction of this model is that mechanical deformation energy will prevent droplets from growing beyond a critical size in sufficiently chromatin-dense regions, i.e., those near the high-density end of the experimentally-measured droplet growth propensity (Figure 3C). To test this prediction, we examined major satellite repeats, dense heterochromatin regions prominent in mouse cultured cells (Guenatri et al., 2004), which are highly enriched in the heterochromatin protein HP1α (Figure 5A). We again use the CasDrop system to locally assemble BRD4 condensates by focusing the laser within the nucleus. When BRD4 droplets are induced in low density chromatin regions, devoid of HP1α-miRFP670 label, BRD4 droplets readily condense (Figure S4A). However, when we attempt to write droplets directly onto HP1α-rich satellite heterochromatin, resolvable droplets tend to condense only around the periphery (Figures 5B and 5C); this effect is not a result of IDR exclusion from the heterochromatin, since it robustly occurs even after enrichment of IDR-sspB component through sgRNA targeting (Figure 5B, and Supplementary Video 4). Simulations of condensate nucleation at a compact heterochromatin core demonstrate flower petal-like configurations strikingly similar to those seen in our experiments (Figure 5D, and Supplementary Video 5). Interestingly, in some cases HP1α-miRFP670 enriched heterochromatin foci exhibit apparent subregions of weak HP1α-miRFP670 fluorescence. When we attempt to nucleate BRD4 droplets on these foci, we find that BRD4 droplets occasionally nucleate within; as they grow, they displace HP1α, as seen from the anticorrelated fluorescence intensities (Figures 5E, 5F, S4B and S4C); strikingly, the growing BRD4 droplets can even “rupture” heterochromatin, abruptly spilling out into lower density regions (Figures 5E and 5F, and Supplementary Video 6). We observe qualitatively similar heterochromatin immiscibility with TAF15 and FUS CasDrops (Figures S4D and S4E). Collectively, these behaviors provide strong support for the presence of mechanical stresses that build up in chromatin surrounding growing condensates. These data are thus consistent with our mechanical droplet exclusion model, although HP1α itself may provide additional unfavorable interactions (Figure S5) to reinforce this mechanical immiscibility.
Figure 5.

The BRD4 CasDrop is mechanically immiscible with HP1α enriched heterochromatin.
(A) Schematic of satellite repeats and chromocenters.
(B) (Top left) Schematic depicting behaviors of BRD4ΔN-mCh-sspB component upon local activation: initial exclusion prior to activation followed by enrichment within the heterochromatin, and peripheral droplet formation. (Bottom left) Time lapse images of the NIH3T3 cell expressing dCas9-ST, scFv-sfGFP-iLID, BRD4ΔN-mCh-sspB, HP1α-miRFP670 and sgRNA for major satellites during local activation. (Right) A kymograph is generated along the white dotted line. An arrowhead indicates initial exclusion of BRD4ΔN-mCh-sspB from the chromocenter and an arrow denotes droplet formation at the periphery.
(C) Time lapse images of the NIH3T3 cell expressing dCas9-ST, scFv-sfGFP-iLID, BRD4ΔN-mCh-sspB, HP1α-miRFP670 during local activation. Here, no sgRNA was used for targeting.
(D) Simulations of our mechanical droplet exclusion model with activation localized at a stiff heterochromatin-like domain (gray contour). Following nucleation of small droplets within the activated region, mechanical deformation energy drives droplets and droplet-forming molecules to the exterior of the heterochromatin-like domain where large condensates ultimately accumulate and coarsen.
(E) (Top) Another example of local activation on the same cell type as shown in (C). Zoomed-in snapshots (bottom) of the single chromocenter marked with a dashed white box are shown.
(F) A kymograph is generated along a vertical line crossing the center of the BRD4 droplet after correcting drift. Arrowheads represent a time when the BRD4 droplet spills out of the ruptured chromocenter.
See also Figure S4 and Supplementary Videos 4-6.
Mechanical restructuring of genomic loci induced by droplet condensation
These findings of mechanical chromatin exclusion are surprising, given that enhancer clusters and other nuclear condensates have been hypothesized to bring specifically-targeted genomic elements into closer proximity (Hnisz et al., 2017; Shin and Brangwynne, 2017; Zhu and Brangwynne, 2015). To explore these mechanical effects, we further examined the condensates targeted to telomeres. Consistent with the findings above, BRD4 CasDrop condensates do not appear to mix with the targeted heterochromatic telomeres, which tend to localize at the droplet periphery (Figures 6A, S6A and S6B). But the two nevertheless partially wet one another, and are thus adherent. When two droplets seeded at different telomeres fuse with one another (Figure 6A), the surface tension is sufficient to produce correlated motion between loci, and pull them into close proximity (Figure 6A). From dimensional arguments, the force, F, associated with the surface tension, γ, of fusing droplets should scale as F~γ∙ℓ, where ℓ is a relevant microscopic length scale. With ℓ ~1μm here, the typical force scale is estimated to be on the order of 0.1-1 pN, in the range of force production measured for in vitro condensed protein phases (Herling et al., 2015). Ignoring viscous effects, telomere displacement should then be given by the ratio of droplet surface tension, γ, and effective genome elasticity, G, i.e. (Figure 6B); estimated values for these two parameters yield predicted displacements that are consistent with our measurements (Figure S7A and STAR Methods). In some cases, droplets can detach from associated telomeres, which then relax back to a more distal position (Figures 6C-6F), consistent with droplet detachment releasing the intervening “spring-loaded” chromatin.
Figure 6.

CasDrop condensates can pull two or more targeted genomic loci together.
(A) (Top) Time lapse images of the NIH3T3 cell expressing dCas9-ST, scFv-sfGFP-iLID, BRD4ΔN-mCh-sspB, miRFP670-TRF1 and telomere-targeting sgRNA during blue light activation. Only a small area around two telomere loci is shown. (Bottom) The distance between two telomere loci is tracked over time. Black dots represent time points when cell images above are taken. The correlation coefficient, computed with a sliding window of 60 frames (= 196 s), is also shown with y axis on the right (Figure S6C). The period shaded in light red represents the time during which two loci are tethered by a single droplet (Figure S6D).
(B) Schematic of genomic loci displacement resulting from coalescence of two associated protein droplets. Red, protein droplets; blue, chromatin network; gray, genomic loci associated with droplets.
(C) Time lapse images similar to (A).
(D) Kymograph along a dashed line in (C) for a time period from 134 s to 763 s.
(E) BRD4 droplet boundaries (solid line) and telomeres (dot) are shown for three time points.
(F) Along two axes shown in (E), corrected displacements (Figure S6E) are plotted for three telomere loci.
See also Figure S6
DISCUSSION
Our work shows how nuclear condensates can both sense and restructure their local genomic environment. We find that a broad range of different IDR-containing proteins exclude chromatin, which in some cases manifests in large scale deformation of the chromatin network. These proteins display a remarkable diversity of their physical characteristics, exhibiting IDRs that range from relatively uncharged (e.g. TAF15N) to highly basic (e.g. SRSF2 IDR) and mixed-charge (e.g. SART1); from relatively hydrophobic (e.g. HSF1) to highly hydrophilic (e.g. RNPS1). Thus, mechanical exclusion of chromatin appears to occur largely irrespective of the physicochemical properties of the protein that drives phase separation, and likely underlies the low chromatin density found within various IDR-rich nuclear bodies. These findings are consistent with the observation in a prior study that the germ plasm protein DDX4 appears to exclude chromatin (Nott et al., 2016). Interestingly, DDX4 condensates do not exclude single-stranded RNA, nor single stranded DNA, which instead can both strongly partition into the droplets. Such selectivity could potentially help facilitate the flow of genetic information, as the single-stranded RNA transcripts from excluded chromatin are pulled into adjacent condensates.
The tendency for nuclear condensates to exclude chromatin has dramatic consequences within the heterogeneous nuclear environment. Exclusion of chromatin from a growing droplet causes the chromatin network to be deformed. Deformation of elastic (or viscoelastic) materials gives rise to a strain energy, which represents a mechanical energy stored within the matrix (Landau and Lifshitz, 1970). This deformation and associated energetic cost is thermodynamically unfavorable, such that the elastic properties of the matrix become an important factor in the growth dynamics of the droplet. In non-living systems, it is known that this effect can strongly impact phase separation, and can even give rise to uniform droplets of a size set by the matrix elasticity (Style et al., 2018). Our theoretical analysis and simulations show that as a result of this deformation energy, droplets will tend to favor growth in softer, lower density regions of the genome. Small droplets that do form in high chromatin density regions ultimately dissolve and act as IDR sources for the growing droplets within the softer, less dense regions. We experimentally observed the striking consequences of this effect, in flower-petal-like arrangement of droplets around heterochromatin foci, or in rare cases the extrusion of droplets from within dense and mechanically stiffer heterochromatin. This effect can thus give rise to genomic rearrangements, and is likely important for promoting preferential growth of transcriptional condensates in mechanically softer, low-density genomic regions associated with active gene expression.
HP1 protein provides an interesting apparent counter-example to our findings of the generality of chromatin exclusion by IDR-rich condensates. HP1 has been described as a phase separation prone-protein, whose ability to form condensed liquid droplets could facilitate chromatin compaction (Larson et al., 2017; Strom et al., 2017). Interestingly however, HP1 does not appear to readily form distinct droplets when coupled to the Cry2 system (Figure S5). But HP1-rich foci are associated with relatively high density (hetero)chromatin, suggesting that if it promotes phase separation, it does so in a manner different than many of the IDR-rich proteins and endogenous condensates that we have examined here, which tend to exclude, rather than recruit chromatin. The tendency of different proteins to compact or decompact chromatin likely reflects a rich interplay between compaction-promoting chromatin-targeting domains, and IDR-rich domains which tend to push out chromatin.
Consistent with this proposed role of different protein domains, our results shed light on how targeted condensates can bring distant loci together. Many IDR-rich proteins possess targeting “reader” motifs, such as the bromodomain found in BRD4, which targets this phase separation-prone protein to histones exhibiting acetylated lysine resides (Dey et al., 2003). The CasDrop system replaces such endogenous targeting motifs with programmable dCas9, enabling dissection of the biophysical consequences of IDP targeting. We use CasDrop to show how IDP targeting promotes localized phase separation, through a process which appears closely related to the recently-described “diffusive capture” mechanism, which can amplify IDR concentration to drive localized phase separation (Bracha et al., 2018). Our work also reveals how surface-tension can mediate targeted droplet coalescence. We quantify the associated forces and genomic deformations, which can bring two or more targeted loci into closer proximity. Our findings suggest that the way in which droplets deform chromatin reflects a mechanical interplay between (1) the effective adhesivity of condensates to chromatin, likely mediated in large part through their targeting domains, (2) the closely related parameter of droplet surface tension, with respect to other elements of the nucleoplasm, and (3) the local chromatin (visco)elasticity. The ability to “pull in” targeted genomic loci, can be contrasted with our finding that a broad spectrum of IDR-driven condensates does the opposite to non-targeted genomic elements, i.e. “pushing them out”. Combing these findings, we propose a chromatin filter model for condensate-induced genome restructuring, in which transcriptionally active condensates such as the nucleolus (Berry et al., 2015; Feric et al., 2016), and super-enhancer clusters (Cho et al., 2018; Sabari et al., 2018), play bifunctional roles, serving to both filter out non-specific elements of the genome, while pulling together targeted regions to which they are bound (Figure 7).
Figure 7.

Mechano-active nuclear condensate growth and “Chromatin filter” models.
(top) Growth of nuclear condensates is favorable in mechanically softer euchromatin while inhibited in mechanically stiffer heterochromatin. (bottom) Schematics for “Chromatin filter” model showing how targeted condensation can bring distal genomic loci together, while mechanically excluding non-targeted background chromatin.
Studies of the interplay between intracellular mechanics and phase separation have only just begun. But continued progress in this area will be important both in the context of mechanics of the cytoplasm, where cytoplasmic condensates interact with the actomyosin cytoskeleton, for example, and in the nucleus, where condensates interact with the polymeric matrix of the genome, and other mechanical elements (Feric and Brangwynne, 2013). Within the nucleus, this challenge is particularly rich, given that many nuclear condensates form on small size scales where local mechanical heterogeneities become important. The field of nuclear mechanobiology has identified a link between mechanical forces and gene expression. However, the underlying biophysical mechanisms are still largely unknown (Cho et al., 2017; Kirby and Lammerding, 2018). Our findings that the dynamics of nuclear condensates are sensitive to the local mechanical environment suggest that the impact of mechanical forces on gene expression might ultimately be mediated by their effect on nuclear condensates. Future work will explore these emerging links between nuclear mechanics and phase separation, and their impact on functional changes in gene expression.
STAR Methods
CONTACT FOR REAGENT AND RESOURCE SHARING
Further information and requests for resources and reagents should be directed to and will be fulfilled by the Lead Contact, Clifford P. Brangwynne (cbrangwy@princeton.edu)
EXPERIMENTAL MODEL AND SUBJECT DETAILS
Cell culture.
NIH3T3 (sex of cell: male), HEK293 (female), HEK293T (female), and U2OS (female) cells were cultured in growth medium consisting of Dulbecco’s modified Eagle’s medium (Gibco), 10% fetal bovine serum (Atlanta Biologicals), and 10 U/mL Penicillin-Streptomycin (Gibco), and incubated at 37°C and 5% CO2 in a humidified incubator.
METHOD DETAILS
Transient transfection.
HEK293, HEK293T, or U2OS cells were grown to approximately 70% confluency in 12-well plates before being transfected with plasmid DNA using Lipofectamine 3000 (Invitrogen) following manufacturer’s protocol. Briefly, transfection reagents and DNA plasmids were diluted with OPTI-MEM (Gibco). Each well received 100 μL of transfection mixture containing a total of 1 μg DNA. The transfection mixture was removed 6-24 hours post-transfection. Cells transiently transfected were typically imaged between 24-48 hours post-transfection.
Lentiviral transduction.
Lentivirus was produced by cotransfecting the transfer plasmids, pCMV-dR8.91, and pMD2.G (9:8:1, mass ratio) into HEK293T cells grown to approximately 70% confluency in 6-well plates using FuGENE HD Transfection Reagent (Promega) per manufacturer’s protocol. A total of 3 μg plasmid and 9 μL of transfection reagent were delivered into each well. After 2 days, supernatant containing viral particles was harvested and filtered with 0.45 μm filter (Pall Life Sciences). Supernatant was immediately used for transduction, concentrated 10-fold using Lenti-X Concentrator (Takara), or stored at −80°C in aliquots. NIH3T3 or HEK293T cells were grown to 10-20% confluency in 12-well plates and 100-1000 μL of filtered viral supernatant was added to the cells. Media containing virus was replaced with fresh growth medium 24 hours post-infection. Cells infected were typically imaged no earlier than 72 hours after infection.
Cell line generation.
To establish cell lines expressing multiple constructs, sequential lentiviral transduction was performed, together with fluorescence activated cell sorting (FACS) when needed. Wild-type NIH3T3 (or HEK293T) cells were transduced with lentivirus containing dCas9-ST under SFFV promoter and scFv-sfGFP-iLID. This transduced NIH3T3 cell line was then used to generate other cell lines by lentiviral transduction, to express required constructs indicated for each experiment. To increase population expressing dCas9-ST in the transduced HEK293T cell line, cells were sorted on a FACSAria Fusion flow cytometer (BD Biosciences) with gating for single-cells expressing high level of BFP and intermediate level of GFP. Polyclonal cell pool was collected, grown and recovered in growth medium. This sorted cell line was then transiently transfected with additional constructs for CasDrop/Cry2-fusion experiment.
Constructs.
FUSN-mCh-sspB was first generated by inserting FUSN (1-214), mCherry, and sspB coding sequence into a pHR-based vector(Shin et al., 2017). For other TR-mCh-sspB constructs, the FUSN in FUSN-mCh-sspB was swapped out for the DNA sequence encoding BRD4ΔN (462-1362, Addgene 31351), TAF15N (1-208, kind gift from Marc Diamond lab, UT Southwestern). scFv-sfGFP-iLID was generated by adding iLID (Addgene 60413) between GB1 and NLS in scFv-GCN4-GFP (Addgene 60906). A promoter for dCas9-ST (Addgene 60910) was modified from dSV40 to SFFV to enhance expression. Fragments of mCherry, sspB (Addgene 60415), miRFP670 (Addgene 79987), TRF1 (Addgene 64164) and HP1α (Addgene 17652) were amplified by PCR. If not specified otherwise, all fragment assemblies are performed using In-Fusion Cloning Kit (Takara). All miRFP670-Cry2 fragments used here are identical to the one described previously (Shin et al., 2017) except for a fluorescent reporter swapped from mCh to miRFP670. For EYFP constructs, FM5-EYFP (kind gift from Marc Diamond lab, UT Southwestern) was digested with NheI and open-reading frames were subcloned onto 5’ end using In-Fusion Cloning Kit (Takara). To create FM5-ORF-mCherry-Cry2 constructs, FM5-EYFP was digested with NheI and AscI and DNA backbone lacking EYFP was gel purified using Qiagen Gel Extraction Kit. mCherry-Cry2 was PCRed from pHr-mCherry-Cry2, digested with NheI and AscI, gel purified, and ligated into FM5 backbone using Quick Ligase (NEB). FM5-mCherry-Cry2 was then digested with NheI and open reading frames were subcloned onto 5’ end using In-Fusion. All open reading frames were PCRed from recombinant DNA vectors obtained from AddGene: CCNT1 (14607), HSF1 (32538), MLLT3 (49428), SART1 (38087), TAF15 (84896), SRSF2 (84020), PRPF6 (51740), with the exception of RNPS1, which was synthesized by GenScript. For sgRNAs targeting telomeres and major satellite repeats (sgTel: TTAGGGTTAGGGTTAGGGTTA and sgMaj: CAAGAAAACTGAAAATCA), pLV-sgCDKN1B (Addgene 60905) was first digested with BstXI and XhoI followed by gel electrophoresis and extraction. Then, PCR fragments for sgRNAs were generated using a sequence-specific forward primer (5’CCTTGGAGAACCACCTTGTTGGNxGTTTAAGAGCTATGCTGGAAACAGCA-3’, where GNx is the base pairing sequence) and a common reverse primer (5’-GATCCTAGTACTCGAGAAAAAAAGCACCG-3’). Fragments were then ligated and assembled into the final vectors again using In-Fusion Cloning Kit.
Immunocytochemistry.
HEK293 cells expressing H2B-miRFP670 were fixed using 3.5% PFA (Electron Microscopy Services) in PBS for 15 minutes. Cells were washed twice with PBS and permeabilized with 0.25% Triton-X in PBS for 20 minutes. Non-specific epitopes were blocked for one hour using blocking buffer (PBS, 0.1% Triton-X, 10% normal goat serum from Vector Laboratories). Primary immunostaining was performed with the following antibodies overnight at 4°C in blocking buffer: PML (Mouse, AbCam ab11826, 1 to 50), Coilin (Rabbit, Santa Cruz sc32860, 1 to 100), TDP43 (Rabbit, ProteinTech 10782-2-AP, 1 to 100), SMN1 (Mouse, Santa Cruz sc-32313, 1 to 100), SC35 (Mouse, AbCam ab11826, 1 to 1000), and FBL (Mouse, AbCam ab4566, 1 to 40). Cells were then washed 3× with 0.1% Triton-X in PBS. Secondary immunostaining was performed with the following antibodies from Invitrogen in blocking buffer at room temperature for 90 minutes: AlexaFluor 546 goat anti-rabbit (A11010, 1 to 400), AlexaFluor 546 goat anti-mouse (A11030, 1 to 400). Cells were washed 3× with 0.1% Triton-X in PBS. DNA was visualized with 2 μg/mL Hoechst dye (ThermoScientific), staining for 15 minutes in PBS. Finally, Hoechst was removed and replaced with PBS prior to imaging. Controls without primary antibodies were performed to ensure specificity of primary stain.
Microscopy.
All images are taken using 60× immersion objective (NA 1.4) on a Nikon A1 laser scanning confocal microscope. An imaging chamber is maintained at 37°C and 5% CO2. For live cell imaging, cells are plated on the fibronectin (Millipore Sigma) coated 35-mm glass-bottom dishes (MatTek) and grown typically overnight. For global activation, cells are usually imaged with a 488-nm laser but when the blue light intensity needs to be reduced due to high sensitivity of the optogenetic proteins (iLID and Cry2), a 440-nm laser is used in conjunction with a dichroic filter for the 488-nm laser. This allows for attenuation of the blue laser intensity at the specimen plane below 0.1 μW. For local activation, a region of interest (ROI) is defined to guide area to be scanned with blue lasers. Fluorescence recovery after photobleaching (FRAP) is performed similarly using ROI.
QUNATIFICATION AND STATISTICAL ANALYSIS
Image analysis.
All data analysis on images is performed using custom-built MATLAB scripts. Briefly, for telomere tracking, raw images are first Gaussian filtered to reduce noise and then peaks corresponding to telomeres are detected based on their peak intensity. Trajectories are generated from a series of detected coordinates based on proximity. To identify and track the boundary of either droplets or heterochromatin, segmented binary images are obtained using the edge detection routine in MATLAB. Analyzed results are manually inspected to check validity.
Minimal model of mechanical exclusion of chromatin by droplet formation.
Here we consider the following relation between pressure and size for a spherical cavity, derived from a neo-Hookean strain energy relation to determine the inward pressure on a cavity with deformation ratio λ in an incompressible elastic medium of Young’s modulus G (Zimberlin et al., 2007):
| (1) |
This pressure, which reflects the energetic cost of deforming the chromatin, complements classical nucleation theory to describe the energetics of droplet formation in a dense elastic matrix. We add the energy cost of deforming the elastic chromatin matrix to the contributions of bulk chemical potential gain and surface tension cost to obtain the total free energy cost to create a spherical droplet of radius R, obtaining:
| (2) |
where γ is the surface tension of the droplet, Δμ is the chemical potential difference between molecules in the supersaturated solution and the droplet phase, cdrop is the saturated bulk concentration of molecules inside the droplet, λ = R/rmesh, and rmesh is a typical local mesh size in the chromatin network. Since rmesh ≪ R, the deformation ratio λ is very large (see Estimation of parameters), and we obtain the following simplified result:
| (3) |
For values of Δμ ∙ cdrop less than the critical pressure Pc = 5G/6, the free energy increases to infinity for large R, suggesting that for sufficiently dense chromatin, droplet size is restricted. However, when Δμcdrop > Pc, the droplet can grow without constraint. If the elastic environment is heterogeneous, as chromatin density is in the cell, then regions of low stiffness should be favored for phase separation and out-compete denser regions for molecules.
Estimation of parameters used in the minimal model.
We estimated the key parameters in this model based on literature:
• γ ≈ 4 × 10⁻⁷ N/m for nucleolar protein in vitro (Feric et al., 2016).
• rmesh ≈ 7-13 nm (Ou et al., 2017). A rough estimate of pore size can be given by the mean free path between chromatin fibers based on the chromatin size and volume fraction: where rc is the width of a chromatin fiber, estimated at 7 nm and f is the volume fraction of chromatin. The fraction has been estimated by electron microscopy at approximately .12-.21 in euchromatin and about .37-.52 for heterochromatin, giving pore sizes of about 14 nm and 7 nm respectively.
• cdrop has been estimated using fluorescence correlation spectroscopy both in the similar biomimetic Corelet system (Bracha et al., 2018) and for in vitro droplets (Wei et al., 2017) to be approximately 5-10 × 10−5 molecules/nm3.
• Δμ is estimated at approximately 2-5kBT, being the chemical potential difference per molecule between the dilute and condensed phases.
• G is dependent on the crosslink frequency of the matrix, which can be estimated by f2, the square of the volume fraction of the matrix (Style et al., 2018b). The effective “spring constant” of the nucleus for a lamin knockout has been estimated to be on order 1 nN/μm (Stephens et al., 2017), which dividing by a microscopic length scale of 1 μm would give about 1 kPa for the nucleus on average. Based on this we assume that the least stiff chromatin, with a fraction of about .21 has a modulus of about 100 Pa and that this value scales with f2.
Simulations.
Our minimal mathematical model for condensate thermodynamics within an elastic medium was implemented within a diffuse-interface formalism that permits numerical study of collective droplet nucleation, growth, and coarsening kinetics with mechanical effects. The nucleoplasmic fluid is described as an effectively ternary system composed of dCas9-ST + scFV-sfGFP-iLID (species A), TR-mCh-ssp (species B; TR=Transcriptional Regulator), and other “solvent” molecules (species C). An extended ternary regular solution free energy functional is employed to describe fluid thermodynamic phase behavior within a mechanical network; , where ϕi is the space-dependent volume fraction of molecular population i ∈ {A, B, C}; χ ij controls the strength of interaction between i and j molecules; is the network-modified surface energy coefficient for population i (see below); is the space-dependent Young’s modulus of the network; and is a field that enhances the concentration of species A at pre-seed sites. The fluid phase is taken to be incompressible such that ϕA + ϕB + ϕC = 1. Dynamics are given by a generalized diffusion equation, where i, j ∈ {A, B} (C is eliminated via incompressibility), Mi is the mobility of population i, and t is dimensionless time.
The effect of the elastic medium is incorporated into a space-dependent bulk term (that proportional to ) which locally modulates the chemical potentials, and a space- and droplet size-dependent interfacial energy coefficient , where λi is the surface energy coefficient in the absence of a network. The interfacial terms associated with the network are negligible compared to the bulk network term when R ≳ 10rmesh. We therefore neglected the effect of the network on interfacial energy (let ) and studied the regime in which R ≳ 10rmesh.
The telomere pre-seeding simulations shown in Figure 2c were conducted by initializing a homogeneously mixed fluid with ϕA = 0.1, ϕB = 0.1, ϕC = 0.8 (red dot in Figure S7b), χ AC = χ BC = 1, λi = 0.75, and setting within randomly positioned pre-seed regions, within an annulus of radius 10 around each stiff pre-seed core, and elsewhere. Non-zero PA values enhance the local concentration of A around pre-seed sites, analogous to the initial enhancement of dCas9-ST + scFV-sfGFP-iLID around telomeres in the experimental system. Blue light-induced heterodimerization of sspB with iLID is described as an increase in A-B interaction strength, , where and are the inactivated state and activated state interaction strengths, respectively, τ [blue] is the time constant for blue light activation, which is inversely proportional to the rate of increase in blue light intensity. For the red dot shown in Figure S7b, decreasing χ AB from −5 to −9.25 induces phase separation into A+B-rich droplets and an A+B-poor background.
Following equilibration with pre-seed sites as described above, blue light is applied globally with intensity increasing according to the equation above for a given value of τ [blue]. Results for two values of τ [blue] are shown in Figure 2c. Droplets are more effectively localized at pre-seed sites with decreasing quench rate, as observed in our experiments. The simulations demonstrate that enhanced concentration of A at pre-seed sites promotes rapid local nucleation and subsequent diffusion-limited growth. Growth proceeds by drawing in nearby A and B molecules, which creates an expanding radial zone depleted in A and B. If depletion zones of neighboring pre-seed sites overlap before droplets can nucleate between pre-seeds, then all droplets become localized at pre-seed sites. If droplets nucleate throughout the system before depletion zones overlap, then long-lived droplets also appear away from seed sites. For ideal diffusion-limited growth, the radius of the depletion zone grows as , where D is the diffusion coefficient of A and B molecules and S0 is their supersaturation. The time required for overlap of neighboring depletion zones is therefore t* ≈ (d/2)2/2DS0, where d is the distance between pre-seed sites.
The simulations shown in Figure 3d with a spatially heterogeneous elastic network were conducted with blue light applied globally as described above, but with and , where Lx and Ly are the lengths of the simulation cell. The constant G0 was increased linearly from 0 to 0.18 between t = 250 (after droplet nucleation) and t = 750. This delay in the introduction of mechanical deformation energy results in spatially uniform droplet nucleation and an initial droplet size distribution that is independent of network stiffness, consistent with our neo-Hookean model. The subsequent introduction of nonzero induces a transition into the large droplet size regime discussed above, in which the dominant effect is a shifting of the bulk chemical potential according to local stiffness and preferential droplet growth in softer regions. The simulations shown in Figure 5d were conducted as those shown in Figure 3d but with blue light applied locally inside a stiff heterochromatin-like domain, wherein G0 was increased linearly from 0 to 0.18 between t = 100 (after droplet nucleation) and t = 600.
Estimation of targeted chromatin displacement.
When two droplets seeded at specific genomic loci fuse, surface tension favors making the resulting large droplet spherical. This results in a force that attracts the two loci towards one another, displacing each one a distance Δx from its original position, as schematized in Figure S7a. This displacement induces deformation in the chromatin that results in an elastic restoring force pulling the loci back towards their original positions; at mechanical equilibrium, the balance between droplet surface area and loci displacement reflects the relative magnitude of the surface tension γ and chromatin Young’s modulus G. Quantitatively, when two droplets of radius R fuse to form a sphere, the resulting droplet has an equilibrium radius of 21/3R. Due to surface tension, there is an energetic cost to elongating the droplet from the spherical configuration. This results in a force Ftension between the telomeres, which to linear order in the elongation δ = 2R − 21/3R − Δx, and assuming that the droplet is constrained to remain ellipsoidal, reads Ftension = γ(2R − 21/3R − Δx). The elastic force on a locus of size rlocus displaced by Δx is given by the elastic Stokes’ law, Felastic = −6πGrlocusΔx. Force balance thus yields
| (4) |
Taking a telomere size of about 10 nm, a γ of 4 × 10⁻⁷ N/m as before, a droplet size of 1 μm and a G in the range of 10-100 Pa results in a displacement Δx ≈ 10-100 nm.
Supplementary Material
Figure S4. Phase immiscibility between heterochromatin and BRD4 CasDrop. Related to Figure 5.
(A) Time-lapse images of the same NIH3T3 cell expressing dCas9-ST, scFv-sfGFP-iLID, BRD4ΔN-mCh-sspB, and HP1α-miRFP670 shown in Fig 5e. BRD4 CasDrop readily forms and grows upon local activation by shining 440 nm laser within designated area away from chromocenters.
(B) (Top) Snapshots of the NIH3T3 cell expressing dCas9-ST, scFv-sfGFP-iLID, BRD4ΔN-mCh-sspB, HP1α-miRFP670 and major-satellite targeting sgRNA before activation. Local activation is applied on a single chromocenter (dashed circle) and a kymograph (bottom left) is generated along a dashed line. Time evolution of BRD4ΔN-mCh-sspB signals along the dashed line is shown (bottom right).
(C) Zoomed-in snapshots of the chromocenter shown in (B) after local activation: overlaid for BRD4 and HP1α channel (top) and HP1α alone (middle). (bottom) Intensity profiles of two channels along the dashed line in (B). Arrowheads indicate regions inside the chromocenter where BRD4 droplets displace HP1α.
(D&E) Fluorescence images of NIH3T3 cells expressing miRFP670-HP1α together with constructs for (D) TAF15 CasDrop or (E) FUS CasDrop, prior to activation (top row) and after activation (bottom row). Insets show zoomed-in snapshots of chromocenter of interest. Local activation is applied on a single chromocenter (dashed circle)
Figure S5. Comparison of partitioning of various Cry2 fusion constructs into BRD4 droplets. Related to Figure 5.
(A) (Left) Time lapse images of HEK293T cells expressing dCas9-ST, scFv-sfGFP-iLID, BRD4ΔN-mCh-sspB and different fusions to miRFP670-Cry2 during local activation. (Right) Zoomed-in snapshots around the activation zone. Oligomers of HP1α formed by Cry2 are not recruited into BRD4 droplets unlike other fusions as well as Cry2 itself.
(B) Intensity profiles along the center of BRD4 droplets.
(C) (Top) Fluorescence images of HEK293T cell expressing dCas9-ST, scFv-sfGFP-iLID, BRD4ΔN-mCh-sspB, and miRFP670-Cry2-HP1α, after local activation with blue light. (Bottom) Intensity profiles of BRD4 and HP1α channel along the dashed line passing through the center of droplet.
(D) Partitioning of various Cry2 fusion constructs into BRD4 droplets is measured and then normalized with that of Cry2-only (null). N = 3 - 5 individual cells for each fusion construct. Error bars are s.d.
Figure S6. Physical interaction between liquid condensates and genomic loci. Related to Figure 6.
(A) Histogram of the location of telomeric locus relative to the center of the associated BRD4 droplet.
(B) (left) Time lapse images of the NIH3T3 cell expressing dCas9-ST, scFv-sfGFP-iLID, BRD4ΔN-mCh-sspB, miRFP670-TRF1 and telomere-targeting sgRNA upon local activation. (right) A telomeric locus sits along the way two droplets fuse and later is displaced to the periphery of the droplet.
(C) (left) Two trajectories are generated by simulating 5 traces of two-dimensional (2D) Brownian motions and joining them so that the middle trace is shared by both trajectories. (middle) The 2D view of simulated trajectories with the shared portion highlighted in red. (right) The correlation coefficient between simulated trajectories is computed in an identical manner as Figure 6A. The period shaded in light red corresponds to the time during which two trajectories shared the same trace.
(D) The 2D trajectories of two telomeric loci shown in Figure 6A at three time periods. Trajectories for later time points are shifted horizontally for better visibility. Arrows, to guide the eye, represent temporal motions associated with two loci, highlighting the similarity between two trajectories.
(E) Motions of three loci shown in Figures 6C-6F along axes in Figure 6E before drift correction.
Figure S7. Schematics for model and simulation used for CasDrop. Related to Figures 2, 3, 5, and 6.
(A) Schematic of the situation before (top) and after (bottom) the fusion of two CasDrop condensates (red circles) seeded at telomeric loci (black points) inside chromatin. At mechanical equilibrium, the balance between surface tension and elastic forces is established for a displacement of the loci Δx given by Δx ≈ γ(2R − 21/3R)/(γ + 6πGrlocus) (See Eq. 4 in STAR Methods.)
(B) Phase diagram of the simulated ternary CasDrop model for three values of χ AB. Solid and dashed lines denote binodal and tie lines, respectively. At the red point, the system is mixed for χ AB > −5.2 and demixed for χ AB < −5.2.
Supplementary Video 1. BRD4 CasDrops nucleation with blue light activation of ramping or rapid increase protocol. Related to Figure 2.
(Part 1) A ramping protocol for blue light activation leads to BRD4 CasDrops nucleating almost exclusively at the telomere loci with sgRNA targeting telomeres. (Part 2) Rapid increase in blue light results in BRD4 CasDrop nucleating throughout the nucleoplasm even with sgRNA targeting telomeres. Red, BRD4ΔN-mCh-sspB; gray, miRFP670-TRF1.
Supplementary Video 2. Simulation of CasDrop nucleation, growth, and coarsening under global activation with slow or rapid activation protocol in the presence of pre-seed sites. Related to Figure 2.
(Part 1) A slow activation protocol. Tau = 1000. φB, the concentration of species B, is mapped in black-gray-white-red (see Figure 2C for colorbar values). White circles denote stiff seed cores, light blue halos denote surrounding regions of enhanced φA. The frame rate increases by a factor of four at 9 sec. (Part 2) A rapid activation protocol. Tau = 10. φB, the concentration of species B, is mapped in black-gray-white-red (see Figure 2C for colorbar values). White circles denote stiff seed cores, light blue halos denote surrounding regions of enhanced φA. The frame rate increases by a factor of four at 10 sec and by another factor of four at 16.5 sec.
Supplementary Video 3. Simulation of CasDrop nucleation, growth, and coarsening under global activation in the presence of a spatially heterogeneous elastic network. Related to Figure 3.
Elastic modulus is mapped in white-lavender-green, see Figure 3D for colorbar values. φB, the concentration of species B, is mapped in black-gray-white-red (see Figure 3D for colorbar values). Mechanical deformation energy drives preferential growth within and droplet migration toward soft regions, leading to an absence of condensates in stiff regions and localization of large condensates in soft regions. The frame rate increases by a factor of five at 10 sec.
Supplementary Video 4. Local activation at a chromocenter in NIH3T3 cell results in BRD4 droplets forming around the periphery of the chromocenter. Related to Figure 5.
Red, BRD4ΔN-mCh-sspB; gray, HP1α-miRFP670.
Supplementary Video 5. 3D simulation of CasDrop nucleation, growth, and coarsening under localized activation within a stiff heterochromatin-like domain. Related to Figure 5.
CasDrop is shown in red; stiff heterochromatin-like domain is shown as gray contour. Following nucleation of small droplets within the activated region, mechanical deformation energy drives droplets and droplet-forming molecules to the exterior of the heterochromatin-like domain where large condensates ultimately accumulate and coarsen.
Supplementary Video 6. Growing BRD4 droplet “ruptures” heterochromatin in a NIH3T3 cell during local activation within a chromocenter. Related to Figure 5.
Red, BRD4ΔN-mCh-sspB; gray, HP1α-miRFP670.
Figure S1. IDR-recruitment in CasDrop system forms reversible, liquid-like droplets. Related to Figure 1.
(A) Predicted disorder score (disordered if greater than 0.5) for BRD4, FUS, and TAF15 from Predictor of Natural Disordered Regions (PONDR) VL-XT algorithm and corresponding IDRs used in this study.
(B) (Left) Fluorescence intensity recovery profiles following photobleaching. (Right) Fluorescence images of the nucleus prior to photobleaching (top) and zoomed-in images of the droplet at varying time points as indicated. 488-nm laser is used to bleach a region of interest (dashed circle) inside BRD4 CasDrop. Average intensity value of bleached area is measured in GFP and mCherry channel, and normalized by that of pre-bleached (t < 0 s) region. Error bars are standard deviation.
(C) Integrated intensity of nuclear clusters over five cycles of activation-deactivation shows reversibility for each of BRD4, FUS, and TAF15 CasDrop. Each activation (shaded region) or deactivation interval is 150 s, and cells are globally activated by 488-nm laser every 3 s. Integrated intensity is normalized by the maximal value over five cycles.
(D) HEK293T cell expressing dCas9-ST, scFv-sfGFP-iLID, and mCh-sspB as an IDR-free control, shows no clustering during ~2 minutes of blue light activation. No sgRNA is added.
Figure S2. Before activation CasDrop components are not strongly patterned by chromatin density. Related to Figure 3.
(A) Correlation between normalized fluorescence intensity of DNA staining dye Hoechst 33342 and of overexpressed fluorescently labeled H2B (H2B-GFP). Solid line represents y = x. Data points from two cells (blue and orange dots) are plotted as mean ± s.d. (N = 2 cells).
(B) Cumulative probability curves of group CasDrop (yellow circles) and group nucleoplasm (blue circles) shown in Figure 3B. Data points from two cells (blue and orange dots) are plotted as mean ± s.e. (N = 6 cells).
(C) Distributions of fluorescence intensity of BRD4ΔN-mCh-sspB (left column) and scFv-sfGFP-iLID (right column). Data points are plotted as mean ± s.e. (N = 6 cells.)
Figure S3. IDR-driven condensates occupying regions of low chromatin density is observed in various systems. Related to Figure 4.
(A) Proteins (TAF15, SRSF2 IDR, RNPS1) tagged with mCherry-Cry2 were co-expressed with H2B-EYFP in HEK293 cells. Prior to blue light exposure, ORF-mCherry-Cry2 was observed as diffusely distributed (in the case of TAF15 and SRSF2 IDR) or slightly enriched in the interchromatin space (RNPS1). Following blue light exposure, droplets formed in areas of low H2B signal. Images shown are following 15 minutes of activation with blue light. SRSF2 IDR, which primarily consists of serine-arginine dipeptides, corresponds to amino acids 92-221 of the full-length protein.
(B) YFP-tagged proteins (CCNT1 and RNPS1) co-expressed with H2B-miRFP670 in HEK293 cells form droplets in a concentration-dependent fashion and are visible in bright field (BF) image. For each protein, Cell 1 is of higher concentration in YFP-tagged protein while Cell 2 lower. Enlarged image of selected regions and DIC images are shown as insets.
Highlights.
The CasDrop system enables controlled liquid condensation at specific genomic loci.
The IDR-driven condensates grow preferentially in regions of low chromatin density.
Condensate formation leads to mechanical exclusion of non-targeted chromatin.
Condensates pull in targeted genomic loci, serving as mechanical chromatin filters.
Nuclear condensates physically pull-in targeted genomic loci, while excluding non-targeted regions of the neighboring genome.
Acknowledgements
We thank members of the Brangwynne laboratory for help with experiments and comments on the manuscript, particularly Amy Strom. We also thank Mike Levine for helpful discussions and comments. This work was supported by the Howard Hughes Medical Institute, and grants from the NIH 4D Nucleome Program (U01 DA040601), DARPA (HR0011-17-2-0010), the Princeton Center for Complex Materials, an NSF supported MRSEC (DMR 1420541), an NSF CAREER award (1253035), NSF Grant PHY-1607612, and Research Resettlement Fund for the new faculty of Seoul National University.
Footnotes
Publisher's Disclaimer: This is a PDF file of an unedited manuscript that has been accepted for publication. As a service to our customers we are providing this early version of the manuscript. The manuscript will undergo copyediting, typesetting, and review of the resulting proof before it is published in its final citable form. Please note that during the production process errors may be discovered which could affect the content, and all legal disclaimers that apply to the journal pertain.
Declaration of Interests
A patent application describing the CasDrop technology is currently pending.
References
- Banani SF, Lee HO, Hyman AA, and Rosen MK (2017). Biomolecular condensates: organizers of cellular biochemistry. Nature reviews Molecular cell biology 18, 285–298. [DOI] [PMC free article] [PubMed] [Google Scholar]
- Berry J, Weber SC, Vaidya N, Haataja M, and Brangwynne CP (2015). RNA Transcription Modulates Phase Transition-Driven Nuclear Body Assembly. Proceedings of the National Academy of Sciences of the United States of America 112, E5237–E5245. [DOI] [PMC free article] [PubMed] [Google Scholar]
- Bracha D, Walls M, Wei M-T, Zhu L, Toettcher JE, and Brangwynne C (2018). Mapping local and global liquid-liquid phase behavior in living cells using light activated multivalent seeds. bioRxiv under review. [Google Scholar]
- Brangwynne CP, Eckmann CR, Courson DS, Rybarska A, Hoege C, Gharakhani J, Julicher F, and Hyman AA (2009). Germline P granules are liquid droplets that localize by controlled dissolution/condensation. Science 324, 1729–1732. [DOI] [PubMed] [Google Scholar]
- Brangwynne CP, Mitchison TJ, and Hyman AA (2011). Active liquid-like behavior of nucleoli determines their size and shape in Xenopus laevis oocytes. Proceedings of the National Academy of Sciences of the United States of America 108, 4334–4339. [DOI] [PMC free article] [PubMed] [Google Scholar]
- Brangwynne CP, P. T, and Pappu RV. (2015). Polymer physics of intracellular phase transitions. Nature Physics 11. [Google Scholar]
- Chen H, Levo M, Barinov L, Fujioka M, Jaynes JB, and Gregor T (2018). Dynamic interplay between enhancer-promoter topology and gene activity. Nat Genet. [DOI] [PMC free article] [PubMed] [Google Scholar]
- Cho S, Irianto J, and Discher DE (2017). Mechanosensing by the nucleus: From pathways to scaling relationships. The Journal of cell biology 216, 305–315. [DOI] [PMC free article] [PubMed] [Google Scholar]
- Cho WK, Spille JH, Hecht M, Lee C, Li C, Grube V, and Cisse II (2018). Mediator and RNA polymerase II clusters associate in transcription-dependent condensates. Science. [DOI] [PMC free article] [PubMed] [Google Scholar]
- Chong S, Dugast-Darzacq C, Liu Z, Dong P, Dailey GM, Cattoglio C, Heckert A, Banala S, Lavis L, Darzacq X, et al. (2018). Imaging dynamic and selective low-complexity domain interactions that control gene transcription. Science. [DOI] [PMC free article] [PubMed] [Google Scholar]
- Dekker J, and Mirny L (2016). The 3D Genome as Moderator of Chromosomal Communication. Cell 164, 1110–1121. [DOI] [PMC free article] [PubMed] [Google Scholar]
- Dey A, Chitsaz F, Abbasi A, Misteli T, and Ozato K (2003). The double bromodomain protein Brd4 binds to acetylated chromatin during interphase and mitosis. Proceedings of the National Academy of Sciences of the United States of America 100, 8758–8763. [DOI] [PMC free article] [PubMed] [Google Scholar]
- Dine E, Gil AA, Uribe G, Brangwynne CP, and Toettcher JE (2018). Protein Phase Separation Provides Long-Term Memory of Transient Spatial Stimuli. Cell Syst 6, 655–663 e655. [DOI] [PMC free article] [PubMed] [Google Scholar]
- Elbaum-Garfinkle S, Kim Y, Szczepaniak C, Chen C-C, Eckmann CR, Myong S, and Brangwynne CP (2015). The disordered P granule protein LAF-1 drives phase separation into droplets with tunable viscosity and dynamics. Proceedings of the National Academy of Sciences of the United States of America 112, 7189–7194. [DOI] [PMC free article] [PubMed] [Google Scholar]
- Falahati H, Pelham-Webb B, Blythe S, and Wieschaus E (2016). Nucleation by rRNA Dictates the Precision of Nucleolus Assembly. Current biology : CB 26, 277–285. [DOI] [PMC free article] [PubMed] [Google Scholar]
- Feric M, and Brangwynne CP (2013). A nuclear F-actin scaffold stabilizes RNP droplets against gravity in large cells Nature cell biology 15. [DOI] [PMC free article] [PubMed] [Google Scholar]
- Feric M, Vaidya N, Harmon TS, Mitrea DM, Zhu L, Richardson TM, Kriwacki RW, Pappu RV, and Brangwynne CP (2016). Coexisting Liquid Phases Underlie Nucleolar Subcompartments. Cell 165, 1686–1697. [DOI] [PMC free article] [PubMed] [Google Scholar]
- Guenatri M, Bailly D, Maison C, and Almouzni G (2004). Mouse centric and pericentric satellite repeats form distinct functional heterochromatin. The Journal of cell biology 166, 493–505. [DOI] [PMC free article] [PubMed] [Google Scholar]
- Guntas G, Hallett RA, Zimmerman SP, Williams T, Yumerefendi H, Bear JE, and Kuhlman B (2015). Engineering an improved light-induced dimer (iLID) for controlling the localization and activity of signaling proteins. Proceedings of the National Academy of Sciences 112, 112–117. [DOI] [PMC free article] [PubMed] [Google Scholar]
- Herling TW, Garcia GA, Michaels TC, Grentz W, Dean J, Shimanovich U, Gang H, Muller T, Kav B, Terentjev EM, et al. (2015). Force generation by the growth of amyloid aggregates. Proceedings of the National Academy of Sciences of the United States of America 112, 9524–9529. [DOI] [PMC free article] [PubMed] [Google Scholar]
- Hnisz D, Shrinivas K, Young RA, Chakraborty AK, and Sharp PA (2017). A Phase Separation Model for Transcriptional Control. Cell 169, 13–23. [DOI] [PMC free article] [PubMed] [Google Scholar]
- Kanno T, Kanno Y, LeRoy G, Campos E, Sun H-W, Brooks SR, Vahedi G, Heightman TD, Garcia BA, Reinberg D, et al. (2014). BRD4 assists elongation of both coding and enhancer RNAs by interacting with acetylated histones. Nature Structural & Molecular Biology 21, 1047–1057. [DOI] [PMC free article] [PubMed] [Google Scholar]
- Kato M, Han TW, Xie S, Shi K, Du X, Wu LC, Mirzaei H, Goldsmith EJ, Longgood J, Pei J, et al. (2012). Cell-free formation of RNA granules: low complexity sequence domains form dynamic fibers within hydrogels. Cell 149, 753–767. [DOI] [PMC free article] [PubMed] [Google Scholar]
- Kirby TJ, and Lammerding J (2018). Emerging views of the nucleus as a cellular mechanosensor. Nature cell biology 20, 373–381. [DOI] [PMC free article] [PubMed] [Google Scholar]
- Landau LD, and Lifshitz EM (1970). Theory of Elasticity (Pergamon Press; ). [Google Scholar]
- Larson AG, Elnatan D, Keenen MM, Trnka MJ, Johnston JB, Burlingame AL, Agard DA, Redding S, and Narlikar GJ (2017). Liquid droplet formation by HP1alpha suggests a role for phase separation in heterochromatin. Nature 547, 236–240. [DOI] [PMC free article] [PubMed] [Google Scholar]
- Li P, Banjade S, Cheng HC, Kim S, Chen B, Guo L, Llaguno M, Hollingsworth JV, King DS, Banani SF, et al. (2012). Phase transitions in the assembly of multivalent signalling proteins. Nature 483, 336–340. [DOI] [PMC free article] [PubMed] [Google Scholar]
- Lim B, Heist T, Levine M, and Fukaya T (2018). Visualization of Transvection in Living Drosophila Embryos. Molecular cell 70, 287–296 e286. [DOI] [PMC free article] [PubMed] [Google Scholar]
- Lovén J, Hoke H.a., Lin CY, Lau A, Orlando D.a., Vakoc CR, Bradner JE, Lee TI, and Young R.a. (2013). Selective inhibition of tumor oncogenes by disruption of super-enhancers. Cell 153, 320–334. [DOI] [PMC free article] [PubMed] [Google Scholar]
- Mao YS, Zhang B, and Spector DL (2011). Biogenesis and function of nuclear bodies. Trends Genet 27, 295–306. [DOI] [PMC free article] [PubMed] [Google Scholar]
- Milovanovic D, Wu Y, Bian X, and De Camilli P (2018). A liquid phase of synapsin and lipid vesicles. Science 361, 604–607. [DOI] [PMC free article] [PubMed] [Google Scholar]
- Mitrea DM, Cika JA, Guy CS, Ban D, Banerjee PR, Stanley CB, Nourse A, Deniz AA, and Kriwacki RW (2016). Nucleophosmin integrates within the nucleolus via multi-modal interactions with proteins displaying R-rich linear motifs and rRNA. Elife 5. [DOI] [PMC free article] [PubMed] [Google Scholar]
- Molliex A, Temirov J, Lee J, Coughlin M, Kanagaraj AP, Kim HJ, Mittag T, and Taylor JP (2015). Phase separation by low complexity domains promotes stress granule assembly and drives pathological fibrillization. Cell 163, 123–133. [DOI] [PMC free article] [PubMed] [Google Scholar]
- Murakami T, Qamar S, Lin JQ, Schierle GS, Rees E, Miyashita A, Costa AR, Dodd RB, Chan FT, Michel CH, et al. (2015). ALS/FTD Mutation-Induced Phase Transition of FUS Liquid Droplets and Reversible Hydrogels into Irreversible Hydrogels Impairs RNP Granule Function. Neuron 88, 678–690. [DOI] [PMC free article] [PubMed] [Google Scholar]
- Nott T, Petsalaki E, Farber P, Jervis D, Fussner E, Plochowietz A, Craggs T, Bazett-Jones D, Pawson T, Forman-Kay J, et al. (2015). Phase Transition of a Disordered Nuage Protein Generates Environmentally Responsive Membraneless Organelles. Molecular cell 57, 936–947. [DOI] [PMC free article] [PubMed] [Google Scholar]
- Nott TJ, Craggs TD, and Baldwin AJ (2016). Membraneless organelles can melt nucleic acid duplexes and act as biomolecular filters. Nature chemistry 8, 569–575. [DOI] [PubMed] [Google Scholar]
- Ōnuki A (2002). Phase transition dynamics (Cambridge University Press; ). [Google Scholar]
- Ou HD, Phan S, Deerinck TJ, Thor A, Ellisman MH, and O’Shea CC (2017). ChromEMT: Visualizing 3D chromatin structure and compaction in interphase and mitotic cells. Science 357. [DOI] [PMC free article] [PubMed] [Google Scholar]
- Patel A, Lee HO, Jawerth L, Maharana S, Jahnel M, Hein MY, Stoynov S, Mahamid J, Saha S, Franzmann TM, et al. (2015). A Liquid-to-Solid Phase Transition of the ALS Protein FUS Accelerated by Disease Mutation. Cell 162, 1066–1077. [DOI] [PubMed] [Google Scholar]
- Pombo A, and Dillon N (2015). Three-dimensional genome architecture: players and mechanisms. Nature reviews Molecular cell biology 16, 245–257. [DOI] [PubMed] [Google Scholar]
- Quinodoz SA, Ollikainen N, Tabak B, Palla A, Schmidt JM, Detmar E, Lai MM, Shishkin AA, Bhat P, Takei Y, et al. (2018). Higher-Order Inter-chromosomal Hubs Shape 3D Genome Organization in the Nucleus. Cell 174, 744–757 e724. [DOI] [PMC free article] [PubMed] [Google Scholar]
- Sabari BR, Dall’Agnese A, Boija A, Klein IA, Coffey EL, Shrinivas K, Abraham BJ, Hannett NM, Zamudio AV, Manteiga JC, et al. (2018). Coactivator condensation at super-enhancers links phase separation and gene control. Science. [DOI] [PMC free article] [PubMed] [Google Scholar]
- Sheu-Gruttadauria J, and MacRae IJ (2018). Phase Transitions in the Assembly and Function of Human miRISC. Cell 173, 946–957 e916. [DOI] [PMC free article] [PubMed] [Google Scholar]
- Shin Y, Berry J, Pannucci N, Haataja MP, Toettcher JE, and Brangwynne CP (2017). Spatiotemporal Control of Intracellular Phase Transitions Using Light-Activated optoDroplets. Cell 168, 159–171 e114. [DOI] [PMC free article] [PubMed] [Google Scholar]
- Shin Y, and Brangwynne CP (2017). Liquid phase condensation in cell physiology and disease. Science 357. [DOI] [PubMed] [Google Scholar]
- Stephens AD, Banigan EJ, Adam SA, Goldman RD, and Marko JF (2017). Chromatin and lamin A determine two different mechanical response regimes of the cell nucleus. Molecular biology of the cell 28, 1984–1996. [DOI] [PMC free article] [PubMed] [Google Scholar]
- Strom AR, Emelyanov AV, Mir M, Fyodorov DV, Darzacq X, and Karpen GH (2017). Phase separation drives heterochromatin domain formation. Nature 547, 241–245. [DOI] [PMC free article] [PubMed] [Google Scholar]
- Style RW, Sai T, Fanelli N, Ijavi M, Smith-Mannschott K, Xu Q, Wilen LA, and Dufresne ER (2018). Liquid-Liquid Phase Separation in an Elastic Network. Physical Review X 8, 11028–11028. [Google Scholar]
- Tanenbaum ME, Gilbert LA, Qi LS, Weissman JS, and Vale RD (2014). A protein-tagging system for signal amplification in gene expression and fluorescence imaging. Cell 159, 635–646. [DOI] [PMC free article] [PubMed] [Google Scholar]
- Wang Q, Sawyer IA, Sung MH, Sturgill D, Shevtsov SP, Pegoraro G, Hakim O, Baek S, Hager GL, and Dundr M (2016). Cajal bodies are linked to genome conformation. Nature communications 7, 10966. [DOI] [PMC free article] [PubMed] [Google Scholar]
- Weber SC, and Brangwynne CP (2012). Getting RNA and protein in phase. Cell 149, 1188–1191. [DOI] [PubMed] [Google Scholar]
- Wei M-T, Elbaum-Garfinkle S, Holehouse AS, Chen CC-H, Feric M, Arnold CB, Priestley RD, Pappu RV, and Brangwynne CP (2017). Phase behavior of disordered proteins underlying low density and high permeability of liquid organelles. Nature chemistry 9, 1118–1125. [DOI] [PMC free article] [PubMed] [Google Scholar]
- Wippich F, Bodenmiller B, Trajkovska MG, Wanka S, Aebersold R, and Pelkmans L (2013). Dual specificity kinase DYRK3 couples stress granule condensation/dissolution to mTORC1 signaling. Cell 152, 791–805. [DOI] [PubMed] [Google Scholar]
- Zeng M, Shang Y, Araki Y, Guo T, Huganir RL, and Zhang M (2016). Phase Transition in Postsynaptic Densities Underlies Formation of Synaptic Complexes and Synaptic Plasticity. Cell 166, 1163–1175 e1112. [DOI] [PMC free article] [PubMed] [Google Scholar]
- Zhu L, and Brangwynne CP (2015). Nuclear bodies: the emerging biophysics of nucleoplasmic phases. Current Opinion in Cell Biology 34, 23–30. [DOI] [PMC free article] [PubMed] [Google Scholar]
- Zimberlin JA, Sanabria-Delong N, Tew GN, and Crosby AJ (2007). Cavitation rheology for soft materials. Soft Matter 3, 763–767. [DOI] [PubMed] [Google Scholar]
Associated Data
This section collects any data citations, data availability statements, or supplementary materials included in this article.
Supplementary Materials
Figure S4. Phase immiscibility between heterochromatin and BRD4 CasDrop. Related to Figure 5.
(A) Time-lapse images of the same NIH3T3 cell expressing dCas9-ST, scFv-sfGFP-iLID, BRD4ΔN-mCh-sspB, and HP1α-miRFP670 shown in Fig 5e. BRD4 CasDrop readily forms and grows upon local activation by shining 440 nm laser within designated area away from chromocenters.
(B) (Top) Snapshots of the NIH3T3 cell expressing dCas9-ST, scFv-sfGFP-iLID, BRD4ΔN-mCh-sspB, HP1α-miRFP670 and major-satellite targeting sgRNA before activation. Local activation is applied on a single chromocenter (dashed circle) and a kymograph (bottom left) is generated along a dashed line. Time evolution of BRD4ΔN-mCh-sspB signals along the dashed line is shown (bottom right).
(C) Zoomed-in snapshots of the chromocenter shown in (B) after local activation: overlaid for BRD4 and HP1α channel (top) and HP1α alone (middle). (bottom) Intensity profiles of two channels along the dashed line in (B). Arrowheads indicate regions inside the chromocenter where BRD4 droplets displace HP1α.
(D&E) Fluorescence images of NIH3T3 cells expressing miRFP670-HP1α together with constructs for (D) TAF15 CasDrop or (E) FUS CasDrop, prior to activation (top row) and after activation (bottom row). Insets show zoomed-in snapshots of chromocenter of interest. Local activation is applied on a single chromocenter (dashed circle)
Figure S5. Comparison of partitioning of various Cry2 fusion constructs into BRD4 droplets. Related to Figure 5.
(A) (Left) Time lapse images of HEK293T cells expressing dCas9-ST, scFv-sfGFP-iLID, BRD4ΔN-mCh-sspB and different fusions to miRFP670-Cry2 during local activation. (Right) Zoomed-in snapshots around the activation zone. Oligomers of HP1α formed by Cry2 are not recruited into BRD4 droplets unlike other fusions as well as Cry2 itself.
(B) Intensity profiles along the center of BRD4 droplets.
(C) (Top) Fluorescence images of HEK293T cell expressing dCas9-ST, scFv-sfGFP-iLID, BRD4ΔN-mCh-sspB, and miRFP670-Cry2-HP1α, after local activation with blue light. (Bottom) Intensity profiles of BRD4 and HP1α channel along the dashed line passing through the center of droplet.
(D) Partitioning of various Cry2 fusion constructs into BRD4 droplets is measured and then normalized with that of Cry2-only (null). N = 3 - 5 individual cells for each fusion construct. Error bars are s.d.
Figure S6. Physical interaction between liquid condensates and genomic loci. Related to Figure 6.
(A) Histogram of the location of telomeric locus relative to the center of the associated BRD4 droplet.
(B) (left) Time lapse images of the NIH3T3 cell expressing dCas9-ST, scFv-sfGFP-iLID, BRD4ΔN-mCh-sspB, miRFP670-TRF1 and telomere-targeting sgRNA upon local activation. (right) A telomeric locus sits along the way two droplets fuse and later is displaced to the periphery of the droplet.
(C) (left) Two trajectories are generated by simulating 5 traces of two-dimensional (2D) Brownian motions and joining them so that the middle trace is shared by both trajectories. (middle) The 2D view of simulated trajectories with the shared portion highlighted in red. (right) The correlation coefficient between simulated trajectories is computed in an identical manner as Figure 6A. The period shaded in light red corresponds to the time during which two trajectories shared the same trace.
(D) The 2D trajectories of two telomeric loci shown in Figure 6A at three time periods. Trajectories for later time points are shifted horizontally for better visibility. Arrows, to guide the eye, represent temporal motions associated with two loci, highlighting the similarity between two trajectories.
(E) Motions of three loci shown in Figures 6C-6F along axes in Figure 6E before drift correction.
Figure S7. Schematics for model and simulation used for CasDrop. Related to Figures 2, 3, 5, and 6.
(A) Schematic of the situation before (top) and after (bottom) the fusion of two CasDrop condensates (red circles) seeded at telomeric loci (black points) inside chromatin. At mechanical equilibrium, the balance between surface tension and elastic forces is established for a displacement of the loci Δx given by Δx ≈ γ(2R − 21/3R)/(γ + 6πGrlocus) (See Eq. 4 in STAR Methods.)
(B) Phase diagram of the simulated ternary CasDrop model for three values of χ AB. Solid and dashed lines denote binodal and tie lines, respectively. At the red point, the system is mixed for χ AB > −5.2 and demixed for χ AB < −5.2.
Supplementary Video 1. BRD4 CasDrops nucleation with blue light activation of ramping or rapid increase protocol. Related to Figure 2.
(Part 1) A ramping protocol for blue light activation leads to BRD4 CasDrops nucleating almost exclusively at the telomere loci with sgRNA targeting telomeres. (Part 2) Rapid increase in blue light results in BRD4 CasDrop nucleating throughout the nucleoplasm even with sgRNA targeting telomeres. Red, BRD4ΔN-mCh-sspB; gray, miRFP670-TRF1.
Supplementary Video 2. Simulation of CasDrop nucleation, growth, and coarsening under global activation with slow or rapid activation protocol in the presence of pre-seed sites. Related to Figure 2.
(Part 1) A slow activation protocol. Tau = 1000. φB, the concentration of species B, is mapped in black-gray-white-red (see Figure 2C for colorbar values). White circles denote stiff seed cores, light blue halos denote surrounding regions of enhanced φA. The frame rate increases by a factor of four at 9 sec. (Part 2) A rapid activation protocol. Tau = 10. φB, the concentration of species B, is mapped in black-gray-white-red (see Figure 2C for colorbar values). White circles denote stiff seed cores, light blue halos denote surrounding regions of enhanced φA. The frame rate increases by a factor of four at 10 sec and by another factor of four at 16.5 sec.
Supplementary Video 3. Simulation of CasDrop nucleation, growth, and coarsening under global activation in the presence of a spatially heterogeneous elastic network. Related to Figure 3.
Elastic modulus is mapped in white-lavender-green, see Figure 3D for colorbar values. φB, the concentration of species B, is mapped in black-gray-white-red (see Figure 3D for colorbar values). Mechanical deformation energy drives preferential growth within and droplet migration toward soft regions, leading to an absence of condensates in stiff regions and localization of large condensates in soft regions. The frame rate increases by a factor of five at 10 sec.
Supplementary Video 4. Local activation at a chromocenter in NIH3T3 cell results in BRD4 droplets forming around the periphery of the chromocenter. Related to Figure 5.
Red, BRD4ΔN-mCh-sspB; gray, HP1α-miRFP670.
Supplementary Video 5. 3D simulation of CasDrop nucleation, growth, and coarsening under localized activation within a stiff heterochromatin-like domain. Related to Figure 5.
CasDrop is shown in red; stiff heterochromatin-like domain is shown as gray contour. Following nucleation of small droplets within the activated region, mechanical deformation energy drives droplets and droplet-forming molecules to the exterior of the heterochromatin-like domain where large condensates ultimately accumulate and coarsen.
Supplementary Video 6. Growing BRD4 droplet “ruptures” heterochromatin in a NIH3T3 cell during local activation within a chromocenter. Related to Figure 5.
Red, BRD4ΔN-mCh-sspB; gray, HP1α-miRFP670.
Figure S1. IDR-recruitment in CasDrop system forms reversible, liquid-like droplets. Related to Figure 1.
(A) Predicted disorder score (disordered if greater than 0.5) for BRD4, FUS, and TAF15 from Predictor of Natural Disordered Regions (PONDR) VL-XT algorithm and corresponding IDRs used in this study.
(B) (Left) Fluorescence intensity recovery profiles following photobleaching. (Right) Fluorescence images of the nucleus prior to photobleaching (top) and zoomed-in images of the droplet at varying time points as indicated. 488-nm laser is used to bleach a region of interest (dashed circle) inside BRD4 CasDrop. Average intensity value of bleached area is measured in GFP and mCherry channel, and normalized by that of pre-bleached (t < 0 s) region. Error bars are standard deviation.
(C) Integrated intensity of nuclear clusters over five cycles of activation-deactivation shows reversibility for each of BRD4, FUS, and TAF15 CasDrop. Each activation (shaded region) or deactivation interval is 150 s, and cells are globally activated by 488-nm laser every 3 s. Integrated intensity is normalized by the maximal value over five cycles.
(D) HEK293T cell expressing dCas9-ST, scFv-sfGFP-iLID, and mCh-sspB as an IDR-free control, shows no clustering during ~2 minutes of blue light activation. No sgRNA is added.
Figure S2. Before activation CasDrop components are not strongly patterned by chromatin density. Related to Figure 3.
(A) Correlation between normalized fluorescence intensity of DNA staining dye Hoechst 33342 and of overexpressed fluorescently labeled H2B (H2B-GFP). Solid line represents y = x. Data points from two cells (blue and orange dots) are plotted as mean ± s.d. (N = 2 cells).
(B) Cumulative probability curves of group CasDrop (yellow circles) and group nucleoplasm (blue circles) shown in Figure 3B. Data points from two cells (blue and orange dots) are plotted as mean ± s.e. (N = 6 cells).
(C) Distributions of fluorescence intensity of BRD4ΔN-mCh-sspB (left column) and scFv-sfGFP-iLID (right column). Data points are plotted as mean ± s.e. (N = 6 cells.)
Figure S3. IDR-driven condensates occupying regions of low chromatin density is observed in various systems. Related to Figure 4.
(A) Proteins (TAF15, SRSF2 IDR, RNPS1) tagged with mCherry-Cry2 were co-expressed with H2B-EYFP in HEK293 cells. Prior to blue light exposure, ORF-mCherry-Cry2 was observed as diffusely distributed (in the case of TAF15 and SRSF2 IDR) or slightly enriched in the interchromatin space (RNPS1). Following blue light exposure, droplets formed in areas of low H2B signal. Images shown are following 15 minutes of activation with blue light. SRSF2 IDR, which primarily consists of serine-arginine dipeptides, corresponds to amino acids 92-221 of the full-length protein.
(B) YFP-tagged proteins (CCNT1 and RNPS1) co-expressed with H2B-miRFP670 in HEK293 cells form droplets in a concentration-dependent fashion and are visible in bright field (BF) image. For each protein, Cell 1 is of higher concentration in YFP-tagged protein while Cell 2 lower. Enlarged image of selected regions and DIC images are shown as insets.