

Abstract
The pre-Bötzinger complex (preBötC) in the ventrolateral medulla contains interneurons important for respiratory rhythm generation. Voltage-dependent sodium channels mediate transient current (INaT), underlying action potentials, and persistent current (INaP), contributing to repetitive firing, pacemaker properties, and the amplification of synaptic inputs. Voltage-clamp studies of the biophysical properties of these sodium currents were conducted on acutely dissociated preBötC region neurons. Reverse transcription-PCR demonstrated the presence of mRNA for Nav1.1, Nav1.2, and Nav1.6 α-subunits in individual neurons. A TTX-sensitive INaP was evoked in all tested neurons by ramp depolarization from -80 to 0 mV. Including a constant in the Boltzmann equation for inactivation by estimating the steady-state fraction of Na+ channels available for inactivation allowed prediction of a window current that did not decay to 0 at voltages positive to -20 mV and closely matched the measured INaP. Riluzole (3 μm), a putative INaP antagonist, reduced both INaP and INaT and produced a hyperpolarizing shift in the voltage dependence of steady-state inactivation. The latter decreased the predicted window current by an amount equivalent to the decrease in INaP. Riluzole also decreased the inactivation time constant at potentials in which the peak window/persistent currents are generated. Together, these findings imply that INaP and INaT arise from the same channels and that a simple modification of the Hodgkin-Huxley model can satisfactorily account for both currents. In the rostral ventral respiratory group (immediately caudal to preBötC), INaP was also detected, but peak conductance, current density, and input resistance were smaller than in preBötC region cells.
Keywords: sodium channels, persistent current, respiration, pre-Bötzinger, pacemaker, riluzole, central pattern generator
Introduction
Brainstem neurons involved in the control of breathing typically fire bursts of action potentials phase locked to respiratory motor output. Voltage-dependent sodium channels mediate transient current (INaT), underlying action potentials, and subthreshold persistent current (INaP), which contribute to repetitive firing and/or pacemaker properties of neurons (Brumberg et al., 2000; Taddese and Bean, 2002; Do and Bean, 2003). INaP can amplify dendritic depolarizations and facilitate repetitive firing (Schwindt and Crill, 1995; Stuart and Sakmann, 1995; Parri and Crunelli, 1998). In addition, INaP can lead to progressive depolarization that brings neurons to their firing threshold (i.e., pacemaker activity) (Alonso and Llinàs, 1989; Pape and Driesang, 1998; Bennett et al., 2000; Del Negro et al., 2002a; Taddese and Bean, 2002).
A core role in generating respiratory rhythm has been ascribed by many investigators to a column of neurons in the ventrolateral medulla termed the ventral respiratory column (VRC) (Alheid et al., 2002; Feldman and McCrimmon, 2003; Feldman et al., 2003). The pre-Bötzinger complex (preBötC), a small compartment within the longer VRC, has been implicated as the zone containing the basic circuit or “kernel” for respiratory rhythm generation (Smith et al., 1991; Ramirez et al., 1998; Rekling and Feldman, 1998; Solomon et al., 1999; Gray et al., 2001; Wang et al., 2002; Monnier et al., 2003). INaP has been demonstrated within preBötC neurons, as has pacemaker activity (Johnson et al., 1994; Koshiya and Smith, 1999; Del Negro et al., 2002a). INaP and pacemaker activity have been postulated to be essential for respiratory rhythm generation and consequently have been incorporated in recent biophysical models of respiratory neuronal circuits (Butera et al., 1999a; Smith et al., 2000). Nevertheless, this view has been questioned (Del Negro et al., 2002b, 2005; Feldman et al., 2003), and the possibility has been raised that respiratory pacemaker activity may only be essential in pathophysiological states such as gasping (St. John and Paton, 2000, 2002). Regardless of the necessity of pacemaker behavior per se to respiratory rhythm generation, the underlying ionic mechanisms assuredly participate in shaping the discharge pattern of respiratory neurons. Understanding these mechanisms and providing realistic estimates of the biophysical parameters underlying the intrinsic activity is essential for establishing valid neuronal models of the central control of breathing.
Accordingly, we addressed the following questions. First, is INaP density higher in neurons believed to be more intimately associated with rhythm generation (i.e., preBötC neurons) than respiratory neurons in adjacent ventral medullary regions [i.e., in the rostral ventral respiratory cell group (rVRG)]? Second, if there are differences in INaP between neurons from the preBötC and the rostral VRG regions, do these differences correlate with differential expression patterns of sodium channel α-subunits? Third, do the biophysical properties of macroscopic INaP and INaT suggest they arise from the same or from different channels? To answer these questions, we examined acutely isolated rat neurons from the preBötC and rVRG regions using whole-cell voltage clamp. Preliminary accounts of these data have been presented previously (McCrimmon et al., 2001; Ptak et al., 2001a,b, 2002).
Materials and Methods
Retrograde labeling of cranial motoneurons. To document the location of the preBötC region relative to the nucleus ambiguus and facial nucleus in neonatal and young rats, diaminobenzidine (DAB) immunocytochemistry for the neurokinin-1 (NK1) receptor was used to label the preBötC (Gray et al., 1999) in the same animals in which medullary motoneurons had been retrogradely prelabeled with FluoroGold (see Fig. 1 A). Subsequently, FluoroGold labeling alone was used to help identify the preBötC region in fresh parasagittal sections (300 μm thickness) by its topographical location caudal (∼500-1100 μm for 7-d-old rats) to prelabeled fluorescent motoneurons in the facial nucleus and ventral to fluorescent motoneurons in caudal aspects of the compact and semicompact divisions of the nucleus ambiguus (see Fig. 1 B). The region of the rVRG was similarly identified relative to the fluorescent-labeled motoneurons as the area caudally adjacent to the preBötC, lying ventral and caudal to the caudal-most extent of the compact and semicompact portions of nucleus ambiguus. Just after birth, animals were injected subcutaneously on the back at the level of the shoulders with 50 mg/kg FluoroGold (Fluorochrome, Denver, CO) or its sulfate, hydroxystilbamidine-methanesulfate (Wessendorf, 1991) (Biotium, Hayward, CA) at 1.5% in 0.15 m NaCl to produce global (retrograde) labeling of cranial motoneurons in the ventral medulla (Ambalavanar and Morris, 1989). Fluorescent-labeled motoneurons were observed in the medullary slices at low magnifications with an inverted microscope and epifluorescent UV illumination.
Figure 1.
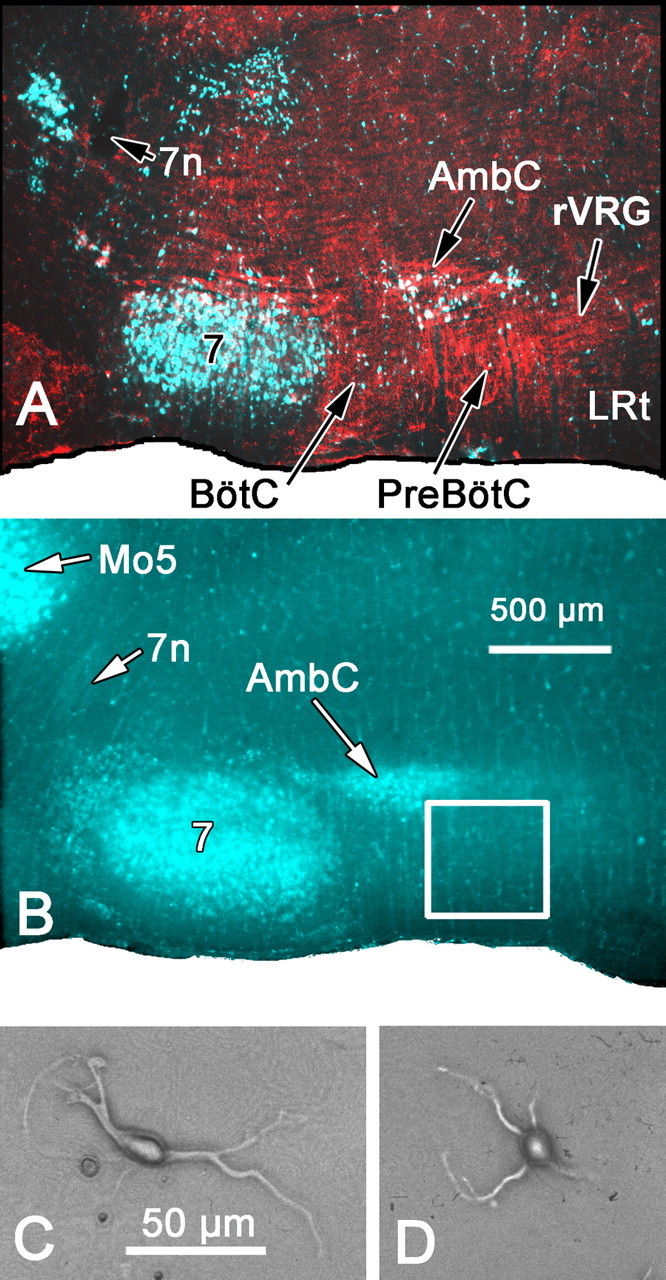
Retrograde labeling of cranial motoneurons provides landmarks for the preBötzinger complex region. A, A 50 μm parasagittal section at the level of the ventral respiratory column. Cranial motoneurons were retrogradely labeled after a subcutaneous injection of FluoroGold (pseudocolored blue and green in digital image) and subsequent DAB immunolabeling of NK1-receptive neurons and processes (inverted bright-field image placed in the red channel of RGB digital image). B, A fresh-mounted, 300-μm-thick parasagittal section at a level similar to that shown in A. Brief, low-magnification, 4× epifluorescent UV excitation is sufficient to identify the FluoroGold-labeled facial nucleus and compact part of nucleus ambiguus as landmarks for dissection of the region containing the preBötC (square). C, D, Examples of fusiform (C) or round (D) neurons acutely dissociated from the region of the preBötC complex. 7, Facial nucleus; 7n, facial nerve; AmbC, compact part of nucleus ambiguus; LRt, lateral reticular nucleus; Mo5, motor nucleus of the trigeminal nerve.
Preparation of dissociated neurons. Neurons from the regions of the preBötC or rVRG (see below) were obtained from newborn and young (1- to 15-d-old) Sprague Dawley rats (Charles River, Wilmington, MA). Cells were dissociated according to a technique adapted from Raman et al. (2000). Animals were anesthetized with isoflurane and decapitated. Parasagittal vibratome slices of the brainstem (300 μm thick) were collected in Tyrode's solution containing the following (in mm): 150 NaCl, 4 KCl, 2 CaCl2, 2 MgCl2, 10 HEPES, 10 glucose, pH 7.4, 300 ± 5 mOsm/L. The slices were incubated for 20 min at 33°C in oxygenated minimum essential medium (MEM) (Invitrogen, Carlsbad, CA) with 10 mm HEPES, 1 mm L-cysteine, and 0.5 mm EDTA, pH 7.2, to which 20 U/ml papain (Worthington, Lakewood, NJ) was added. After enzymatic digestion, slices were washed three times in MEM-HEPES to which 1 mg/ml trypsin inhibitor and 1 mg/ml bovine serum albumin was added. The selected region was dissected from the slice and then dissociated mechanically using a series of fire-polished Pasteur pipettes. To maximize the yield of usable cells, the cell suspension was centrifuged at 1000 rpm for 10 min resuspended, plated onto 35 mm Petri dishes, and placed on the stage of an inverted microscope.
Isolated neurons of varying size and morphology were obtained from this region via enzymatic dissociation (see Fig. 1C,D). Presumptive motoneurons from the external formation of the nucleus ambiguus, identified by their large size and/or fluorescent labeling, were excluded from subsequent physiological analysis. The exclusion of larger neurons from our sample also favors the selection of ventral respiratory column interneurons rather than premotor bulbospinal neurons, because the former are significantly smaller than the latter (Alheid et al., 2002). The size (cross-sectional area) of neurons used for either electrophysiological (202.4 ± 8.68 μm2; n = 33) or reverse transcription (RT)-PCR (175.4 ± 8.66 μm2; n = 24) experiments averaged 191.0 ± 6.4 μm2, which is consistent with the previously reported size of propriobulbar VRC neurons (193.8 ± 6.6 μm2) (Alheid et al., 2002). From the selected population of presumptive propriobulbar neurons, patching was only attempted for those cells that looked healthy based on their microscopic appearance (e.g., well defined and smooth membrane with the perimeter of the soma appearing as a bright line when viewed with phase optics). Of these healthy appearing small cells, ∼75% yielded usable recordings.
Electrophysiological recordings. Patch pipettes were pulled from borosilicate glass (World Precision Instruments, Sarasota, FL) coated with Sylgard (Dow Corning, Midland, MI) and fire polished. Electrode resistance was 1.5-3 MΩ. Pipettes were filled with an internal solution based on N-methyl-d-glucamine (NMDG) (as the free base) as follows (in mm): 130 NMDG, 10 EGTA, 20 HEPES, 20 CsCl, 2 MgCl2, 12 phosphocreatine, 2 Mg-ATP, 0.7 Na2GTP, and 0.1 leupeptin, pH 7.2 adjusted with H2SO4 (265 ± 5 mOsm/L; <1 μm added). Occasionally, small pH levels over adjustments (only if 7.1 < pH <7.2) were corrected with CsOH (300 ± 5 mOsm/L). The INaT was recorded using an external solution consisting of the following (in mm): 15 NaCl, 110 tetraethylammonium (TEA)-Cl, 10 HEPES, 10 CsCl, 1 MgCl2, 2 BaCl2, and 0.3 CdCl2 buffered to pH 7.4 with CsOH (300 ± 5 mOsm/L). For measurement of INaP, the external solution contained the following (in mm): 115 NaCl, 45 TEA-Cl, 10 CsCl, 10 HEPES, 1 MgCl2, 2 BaCl2, and 0.3 CdCl2 buffered to pH 7.4 with CsOH (300 ± 5 mOsm/L) (Maurice et al., 2001). The quantitative relationship between INaP and INaT (see Figs. 4 B, C, 5, 8 A-D) was examined using an internal pipette solution containing the following (in mm): 120 TEA-Cl, 15 NaCl, 1.8 MgCl2, 9 EGTA, 4 Mg-ATP, 14 phosphocreatine, 0.3 mm GTP (Tris salt), and 9 HEPES, pH 7.4 with TEA-OH (265 ± 5 mOsm/L). The external solution was as follows (in mm): 150 NaCl, 3 KCl, 15 TEA-Cl, 3.9 BaCl2, 0.1 CdCl2, and 10 HEPES, adjusted to pH 7.4 with NaOH (300 ± 5 mOsm/L). During recording, the external solutions were applied through a gravity-driven capillary perfusion array. Its end was placed ∼3 mm from the neuron. Bathing solutions were changed by adjusting the perfusion array using DC solenoid valves (Warner Instruments, Hamden, CT). Solutions were changed in <1 s. All reagents were obtained from Sigma (St. Louis, MO). Membrane potentials (Vm) are uncorrected for the liquid junction potential, which was small but varied slightly with the external solution (for external [Na+] of 15 mm, -1.2 mV; external [Na+] of 115 mm, -0.6 mV; external [Na+] of 150 mm, +1 mV) measured using a flow KCl bridge (Neher, 1992).
Figure 4.

Na+ currents in neurons from the preBötC region do not completely inactivate at more than -20 mV. A, Persistent Na+ current was evoked by a ramp from -80 to 0 mV (50 mV/s). The TTX-subtracted trace is illustrated. Inset, Traces before and during TTX (300 nm). B, Representative TTX-subtracted Na+ current was elicited at -20 mV by a 70 ms step from a holding potential of -80 mV. In this neuron, the step to -20 mV produced a peak Na+ current of -6 nA that decayed to a steady-state level of approximately -75 pA (higher resolution in the inset; note the different scale for time and current), representing 1.2% of the total Na+ current. C, Na+ channel availability for inactivation at -20 mV. Peak current amplitudes during a 10 mV test pulse were divided by the peak currents measured during prepulses of varying duration. These values were plotted as percentages representing the fraction of remaining Na channels available for inactivation. The data points were subsequently fit with a curve based on the sum of two exponentials (time constants, 13.1 and 1.7 ms).
Figure 5.

Conditioning pulse trains reduce the amount of transient and persistent Na+ currents at -20 mV in neurons from the preBötC region. Entry into inactivation was determined using a 500 ms prepulse to -20 mV. Inactivation was measured with a 10 ms test pulse to 10 mV after a 20 ms recovery interval at -80 mV (○). The conditioning trains consisted of 15 20 ms pulses separated by 20 ms intervals at -80 mV (•). Insets, Transient Na+ current with (•) and without (○) conditioning trains at higher resolution either during beginning of prepulse at -20 mV (left inset) or during test pulse at 10 mV (right inset). The effect of conditioning trains was also studied on persistent Na+ current measured at the end of prepulse (middle inset; note different current scale). Note that the conditioning trains and step pulse reduced the amplitude of INaT similarly (∼50%). The step pulse similarly reduced INaP (∼60%).
Figure 8.

The effect of riluzole on transient Na+ currents evoked by a 50 ms pulse to -20 mV in a preBötC region neuron is dependent on holding potential. A-D, Representative Na+ currents evoked in control and with riluzole (3 μm) by a step from holding potentials of -100 (A), -80 (B), -60 (C), and -55 (D) mV. Insets, Currents at the end of 50 ms steps at higher resolution. Note the enhanced effect of riluzole on transient and persistent Na+ currents with steps initiated from depolarized holding potentials. E, Summary of the reduction of transient (□) and persistent (▪) Na+ current by riluzole (3 μm; n = 11). F, Riluzole reduced the inactivation time course at potentials more negative than -30 mV. Currents were evoked by 50 ms step depolarizations from -45 to 0 mV (5 mV increments) from a holding potential of -80 mV. Decaying phases of current traces were fit by a monoexponential function, and the time constant in the absence (○) and presence (•) of riluzole was plotted as a function of the test potentials. RIL, Riluzole; CTRL, control.
Riluzole [2-amino-6-(trifluoromethoxy)benzothiazole] (Sigma) was dissolved in 10% DMSO to make a 10 mm stock and was diluted with external solutions immediately before use. The concentration of DMSO in the external solution was 0.01% except in experiments shown in Figure 7B, in which the dose dependence of riluzole-mediated inhibition of INa was determined. In these experiments, a stock solution of riluzole in 10% DMSO was sequentially diluted, resulting in a DMSO of 0.1% at the highest riluzole concentration (100 μm).
Figure 7.

Riluzole reduces transient and persistent Na+ currents in preBötC region neurons. A, Riluzole (3 μm) reduced transient Na+ current (∼70%) evoked by a step to -20 from -80 mV in a representative neuron. B, Concentration-dependent reduction by riluzole of Na+ current during steps from -80 to -20 mV. Data were fit to the Langmuir isotherm with an EC50 value of 2.4 μm. Concentrations of riluzole <100 nm were not used; accordingly, current inhibition by lower concentrations represents values predicted by the theoretical fit of the curve. Control (○) and riluzole (•; 3 μm) influence the voltage dependence of activation and inactivation. Solid lines are fits to the Boltzmann equation. Note that riluzole reduced availability at hyperpolarized potentials and shifted the steady-state inactivation curve to the left. D, Relative window conductance for control and riluzole computed from C. E, Riluzole (3 μm) reduced the INaP (∼70% at -45 mV; ∼80% at -20 mV). F, Effect of riluzole on INaP activation in one cell. Na+ conductance was derived from TTX-subtracted current in A. Solid lines are fits to the Boltzmann equation.
Membrane capacitance (CM) was determined from the transient capacitive current evoked by a 20 ms hyperpolarizing step from -70 to -80 mV averaged for 10 trials and calculated according to CM = τ/Rs, where Rs is the series resistance. The input resistance (RIN) was calculated by measuring the steady-state passive current (IP) evoked with a 20 ms hyperpolarizing step from -70 to -80 mV (Vm) averaged for 10 trials and calculated according to RIN = Vm/IP.
Several steps were taken to ensure adequate voltage control as described previously (Carr et al., 2002). Briefly, recordings were performed only on cells with relatively short attached primary dendrites to ensure adequate space-clamp control. Data were also disqualified if there was evidence of loss of voltage control or space-clamp errors. These include changes in the activation kinetics of the pulse current evoked by the inactivation protocol, spiking during the ramp experiments, or signs of rundown (>30% response decline relative to that after the initial prepulse) over the course of the experiments examining kinetics of entry into inactivation.
As in the previous report by Maurice et al. (2001), the activation data curve was fit with a third-order Boltzmann function of the following form: g(V) = 1/(1 + exp[(V - V1/2)/k])3, where k is the slope factor and V1/2 is the half-activation voltage of each of three hypothetical gates. The third-order equation provided a better fit of the curve to the raw data in the threshold region of current activation than was the case for the first-order equation. Optimization of the fit in this region of the curve was particularly important for accurate calculation of the window current. The use of a third-order fit is also consistent with the Hodgkin-Huxley kinetic model of Na+ channels. In the model, activation is described as the opening of three identical and independent m-gates. Accounting for the movement of three hypothetical particles during channel opening is consistent with the better fit provided by the third-order Boltzmann function to the activation data (Maurice et al., 2001). It should be noted that with a third-order function, half-activation of the macroscopic current occurs at more depolarized potentials than those estimated with the first-order Boltzmann function generally applied to the activation data from various CNS neurons studied in previous reports. In contrast, inactivation in the Hodgkin-Huxley model occurs on the closing of one h-gate, so the inactivation-voltage curve was fit with a modified first-order Boltzmann equation of the form I/Imax = (1 - Iss)/(1 + exp[(V - V1/2)/k]) + Iss, where I/Imax is the relative current, V1/2 is the half-voltage inactivation, k is the slope factor, and Iss is the sustained current resulting from activation of a fraction of available channels (open or closed).
The INaT activation time constant (τm) was calculated from the time-to-peak [to(V)] data at each voltage step (V) by fitting to a first-order exponential in the following form: I(t,V) = Imax(V)(1 - exp[t/τm(V)])/(1 -exp[to(V)]/[t/τm(V)]). The INaT inactivation time constant (τh) was evaluated from the data on current decay for each voltage step during the activation protocol by fitting to a first-order exponential in the following form: I(t,V) = [Ii(V) - Iss(V)] exp[- [(t - ti)/τh(V)] + Iss(V), t ≥ti, where Ii(V) is the current value close to Imax(V) at the moment ti and Iss is the steady-state current of the decaying current. The concentration-response relationship for riluzole inhibition of the transient Na+ current was fit with a Langmuir isotherm of the following form: I = Isat/(1 + [R]/EC50)n + Ir, where Isat is the fraction of current blocked at saturating riluzole concentrations, Ir is the fraction of current that is resistant to block and is the concentration of riluzole, and EC50 is the concentration of riluzole producing a block equal to 50% of Isat (Carr et al., 2002). The apparent binding for riluzole to block Na+ channels in the inactivated state (Ki) was estimated by the following equation: Ki = R/([1 + R/EC50]/exp[(ΔV1/2/k) - 1]), where R is the riluzole concentration, ΔV1/2 represents the shift of inactivation curve after application of riluzole, and k is the slope factor (Bean et al., 1983).
Average values were expressed as mean ± SE. Except where noted otherwise, statistical significance was evaluated by means of the two-tail Student's t test for unpaired data. Box plots (Tukey, 1977) are used in Figures 3 and 6. As applied here, the median is the central line and the box extends from the first to third quartiles. Vertical lines extend beyond the box to include adjacent values not >1.5 times the interquartile range. Individual values beyond this limit are plotted as circles.
Figure 3.

Comparison of Na+ currents in neurons from the rVRG and preBötC regions. A, Box plots showing transient Na+ current amplitude in rVRG (open bars; n = 20) and preBötC (hatched bars; n = 29) neurons. B, Amplitude of persistent Na+ current induced by a voltage ramp (50 mV/s) in rVRG neurons (n = 20) compared with preBötC neurons (n = 29). C, Density of INaP in neurons from rVRG (open bars; n = 20) preBötC (hatched bars; n = 29) regions. D, RIN is lower for rVRG (n = 13) compared with preBötC (n = 13) region neurons. E, F, Time constants for activation (E) and inactivation (F). See Materials and Methods for a description of box-plot parameters.
Figure 6.

Persistent and window currents may arise from the same Na+ channels in preBötC region neurons. A, Voltage dependence of the conductance underlying persistent current compared with that of window conductance (solid line) for the same cell. Both conductances were normalized to the same maximum values and are approximately coincident. B, Box plot illustrating the offsets in peak conductance of window minus persistent conductances in neurons from the preBötC region (n = 20). Note that the median and lower bounds for the interquartile range both equal zero.
Single-cell and tissue RT-PCR procedures. Procedures were similar to those described by Maurice et al. (2001). Briefly, isolated neurons (unrecorded) were aspirated into sterilized glass electrodes (capillaries treated at 180°C for 8 h before pulling) containing 1-2 μl of a solution consisting of diethyl pyrocarbonate-treated water (DEPC) and Superasin RNase-inhibitor (Ambion, Austin, TX). Sterile gloves were worn during cell collection for RT-PCR to minimize RNase contamination. The glass pipette tip (containing the cell) was broken into a 0.5 ml presiliconized centrifuge tube containing a 5 μl mixture of bovine serum albumin (143 ng/μl), Superasin (40 U/μl), deoxyNTPs (dNTPs) (10 mm), and random hexamers (50 ng/μl). The centrifuge tube with the sampled neuron was immediately placed in liquid nitrogen and then stored at -80°C. All components excluding Supernasin (Ambion, Austin, TX) were purchased from Invitrogen (Carlsbad, CA). In addition to single cells, tissue blocks containing the preBötC or rVRG regions were also collected for RT-PCR analysis. In the latter instance, the tissue was dissected as described for the patch-clamp experiments, except that blocks immediately caudal to the preBötC were also dissected. Tissue blocks were immediately placed in RNase- and DNase-free 1.5 ml centrifuge tubes, frozen in liquid nitrogen, and stored at -80°C. RNA was extracted from tissue samples using the RNeasy RNA mini kit (Qiagen, Valencia, CA). The sample was also treated with amplification-grade DNase I (Invitrogen) to eliminate genomic DNA. Either the aspirated cell mixture or tissue mRNA combined with dNTPs and random hexamers was heated at 65°C for 5 min and then incubated on ice for 1 min. Single-strand cDNA was synthesized from the mRNAs by the addition of 50 U/μl SuperScript II RT, 10× PCR buffer, 25 mm MgCl2, 0.1 m DTT, and 40U/μl RNase OUT followed by incubation at 25°C for 10 min and then 42°C for 50 min. The reaction was terminated by heating the mixture at 70°C for 15 min and cooling it to 0°C. The RNA strand in the RNA-DNA hetero-duplex was removed by incubating the sample at 37°C for 20 min in the presence of Escherichia coli RNase H (2 U/ml). The cDNA from single neurons as well as the cDNA from tissue samples were subjected to PCR to detect the specific sodium channel α-subunit mRNAs. Conventional PCR was performed with a thermal cycler (MJ Research, Watertown, MA). PCR primers were the same as those described by Maurice et al. (2001) for sodium channel α-subunits (Nav1.1, Nav1.2, Nav1.5, Nav1.6). PCR mixtures contained 2.2 mm MgCl2, 0.5 mm of each dNTP, 20 μm primers, 2.5 U of TaqDNA polymerase (Promega, Madison, WI), 2.5 μl of 10× buffer (Promega), and 5 μl of cDNA template from single-cell RT reaction. After a 5 min denaturing step at 95°C, a thermal cycler program was performed for all primer sets: 94°C for 1 min, 56-58°C for 1 min, and 72°C for 1 min. Forty-five PCR cycles were followed by a 10 min extension at 72°C. PCR techniques were performed following procedures designed to minimize the chance of cross-contamination. Negative controls were run with each batch of neurons to ensure that genomic DNA did not contribute to PCR products. Neurons were aspirated and processed without Superscript II in the manner described above. Additional negative controls were run during the PCR experiment by replacing the cellular template with DEPC-treated water. Both controls were consistently negative in these experiments. Positive controls were also run with each PCR experiment. Positive controls using cDNA from preBötC region tissue ensured that the PCR was successful in the event that bands were not detected in any of the neurons. PCR products were separated by electrophoresis in 1.5% agarose gels and stained with ethidium bromide for visualization. The frequencies of sodium channel detection in individual neurons from the preBötC and rVRG regions were determined and evaluated for differences using the χ2 distribution without the correction for continuity. Nav1.1, Nav1.2, Nav1.6 were all detected in significant percentages of preBötC and rVRG neurons. In contrast, although the Nav1.5 mRNA was detected in tissue samples of the preBötC and rVRG, it was not discerned in the small-sized interneuronal cell population that we sampled. The lack of detection in single cells is unlikely to be attributable to a limitation of the technique or the primers used in the present study. In the septum, where neurons expressing this subunit are more abundant (Hartmann et al., 1999), Nav1.5 mRNA was detected in a subset of individual septal neurons using identical primers and RT-PCR protocols (Maurice et al., 2001). In the current study, Nav1.5 was also identified in ∼5% of dissociated single septal neurons that were tested as a positive control (data not shown). Nevertheless, the possibility of false negatives cannot be completely discounted where the abundance of mRNA is particularly low in individual cells.
Immunohistochemistry for NK1 receptors. To document the location of the preBötC relative to labeled cranial motoneurons, sections from several young rats injected subcutaneously with fluorescent tracers (see above) were counterstained for the NK1 receptor using normal immunocytochemical procedures. Briefly, 7-d-old rats were killed under deep Nembutal anesthesia (150 mg/kg), perfused transcardially, and fixed with 4% paraformaldehyde and 15% (v/v) saturated picric acid in 0.1 m NaPO4 buffer. The brains were sectioned sagittally at 50 μm. NK1 receptor-positive neurons were detected using rabbit antibodies to these receptors (1:3000; Advanced Targeting System, San Diego, CA). Sections were rinsed in PBS and then pretreated for 30 min in 0.3% H2O2 in 5% methanol in PBS. The sections were subsequently preincubated for 30 min in a solution consisting of 0.25% λ-carrageenan, 1% bovine serum albumin, 0.1% Tween 20 (Sigma), and 0.05% sodium azide. The primary antibodies were then added to the mixture of carrier solution, and sections were incubated overnight. The following day, sections were rinsed and incubated for 2 h with biotinylated donkey anti-rabbit secondary antibodies (Jackson ImmunoResearch, West Grove, PA). The sections were then incubated for an additional 2 h in PBS containing an avidin-biotinylated horseradish peroxidase complex (ABC reagents; Vector Laboratories, Burlingame, CA). Sections were incubated subsequently for 20-30 min using the glucose-oxidase-coupled peroxidase reaction with DAB as the substrate.
Results
In the present study, we characterized sodium currents in neurons from the region of the preBötC in the rostral ventrolateral medulla. These were then contrasted with currents recorded from the immediate caudal region of the rVRG. These regions were identified relative to the fluorescent-labeled landmarks (Fig. 1A,B) that were readily observed at low magnifications and that have a fixed relationship to NK1 receptor immunoreactivity in the preBötC region (Gray et al., 1999). This allowed reproducible sampling of neurons from this region and assured sampling from a population of isolated neurons that were enriched in respiratory neurons from the preBötC or, in the contrasting sample, from the rVRG. Despite this, it should be acknowledged that the respiratory nature of individual dissociated neurons was not directly established.
Transient sodium current in the pre-Bötzinger region
Initial experiments characterized INaT. For this purpose, the external Na+ concentration was lowered to 15 mm to reduce current amplitude and voltage disparities introduced by series resistance errors. At this concentration, the properties of INaT were similar to those reported in studies in which the Na+ concentration gradient between the inside and outside of neurons was reversed, making them nonregenerative (Dargent et al., 1994). Figure 2, A and B, illustrates Na+ currents evoked by standard activation and inactivation protocols, respectively. Steady-state plots were constructed by subtracting the TTX-insensitive leak current (Fig. 2C). In 29 dissociated neurons from the preBötC region, the V1/2 activation of INaT was -43.7 ± 0.6 mV, with k = 6.5 ± 0.2, based on the fit of the third-order version of the Boltzmann equation. Using 100 ms prepulses, V1/2 of steady-state inactivation was -67.0 ± 0.3 mV with k = 9.8 ± 0.4 mV (n = 29).
Figure 2.

Features of transient Na+ current in neurons from the preBötC region. A, B, Representative current traces (TTX-subtracted) and protocols used to examine the voltage dependence of activation (A) and inactivation (B; 100 ms prepulses). C, Plots of the peak conductance (○) and the test pulse conductance (•) as a function of voltage. Solid lines are fits to the Boltzmann equation for inactivation and activation. Fitting parameters for this neuron were as follows: V1/2 = -46.0 mV, k = 6.0 mV (activation; based on the third-order version of the Boltzmann equation); V1/2 = -68.3 mV, k = 8.5 mV (inactivation; first-order Boltzmann equation).
Comparison of the activation properties obtained for INaT in preBötC region neurons revealed reasonable agreement with values reported by Maurice et al. (2001) for cortical pyramidal neurons (V1/2 = -38.4 mV; k = 5.8), the only other study applying a third-order Boltzmann function on dissociated neurons. Fitting a first-order equation to the data in the current study yields an activation of V1/2 = -32.4 ± 0.8 for preBötC neurons and a slope factor of 4.7 ± 0.1. This agrees well with previous studies on INaT voltage dependence using acutely dissociated neurons from other CNS regions (median activation, V1/2 = -31.5 mV) (Huguenard et al., 1988; Sah et al., 1988; Raman and Bean, 1997; Magistretti and Alonso, 1999; Raman et al., 2000; Taddese and Bean, 2002).
With respect to inactivation of INaT, the V1/2 (-67.0 mV) in the present study was close to the median value for other CNS neurons (-64.4 mV) (Huguenard et al., 1988; Sah et al., 1988; Raman and Bean, 1997; Magistretti and Alonso, 1999; Raman et al., 2000; Maurice et al., 2001; Taddese and Bean, 2002). In contrast, the slope factor (9.8) for the preBötC region Na+ channel inactivation was higher than that for neurons from other CNS regions (median inactivation, k = 5.7). The higher slope factor is not readily attributed to methodological differences, because first-order Boltzmann functions were used to fit the inactivation data in both instances. To determine whether the higher slope factor may have been attributable to a failure to achieve steady-state inactivation in these neurons, longer prepulses of 200 or 300 ms were tried. However, the longer steps did not significantly shift the voltage-dependent inactivation in the hyperpolarizing direction, nor did the slope factor become steeper. This is also consistent with the relatively short τ for inactivation, which was ∼7 ms at -40 mV and shortened to ∼1 ms at 0 mV (Fig. 3E,F) (see below). In contrast, use of a lowered external sodium concentration (15 mm in the current study) to improve the space clamp may have reduced the slope factor, as has been found for cerebellar neurons (Afshari et al., 2004). Additionally, the shallow slope is consistent with the presence of multiple sodium channels with slight differences in the voltage dependence of inactivation, thereby extending the voltage range over which inactivation occurred.
To investigate the time constant of activation (τm), the rising currents evoked by the step depolarizing protocol were fitted with an exponential function. The τm became shorter with increasing depolarization, for instance, from 0.71 ± 0.08 ms at -40 mV to 0.11 ± 0.01 ms at 5 mV (n = 29) (Fig. 3E). The inactivation time constant (τh), calculated using an exponential fit to the decaying Na+ current evoked by depolarizing steps, was also shortened from 6.89 ± 0.76 ms at -40 mV to 0.81 ± 0.06 ms at +5 mV (n = 29) (Fig. 3F).
Persistent sodium current in the pre-Bötzinger region
For characterization of INaP, the external Na+ concentration was elevated to 115 mm to increase the current amplitude, thereby improving the signal-to-noise ratio. Slow ramps from -80 to 0 mV (50 mV/s) were used to examine the voltage dependence of the persistent current. This allowed full inactivation of the fast-decaying Na+ current component but produced minimal slow inactivation (Fig. 4A). At the end of each experiment, Na+ current was blocked with TTX (300 nm). The resulting residual TTX-insensitive current was thus determined and subtracted from the overall Na+ current to reveal the TTX-sensitive portion of INaP. An INaP was evoked in all tested neurons (n = 29), and its properties were similar to those described previously in neurons from other CNS regions (Alzheimer et al., 1993; Kay et al., 1998; Magistretti and Alonso, 1999; Maurice et al., 2001; Carr et al., 2002). This current was activated above -60 mV, reaching a peak of approximately -40 mV (Fig. 4A); the current then declined with additional depolarization but remained active.
Comparison of pre-Bötzinger region INaP with window current
Window current is described by the overlap of the nominally steady-state activation and inactivation curves. A distinction between the window current and the persistent current has been presumed (Kay et al., 1998; Magistretti and Alonso, 1999; Maurice et al., 2001), because the predicted inactivation curve of the window current decays to zero, according to the Hodgkin and Huxley (1952) model, whereas the persistent current remains outside a voltage range predicted for the window current. However, Taddese and Bean (2002) recently applied an allosteric gating model of Na+ channels and postulated that the persistent current originates from incomplete inactivation approaching a steady-state level in the range of 0.5 to 4% of the total Na+ conductance.
To determine whether the inactivation process in preBötC region neurons is complete, the ratio of INaP to INaT was quantified. To improve the ability to resolve small currents, the current was evoked in 150 mm external Na+ and measured at the end of a 70 ms depolarizing pulse to -20 mV. The evoked current was sampled 25 times and then averaged. In this series, the peak of the INaT was -5.8 ± 0.3 nA, the steady-state current was -77.7 ± 8.1 pA, and the ratio of INaP to INaT was 1.54 ± 0.25% at -20 mV (range, 0.7-3.3%; n = 14) (Fig. 4B). Next, we determined the kinetics of inactivation at this potential (Fig. 4C). This process was estimated by plotting the current evoked by a test pulse to -10 mV after a variable length conditioning prepulse (5-100 ms) to -20 mV. The resulting plot was fit with the sum of two exponential functions. The fast time constant was 1.6 ± 0.1 ms, and the slow time constant was 12.6 ± 0.35 (n = 6). In these experiments, the peak of INaT was -7.68 ± 0.7 nA, the steady-state current was -76 ± 9.4 pA, and the ratio of INaP to INaT was 1 ± 0.1% (n = 6) (Fig. 4C). These results indicate that in neurons from the preBötC region, Na+ channels did not completely inactivate at -20 mV, at least within several hundred milliseconds.
To examine whether persistent current originates from the same Na+ channels as transient current, we asked whether slow inactivation affected these currents in a similar manner (Taddese and Bean, 2002; Carr et al., 2003; Do and Bean, 2003). To drive the Na+ channels in preBötC neurons into the slow inactivated state, a train of 15 pulses was delivered at 25 Hz (20 ms depolarizations to -20 mV separated by 20 ms intervals at -80 mV) (Fig. 5). The conditioning pulse train reduced the amplitude of INaT by 56 ± 2.8% and the persistent Na+ current by 63.1 ± 2.7% (n = 5) (Fig. 5). This result demonstrates that the process of slow inactivation induced by the conditioning train affected both the transient and the persistent Na+ currents equivalently and is consistent with both currents generated by the same population of Na+ channels.
These data are consistent with the hypothesis that the persistent Na+ current is a window current. Therefore, we directly compared the conductance of the window current with that of the persistent current evoked by a ramp protocol (50 mV/s). Window conductance was computed by taking the product of the Boltzmann equations fit to the steady-state activation (third-order) and inactivation (first-order) plots (see Materials and Methods). The inactivation curve was fit by a Boltzmann equation that had been altered by the addition of a factor that estimated the steady-state fraction of Na+ channels available for inactivation (open or closed; see Materials and Methods). In neurons from the preBötC region, this availability ranged from 0.7 to 3.3% for a prepulse duration of 100 ms. Figure 4C shows a typical experiment with availability of 1.5% at 100 ms. Figure 6A shows an example in which normalized persistent and window conductances are plotted for an individual cell. The shapes and voltage dependence of both conductances are sufficiently coincident to suggest that INaP and window current may arise from the same type of Na+ channels. This overlap was a typical result. In 8 of 20 neurons, there was no difference between the voltages at which the peak conductance occurred when comparing persistent and window currents, and, for 17 of 20 neurons, the difference was <2 mV. When averaged over all preBötC region neurons, the shift was <1 mV (0.9 ± 0.6 mV; n = 20) with a median of 0 mV. The distribution of these differences is depicted in the box plot shown in Figure 6B. In two neurons from the preBötC region, the activation voltage dependence of persistent current appeared to be shifted toward a more negative membrane potential than the macroscopic window current and, in one cell, to a more positive value (Fig. 6B, outliers).
Effect of riluzole on pre-Bötzinger regions INaP and INaT
It has been postulated that persistent current is selectively sensitive to riluzole (Benoit and Escande, 1991; Urbani and Belluzzi, 2000), with the implication that this current arises from different Na+ channels than those producing INaT. To examine this question, we compared the sensitivity of INaT and INaP in preBötC region neurons to riluzole at a series of concentrations. Application of riluzole produced a concentration-dependent and reversible reduction in the peak of INaT evoked by a step from a holding potential of -80 to -20 mV (Fig. 7A). The fraction by which the peak amplitude was reduced was plotted as a function of riluzole concentration and fit with the Langmuir isotherm with an EC50 value of 2.4 μm (Fig. 7B). The effects of riluzole on INaT were mediated in part by a negative shift in the voltage dependence of rapid inactivation (V1/2 control, -64.7 ± 1.1 mV; V1/2 riluzole, -75.1 ± 1.1 mV; p ≤ 0.001; n = 8) (Fig. 7C), a decrease in peak Na+ conductance (gmax control, 1.29 ± 0.10 nS; gmax riluzole, 0.52 ± 0.06 nS; p ≤ 0.001; n = 8), and reduced channel availability at hyperpolarized potentials (9.32 ± 1.4% reduction at -110 mV; n = 8) (Fig. 7C). However, riluzole did not change the inactivation slope factor (k control, 7.80 ± 0.3 mV; k riluzole, 7.86 ± 0.2 mV; n = 8) (Fig. 7C). In 3 μm riluzole, there was no significant change in the voltage dependence of activation (V1/2 control, -43.7 ± 0.95 mV; V1/2 riluzole, -43.9 ± 1.1 mV; n = 8) (Fig. 7C). However, a positive shift in the V1/2 of activation occurred as the drug concentration was increased to 10 μm (data not shown). These results suggest that riluzole binds selectively to Na+ channels in their inactivated states.
By shifting the steady-state inactivation curve, riluzole decreased the relative window conductance by ∼70% and shifted the peak of the window current to a more hyperpolarized potential (approximately -4 mV) (Fig. 7D). In addition to its effects on the transient Na+ current, riluzole reduced the INaP, measured with a slow (50 mV/s) voltage ramp protocol, by 76 ± 1% (n = 5) (Fig. 7E). An equivalent decrease in the amplitude of the INaP was also obtained using a step depolarization to -20 mV in the presence of riluzole (3 μm) in all examined neurons (average reduction, 74 ± 5.0%; n = 7) (Fig. 7A). Riluzole shifted the voltage dependence of persistent current activation toward more negative membrane potentials by ∼3 mV (V1/2 control, -53.1 ± 0.4 mV; V1/2 riluzole, -56.5 ± 0.4 mV; p ≤ 0.01; n = 5) (Fig. 7F). The results from these experiments demonstrate that riluzole modulates transient as well as persistent Na+ currents to approximately the same degree, suggesting the presence of a single population of Na+ channels underlying both types of currents.
Mechanism of Na+ channel modulation by riluzole
A variety of investigators (Benoit and Escande, 1991; Hebert et al., 1994; Song et al., 1997; Urbani and Belluzzi, 2000) have interpreted the effects of riluzole on Na+ channels according to a modulated receptor model (Hille, 1977). In this model, the affinity of the drug for Na+ channels depends on the gating state (deinactivated, open, or inactivated). Accordingly, and as observed in previous reports, a riluzole-induced negative shift in the voltage dependence of fast inactivation results from a higher affinity of the drug for Na+ channels in their inactivated state.
To estimate the affinity of riluzole for binding to inactivated Na+ channels in the preBötC region, the apparent dissociation constant (Ki) was calculated (see Materials and Methods). The Ki value of 0.3 ± 0.1 μm (n = 9) indicated an approximately eight-fold greater apparent affinity of riluzole compared with the EC50 value, consistent with a highly preferential block of Na+ channels in the inactivated state, as reported previously (Benoit and Escande, 1991; Hebert et al., 1994; Song et al., 1997; Urbani and Belluzzi, 2000). As a result, the effect of riluzole on Na+ current would be expected to depend on the holding potential of a neuron. Removing inactivation by holding a neuron at a very polarized potential (i.e., moving channels into the deinactivated state) would reduce the effect of riluzole. To examine this in preBötC region neurons, the effects of 3 μm riluzole on both transient and persistent currents were examined with steps to -20 mV from different holding potentials in 150 mm external Na+ (Fig. 7C). The evoked current was sampled 25 times and then averaged as described above. When the current was evoked from -100 mV, riluzole decreased the peak of INaT and INaP by 21 ± 2 and 62 ± 2%, respectively (Fig. 8A,E) (n = 11). The reduction was greater from a holding potential of -80 mV (Fig. 8B,E) (peak INaT, 59 ± 0.2%; INaP, 74 ± 1%; n = 18). In comparison, as shown in Figure 8C-E, stepping from a holding potential of -60 or -55 mV dramatically enhanced the reduction of peak INaT (88 ± 2% from -60 mV; 94 ± 2% from -50 mV; n = 11) by riluzole. In contrast, there were only modest additional reductions (INaP, 88 ± 2% from -60 mV; 80 ± 1% from -55 mV; n = 11).
These results are consistent with the modulated receptor model (Hille, 1977), with a greater affinity of riluzole for inactivated compared with deinactivated (closed) channels. The relatively greater reduction in INaP versus INaT evoked from holding potentials of -100 or -80 mV suggests that riluzole may preferentially modulate the inactivation of Na+ current. With steps initiated from these relatively hyperpolarized potentials, very few channels would initially be in the inactivated state, whereas by the end of a 50 ms depolarizing step, many channels would have entered the inactivated state. The relatively smaller additional effect of riluzole on INaP compared with INaT with steps initiated from less negative holding potentials (-60 and -55 mV) (Fig. 8C-E) is also consistent with riluzole acting preferentially on the inactivated channel. In these cases, a greater portion of the channels would already be in an inactivated state and exhibit a higher affinity for riluzole with a resulting reduced availability for inactivation and a smaller effect on INaT. With respect to the effect of riluzole on INaP, the channel inactivation occurring during the 50 ms step to -20 mV would be expected to decrease the importance of the holding potential in determining the number of channels available for inactivation.
One study has reported riluzole-induced shortening of the inactivation time constant of Na+ current (Song et al., 1997), whereas others have reported no effect (Benoit and Escande, 1991; Hebert et al., 1994). Faster inactivation in the presence of riluzole would decrease the availability of Na+ channels for inactivation during step depolarizations. To examine the effect of riluzole on the rate of inactivation, the time course was measured at different test potentials in the presence and absence of 3 μm riluzole. Inactivation time constants (calculated from monoexponential fits) were plotted as a function of the test potentials. As shown in Figure 8F, riluzole reduced the inactivation time constant at potentials negative to -30 mV with more pronounced effects at more negative potentials, that is, riluzole accelerated entry into inactivation. Moreover, the predominant effect occurred over the voltage range encompassing the peak in window current, or INaP. In contrast, the activation time constant was not changed (data not shown).
Together, these are consistent with riluzole having a higher affinity for the inactivated Na+ channels and, by decreasing the inactivation time constant at potentials negative to -30 mV, accelerating entry into inactivation.
INaP and INaT in neurons from the rVRG region
Sodium currents were determined in a sample of 20 neurons dissociated from the region of the rVRG and compared with the currents measured in preBötC neurons (n = 29). The voltage at which the peak INaT occurred was significantly greater for rVRG neurons (Table 1). The magnitude of the peak current was considerably larger (p < 0.001) in neurons from preBötC (-2.26 ± 0.1 nA) than from rVRG (-1.54 ± 0.1 nA) regions (Fig. 3A). The voltage dependence of activation (V1/2) was slightly lower and the slope factor (k) was slightly greater for neurons from the preBötC region when determined using conductance-voltage plots (Table 1). In contrast, there was no significant difference in voltage dependence of inactivation (V1/2) or in its slope factor between the two groups (Fig. 7F, Table 1). The time constants of activation and inactivation were almost identical between neurons from the two regions and demonstrated similar voltage dependence, becoming shorter at more depolarized potentials (Fig. 3E,F). Finally, similar values for CM were measured for both the preBötC and the rVRG (preBötC, 10.9 ± 0.7 pF, n = 10; rVRG, 11.3 ± 0.6, n = 5; p > 0.05), presumably reflecting sampling of similarly sized neurons from either area. In contrast, RIN was significantly greater for preBötC compared with rVRG neurons (Fig. 3D) (preBötC, 176.8 ± 12.4 MΩ, n = 13; rVRG, 98.5 ± 7.5 MΩ, n = 13; p < 0.05).
Table 1.
Biophysical characteristics of Na+ channels in neurons from preBötC and rVRG regions
|
|
preBötC region (n = 29) |
rVRG region (n = 20) |
p (df = 47) |
|---|---|---|---|
| Peak of INaT (mV) | −21.2 ± 0.6 | −16.5 ± 1.1 | 0.001 |
| Magnitude of INaT (nA) | −2.3 ± 0.1 | −1.5 ± 0.1 | 0.001 |
| Activation | |||
| V½ (mV) | −43.7 ± 0.6 | −40.3 ± 0.8 | 0.02 |
| k (mV) | 6.5 ± 0.2 | 5.6 ± 0.2 | 0.01 |
| Inactivation | |||
| V½ (mV) | −67.0 ± 0.6 | −66.1 ± 0.1 | NS |
| k (mV) | 9.8 ± 0.4 | 9.2 ± 0.2 | NS |
| Max window conductance (estimated percentage of INaT) | 2.0 ± 0.1 | 1.2 ± 0.1 | 0.001 |
| Peak of INaP (mV) (ramp, 50 mV/s) | −42.0 ± 0.5 | −39.6 ± 0.7 | 0.01 |
| Conductance of INaP (nS) (ramp, 50 mV/s) | 1.7 ± 0.2 | 0.9 ± 0.1 | 0.01 |
| INaP density (pA/pF) | 14.1 ± 1.6 | 7.6 ± 0.9 | 0.01 |
|
|
Range, 7.1-26.8 |
Range, 3.5-13.5 |
|
The differences in steady-state activation and inactivation kinetics resulted in a significantly smaller maximum window conductance in neurons from the rVRG region compared with neurons from the preBötC region (Table 1). Similar to the reduced window current for neurons from the rVRG region, the persistent Na+ current induced by a slow ramp (50 mV/s) was also smaller (p < 0.001), with a maximum of -85.6 ± 6.5 pA (Fig. 3B) (gNaP, 0.9 ± 0.1 nS; n = 20) occurring at a potential of -39.6 ± 0.7 mV (Table 1) compared with the window current for neurons from the preBötC region, in which the maximal persistent current was -161.9 ± 12.7 pA (Fig. 3B) (gNaP, 1.7 ± 0.2 nS; n = 29), occurring at a potential of -42.0 ± 0.5 mV (Table 1). In addition, the density of INaP was significantly lower in neurons from the rVRG region compared with that measured in neurons from the preBötC region (Fig. 3C, Table 1).
Detection of Na+ channel α-subunits with single-cell RT-PCR
In parallel with our electrophysiological experiments, RT-PCR techniques were used to determine the contribution of different Na+ channel α-subunits. In CNS neurons, several sodium channel α-subunit mRNAs are expressed, including Nav1.1, Nav1.2, Nav1.3, Nav1.5, and Nav1.6 (Donahue et al., 2000; Goldin, 2001). Because a null mutation in Nav1.6 reduced the amplitude of persistent Na+ current in Purkinje neurons and prefrontal cortex pyramidal neurons, it was suggested that this isoform might contribute, importantly, to this current (Raman et al., 1997; Vega-Saenz de Miera et al., 1997; Maurice et al., 2001). Nevertheless, Nav1.6 null mutant mice demonstrated the presence of persistent current that was attributed to Nav1.1/1.2 (Raman et al., 1997; Maurice et al., 2001). In tissue samples from the preBötC and rVRG regions, all four channel mRNAs were detected. In the small neurons sampled from these regions, only Nav1.1, Nav1.2, and Nav1.6 mRNAs were detected. Although Nav1.5 was not detected in single cells, the ability of the primers to detect this subunit in single neurons has been demonstrated for septal neurons (Maurice et al., 2001). Nevertheless, for RT-PCR, the probability of false negatives, although low, is never zero, and the precise number of cells actually expressing the mRNA for each subunit may be somewhat higher than the experimentally determined detection rate.
Detection of these mRNAs is illustrated in Figure 9. The example in Figure 9A shows detection of Nav1.1 and Nav1.6 in isolated single neurons from the preBötC region. Relative detection frequencies for each Na+ α-channel subunit mRNA are depicted in Figure 9B. Significant differences in the detection frequency of Nav1.1 and Nav1.2 mRNAs were observed between the preBötC and rVRG regions. Nav1.1 was more prevalent in isolated neurons from the preBötC region (60%; 76 of 127) compared with the rVRG region (24%; 11 of 45; χ2 = 16.66; df = 1; p < 0.01). In contrast, Nav1.2 was more frequently observed in neurons from the rVRG region (36%; 16 of 44) than in the preBötC region (16%; 6 of 37; χ2 = 4.12; df = 1; p < 0.05). Nav1.6 was detected at similar rates in the preBötC region (50%; 38 of 74 cells) and in the rVRG (46%; 27 of 59 neurons; χ2 = 0.28; df = 1, NS).
Figure 9.

Summary of Na+ channel α-subunit mRNA detection in neurons from preBötC and rVRG regions. A, Example of single-cell RT-PCR on six neurons (1 per column) from the preBötC region. The leftmost column is a 100 bp ladder. Top, Nav1.1 (353 bp). Bottom, Nav1.6 (256 bp). B, α-Subunits were detected in both the preBötC and rVRG regions. Three left histogram pairs show the detection rate for individual α-subunits; three right pairs show the rate of codetection when two α-subunits were simultaneously examined in individual neurons. Note the higher frequency of Nav1.1 in preBötC region neurons and Nav1.2 in rVRG neurons. *p < 0.05 between preBötC and rVRG. The number of cells analyzed is as follows: from preBötC region, 127 Nav1.1, 37 Nav1.2, 116 Nav1.6, 37 Nav1.1 and Nav1.2, 37 Nav1.2 and Nav1.6, 116 Nav1.1 and Nav1.6; from rVRG region, 45 Nav1.1, 44 Nav1.2, 59 Nav1.6, 30 Nav1.1 and Nav1.2, 24 Nav1.2 and Nav1.6, 15 Nav1.1 and Nav1.6.
Discussion
Our findings suggest that INaP is a common property expressed by respiratory neurons. However, a higher INaP density and higher RIN may distinguish the interneurons in the preBötC region from those in the rVRG. The differential distribution of mRNA for the Nav1.1 and Nav1.2 α-subunits from the preBötC and rVRG region neurons may account for the different INaP magnitudes observed in these distinct respiratory compartments. Taking into account an estimate of Na+ channel availability for inactivation allows INaP to be closely predicted by the window current. Consequently, the preferential effects of riluzole on Na+ channel inactivation can account for the apparent selectivity of riluzole for INaP.
Acutely dissociated neurons provide for improved space clamp and more accurate determination of small persistent currents; however, the loss of synaptic inputs precludes identification of respiratory neurons by their characteristic phasic discharge pattern. Nevertheless, a substantial fraction of the isolated small interneurons was likely to be respiratory, because, in vivo, the vast majority of spontaneously active neurons from the region of the VRC exhibit a respiratory-phasic discharge pattern. Moreover, the small size of respiratory interneurons distinguishes these from larger premotor and motor neurons in the VRC (Alheid et al., 2002). Topographical cues provided by FluoroGold retrograde labeling of nucleus ambiguus motoneurons greatly improved the likelihood that the preBötC and VRG were selectively sampled from the VRC, while additionally facilitating the exclusion of large labeled motoneurons.
Possible basis of INaP
Our data indicate that the amplitude and shape of INaP and predicted window currents coincide. Yet, it has been suggested that INaP and window current may derive from different mechanisms (French et al., 1990; Kay et al., 1998, Magistretti and Alonso, 1999; Maurice et al., 2001). Although INaP remains active at a quasi-stable, nonzero value, window current is generally predicted by the Hodgkin-Huxley equations to decline to zero at voltages of at least -20 mV. However, in an examination of an allosteric model of Na+ channel gating, strong depolarization failed to fully inactivate Na+ channels (Taddese and Bean, 2002). In our experiments, the ratio of preBötC steady-state INaP to the peak INaT was ∼1.5%, consistent with incomplete inactivation in the allosteric model. Altering the Boltzmann equation for sodium channel inactivation by including a constant estimating this steady-state fraction of Na+ channels available for inactivation resulted in a predicted window current that closely approximated the measured INaP (Fig. 6). The observation that a conditioning train of depolarizing pulses was equally effective in driving both INaT and INaP into the inactivated state is also consistent with the same Na+ channel populations underlying both persistent and transient currents and with observations in other brain regions (Fleidervish and Gutnick, 1996; Magistretti and Alonso, 1999; Urbani and Belluzzi, 2000; Taddese and Bean; 2002). Nevertheless, the possibility cannot be excluded that, for a subset of neurons, two or more types of Na+ channels differing in their activation voltage dependence may contribute to INaP. This type of heterogeneity could account for the shift in the voltage dependence of the peak conductance observed in some neurons (e.g., the outliers in Figure 6B).
Riluzole, INaP, and INaT
We found that INaT and INaP, evoked from -80 mV, exhibited similar sensitivities to riluzole (3 μm), reducing them 59 and 74%, respectively, consistent with a common origin for these two currents. Contributing to this effect was a 10 mV hyperpolarizing shift in the steady-state inactivation curve. A similar displacement was observed in rat dorsal root ganglion neurons (Song et al., 1997), cortical neurons (Urbani and Belluzzi, 2000), and Xenopus oocytes in which the Nav1.2 Na+ channel isoform was expressed (Hebert et al., 1994). The shift in the inactivation curve by riluzole can account for its apparent selectivity for INaP, because an identity between the window current and INaP means that a hyperpolarizing shift in the inactivation curve leads to a proportionally greater decrease in the INaP (window current) than is the case for INaT.
As pointed out by Urbani and Belluzzi (2000), the effects of riluzole on INaP and INaT are consistent with the modulated receptor hypothesis in which both currents are generated by the same channels, but riluzole binds with a higher affinity to channels in the inactivated state (Hille, 1977; Kuo and Bean, 1994). In our experiments, riluzole modulation of Na+ currents depended on the holding potential from which these currents were evoked, implying that riluzole has higher affinity for Na+ channels in the inactivated state. We also found that riluzole decreased the inactivation time constant at potentials less than -30 mV.
Possible contribution of INaP to breathing rhythm and pattern generation
The finding of substantial persistent current in all neurons tested from the VRC region agrees with previous observations (Del Negro et al., 2002a,b; Rybak et al., 2003). Additionally, peak persistent sodium conductance, current density, and RIN were greater in interneurons isolated from the preBötC than from the immediately adjacent rVRG region. In brain slices, INaP density was nominally greater for preBötC pacemaker versus nonpacemaker neurons (Del Negro et al., 2002a,b), suggesting that the higher INaP density reflects the higher proportion of pacemaker neurons in this region. Pacemaker activity does not depend on the magnitude of the persistent current alone; higher input resistance (as observed for preBötC neurons compared with rVRG cells) also promotes firing from subthreshold activation of persistent currents (Del Negro et al., 2002a; Taddese and Bean; 2002).
Persistent sodium current supports pacemaker activity in various CNS neurons (Taddese and Bean, 2002), including a subset of preBötC respiratory neurons (Thoby-Brisson and Ramirez, 2001; Del Negro et al., 2002a,b, 2005). However, INaP is also present in nonpacemaker preBötC neurons (Del Negro et al., 2002a, 2005) as well as in rVRG neurons (present study). Accordingly, Del Negro et al. (2002a) argued that pacemaker activity in preBötC neurons depends on the ratio of INaP to the leak current. In the current study, INaP density in preBötC neurons averaged 16.7 versus 7.7 pA/pF in rVRG neurons. These are larger than the current densities reported by Del Negro et al. (2002a) for pacemaker or nonpacemaker preBötC neurons (4.3 and 2.0 pA/pF, respectively). The difference probably reflects our use of dissociated neurons with little dendritic arbor compared with relatively intact neurons within their slice preparation. This is also concordant with the smaller CM in our experiments, approximately one-third of that measured by Del Negro et al. (2002a). Although Del Negro et al. (2002a) reported a difference in CM between pacemaker and nonpacemaker neurons, our selection of similar-sized small cells for physiological recording from both the preBötC and rVRG is consistent with the similarity in the CM we obtained for cells from these two regions. The INaP in our preBötC region neurons was also greater than that reported for many other CNS neurons, even where dissociated cells were used (Raman et al., 1997; Maurice et al., 2001; Carr et al., 2002; Taddese and Bean, 2002).
The mRNAs for α-subunits Nav1.1, Nav1.2, and Nav1.6 were detected in substantial numbers of neurons from both the preBötC and rVRG regions, and this agrees with the RT-PCR performed on tissue samples. The ratio of INaP to peak sodium current differs between α-subunits when they are expressed in Xenopus oocytes (Nav1.1, ∼2%; Nav1.2, ∼0.5%; Nav1.6, ∼2-4%) (Smith et al., 1998). The ratio observed for preBötC region neurons (1.5%) is consonant with a key role for Nav1.1 and Nav1.2 α-subunits in determining INaP for these cells. The greater detection frequency of Nav1.1 in preBötC neurons is consistent with the higher current density found in neurons from this region and, conversely, the higher prevalence of Nav1.2 in the rVRG is consistent with the lower current density measured in these neurons.
Although the presence of pacemaker neurons is characteristic of the preBötC, it has been argued that they may not be essential for the maintenance of rhythmic activity. Del Negro et al. (2002b, 2005) pharmacologically blocked persistent sodium current with relatively low doses of riluzole (10 μm); this blocked bursting activity in pacemaker neurons in the preBötC, confirming that INaP is required for this activity. However, respiratory rhythm continued (Del Negro et al., 2002b, 2005). Although INaP-based pacemaker activity may not be essential for generation of respiratory rhythm, INaP would be expected to modulate the intrinsic excitability of both pacemaker and nonpacemaker respiratory neurons. Subthreshold persistent sodium current could have an important role in amplifying synaptic currents supporting repetitive firing and leading to rhythm generation (Butera et al., 1999b; Lee and Heckman, 2000; Henze and Buzsáki, 2001).
In summary, INaP is evident in all examined interneurons from the preBötC and rVRG and may be closely modeled with the window current using the modified Hodgkin-Huxley equations. Higher INaP density and input resistance, a combination of parameters favoring pacemaker activity (Taddese and Bean, 2002), are found in the preBötC, a region in which VRC pacemaker neurons are more prevalent and that is thought to be crucial for the generation of rhythmic inspiratory activity.
Footnotes
This work was supported by National Institutes of Health Grants HL60097, HL60969, and HL72415 (D.R.M.) and NS 34696 (D.J.S.). We thank Dr. Ilya A. Rybak for his mathematical insights, Dr. Adriana Ferreira and Sasha Ulrich for help with the RT-PCR experiments, Drs. Indira M. Raman and Nicolas Maurice for their advice on the enzymatic dissociation procedures, and Dr. Susanne Birnstiel for helpful comments on this manuscript.
Correspondence should be addressed to Donald R. McCrimmon, Department of Physiology, M211, Feinberg School of Medicine, Northwestern University, 303 East Chicago Avenue, Chicago, IL 60611-3008. E-mail: dm@northwestern.edu.
K. Ptak's present address: National Institute of Neurological Disorders and Stroke, National Institutes of Health, Bethesda, MD 20892.
Copyright © 2005 Society for Neuroscience 0270-6474/05/255159-12$15.00/0
References
- Afshari FS, Ptak K, Khaliq ZM, Grieco TM, Slater NT, McCrimmon DR, Raman IM (2004) Resurgent Na currents in four classes of neurons of the cerebellum. J Neurophysiol 92: 2831-2843. [DOI] [PubMed] [Google Scholar]
- Alheid GF, Gray PA, Jiang M, Feldman JL, McCrimmon DR (2002) Parvalbumin in respiratory neurons of the ventrolateral medulla of the adult rat. J Neurocytol 31: 693-717. [DOI] [PubMed] [Google Scholar]
- Alonso A, Llinàs RR (1989) Subthreshold Na+-dependent theta-like rhythmicity in stellate cells of entorhinal cortex layer II. Nature 342: 175-177. [DOI] [PubMed] [Google Scholar]
- Alzheimer C, Schwindt PC, Crill WE (1993) Modal gating of Na+ channels as a mechanism of persistent Na+ current in pyramidal neurons from rat and cat sensorimotor cortex. J Neurosci 13: 660-673. [DOI] [PMC free article] [PubMed] [Google Scholar]
- Ambalavanar R, Morris R (1989) Fluoro-gold injected either subcutaneously or intravascularly results in extensive retrograde labelling of CNS neurones having axons terminating outside the blood-brain barrier. Brain Res 505: 171-175. [DOI] [PubMed] [Google Scholar]
- Bean BP, Cohen CJ, Tsien RW (1983) Lidocaine block of cardiac sodium channels. J Gen Physiol 81: 613-642. [DOI] [PMC free article] [PubMed] [Google Scholar]
- Bennett BD, Callaway JC, Wilson CJ (2000) Intrinsic membrane properties underlying spontaneous tonic firing in neostriatal cholinergic interneurons. J Neurosci 20: 8493-8503. [DOI] [PMC free article] [PubMed] [Google Scholar]
- Benoit E, Escande D (1991) Riluzole specifically blocks inactivated Na channels in myelinated nerve fibre. Pflügers Arch 419: 603-609. [DOI] [PubMed] [Google Scholar]
- Brumberg JC, Nowak LG, McCormick DA (2000) Ionic mechanisms underlying repetitive high-frequency burst firing in supragranular cortical neurons. J Neurosci 20: 4829-4843. [DOI] [PMC free article] [PubMed] [Google Scholar]
- Butera Jr RJ, Rinzel J, Smith JC (1999a) Models of respiratory rhythm generation in the preBötzinger complex. I. Bursting pacemaker neurons. J Neurophysiol 82: 382-397. [DOI] [PubMed] [Google Scholar]
- Butera Jr RJ, Rinzel J, Smith JC (1999b) Models of respiratory rhythm generation in the preBötzinger complex. II. Populations of coupled pacemaker neurons. J Neurophysiol 82: 398-415. [DOI] [PubMed] [Google Scholar]
- Carr DB, Cooper DC, Ulrich SL, Spruston N, Surmeier DJ (2002) Serotonin receptor activation inhibits sodium current and dendritic excitability in prefrontal cortex via a protein kinase C-dependent mechanism. J Neurosci 22: 6846-6855. [DOI] [PMC free article] [PubMed] [Google Scholar]
- Carr DB, Day M, Cantrell AR, Held J, Scheuer T, Catterall WA, Surmeier DJ (2003) Transmitter modulation of slow, activity-dependent alternations in sodium channel availability endows neurons with a novel form of cellular plasticity. Neuron 39: 793-806. [DOI] [PubMed] [Google Scholar]
- Dargent B, Paillart C, Carlier E, Alcaraz G, Martin-Eauclaire MF, Couraud F (1994) Sodium channel internalization in developing neurons. Neuron 13: 683-690. [DOI] [PubMed] [Google Scholar]
- Del Negro CA, Koshiya N, Butera Jr RJ, Smith JC (2002a) Persistent sodium current, membrane properties and bursting behavior of preBötzinger complex inspiratory neurons in vitro J Neurophysiol 88: 2242-2250. [DOI] [PubMed] [Google Scholar]
- Del Negro CA, Morgado-Valle C, Feldman JL (2002b) Respiratory rhythm: an emergent network property? Neuron 34: 821-830. [DOI] [PubMed] [Google Scholar]
- Del Negro CA, Morgado-Valle C, Hayes JA, Mackay DD, Pace RW, Crowder EA, Feldman JL (2005) Sodium and calcium current-mediated pacemaker neurons and respiratory rhythm generation. J Neurosci 25: 446-453. [DOI] [PMC free article] [PubMed] [Google Scholar]
- Do MT, Bean BP (2003) Subthreshold sodium currents and pacemaking of subthalamic neurons: modulation by slow inactivation. Neuron 39: 109-120. [DOI] [PubMed] [Google Scholar]
- Donahue LM, Coates W, Lee VH, Ippensen DC, Arze SE, Poduslo SE (2000) The cardiac sodium channel mRNA is expressed in the developing and adult rat and human brain. Brain Res 887: 335-343. [DOI] [PubMed] [Google Scholar]
- Feldman JL, McCrimmon DR (2003) Neural control of breathing. In: Fundamental neuroscience, Chap 37, Ed 2 (Squire LR, Bloom FE, Roberts JL, Zigmond MJ, McConnell SK, Spitzer NC, eds), pp 967-990. New York: Academic.
- Feldman JL, Mitchell GS, Nattie EE (2003) Breathing: rhythmicity, plasticity, chemosensitivity. Annu Rev Neurosci 26: 239-266. [DOI] [PMC free article] [PubMed] [Google Scholar]
- Fleidervish IA, Gutnick MJ (1996) Kinetics of slow inactivation of persistent sodium current in layer V neurons of mouse neocortical slices. J Neurophysiol 76: 2125-2130. [DOI] [PubMed] [Google Scholar]
- French CR, Sah P, Buckett KJ, Gage PW (1990) A voltage-dependent persistent sodium current in mammalian hippocampal neurons. J Gen Physiol 95: 1139-1157. [DOI] [PMC free article] [PubMed] [Google Scholar]
- Goldin AL (2001) Resurgence of sodium channel research. Annu Rev Physiol 63: 871-894. [DOI] [PubMed] [Google Scholar]
- Gray PA, Rekling JC, Bocchiaro CM, Feldman JL (1999) Modulation of respiratory frequency by peptidergic input to rhythmogenic neurons in the preBötzinger complex. Science 286: 1566-1568. [DOI] [PMC free article] [PubMed] [Google Scholar]
- Gray PA, Janczewski WA, Mellen N, McCrimmon DR, Feldman JL (2001) Normal breathing requires preBötzinger complex neurokinin-1 receptor-expressing neurons. Nat Neurosci 4: 927-930. [DOI] [PMC free article] [PubMed] [Google Scholar]
- Hartmann HA, Colom LV, Sutherland ML, Noebels JL (1999) Selective localization of cardiac SCN5A sodium channels in limbic regions of rat brain. Nat Neurosci 2: 593-595. [DOI] [PubMed] [Google Scholar]
- Hebert T, Drapeau P, Pradier L, Dunn RJ (1994) Block of the rat brain IIA sodium channel α-subunit by the neuroprotective drug riluzole. Mol Pharmacol 45: 1055-1060. [PubMed] [Google Scholar]
- Henze DA, Buzsáki G (2001) Action potential threshold of hippocampal pyramidal cells in vivo is increased by recent spiking activity. Neuroscience 105: 121-130. [DOI] [PubMed] [Google Scholar]
- Hille B (1977) Local anesthetics: hydrophilic and hydrophobic pathways for the drug-receptor interaction. J Gen Physiol 69: 497-515. [DOI] [PMC free article] [PubMed] [Google Scholar]
- Hodgkin AL, Huxley AF (1952) A quantitative description of membrane current and its application to conduction and excitation in nerve. J Physiol (Lond) 117: 500-544. [DOI] [PMC free article] [PubMed] [Google Scholar]
- Huguenard JR, Hamill OP, Prince DA (1988) Developmental changes in Na+ conductances in rat neocortical neurons: appearance of a slowly inactivating component. J Neurophysiol 59: 778-795. [DOI] [PubMed] [Google Scholar]
- Johnson SM, Smith JC, Funk GD, Feldman JL (1994) Pacemaker behavior of respiratory neurons in medullary slices from neonatal rat. J Neurophysiol 72: 2598-2608. [DOI] [PubMed] [Google Scholar]
- Kay AR, Sugimori M, Llinàs R (1998) Kinetic and stochastic properties of a persistent sodium current in mature guinea pig cerebellar Purkinje cells. J Neurophysiol 80: 1167-1179. [DOI] [PubMed] [Google Scholar]
- Koshiya N, Smith JC (1999) Neuronal pacemaker for breathing visualized in vitro Nature 400: 360-363. [DOI] [PubMed] [Google Scholar]
- Kuo CC, Bean BP (1994) Slow binding of phenytoin to inactivated sodium channels in rat hippocampal neurons. Mol Pharmacol 46: 716-725. [PubMed] [Google Scholar]
- Lee RH, Heckman CJ (2000) Adjustable amplification of synaptic input in the dendrites of spinal motoneurons in vivo J Neurosci 20: 6734-6740. [DOI] [PMC free article] [PubMed] [Google Scholar]
- Magistretti J, Alonso A (1999) Biophysical properties and slow voltage-dependent inactivation of a sustained sodium current in entorhinal cortex layer-II principal neurons: a whole-cell and single-channel study. J Gen Physiol 114: 491-509. [DOI] [PMC free article] [PubMed] [Google Scholar]
- Maurice N, Tkatch T, Meisler M, Sprunger LK, Surmeier DJ (2001) D1/D5 dopamine receptor activation differentially modulates rapidly inactivating and persistent sodium currents in prefrontal cortex pyramidal neurons. J Neurosci 21: 2268-2277. [DOI] [PMC free article] [PubMed] [Google Scholar]
- McCrimmon DR, Monnier A, Ptak K, Zummo G, Zhang Z, Alheid GF (2001) Respiratory rhythm generation: preBötzinger neuron discharge patterns and persistent sodium current. Adv Exp Med Biol 499: 147-152. [DOI] [PubMed] [Google Scholar]
- Monnier A, Alheid GF, McCrimmon DR (2003) Defining ventral medullary respiratory compartments with a glutamate receptor agonist in the rat. J Physiol (Lond) 548: 859-874. [DOI] [PMC free article] [PubMed] [Google Scholar]
- Neher E (1992) Correction for liquid junction potentials in patch clamp experiments. Methods Enzymol 207: 123-131. [DOI] [PubMed] [Google Scholar]
- Pape HC, Driesang RB (1998) Ionic mechanisms of intrinsic oscillations in neurons of the basolateral amygdaloid complex. J Neurophysiol 79: 217-226. [DOI] [PubMed] [Google Scholar]
- Parri HR, Crunelli V (1998) Sodium current in rat and cat thalamocortical neurons: role of a non-inactivating component in tonic and burst firing. J Neurosci 18: 854-867. [DOI] [PMC free article] [PubMed] [Google Scholar]
- Ptak K, Alheid GF, Jiang M, Surmeier DJ, McCrimmon DR (2001a) Characterization of persistent sodium current in a subset of pre-Bötzinger complex neurons. Soc Neurosci Abstr 27: 633.9. [Google Scholar]
- Ptak K, Zummo G, Alheid GF, McCrimmon DR (2001b) Presence of persistent sodium currents in the pre-Bötzinger neurons. FASEB J 15: A425. [Google Scholar]
- Ptak K, Zummo G, Alheid GF, Surmeier DJ, McCrimmon DR (2002) Biophysical and molecular proprieties of persistent sodium current in preBötzinger complex respiratory neurons. Soc Neurosci Abstr 28: 221.8. [Google Scholar]
- Raman IM, Bean BP (1997) Resurgent sodium current and action potential formation in dissociated cerebellar Purkinje neurons. J Neurosci 17: 4517-4526. [DOI] [PMC free article] [PubMed] [Google Scholar]
- Raman IM, Sprunger LK, Meisler MH, Bean BP (1997) Altered subthreshold sodium currents and disrupted firing patterns in Purkinje neurons of Scn8a mutant mice. Neuron 19: 881-891. [DOI] [PubMed] [Google Scholar]
- Raman IM, Gustafson AE, Padgett D (2000) Ionic currents and spontaneous firing in neurons isolated from the cerebellar nuclei. J Neurosci 20: 9004-9016. [DOI] [PMC free article] [PubMed] [Google Scholar]
- Ramirez JM, Schwarzacher SW, Pierrefiche O, Olivera BM, Richter DW (1998) Selective lesioning of the cat pre-Bötzinger complex in vivo eliminates breathing but not gasping. J Physiol (Lond) 507: 895-907. [DOI] [PMC free article] [PubMed] [Google Scholar]
- Rekling JC, Feldman JL (1998) PreBötzinger complex and pacemaker neurons: hypothesized site and kernel for respiratory rhythm generation. Annu Rev Physiol 60: 385-405. [DOI] [PubMed] [Google Scholar]
- Rybak IA, Ptak K, Shevtsova NA, McCrimmon DR (2003) Sodium currents in neurons from the rostroventrolateral medulla of the rat. J Neurophysiol 90: 1635-1642. [DOI] [PubMed] [Google Scholar]
- Sah P, Gibb AJ, Gage PW (1988) The sodium current underlying action potentials in guinea pig hippocampal CA1 neurons. J Gen Physiol 91: 373-398. [DOI] [PMC free article] [PubMed] [Google Scholar]
- Schwindt PC, Crill WE (1995) Amplification of synaptic current by persistent sodium conductance in apical dendrite of neocortical neurons. J Neurophysiol 74: 2220-2224. [DOI] [PubMed] [Google Scholar]
- Smith JC, Ellenberger HH, Ballanyi K, Richter DW, Feldman JL (1991) PreBötzinger complex: a brainstem region that may generate respiratory rhythm in mammals. Science 254: 726-729. [DOI] [PMC free article] [PubMed] [Google Scholar]
- Smith JC, Butera RJ, Koshiya N, Del Negro C, Wilson CG, Johnson SM (2000) Respiratory rhythm generation in neonatal and adult mammals: the hybrid pacemaker-network model. Respir Physiol 122: 131-147. [DOI] [PubMed] [Google Scholar]
- Smith MR, Smith RD, Plummer NW, Meisler MH, Goldin AL (1998) Functional analysis of the mouse Scn8a sodium channel. J Neurosci 18: 6093-6102. [DOI] [PMC free article] [PubMed] [Google Scholar]
- Solomon IC, Edelman NH, Neubauer JA (1999) Patterns of phrenic motor output evoked by chemical stimulation of neurons located in the preBötzinger complex in vivo. J Neurophysiol 81: 1150-1161. [DOI] [PubMed] [Google Scholar]
- Song JH, Huang CS, Nagata K, Yeh JZ, Narahashi T (1997) Differential action of riluzole on tetrodotoxin-sensitive and tetrodotoxin-resistant sodium channels J Pharmacol Exp Ther 282: 707-714. [PubMed] [Google Scholar]
- St. John WM, Paton JF (2000) Characterizations of eupnea, apneusis and gasping in a perfused rat preparation. Respir Physiol 123: 201-213. [DOI] [PubMed] [Google Scholar]
- St. John WM, Paton JF (2002) Neurogenesis of gasping does not require inhibitory transmission using GABAA or glycine receptors. Respir Physiol Neurobiol 132: 265-277. [DOI] [PubMed] [Google Scholar]
- Stuart G, Sakmann B (1995) Amplification of EPSPs by axosomatic sodium channels in neocortical pyramidal neurons. Neuron 15: 1065-1076. [DOI] [PubMed] [Google Scholar]
- Taddese A, Bean BP (2002) Subthreshold sodium current from rapidly inactivating sodium channels drives spontaneous firing of tuberomammillary neurons. Neuron 33: 587-600. [DOI] [PubMed] [Google Scholar]
- Thoby-Brisson M, Ramirez JM (2001) Identification of two types of inspiratory pacemaker neurons in the isolated respiratory neural network of mice. J Neurophysiol 86: 104-112. [DOI] [PubMed] [Google Scholar]
- Tukey JW (1977) Exploratory data analysis. Menlo Park, CA: Addison-Wesley.
- Urbani A, Belluzzi O (2000) Riluzole inhibits the persistent sodium current in mammalian CNS neurons. Eur J Neurosci 12: 3567-3574. [DOI] [PubMed] [Google Scholar]
- Vega-Saenz de Miera EC, Rudy B, Sugimori M, Llinàs R (1997) Molecular characterization of the sodium channel subunits expressed in mammalian cerebellar Purkinje cells. Proc Natl Acad Sci USA 94: 7059-7064. [DOI] [PMC free article] [PubMed] [Google Scholar]
- Wang H, Germanson TP, Guyenet PG (2002) Depressor and tachypneic responses to chemical stimulation of the ventral respiratory group are reduced by ablation of neurokinin-1 receptor-expressing neurons. J Neurosci 22: 3755-3764. [DOI] [PMC free article] [PubMed] [Google Scholar]
- Wessendorf MW (1991) Fluoro-gold: composition, and mechanism of uptake. Brain Res 553: 135-148. [DOI] [PubMed] [Google Scholar]