

Abstract
Functional magnetic resonance imaging in awake monkeys and humans was used to compare object adaptation in shape-sensitive regions of these two species under identical and different size conditions. Object adaptation was similar in humans and monkeys under both conditions. Neither species showed complete size invariance, in agreement with single-cell studies. Both the macaque inferotemporal (IT) complex and human lateral occipital complex (LOC) displayed an anteroposterior gradient in object adaptation and size invariance, with the more anterior regions being more adaptable and size invariant. The results provide additional evidence for the homology between the macaque IT cortex and human LOC but also add to the growing list of differences between human and monkey intraparietal sulcus regions.
Keywords: functional imaging, object adaptation, size invariance, vision, cerebral cortex, human and macaque
Introduction
It is well established that magnetic resonance (MR) signals decrease in the human lateral occipital complex (LOC) after repeated presentations of images of shapes or objects (Buckner et al., 1998; Grill-Spector et al., 1999; Kourtzi and Kanwisher, 2001). This sort of adaptation has been related to the decrease in the responses of macaque inferotemporal (IT) neurons after repeated stimulation (Brown et al., 1987; Rolls et al., 1989; Riches et al., 1991; Miller et al., 1993). In proposing such a relationship, one is making three assumptions: (1) the functional magnetic resonance imaging (fMRI) signals reflect neural responses; (2) the human LOC and monkey IT cortex are homologous; and (3) neural adaptation is similar in both species. The first assumption has been tested directly (Logothetis et al., 2001; Kim et al., 2004) and indirectly (Lauritzen, 2001; Heeger and Ress, 2002; Kim and Ogawa, 2002; Devor et al., 2003) with some success. There is also reasonable evidence that the second assumption holds (Tootell et al., 1996; Grill-Spector et al., 1998; Tsao et al., 2003; Denys et al., 2004a). The third assumption, however, has not yet been tested systematically (Tootell et al., 2003). Therefore, the first aim of the present experiments was to compare fMRI adaptation (i.e., neural adaptation captured by fMRI) in the human LOC and monkey IT complex.
The importance of fMRI adaptation derives mainly from suggestions that it can serve as a tool for assessing neuronal selectivity (Tootell et al., 1998; Grill-Spector and Malach, 2001; Avidan et al., 2002; Kourtzi et al., 2003) or neuronal invariance in humans (Grill-Spector et al., 1999; James et al., 2002; Vuilleumier et al., 2002). In particular, it has been suggested that LOC adaptation for object images is size invariant (Grill-Spector et al., 1999). This is surprising because most single-cell macaque IT studies have reported size-invariant responses to shapes in only a fraction of the neurons (Schwartz et al., 1983; Miyashita and Chang, 1988; Lueschow et al., 1994). Therefore, the second aim of this study was to quantify the size invariance of fMRI adaptation in the IT cortex and human LOC. It is noteworthy that fMRI measures size invariance in terms of neuronal response levels, whereas most single-cell studies have reported size invariance of stimulus selectivity.
It has been established that shape is processed in the ventral temporal cortex of both monkeys and humans (Gross et al., 1972; Desimone et al., 1984; Malach et al., 1995; Grill-Spector et al., 1998; Kourtzi and Kanwisher, 2000). Recently, however, it has been suggested that the dorsal parietal cortex is also involved in shape processing in both species (Kraut et al., 1997; Sereno and Maunsell, 1998; James et al., 2002; Denys et al., 2004a) and that ventral and dorsal human shape processing regions differ in degree of stimulus invariance (James et al., 2002). Therefore, a third aim was to evaluate the regional variation of object adaptation and size invariance in both humans and monkeys.
To address these questions, we used fMRI in both humans (Belliveau et al., 1991) and awake monkeys (Vanduffel et al., 2001). We used an adaptation procedure similar to that of Grill-Spector et al. (1999) but tested for size invariance by varying size in fixed steps over a fourfold range.
Materials and Methods
Subjects
Eleven right-handed human subjects (six males and five females; age, 18-32 years old) participated in the present experiments. Six subjects participated in the adaptation experiment, and nine subjects participated in the size invariance experiment, with four subjects taking part in both experiments. All subjects had normal or corrected to normal vision, had no history of neurological or psychiatric disease, and were drug free. The study was approved by the Ethical Committee of the K.U. Leuven Medical School, and subjects gave their written informed consent, in accordance with the Helsinki Declaration. Human subjects viewed the stimuli through a mirror tilted at 45° that was attached to the head coil. Subjects were immobilized using an individually molded bite-bar. They were instructed to maintain fixation on a small red target (0.35 × 0.35°) in the center of the screen. Fixation was monitored during all of the experiments using an MR-compatible infrared eye movement tracking device (Ober 2; Permobil Meditech, Timrȧ, Sweden).
Three male rhesus monkeys (M1, M5, and M7; Macaca mulatta) also served as subjects. All animal care and experimental procedures met the national and European guidelines and were approved by the Ethical Committee of the K.U. Leuven Medical School. The details of the surgical procedures, training of monkeys, image acquisition, eye monitoring, and statistical analysis of monkey scans have been described previously (Vanduffel et al., 2001; Fize et al., 2003; Denys et al., 2004a) and will be described only briefly. The monkey subjects sat in a sphinx position in a plastic monkey chair directly facing the screen. During training, they were required to maintain fixation within a 2 × 2° window centered on a red mark (0.35 × 0.35°) in the middle of the screen. Eye position was monitored through the pupil position and corneal reflection (RK-726PCI; Iscan, Cambridge, MA). During scanning, the fixation window was slightly elongated in a vertical direction to 3°, to accommodate an occasional artifact on the vertical eye trace induced by the scanning sequence.
Before each monkey scanning session, a contrast agent, monocrystalline iron oxide nanoparticle (MION), was injected into the femoral or external saphenous vein (4-11 mg/kg). Use of the contrast agent improved the contrast/noise ratio (by approximately fivefold) and the spatial selectivity of the MR signal changes compared with blood oxygenation level-dependent (BOLD) measurements (Vanduffel et al., 2001; Leite et al., 2002). Whereas BOLD measurements depend on three hemodynamic variables (blood flow, blood volume, and oxygenation level), MION measurements depend only on blood volume. For the sake of clarity, the polarity of the MION MR signal changes, which are opposite to those of BOLD measurements, were inverted.
Stimuli
Stimuli were projected by means of a liquid crystal display projector (Barco Reality 6300; 1280 × 1024 pixels for monkeys, 1024 × 768 pixels for humans; 60 Hz) onto a translucent screen, positioned in the bore of the magnet at 28 cm from the human's eyes (54 cm for monkeys). The experiments used block designs with the presentation order of the conditions randomized between different time series.
Object adaptation experiment. In the object adaptation experiment, the visual stimuli (Fig. 1) were γ-corrected, grayscale images of isolated objects (average, ∼4.6 × 4.6°), mostly man-made, on a gray background in a 7 × 7° frame [selected and modified from Rossion and Pourtois (2004); courtesy of M. J. Tarr, Brown University, Providence, RI) and phase-scrambled versions of these images. Phase scrambling was used because this method conserves the Fourier power spectrum. The images of objects were presented for 600 ms, followed by a blank (empty background) for 520 ms. The adaptation experiment included six experimental conditions: repetitions of the object images 1, 4, 8, and 32 times (with the order of images randomized in each block), phase-scrambled images (Fig. 1 A), and no stimulus (fixation target on empty background). Each condition lasted 36 s, corresponding to 12 functional volumes in humans (15 for monkeys). Because conditions were repeated once in a time series (or run), 24 images (30 for monkeys) were sampled per condition, and 144 functional images (180 for monkeys) were sampled per run.
Figure 1.

Examples of stimuli used in the adaptation experiment (A) and size invariance experiment (B). Stimuli are drawn to scale.
One hundred thirty-five object images were selected from the Rossion and Pourtois (2004) database and divided into three groups of 45 object images. To exclude the possibility of a right-left bias in the stimuli, those 135 images were flipped about the vertical axis and again divided into three groups. In total, six different stimuli sets (three times original/flipped) of 45 images were prepared. These different sets were used in different runs, and each set was divided over the different conditions within a run in the same manner as described by Grill-Spector et al. (1999). Thirty-two object images appeared once (“32-object” condition) in a 36 s epoch, a set of 8 object images appeared four times (“8-object” condition), a set of 4 objects appeared eight times (“4-object” condition), one identical image appeared 32 times (“identical” condition), and 32 different phase-scrambled versions of the 32 object images appeared once (“phase-scramble” condition). Thus, different object images were used in each of the different conditions of a run. Care was taken so that in epochs with different objects, no stimulus was shown twice in a row, without intervening stimuli. A cycle of six runs corresponds to the six different stimulus sets. This cycle was repeated six times for the monkeys and for two of the human subjects, each time with a new random selection of 45 images from the original set of 135 images. With four human subjects, only nine runs were sampled, corresponding to the runs of the first cycle and the first half of the second cycle used in monkeys. Thus, across groups of monkey and human subjects, the frequency of presentation of individual object images in the different conditions was very similar.
Size adaptation experiment. Stimuli in the size adaptation experiment consisted of grayscale images of objects similar to those in the adaptation experiment, but presented in a 14 × 14° frame (Fig. 1 B). Object images, different from those used in the first experiment, were again drawn from the modified Snoddgrass and Vanderwart image set prepared by Rossion and Pourtois (2004). These images were very carefully selected so that image details, such as texture, visible in any given image remained visible in all sizes presented. Five different grayscale objects were rendered at five different sizes in logarithmic steps: 2.3 × 2.3, 3.2 × 3.2, 4.6 × 4.6, 6.4 × 6.4, and 9.2 × 9.2 visual degrees (Fig. 1 B), yielding a total of 25 images. The stimuli were presented for 800 ms, followed by a blank (empty background) of 700 ms. The test included four conditions: one object at a fixed size (identical or “same size”), the same object at five different sizes (“different sizes”), five different objects at the same size (“different objects”), and five phase-scrambled images, created from the images of the largest object size (9.2 × 9.2 visual degree). The epoch duration was 48 s, corresponding to 16 volumes per epoch in humans and 20 in the monkey. Each of the four conditions was repeated once in a time series (runs), and 128 functional volumes (160 for monkeys) were collected per run. In this experiment, one cycle included 25 such time series (or runs), because only one of the 25 images of the set could be presented in the identical conditions of any given run. By repeating the stimuli from the other conditions in 5 of the 25 runs, stimulus frequency was equated in the identical, different size, and different object conditions of a cycle. All possible sequence orders of four different conditions yield 24 different sequences, each of which was used once in the cycle of 25 time series, with the 25th sequence being the same as 19th sequence.
For each of the three monkeys, the 25 run cycle was repeated three times with different sets of object images, but within each of the three scanning sessions, runs from the three cycles alternated. Each of the nine human subjects was tested with only 25 runs, divided over three scanning sessions, but runs were alternated in the three different cycles, so that three humans were presented with the same total stimuli (presented in 75 runs) as a single monkey. Thus, the same three sets of stimuli were presented the same number of times to the groups of subjects of both species.
Motion localizer and LOC localizer tests were performed on all of the human subjects. For the LOC localizer scans, we used grayscale images (12 × 12 visual degrees) of familiar and nonfamiliar objects as well as scrambled versions of each set (Kourtzi and Kanwisher, 2000; Denys et al., 2004a). Motion localizer scans contrasted a moving with a static random texture pattern [7° diameter (Sunaert et al., 1999)]. Similar tests were also performed on the three monkeys, as described by Denys et al. (2004a) and Vanduffel et al. (2001). In these monkeys, retinotopic organization was charted in previous experiments (Fize et al., 2003). In human subjects, no retinotopic mapping was performed, but the identification of V3A as a shape-sensitive region was validated in the previous study by Denys et al. (2004a). Therefore, in the present study, we identified V3A indirectly, by the coordinates of its shape and motion response.
Tasks
Most experiments were performed under conditions of passive fixation. Humans made a few saccades during scanning (seven per block, on average, in the object adaptation and size adaptation experiments), but the number of saccades (>1.5° amplitude) did not differ significantly among conditions in the object adaptation experiment (one-way ANOVA; p > 0.5) or in the size adaptation experiment (one-way ANOVA; p > 0.8). In both monkey experiments, the runs in which monkeys fixated for <80% of the time were aborted and scanned again using that stimuli set in the next scanning session. Therefore, the percentage of fixation exceeded 80% in all of the runs completed, and all completed runs were analyzed. All three monkeys spent ≥90% of the run in the fixation window: M1 spent, on average, 98 and 99% of the time in the fixation window in the adaptation and size experiments, respectively; M5 spent, on average, 90% of the time in both experiments; and M7 spent, on average, 96 and 97% of the time in the adaptation and size experiments, respectively.
Four human subjects and all three monkeys also performed a high-acuity task (Vanduffel et al., 2001) while being scanned in the object adaptation experiment. They were required to interrupt an infrared beam with one hand (monkeys) or the index finger (humans) when a small (0.45 × 0.15°) green bar, presented in the center of the screen, changed orientation from horizontal to vertical. The order of testing for the passive and active conditions alternated between subjects. In these initial control experiments, the bar size was adjusted in such a way that performance levels were high, averaging 90% in humans and 93% in monkeys. To demonstrate that attention could be controlled by this paradigm, we systematized our informal observations that the bar size allowed us to control the difficulty of the acuity task and hence the attention subjects were allocating to the central bar. In four human subjects and one monkey subject (M5), tested in the scanning conditions, we were able to show that performance level, in terms of percentage of correct detection, decreased significantly with decreasing bar size in both species (repeated-measures ANOVA; p < 10-8 in monkeys; p < 10-4 in humans) (Fig. 2). Reaction times increased significantly with decreasing bar size in the monkey (ANOVA; p < 10-8) but not in humans (Fig. 2). These data allowed us to select a bar size for which performance would be a sensitive indicator of the subjects' attentional state. Two of the four human subjects as well as monkey M5 were therefore rescanned in the object adaptation experiment while performing the acuity task with a bar size of 0.20 × 0.05°.
Figure 2.

Psychophysical testing in the scanner of the acuity tasks in monkey subject M5 (A, B) and four human subjects (C, D). A, C, Percentage correct as a function of bar size. B, D, Reaction time as a function of bar size. Error bars indicate SE across trials in A and B and SD across subjects in C and D. Asterisks indicate significant differences on post hoc testing (Bonferroni's test; p < 0.05); in A, the smallest size was significantly different from all other sizes.
Data collection
The data were collected with a 1.5 T MR scanner (Sonata; Siemens, Erlangen, Germany). Each functional volume consisted of gradient-echo-planar whole-brain images [repetition time (TR), 3.01 s in humans (2.4 s in monkey); echo time (TE), 50 ms in humans (27 ms in monkeys); flip angle, 90°; 64 × 64 matrix; 32 sagittal slices (3 × 3 × 4.5 mm in humans, 2 × 2 × 2 mm in monkeys)]. In total, 81,360 functional volumes were sampled in monkeys and 51,976 volumes were sampled in humans. For each subject, a high-resolution anatomical image (3D-MPRAGE) was acquired (TR, 1950 ms; TE, 3.9 ms; inversion time, 800 ms; 240 × 256 matrix; 1 ×1 ×1 mm voxels; 160 sagittal slices).
Data analysis
Human data were analyzed with SPM99 software (Wellcome Department of Cognitive Neurology, London, UK). Preprocessing steps included realignment, coregistration of the anatomical images to the functional scans, and spatial normalization into a standard space. The functional volumes were subsampled to 3 × 3 × 3 mm for the group analysis and 2 × 2 × 2 mm for the single-subject analysis and spatially smoothed with a Gaussian kernel [full-width at half-height (FWHH) for group analysis, 8 mm; FWHH for single-subject analysis, 6 mm] before statistical analysis. A fixed-effects analysis was performed on the group data of the adaptation experiment. The small number of subjects and the need to use similar analysis in both species prevented us from using random-effects analysis in humans. Also, single-subject analyses were performed for the comparisons across tasks and number of runs. The amount of data collected in the size invariance experiment exceeded software (Matlab) limitations in attempts to perform a group analysis. Therefore, the data were divided into six sets (four runs of each subject), each of which was analyzed as a subgroup. Runs were selected in such a way that the number of runs per subjects, per scanning session, and per time series cycle and the stimulus sizes in the identical condition were equalized among the six subgroups.
Monkey data were analyzed using the SPM99 and Match software. In these analyses, eye movement parameters and, in the size invariance experiment, realignment parameters were included as covariates of no interest to remove eye movement and brain motion artifacts. The monkey functional volumes were realigned and non-rigidly coregistered with the anatomy of M3 as a template in the group and single-subject analyses using a customized volume-based registration algorithm, implemented in the Match software (Chef d'Hotel et al., 2002). The algorithm computed a dense deformation field by composing small displacements minimizing a local correlation criterion. Regularization of the deformation field was obtained by low-pass filtering. The monkey functional volumes were then subsampled to 1 mm3 and smoothed with an isotropic Gaussian kernel (FWHH, 1.5 mm). Each stimulus epoch was represented as a box-car model convoluted by the MION response function as defined by Vanduffel et al. (2001). The same analyses were performed as in humans: fixed-effects group analysis of the adaptation experiment (first half of the data), single-subject analysis for the comparison between passive fixation and high-acuity task, and subgroup analysis of the size invariance experiment. In this latter analysis, exactly the same partition into six subgroups was used as in humans, but here each subgroup included 12 runs per subject.
The threshold of the t-score maps was set at p < 0.05 corrected for multiple comparisons, corresponding to a t score >4.89 for group analyses in monkeys (>4.69 in humans). In the single-subject and subgroup analyses, p < 0.001 uncorrected for multiple comparisons was used as threshold. The t-score maps were combined and projected onto the flattened cortical reconstruction (at the level of layer 4) of the monkey brain of M3 using the Freesurfer software. This program was also used to project the human t-score maps onto the flattened average brain of the nine subjects participating in the size invariance experiment.
Activity profiles plotting MR signal change relative to the fixation condition were obtained for a number of functional regions from the group analyses (object adaptation experiment). In the case of subgroup analyses (size adaptation experiment), profiles from the six subgroups were averaged and SDs were calculated. We considered the presumptive shape-related regions in each species as defined by Denys et al. (2004a). Activity profiles were calculated for a small region of interest (ROI) surrounding the local maximum of a shape-sensitive region and defined by the most significant voxel in the subtraction intact shapes (average of the identical, 4-object, 8-object, and 32-object conditions) minus the phase-scramble (adaptation experiment) and six of its neighboring voxels in both hemispheres (Tables 1, 2).
Table 1.
Statistical analysis in shape-sensitive regions of monkeys
|
|
|
|
|
Adaptation experiment |
Size experiment |
||||||||||||||
|---|---|---|---|---|---|---|---|---|---|---|---|---|---|---|---|---|---|---|---|
| 32 versus 1 |
8 versus 1 |
4 versus 1 |
DO versus SS |
DO versus DS |
DS versus SS |
||||||||||||||
| Region |
|
Coordinates (x,y,z)
|
t scores |
# subj |
t scores |
# subj |
t scores |
# subj |
# subgr |
# subgr |
# subgr |
||||||||
| 1 | V4v | L | (−23, −6, 15) | 13.24 | 3 | 9.47 | 3 | 6.85 | 3 | 4 | 2 | 2 | |||||||
| R | (23, −6, 14) | 12.88 | 3 | 5.73 | 3 | 3.35 | 2 | 1 | 1 | 0 | |||||||||
| 2 | V4d | L | (−26, −5, 18) | 13.54 | 3 | 9.4 | 3 | 6.14 | 2 | 3 | 1 | 3 | |||||||
| R | (28, −3, 18) | 17.39 | 3 | 11.68 | 3 | 9.29 | 3 | 5 | 3 | 3 | |||||||||
| 3 | TEO | L | (−27, 0, 14) | 17.18 | 3 | 14.34 | 3 | 9.83 | 3 | 6 | 4 | 5 | |||||||
| R | (27, 2, 15) | 16.91 | 3 | 11.17 | 3 | 8.57 | 3 | 6 | 4 | 5 | |||||||||
| 4 | TEdp | L | (−24, 5, 7) | 10.75 | 3 | 7.67 | 3 | 5.53 | 3 | 4 | 2 | 3 | |||||||
| R | (27, 5, 10) | 10.76 | 3 | 7.37 | 3 | 6.28 | 2 | 6 | 4 | 4 | |||||||||
| 5 | TEvp | L | (−23, 8, 3) | 8.64 | 3 | 4.28 | 3 | 3.42 | 2 | 6 | 3 | 3 | |||||||
| R | (24, 12, 6) | 8.7 | 3 | 6.6 | 3 | 3.41 | 3 | 6 | 3 | 2 | |||||||||
| 6 | TEda | L | (−17, 18, −1) | 5.84 | 3 | 4.83 | 3 | 3.47 | 2 | 5 | 5 | 4 | |||||||
| R | (20, 18, 3) | 9.93 | 3 | 4.89 | 2 | 4.94 | 2 | 6 | 3 | 3 | |||||||||
| 7 | LIP | L | (−14, −2, 30) | 9.04 | 3 | 5.16 | 3 | 5.17 | 3 | 5 | 3 | 1 | |||||||
| R | (16, 1, 27) | 8.4 | 3 | 4.92 | 3 | 3.83 | 2 | 6 | 3 | 2 | |||||||||
| irAS | L | (−20, 23, 24) | 10.22 | 3 | 3.39 | 2 | 3.92 | 2 | 3 | 1 | 1 | ||||||||
| R | (17, 24, 25) | 15.04 | 3 | 8.02 | 3 | 5.69 | 3 | 5 | 2 | 3 | |||||||||
|
|
PS |
R |
(15, 33, 24) |
7.34
|
3 |
5.88
|
2 |
3.21 |
1 |
4 |
2 |
5 |
|||||||
Bold values indicate t scores at p > 0.05 corrected. # subj, Number of single subjects (of 3) reaching p < 0.001 uncorrected; # subgr, number of subgroups (of 6) reaching p < 0.001 uncorrected; DO, different objects; DS, different size; SS, same size; V4d, V4 dorsal; V4v, V4 ventral.
Table 2.
Statistical analysis in shape-sensitive regions of humans
|
|
|
|
|
Adaptation experiment |
Size experiment |
||||||||||||||
|---|---|---|---|---|---|---|---|---|---|---|---|---|---|---|---|---|---|---|---|
| 32 versus 1 |
8 versus 1 |
4 versus 1 |
DO versus SS |
DO versus DS |
DS Versus SS |
||||||||||||||
| Region |
Coordinates (x,y,z) | t scores | # subj | t scores | # subj | t scores | # subj | # subgr | # subgr | # subgr | |||||||||
| 1 | midFG | L | (−33, −42, −21) | 15.9 | 5 | 11.25 | 5 | 6.91 | 5 | 6 | 5 | 2 | |||||||
| R | (36, −45, −24) | 20.65 | 6 | 14 | 5 | 7.36 | 5 | 6 | 5 | 5 | |||||||||
| 2 | postITG | L | (−45, −78, −6) | 15.33 | 6 | 9.3 | 5 | 7.11 | 5 | 6 | 3 | 4 | |||||||
| R | (45, −66, −12) | 19.33 | 6 | 11.87 | 5 | 6.59 | 5 | 6 | 5 | 6 | |||||||||
| 3 | LOS | L | (−45, −78, 9) | 6.79 | 5 | 6.67 | 5 | 3.24 | 5 | 6 | 1 | 3 | |||||||
| R | (42, −84, 0) | 15.27 | 6 | 10.14 | 5 | 5.59 | 4 | 5 | 3 | 3 | |||||||||
| 4 | V3A | L | (−33, −87, 21) | 9.02 | 5 | 4.72 | 4 | 3.32 | 3 | — | — | — | |||||||
| R | (30, −87, 12) | 8.07 | 5 | 5.04 | 2 | 3.18 | 2 | — | — | — | |||||||||
| 5 | VIPS | L | (−27, −75, 36) | 6.24 | 4 | 5.27 | 3 | 3.84 | 2 | 5 | — | 3 | |||||||
| R | (27, −69, 36) | 8.99 | 5 | 6.22 | 4 | 3.13 | 2 | 3 | — | 4 | |||||||||
| 6 | DIPSMs | L | (−21, −63, 63) | 7.14 | 3 | 5.25 | 3 | 4.98 | 3 | 3 | 1 | 3 | |||||||
| R | (30, −60, 60) | 7.58 | 4 | 5.34 | 3 | 3.52 | 2 | 1 | — | 5 | |||||||||
| 7 | DIPSAs | L | (−39, −48, 57) | 5.21 | 3 | 3.55 | 2 | 3.34 | 2 | 4 | 1 | 4 | |||||||
|
|
|
R |
(36, −51, 60) |
5.27
|
3 |
3.5 |
3 |
3.29 |
3 |
3 |
— |
3 |
|||||||
Bold values indicate t scores at p > 0.05 corrected. # subj, Number of single subjects (of 6) reaching p < 0.001 uncorrected; # subgr, number of subgroups (of 6) reaching p < 0.001 uncorrected; DO, different objects; DS, different size; SS, same size.
Two indices were derived from the activity profiles. The object adaptation index (AI) was calculated as follows: (%MR signal change in 32-object epochs - %MR signal change in identical epochs)/%MR signal change in 32-object epochs. The %MR signal change is defined relative to the fixation-only conditions. The index ranges from 0 to 1, with 1 indicating complete adaptation and 0 indicating no adaptation at all. The size invariance index (SI) was calculated as follows: (%MR signal change in different sizes epochs - %MR signal change in identical epochs)/(%MR signal change in different objects epochs - %MR signal change in identical epochs). According to this formula, an index of 1 indicates no size invariance, whereas an index of 0 corresponds to complete size invariance. Note that this index does not depend on the baseline condition, here scrambled condition, from which the percentage of signal change is defined. Note also that this index requires the adaptation to be large enough to obtain reliable values. To meet this condition, we introduced two arbitrary criteria: the difference between the percentage of MR signal change in the different objects and identical epochs has to exceed 0.1% of the MR signal in the scrambled condition in monkeys (0.03% in humans, given the difference between MION and BOLD signals) and 20% of the signal change between different objects and scrambled conditions.
The percentage of overlap between two activation patterns was calculated as the ratio of the intersection over the union of activated regions. These intersections and unions were outlined on the Freesurfer maps, but the calculation was based on the number of voxels in the native three-dimensional volume, given the distortions of cortical surface introduced by the flattening. Therefore, the percentage of overlap calculated this way may not always correspond to the visual impression derived from inspection of the flatmaps.
Results
Object adaptation-sensitive regions in monkeys and humans
Object adaptation-sensitive regions were defined as those showing significantly (p < 0.05; corrected) larger activation for viewing 32-object stimuli compared with viewing identical object stimuli (Fig. 3A). These regions, obtained in the group analysis of the three monkeys, were superimposed onto the flatmaps of the posterior parts of both hemispheres and are displayed as a colored (yellow to red) map in Figure 4. The black solid lines indicate the borders of the “object shape-sensitive” regions defined as regions significantly (p < 0.05; corrected) more activated by the object stimuli than by their phase-scrambled counterparts (i.e., regions showing a significant scrambling effect). In both hemispheres, the object adaptation-sensitive regions and shape-sensitive regions overlap to a great extent. The overlap averaged (over hemispheres) 71% in the occipital and temporal part of the activation (numbers 1-6) and 82% in the intraparietal sulcus (IPS) (number 7)
Figure 3.

Adaptation-sensitive regions. A, Statistical parametric map (group; n = 3) showing voxels significant (p < 0.05; corrected) in the subtraction 32-object condition minus identical condition superimposed on coronal sections of M3's brain through the local maxima of TEdp (top) and LIP (arrows; bottom). B, Activity profiles (group; n = 3) plotting MR signal changes compared with the fixation condition in the scrambled (S), identical (1), 4-object (4), 8-object (8), and 32-object (32) conditions of left and right TEdp and LIP. C, Activity profiles (group; n = 6) of the left and right midFG and DIPSAs regions. In A, y indicates the anteroposterior level compared with the interaural plane. In B and C, error bars indicate SEs, and the ratio (a - b)/a indicates the AI.
Figure 4.

Adaptation-sensitive regions in the monkey. A, B, Statistical parametric maps (group; n = 3) showing voxels significant (p < 0.05; corrected) in the subtraction 32-object minus identical condition superimposed on the posterior part of the flattened left (A) and right (B) hemisphere of M3. The borders of shape-sensitive regions [i.e., voxels significant (p < 0.05; corrected) in the subtractions intact vs scrambled images] obtained with the small grayscale images of the present experiment (black lines) and in the study by Denys et al. (2004a) (light blue lines) are shown. The numbers indicate the local maxima of shape-sensitive regions obtained with small grayscale stimuli (see Table 1). Black dotted lines and asterisks indicate the central visual field (1.5 eccentricity), and thick and dashed white lines indicate the projection of horizontal and vertical meridians. U and L, Upper and lower field, respectively (Fize et al., 2003).
Shape-sensitive regions were identified previously (Denys et al., 2004a) using a different stimulus set (Kourtzi and Kanwisher, 2000), and the borders of these regions are also shown in Figure 4 with light-blue lines. Shape processing regions obtained with the present grayscale object images, which were smaller in size (4.6 × 4.6°) than the Kourtzi and Kanwisher (2000) stimuli (15 × 15°), matched those obtained by Denys et al. (2004a) relatively well in the IT cortex (on average, 48% overlap). The most notable difference between the two experiments is a more extensive activation of the early regions in the present experiment, including dorsal and ventral V3 and V4, as well as small parts of V1/V2. Also, activation is fairly equal in the dorsal and ventral parts of V3 and V4 in the present experiment, whereas most V3 and V4 activation was located dorsally in the previous experiment. Such early-level activity probably reflects a reduced activation in these regions by the phase-scrambled stimuli that were used as control stimuli in the present experiment, compared with the mosaic scrambled stimuli of Kourtzi and Kanwisher (2000). Indeed the mosaic scrambled images of Kourtzi and Kanwisher (2000) conserved local edges, absent in the phase-scrambled stimuli. This view is supported by the scrambling effect documented by Rainer et al. (2002) in the near extrastriate areas of the anesthetized monkey. In contrast, the scrambling effect was larger in the IPS for the Kourtzi and Kanwisher (2000) stimuli than for the stimuli of the present experiment. Only an anterior region, located close to the central visual field representation in the lateral intraparietal region (LIP) (Fize et al., 2003), exhibited a scrambling effect with the present stimuli. For consistency with the previous study, we refer to this region as LIP, but given its location (Fig. 4), it may include a part of anterior intraparietal (AIP) (Luppino et al., 1999; Murata et al., 2000).
Because of the similarity of the two shape-related activation patterns, most shape-sensitive regions defined by Denys et al. (2004a) could also be identified with the present stimuli (Table 1), except for the region in the posterior IPS. Another exception was the middle superior temporal sulcus (STS) region for which no local maximum could be obtained, the activation being rather uniform over that part of the STS. In monkeys, object adaptation was observed in the prefrontal cortex, corresponding to the shape-related regions that have been reported previously in the prefrontal cortex of monkeys but not in humans (Denys et al., 2004b). In agreement with the latter study, shape-sensitive regions included the anterior bank of the inferior ramus of the arcuate sulcus (irAS) and the lateral bank of the principal sulcus (PS), at least in the right hemisphere (Table 1). As indicated in Table 1, the subtraction 32-object minus identical condition reached significance (p < 0.05; corrected for multiple comparisons) for the group in each of the shape-sensitive regions defined as described above. This subtraction reached p < 0.001 uncorrected in all three single subjects. In most of the single subjects, the subtractions in which the 8-object and 4-object conditions were compared with the identical condition also reached p < 0.001 uncorrected in these regions (Table 1).
Figure 5 illustrates human object adaptation-sensitive regions, obtained from the group-averaged results of six subjects and displayed on flatmaps of the posterior parts of the two hemispheres of the average brain of the nine subjects who participated in the size experiment. As was the case in the monkey, there is a good match between the regions showing object adaptation and the shape-sensitive regions (Fig. 5, black outlines) in humans, although the adaptation effect extended more medially in the ventral cortex (Fig. 5, green arrows). The overlap between the two sets of regions averaged 80% over hemispheres. Again, in agreement with what was observed in monkeys (see above), the shape-sensitive regions defined by the stimuli of the present experiment (Fig. 5, black outlines) and those defined by the Kourtzi and Kanwisher (2000) stimuli (Fig. 5, blue outlines) in these human subjects matched relatively well, especially in the LOC (on average, 75% overlap). The match was reduced in the human IPS, reminiscent of what we described above for monkeys. Compared with the shape-sensitive regions defined by Kourtzi and Kanwisher (2000) stimuli, the present stimuli produced more extensive activation in the anterior/dorsal IPS, whereas activation was somewhat reduced in the posterior/ventral IPS. The more peripheral, dorsal parts of area V3A (Fig. 5, black arrows) exhibited a scrambling effect for the Kourtzi and Kanwisher (2000) stimuli but not for the smaller stimuli of the present experiment. The reverse is true in small regions posterior to the lateral occipital sulcus (LOS) shape-sensitive region (Fig. 5, white arrows). Thus, except for the dorsal part of the human IPS (numbers 7 and 6), the scrambling effects overlap relatively well in humans.
Figure 5.

Adaptation-sensitive regions in humans. A, B, Statistical parametric maps (group; n = 6) showing voxels significant (p < 0.05; corrected) in the subtraction 32-object minus identical condition superimposed on the posterior part of the flattened left (A) and right (B) hemisphere of the average of nine brains. The borders of shape-sensitive regions [i.e., voxels significant (p < 0.05; corrected) in the subtractions intact vs scrambled images] obtained with the small grayscale images of the present experiment (black lines) and with the stimuli of Denys et al. (2004a) (light blue lines) are shown. The numbers indicate the local maxima of shape-sensitive regions obtained with small grayscale stimuli (see Table 2). The shape-sensitive regions (Denys et al., 2004a) include the following: mid FG (or LOa, 1); post ITG (or LO proper, 2); LOS, 3; V3A, human V3A, 4; VIPS, ventral IPS, 5; DIPSMs, 6; DIPSAs, 7. The white outlines indicate motion-sensitive voxels [significant in subtraction motion minus stationary at p < 0.05 corrected (solid lines) or p < 10-5 corrected (dotted lines)]. The black and white arrows point to regions differing in shape sensitivity in the present experiment compared with previous experiments (Denys et al., 2004a) (see Results). Green arrows, Voxels showing significant adaptation without significant shape sensitivity.
As a consequence of the similarity of scrambling effects with these two types of stimuli, local maxima could be defined with stimuli of the present experiment for all shape-sensitive regions described in humans by Denys et al. (2004a), with the exception of the parieto-occipital IPS (POIPS) region (Table 2). The subtraction 32-object minus identical condition reached significance (p < 0.05) for the group analysis in each of the shape-sensitive regions. The same subtraction also reached p < 0.001 uncorrected in these regions for most single subjects (Table 2).
From these results, we conclude that in both species, object adaptation was essentially confined to the shape-sensitive regions in both humans and monkeys.
Adaptation level in monkey and human shape-sensitive regions
Figure 3, B and C, displays the activity profiles occipito-temporal and IPS regions of the human and monkey. These profiles show that MR signals (relative to fixation condition) decrease regularly as a function of repetition rate (Tables 1, 2). Therefore, the effect of adaptation deepens as the repetition rate increases and maximum adaptation is reached for 100% repetition in the identical condition. This maximum is captured by the object AI. The activity profiles also show that the MR signals measured in shape-sensitive regions are stronger in the monkey than in humans, likely because of the use of a contrast agent [see Denys et al. (2004b) for discussion]. They also indicate that for the small grayscale stimuli used here, the parietal activation levels in both species are 60-70% less than those obtained in the ventral cortex (IT complex and LOC).
The values of the object AI in the shape-sensitive regions of monkeys and humans are compared in Figure 6. Using the fixation-only condition as the reference, as is standard in single-cell studies, the AI [ratio (a - b)/a in Fig. 3] ranges from 0.35 to 0.83 in monkeys, which is very similar to the human range of adaptation indices (0.45-0.87). In two humans, in which 36 runs were sampled, we verified that differences in the numbers of runs sampled had no significant effect on the AI values (Mann-Whitney U test; p > 0.4 comparing 9 and 36 runs).
Figure 6.
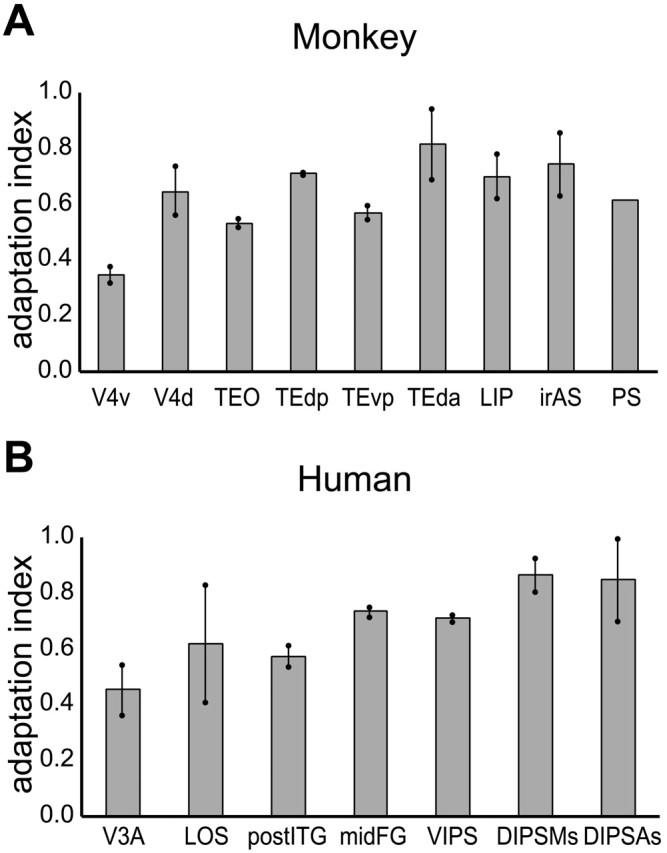
Object AI in shape-sensitive regions of monkey (group; n = 3; A) and human (group; n = 6; B). Dots connected by bars indicate the values of the left and right hemispheres (for PS-only right hemisphere). For coordinates of the different regions, see Tables 1 and 2. V3A, Human V3A; V4d, V4 dorsal; V4v, V4 ventral.
In both species, the AI values were relatively similar in the different regions, except for somewhat lower values in early regions (V4v in the monkey, V3A in humans). Notice that although adaptation indices were similar in the ventral and dorsal regions of both species, the subtractions comparing 32-object, 8-object, and 4-object conditions to identical conditions were more significant in ventral compared with dorsal shape-sensitive regions (Tables 1, 2).
To test for differences in the AI between monkeys and humans, we compared the four regions of the monkey IT complex [TEO, TE dorsal posterior (TEdp), TE ventral posterior (TEvp), and TE dorsal anterior (TEda)] with the two regions of the human LOC [post-inferior temporal gyrus (ITG) and middle fusiform gyrus (midFG)] and monkey LIP with the three human IPS regions [ventral IPS (VIPS), dorsal IPS medial shape part (DIPSMs), and dorsal IPS anterior shape part (DIPSAs)]. A two-way ANOVA on the single subject results with regional complexes (temporal, parietal) and species (monkey, human) as factors yielded no significant effects (regional complex, p > 0.3; species, p > 0.9; interaction, p > 0.05).
Adaptation levels in passive and task conditions
The AI was measured in three monkeys and four human subjects while the subjects were performing a demanding high-acuity task in central vision (Vanduffel et al., 2001). The aim was to equalize attention among conditions within and between species, because it could be argued that subjects pay less attention to repeated stimuli or that monkeys were more concerned by the fixation target and less concerned by the background stimuli than humans. Given the small number of subjects tested, single-subject analysis was performed, and Figure 7 plots the AI averaged over subjects, for both the passive fixation and active task conditions. In general, the indices obtained in these two conditions were very similar. The results shown in Figure 7 were analyzed with a repeated-measures ANOVA. The main effect of task was significant in neither monkeys nor humans (p > 0.75 in monkeys; p > 0.95 in humans), nor in the effect of region (p > 0.15 in monkeys and humans).
Figure 7.
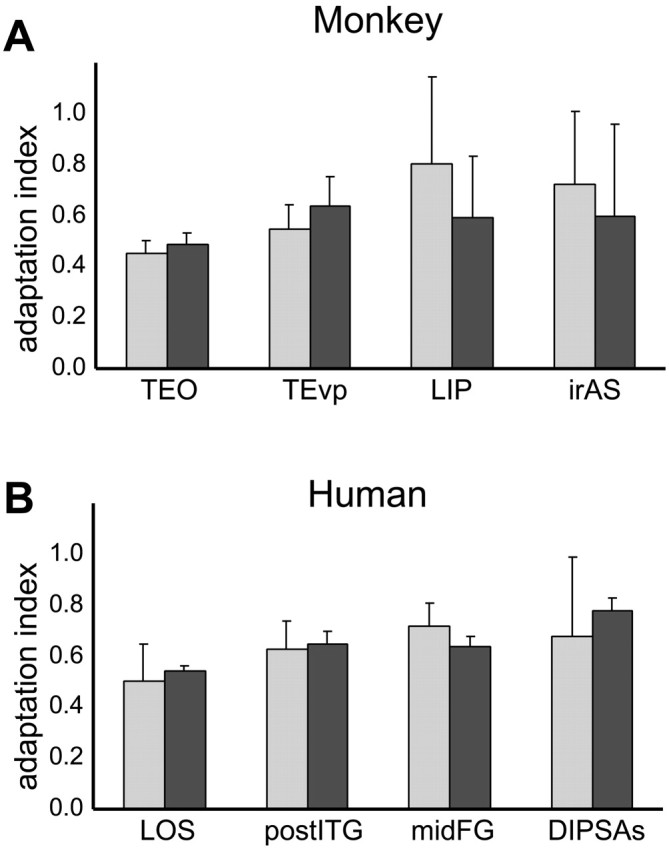
Object AI in passive fixation (light gray) and active task (dark gray) conditions in selected shape-sensitive regions of monkey (average of 3 single subjects; A) and human (average of 4 single subjects; B). Error bars indicate SDs across subjects.
Given the importance of controlling attention in adaptation experiments (Eger et al., 2004), we repeated the assessment of object adaptation while the subject performed the acuity task with a smaller bar size, assuming that the performance level and reaction time were sensitive indicators of the subjects' attentional state (see Materials and Methods). Rescanning of monkey M5 yielded AI values very similar to those in the initial, less controlled acuity task experiment (Fig. 8A). Yet, during rescanning, we observed close to 86% correct in all conditions and, although one-way ANOVA indicated differences in the percentage correct among conditions, post hoc testing (Bonferroni's test) revealed no significant differences among the conditions in which intact objects were shown (range, 86-88%). The reaction time was close to 550 ms in all conditions, except fixation-only, in which it was 25 ms shorter, probably because the small bar was easier to detect on an empty background. Post hoc testing revealed no significant differences among the five other conditions (range, 549-552 ms). For these three scanning sessions, we also quantified the time and the precise eye position within the fixation window. The percentage of fixation averaged 85% and, although one-way ANOVA revealed a significant effect of condition because of a poorer performance during fixation, post hoc testing revealed no significant differences among the five other conditions (range, 85-88%). The SD of the eye position averaged 0.56 and 0.75° in the horizontal and vertical directions, respectively. There were no significant differences in the mean and SD of vertical and horizontal eye position among the conditions in which stimuli were presented, although SDs were significantly larger for the fixation condition.
Figure 8.
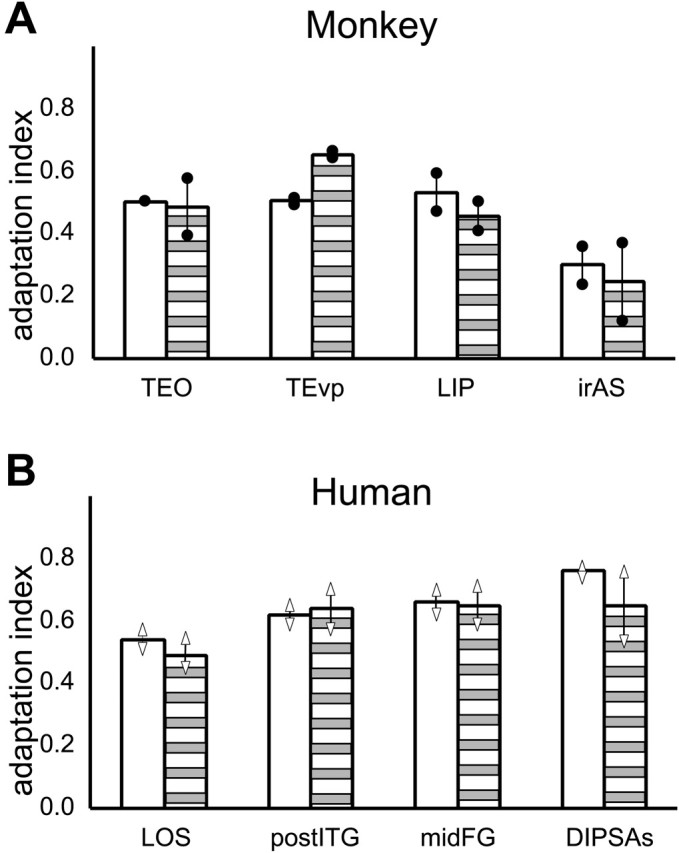
Adaptation indices of selected shape-sensitive regions in test (open bars) and retest (striped bars) of the acuity task of monkey M5 (A) and two human subjects (B). The dots connected by lines in A indicate values of the left and right hemispheres. Vertical bars connecting triangles in B indicate individual data.
Very similar results were obtained in the two human subjects retested with a smaller bar size. Again, AI values were very similar for the test and retest (Fig. 8B). There was no significant effect of condition on performance levels (one-way ANOVA; p > 0.10), and the average performance was close to 83% correct. Statistical testing with one-way ANOVA and post hoc Bonferroni's testing showed that reaction times did not differ significantly between conditions (range, 522-540 ms), except for the fixation only condition, in which the reaction time equaled 503 ms.
Thus, object adaptation was little affected when attention was drawn away from the object images, and attention to the central bar was equalized across conditions.
Size invariance of object AI in monkeys and humans
Because monkeys and humans show similar levels of object adaptation, and this adaptation is sizeable even for relative low numbers of repetition (Tables 1, 2), we can use object adaptation to compare the size invariance in the human and monkey brain. We verified that the difference between the different objects and identical conditions were significant in most of the six subgroup analyses of the size experiment in both species (Tables 1, 2). In the monkey, adaptation (assessed by the subtraction different objects minus identical) was significant (p < 0.001; uncorrected) in the shape-sensitive regions, except V3A, for the majority of subgroups, but most frequently so in the IT regions and LIP (Table 1). In humans, adaptation was also significant (p < 0.001; uncorrected) in the shape-sensitive regions for the majority of subgroups, but adaptation reached significance more frequently in the ventral shape-related regions (Table 2).
In the size invariance experiment, we compared MR activity in three conditions: viewing of different sizes of the same object, viewing the same size of a single object, and viewing different objects of a single size. If a brain region treats different sizes of an object as the same object (i.e., with complete size invariance), adaptation should be the same under the different sizes and same size conditions, and thus MR signals should be equal under those conditions. Thus, the SI [ratio (b - a)/(c - a) in Figure 9] will be zero. Alternatively, if a brain region treats different sizes of an object as different objects, with no size invariance, then no adaptation will be observed and MR signal will be the same in the different sizes and different objects conditions. In this case, the SI will equal 1. As shown in Figure 9, MR signals under changing size conditions usually fell between those of the same size and different objects conditions, in monkeys as well as in humans. Occasionally, the MR activity in the different sizes condition exceeded that in the different objects condition or fell below (data not shown) that in the same object condition. In these instances, SI was set to 1 or 0, respectively.
Figure 9.

Activity profiles (average of 6 subgroups) plotting MR signal changes compared with the scrambled condition in the same object, same size (SS), different size (DS), and different object (DO) conditions of the left and right TEdp and LIP (A) and of the left and right midFG and DIPSAs (B). Error bars indicate SDs. The ratio (b - a)/(c - a) indicates the SI.
In the monkey, the size invariance indices ranged between 0.35 and 0.60 (Fig. 10A). Thus, the activity in the different sizes condition was about halfway between that in the identical and different objects conditions. Indeed, the subtractions different objects minus different sizes and different sizes minus identical were approximately equally significant (Table 1). The differences between the ventral and dorsal regions were not significant (nested ANOVA comparing LIP to the four IT parts; p > 0.4).
Figure 10.
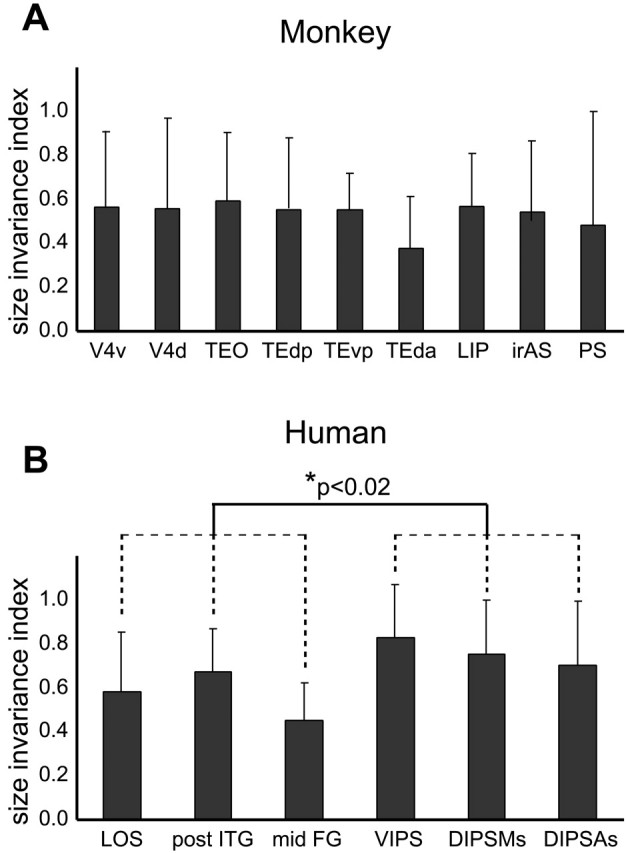
SI in shape-sensitive regions of monkey (A) and human (B) averaged over the six subgroups. Error bars indicate SDs. The difference between the three ventral and three dorsal shape-sensitive regions in humans was significant (nested ANOVA; p < 0.02). V4d, V4 dorsal; V4v, V4 ventral.
In humans, the size invariance indices were slightly larger than in the monkey, ranging between 0.4 and 0.85 (Fig. 10B). Consistent with these values, the subtraction different sizes minus identical condition reached significance more frequently than the subtraction different objects minus different sizes condition (Table 2). The size invariance indices were significantly lower in the three ventral compared with the three parietal shape-sensitive regions (nested ANOVA; p < 0.02), indicating that in humans the ventral shape-sensitive regions are more size invariant than their dorsal counterparts.
To test for species differences in size invariance indices, we compared (1) the four regions of the IT complex with the two regions of the LOC and (2) monkey LIP with the three human IPS regions. A two-way ANOVA with regional complexes (temporal, parietal) and species (monkey, human) as factors yielded no significant effects (regional complex, p > 0.1; species, p > 0.1; interaction, p > 0.25).
These results indicate that size invariance was by no means complete in either species. There are hints that invariance is somewhat reduced but slightly more differentiated in humans than in monkeys.
Path analysis of IT complex in monkeys
The IT complex is a large expanse of cortex, which is only partially represented by the four local maxima of shape sensitivity (Table 1) we used to describe the object adaptation and size invariance of this complex. Therefore, we performed a more detailed analysis of the IT complex by plotting the MR signals in the different conditions of the two experiments along paths parallel to the anteroposterior axis of the IT complex (Brewer et al., 2002; Rosano et al., 2002; Fize et al., 2003; Denys et al., 2004a). To define these three paths, we connected voxels in each of the successive coronal sections through the IT cortex. Starting from the V4/IT border, a first path (Fig. 11A, blue line) connected voxels located within the lower bank of the STS, at ∼4.5 mm from the lip of the STS. The two other paths (Fig. 11A, green and red lines) followed the dorsal part of the convexity of the IT cortex, running 3 and 8 mm below (lateral on the flatmap) the lip of the STS. These paths covered most of the object-related regions of the IT complex (Fig. 11A, thick black lines).
Figure 11.
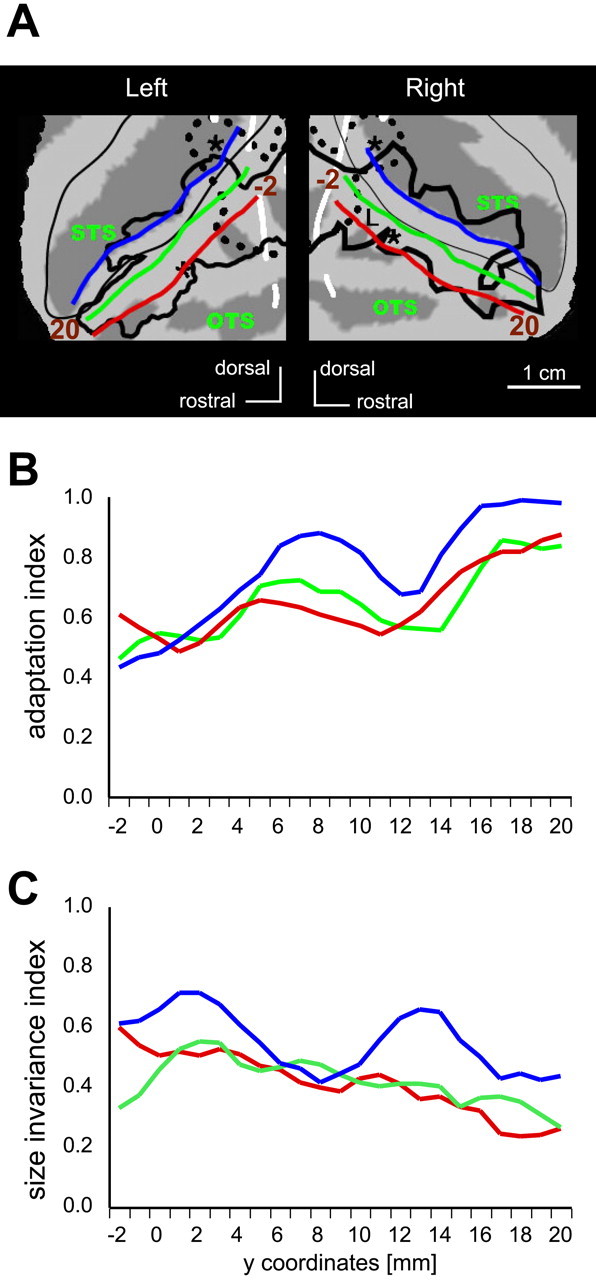
Detailed analysis of the IT complex. A, Parts of monkey flatmaps (see Fig. 4) showing the position of the three paths in the IT cortex: in the STS (blue) and on the dorsal convexity (green and red). Thin black outline, Lips of the STS; thick black lines, shape-sensitive regions, as in Figure 4, defined by the subtraction intact versus scrambled images. B, C, Plots of the AI (B) and SI (C) along the three paths, averaged for the two hemispheres. The endpoints of paths (-2, 20) are indicated in A. Values of the correlation between the AI and position were 0.83, 0.66, and 0.78 for paths along the STS, upper convexity, and lower convexity, respectively. The values of correlation between the SI and position were -0.51, -0.87, and -0.44 along the STS, upper convexity, and lower convexity, respectively. All six correlation coefficients were significant (p < 0.05).
Because we could measure the activity profiles in all voxels on these paths, we could plot the AI and SI derived from the two experiments along these paths. Smooth curves were obtained by taking running averages over three successive points. The AI and SI curves are plotted in Figure 11, B and C, respectively. Because there was no significant difference between the curves of the right and left hemispheres (two-way ANOVA with paths and hemispheres as factors, main effect of hemisphere; p > 0.7 in adaptation experiment 1; p > 0.85 in the size experiment), the curves were averaged over the hemispheres. Changes in the adaptation level and size invariance were very similar in the two paths along the convexity. Adaptation was stronger and the size invariance was weaker in the lower bank of the STS compared with the convexity. Indeed, the factor “path” had a significant effect (p < 0.001) in both experiments, and post hoc testing (Bonferroni's) revealed a significant difference between the STS and the two other paths (p < 0.01 in the adaptation experiment; p < 0.001 in the size experiment). Linear regression analysis showed that both the increase in the AI and the decrease in the SI at more anterior levels of the IT complex were significant (p < 0.05; for r values, see the legend to Fig. 11) along all three paths.
Detailed analysis of the human LOC
We performed a similar path analysis of the human LOC, which is even larger than the IT cortex and was only represented by two local maxima (Table 2) in the initial analysis. To date, no anatomical definition of the LOC is available; therefore, we defined the paths by straight lines on the flatmaps rather than in the sections, but nonetheless tried to follow anatomical landmarks (gyri and sulci) and to cover the whole shape-sensitive region (Fig. 12A). In humans, the LOC runs along an anterior posterior axis in the occipito-temporal sulcus (OTS) and neighboring gyri, the ITG laterally, and the fusiform gyrus medially (Kourtzi and Kanwisher, 2000; Denys et al., 2004a). Note that on the flatmaps, medial is toward the calcarine sulcus (back of the flatmap) and lateral is away from the calcarine (forward on the flatmap). To explore changes in object adaptation along the anteroposterior dimension of the LOC, we defined five paths running parallel to this axis and following approximately the ITG (black), the OTS (orange), the lateral FG (lFG; green), the medial FG (mFG; yellow), and collateral sulcus (purple). Consistent MR profiles were obtained in the voxels corresponding to all five paths in the right hemisphere and the three most lateral paths in the left hemisphere, starting (positions zero in Fig. 12A) from the posterior end of the post-ITG region (or LO proper) to the crossing of the paths with the anterior end of the post-ITG or midFG (or LO anterior) at the positions indicated on the flatmaps (numbers in Fig. 12A). Therefore, we could plot both the AI and SI along these eight paths (Fig. 12B, C).
Figure 12.
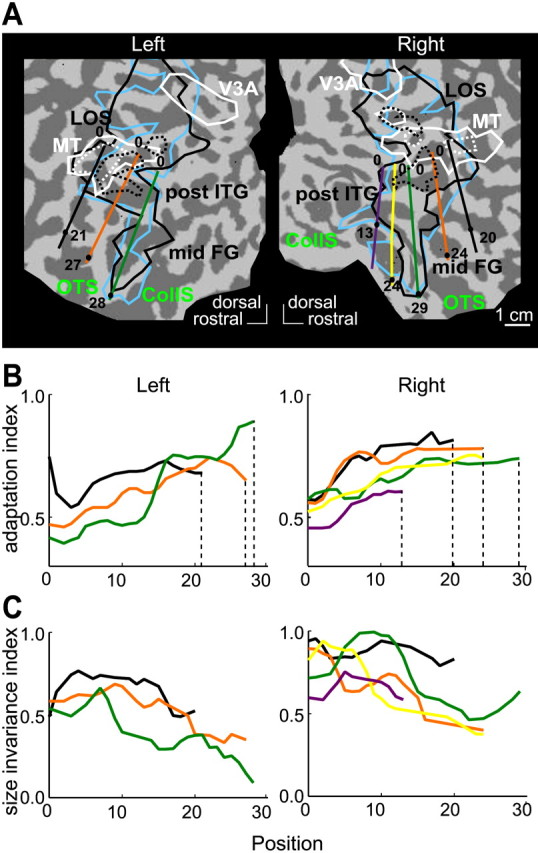
Detailed analysis of the LOC. A, Parts of human flatmaps (see Fig. 5) showing the position of the paths in the LO cortex: black in the ITG, orange in the OTS, green in the lFG, yellow in the mFG, and purple in the collateral sulcus (CollS). Black and white outlines indicate the shape-sensitive regions (LOS, post ITG, and midFG) and motion-sensitive regions (hMT/V5+ and V3A): solid lines contour at p < 0.05, and dotted lines contour at p < 10-5. B, C, Plots of object AI (B) and SI (C) along the three (left hemisphere) and five (right hemisphere) paths. The endpoints of paths are indicated by numbers in A. Dotted lines in B indicate the anterior endpoints. The values of the correlation between AI and position were 0.59, 0.91, and 0.97 in the left ITG, OTS, and lFG, respectively, and 0.65, 0.70, 0.82, 0.94, and 0.76 along the right ITG, OTS, lFG, mFG, and CollS, respectively (all p < 0.05). The values of the correlation between SI and position were -0.39, -0.72, -0.73 for left ITG, OTS, and lFG, respectively, and -0.32, -0.81, -0.68, -0.93, and 0.0 along the right ITG, OTS, lFG, mFG, and CollS, respectively. The values for OTS and lFG bilaterally and the right mFG were significant (p < 0.05). For differences between the left and right hemispheres, see Results.
Figure 12B shows that the AI increases at more anterior levels in the LOC along all eight paths. Linear regression analysis demonstrated that these changes were significant along all eight paths (p < 0.05; for r values, see figure legend). Statistical testing (two-way ANOVA with paths and hemispheres as factors) revealed a significant hemispheric difference (right larger than left) in the AI (p < 0.001) but no interaction between path and hemisphere.
Just as in the monkey IT complex, the increase in the AI at anterior levels of the LOC was accompanied by a decrease in the SI, indicating more pronounced size invariance at these anterior levels (Fig. 12B). Linear regression analysis revealed that this change was significant along the OTS and lFG paths bilaterally and along right mFG path (for r values, see figure legend). Finally, it is noteworthy that along all paths, size invariance indices were smaller in the left than in the right hemisphere along all three paths. Statistical testing (two-way ANOVA with path and hemisphere as factors) confirmed the significance of this interhemispheric difference (p < 10-7) and also showed an interaction between path and hemisphere (p < 0.01). Post hoc testing (Bonferroni's) showed that size invariance indices were significantly lower in the left ITG (black; p < 0.005), OTS (orange; p < 0.05), and lFG (green; p < 10-7) paths compared with their right counterparts.
This analysis revealed similar anteroposterior gradients in object adaptation and size invariance across the IT complex and LOC.
Discussion
The similarity between humans and monkeys
Using the same experimental technique and behavioral state in both species (Nakahara et al., 2002; Vanduffel et al., 2002), we were able to compare fMRI object adaptation in the two species. Over a wide range of conditions, including controls of attention, object adaptation is very similar in the two visual systems. The match was almost perfect between object adaptation in the LOC and IT complex. This conclusion can be extended to object adaptation under different size conditions. Complete size invariance was observed in none of the shape-sensitive regions of either species.
Adaptation and size invariance in monkeys
In macaques, the regions sensitive to object adaptation overlapped extensively with the shape-sensitive regions, including the prefrontal cortex. This agrees with the single-cell recording studies reporting that repetition of shape stimuli typically decreases neural responses in the IT cortex (Brown et al., 1987; Li et al., 1993; Sobotka and Ringo, 1993; Vogels et al., 1995) and in the prefrontal cortex (Miller et al., 1996; Rainer and Miller, 2000). So far, the effect of repeated presentation of shapes has not been assessed in parietal shape-selective neurons (Sereno and Maunsell, 1998). Thus, fMRI object adaptation was observed in regions where decreased neuronal responses have been reported for repeated presentation of shape/object stimuli, supporting a link between fMRI adaptation and neuronal response suppression. This link has been frequently assumed without explicit testing. In fact, these two phenomena are often interchangeably referred to as neuronal priming, although the relationship with behavioral priming is complex (Henson et al., 2000; Dobbins et al., 2004; Maccotta and Buckner, 2004).
Complete size invariance was observed in none of the shape-related areas of the monkey. This is in general agreement with single-cell studies (Schwartz et al., 1983; Lueshow et al., 1994; Logothetis et al., 1995; Vogels, 1999) reporting that response is independent of size only in a fraction of IT neurons. Using fMRI, the largest size invariance was observed in the anterior part of TE. Two studies (Ito et al., 1995; Op De Beeck and Vogels, 2000) have investigated the invariance of shape-selective neurons in this region over a large range of sizes and reported that a large fraction of neurons were size specific. Thus, the size invariance observed in the anterior TE with fMRI is at least qualitatively in agreement with the single-cell results. Our results also indicate a considerable variation in size invariance along the anteroposterior levels of the IT complex. Unfortunately, no single-cell study has investigated this range of anteroposterior levels. However, it is well known that receptive field (RF) size increases along anteroposterior levels in the IT complex (Desimone and Gross, 1979; Kobatake and Tanaka, 1994) and therefore one may infer that size dependency will decrease as one reaches more anterior levels, as we observed.
LIP also exhibited size-dependent adaptation, suggesting size selectivity of LIP neurons. Murata et al. (2000) reported that many neurons in the AIP were selective for size. Precise coding of object size is effectively important for guidance of grasping of object, a function in which AIP is believed to play an important role (Murata et al., 2000), although size dependence of recognition has also been reported (Bundesen and Larsen, 1975).
Adaptation and size invariance in humans
Significant object adaptation effects were observed in the shape-sensitive regions of human subjects. The pattern of shape-related activation obtained with the small stimuli used in the present study matched that observed with the large stimuli used by Denys et al. (2004a) relatively well, particularly in the ventral visual cortex. In the dorsal regions, a few frank discrepancies were noted that can be mostly attributed to the difference in size of the stimuli. The activation of hV3A in the present study was restricted to the more ventral part of V3A, where central vision is represented (Tootell et al., 1997). In the posterior IPS, no activation of POIPS was observed (Table 2), whereas activation in the anterior IPS (DIPSMs and DIPSAs) was actually stronger than in the study by Denys et al. (2004a). Recently, we have shown that although DIPSM/DIPSA regions represent mainly the center of the visual field, POIPS represents mainly the periphery (Claeys et al., 2004).
In experiment 1, we used a paradigm very similar to that used in the adaptation experiment of Grill-Spector et al. (1999). They reported a response in the one-object condition only 40% of that in the 32-object condition (their Fig. 3e). This corresponds to an AI of 0.6, close to the values of 0.58 and 0.62 we obtained as the AI in right and left post-ITG (LO proper), the main part of the LOC (Fig. 5). Because Grill-Spector used an ROI approach, their value was dominated by that of the LO because it contributed the most voxels. Our study also agrees with the previous studies that reported a stronger adaptation in the anterior part of the LOC (LOa; ventral temporo-occipital) than the posterior part of the LOC (LO proper) (Grill-Spector et al., 1999; James et al., 2002). The parietal components of the object shape-sensitive regions showed an adaptation effect similar in strength to that in the post-ITG, in agreement with the results of James et al. (2002).
We failed to observe complete size invariance in the LOC (Grill-Spector et al., 1999; Vuilleumier et al., 2002). Grill-Spector et al. (1999), using object stimuli similar to ours, obtained more adaptation under the different size conditions than under the identical size condition: they reported an adaptation ratio of 56% in the first condition compared with 71% in the second condition, a smaller ratio indicating more adaptation. Using different face stimuli, however, these authors also failed to observe complete size invariance. Using the data shown in their Figure 7d (second face experiment) we calculated an SI of 0.33 and 0.69 for the LOa and LO, respectively. This is again close to the values we obtained in the anterior and posterior parts of the paths through the LOC, at least those in the left hemisphere (Fig. 12C). Thus, overall, the present human data agree with those of Grill-Spector et al. (1999): we observed similar levels of adaptation, and similar anteroposterior gradients in adaptation, and size invariance; only the degree of size invariance differs to some extent. Differences in procedure may explain the discrepancy with our results: the range of size change is larger in our experiment than that of Grill-Spector et al. (1999), and we used only five discrete sizes in that range.
Our finding that in humans the left LOC is more size invariant than the right LOC fits previous behavioral and functional imaging reports that the left fusiform cortex may host a more abstract or invariant visual shape representation than its counterpart in the right hemisphere (Marsolek, 1999; Koutstaal et al., 2001; Vuilleumier et al., 2002).
Interspecies comparisons: ventral and dorsal pathways
Our study shows that both in the LOC and IT complex, object adaptation and shape sensitivity measured with two different types of stimuli are all coextensive. This provides additional support for the homology between these complexes at the “regional” level (region considered here as a set of areas) (Orban et al., 2004). Also, the finding that both complexes exhibit anteroposterior gradients in adaptation and size invariance further supports the regional homology. Because there has so far been no consistent way to functionally parcel these two complexes, it still remains a formidable task to resolve the homology issue at the level of single areas.
The present experiments confirmed species differences in shape sensitivity at the level of the IPS (Vanduffel et al., 2002; Denys et al., 2004a,b). Only one region, which we tentatively identified as LIP, was shape sensitive in monkeys compared with three regions (VIPS, DIPSMs, and DIPSAs) in humans. Furthermore, in monkeys, the shape sensitivity in the present experiments was less extensive in the anterior IPS than in our previous experiments (Denys et al., 2004a), whereas in humans the opposite was true.
One additional species difference emerged in the near extra-striate cortex (V3 and V4), in which the scrambling was much stronger in the present experiment than in our previous one (Denys et al., 2004a). Comparatively, the difference between the two scrambling procedures was much smaller in humans (compare Figs. 4, 5). Using the same coordinates as those used by Denys et al. (2004a; their Tables S1 and S2) to asses the V1 activity in the present experiments indicated the scrambling effect was similar in V1 of both species: the scrambled condition evoked ∼70% more MR change than the intact shapes. Thus, the species difference is really limited to near extrastriate areas including V3 and V2 at subthreshold level, where phase scrambling is more effective than mosaic scrambling [see Rainer et al. (2002), their Fig. 4B]. This effect is much reduced in humans, perhaps because of the somewhat smaller RFs.
Conclusion
We were able to show that the human and monkey visual systems show similar object adaptation properties, both under identical and different size conditions. We provide evidence for consistency between fMRI adaptation under both conditions and properties of single neurons. This still leaves open the question whether neuronal adaptation can be used to assess neuronal selectivity. This question has to be addressed by single-cell recordings and is now being investigated (Sawamura et al., 2004).
Footnotes
This work was supported by grants from the Queen Elizabeth Medical Foundation (GSKE), the National Research Foundation (FWO G 0151.04), the Flemish Regional Ministry of Education (GOA 2000/11), the InterUniversity Attraction Pole P5/04, the Human Frontier Science Program, and the MIND Institute. H.S. was supported by a Japan Society for the Promotion of Science postdoctoral fellowship (2003) for research abroad. We thank K. Nelissen for help with the monkey experiments and S. Raiguel for comments on this manuscript. We also thank M. De Paep, W. Depuydt, A. Coeman, C. Fransen, P. Kayenbergh, G. Meulemans, Y. Celis, and G. Vanparrijs for technical support.
Correspondence should be addressed to Prof. Guy A. Orban, Laboratorium voor Neuroen Psychofysiologie, K.U. Leuven Medical School, Campus Gasthuisberg, Herestraat 49, bus 801, B-3000 Leuven, Belgium. E-mail: guy.orban@med.kuleuven.ac.be.
Copyright © 2005 Society for Neuroscience 0270-6474/05/254294-13$15.00/0
References
- Avidan G, Hasson U, Hendler T, Zohary E, Malach R (2002) Analysis of the neuronal selectivity underlying low fMRI signals. Curr Biol 12: 964-972. [DOI] [PubMed] [Google Scholar]
- Belliveau JW, Kennedy Jr DN, McKinstry RC, Buchbinder BR, Weisskoff RM, Cohen MS, Vevea JM, Brady TJ, Rosen BR (1991) Functional mapping of the human visual cortex by magnetic resonance imaging. Science 254: 716-719. [DOI] [PubMed] [Google Scholar]
- Brewer AA, Press WA, Logothetis NK, Wandell BA (2002) Visual areas in macaque cortex measured using functional magnetic resonance imaging. J Neurosci 22: 10416-10426. [DOI] [PMC free article] [PubMed] [Google Scholar]
- Brown MW, Wilson FA, Riches IP (1987) Neuronal evidence that inferomedial temporal cortex is more important than hippocampus in certain processes underlying recognition memory. Brain Res 409: 158-162. [DOI] [PubMed] [Google Scholar]
- Buckner RL, Goodman J, Burock M, Rotte M, Koutstaal W, Schacter D, Rosen B, Dale AM (1998) Functional-anatomic correlates of object priming in humans revealed by rapid presentation event-related fMRI. Neuron 20: 285-296. [DOI] [PubMed] [Google Scholar]
- Bundesen C, Larsen A (1975) Visual transformation of size. J Exp Psychol Hum Percept Perform 1: 214-220. [DOI] [PubMed] [Google Scholar]
- Chef d'Hotel C, Hermosillo G, Faugeras O (2002) Flows of diffeomorphisms for multimodal image registration. Proc IEEE Int S Bio Im 7-8: 753-756. [Google Scholar]
- Claeys KG, De Schutter E, Orban GA (2004) Distinct representation of central and peripheral vision in human parietal cortex. Soc Neurosci Abstr 30: 935.3. [Google Scholar]
- Denys K, Vanduffel W, Fize D, Nelissen K, Peuskens H, Van Essen D, Orban GA (2004a) The processing of visual shape in the cerebral cortex of human and nonhuman primates: a functional magnetic resonance imaging study. J Neurosci 24: 2551-2565. [DOI] [PMC free article] [PubMed] [Google Scholar]
- Denys K, Vanduffel W, Fize D, Nelissen K, Sawamura H, Georgieva S, Vogels R, Van Essen D, Orban GA (2004b) Visual activation in prefrontal cortex is stronger in monkeys than in humans. J Cogn Neurosci 16: 1505-1516. [DOI] [PubMed] [Google Scholar]
- Desimone R, Gross CG (1979) Visual areas in the temporal cortex of the macaque. Brain Res 178: 363-380. [DOI] [PubMed] [Google Scholar]
- Desimone R, Albright TD, Gross CG, Bruce C (1984) Stimulus-selective properties of inferior temporal neurons in the macaque. J Neurosci 4: 2051-2062. [DOI] [PMC free article] [PubMed] [Google Scholar]
- Devor A, Dunn AK, Andermann ML, Ulbert I, Boas DA, Dale AM (2003) Coupling of total hemoglobin concentration, oxygenation, and neural activity in rat somatosensory cortex. Neuron 39: 353-359. [DOI] [PubMed] [Google Scholar]
- Dobbins IG, Schnyer DM, Verfaellie M, Schacter DL (2004) Cortical activity reductions during repetition priming can result from rapid response learning. Nature 428: 316-319. [DOI] [PubMed] [Google Scholar]
- Eger E, Henson RN, Driver J, Dolan RJ (2004) BOLD repetition decreases in object-responsive ventral visual areas depend on spatial attention. J Neurophysiol 92: 1241-1247. [DOI] [PubMed] [Google Scholar]
- Fize D, Vanduffel W, Nelissen K, Denys K, Chef d'Hotel C, Faugeras O, Orban GA (2003) The retinotopic organization of primate dorsal V4 and surrounding areas: a functional magnetic resonance imaging study in awake monkeys. J Neurosci 23: 7395-7406. [DOI] [PMC free article] [PubMed] [Google Scholar]
- Grill-Spector K, Malach R (2001) fMR-adaptation: a tool for studying the functional properties of human cortical neurons. Acta Psychol (Amst) 107: 293-321. [DOI] [PubMed] [Google Scholar]
- Grill-Spector K, Kushnir T, Edelman S, Itzchak Y, Malach R (1998) Cue-invariant activation in object-related areas of the human occipital lobe. Neuron 21: 191-202. [DOI] [PubMed] [Google Scholar]
- Grill-Spector K, Kushnir T, Edelman S, Avidan G, Itzchak Y, Malach R (1999) Differential processing of objects under various viewing conditions in the human lateral occipital complex. Neuron 24: 187-203. [DOI] [PubMed] [Google Scholar]
- Gross CG, Rocha-Miranda CE, Bender DB (1972) Visual properties of neurons in inferotemporal cortex of the macaque. J Neurophysiol 35: 96-111. [DOI] [PubMed] [Google Scholar]
- Heeger DJ, Ress D (2002) What does fMRI tell us about neuronal activity? Nat Rev Neurosci 3: 142-151. [DOI] [PubMed] [Google Scholar]
- Henson R, Shallice T, Dolan R (2000) Neuroimaging evidence for dissociable forms of repetition priming. Science 287: 1269-1272. [DOI] [PubMed] [Google Scholar]
- Ito M, Tamura H, Fujita I, Tanaka K (1995) Size and position invariance of neuronal responses in monkey inferotemporal cortex. J Neurophysiol 73: 218-226. [DOI] [PubMed] [Google Scholar]
- James TW, Humphrey GK, Gati JS, Menon RS, Goodale MA (2002) Differential effects of viewpoint on object-driven activation in dorsal and ventral streams. Neuron 35: 793-801. [DOI] [PubMed] [Google Scholar]
- Kim DS, Ronen I, Olman C, Kim SG, Ugurbil K, Toth LJ (2004) Spatial relationship between neuronal activity and BOLD functional MRI. NeuroImage 21: 876-885. [DOI] [PubMed] [Google Scholar]
- Kim SG, Ogawa S (2002) Insights into new techniques for high resolution functional MRI. Curr Opin Neurobiol 12: 607-615. [DOI] [PubMed] [Google Scholar]
- Kobatake E, Tanaka K (1994) Neuronal selectivities to complex object features in the ventral visual pathway of the macaque cerebral cortex. J Neurophysiol 71: 856-867. [DOI] [PubMed] [Google Scholar]
- Kourtzi Z, Kanwisher N (2000) Cortical regions involved in perceiving object shape. J Neurosci 20: 3310-3318. [DOI] [PMC free article] [PubMed] [Google Scholar]
- Kourtzi Z, Kanwisher N (2001) Representation of perceived object shape by the human lateral occipital complex. Science 293: 1506-1509. [DOI] [PubMed] [Google Scholar]
- Kourtzi Z, Tolias AS, Altmann CF, Augath M, Logothetis NK (2003) Integration of local features into global shapes: monkey and human FMRI studies. Neuron 37: 333-346. [DOI] [PubMed] [Google Scholar]
- Koutstaal W, Wagner AD, Rotte M, Maril A, Buckner RL, Schacter DL (2001) Perceptual specificity in visual object priming: functional magnetic resonance imaging evidence for a laterality difference in fusiform cortex. Neuropsychologia 39: 184-199. [DOI] [PubMed] [Google Scholar]
- Kraut M, Hart Jr J, Soher BJ, Gordon B (1997) Object shape processing in the visual system evaluated using functional MRI. Neurology 48: 1416-1420. [DOI] [PubMed] [Google Scholar]
- Lauritzen M (2001) Relationship of spikes, synaptic activity, and local changes of cerebral blood flow. J Cereb Blood Flow Metab 21: 1367-1383. [DOI] [PubMed] [Google Scholar]
- Leite FP, Tsao D, Vanduffel W, Fize D, Sasaki Y, Wald LL, Dale AM, Kwong KK, Orban GA, Rosen BR, Tootell RB, Mandeville JB (2002) Repeated fMRI using iron oxide contrast agent in awake, behaving macaques at 3 Tesla. NeuroImage 16: 283-294. [DOI] [PubMed] [Google Scholar]
- Li L, Miller EK, Desimone R (1993) The representation of stimulus familiarity in anterior inferior temporal cortex. J Neurophysiol 69: 1918-1929. [DOI] [PubMed] [Google Scholar]
- Logothetis NK, Pauls J, Poggio T (1995) Shape representation in the inferior temporal cortex of monkeys. Curr Biol 5: 552-563. [DOI] [PubMed] [Google Scholar]
- Logothetis NK, Pauls J, Augath M, Trinath T, Oeltermann A (2001) Neurophysiological investigation of the basis of the fMRI signal. Nature 412: 150-157. [DOI] [PubMed] [Google Scholar]
- Lueschow A, Miller EK, Desimone R (1994) Inferior temporal mechanisms for invariant object recognition. Cereb Cortex 4: 523-531. [DOI] [PubMed] [Google Scholar]
- Luppino G, Murata A, Govoni P, Matelli M (1999) Largely segregated parietofrontal connections linking rostral intraparietal cortex (areas AIP and VIP) and the ventral premotor cortex (areas F5 and F4). Exp Brain Res 128: 181-187. [DOI] [PubMed] [Google Scholar]
- Maccotta L, Buckner RL (2004) Evidence for neural effects of repetition that directly correlate with behavioral priming. J Cogn Neurosci 16: 1625-1632. [DOI] [PubMed] [Google Scholar]
- Malach R, Reppas JB, Benson RR, Kwong KK, Jiang H, Kennedy WA, Ledden PJ, Brady TJ, Rosen BR, Tootell RB (1995) Object-related activity revealed by functional magnetic resonance imaging in human occipital cortex. Proc Natl Acad Sci USA 92: 8135-8139. [DOI] [PMC free article] [PubMed] [Google Scholar]
- Marsolek CJ (1999) Dissociable neural subsystems underlie abstract and specific object recognition. Psychol Sci 10: 111-118. [Google Scholar]
- Miller EK, Li L, Desimone R (1993) Activity of neurons in anterior inferior temporal cortex during a short-term memory task. J Neurosci 13: 1460-1478. [DOI] [PMC free article] [PubMed] [Google Scholar]
- Miller EK, Erickson CA, Desimone R (1996) Neural mechanisms of visual working memory in prefrontal cortex of the macaque. J Neurosci 16: 5154-5167. [DOI] [PMC free article] [PubMed] [Google Scholar]
- Miyashita Y, Chang HS (1988) Neuronal correlate of pictorial short-term memory in the primate temporal cortex. Nature 331: 68-70. [DOI] [PubMed] [Google Scholar]
- Murata A, Gallese V, Luppino G, Kaseda M, Sakata H (2000) Selectivity for the shape, size, and orientation of objects for grasping in neurons of monkey parietal area AIP. J Neurophysiol 83: 2580-2601. [DOI] [PubMed] [Google Scholar]
- Nakahara K, Hayashi T, Konishi S, Miyashita Y (2002) Functional MRI of macaque monkeys performing a cognitive set-shifting task. Science 295: 1532-1536. [DOI] [PubMed] [Google Scholar]
- Op De Beeck H, Vogels R (2000) Spatial sensitivity of macaque inferior temporal neurons. J Comp Neurol 426: 505-518. [DOI] [PubMed] [Google Scholar]
- Orban GA, Van Essen D, Vanduffel W (2004) Comparative mapping of higher visual areas in monkeys and humans. Trends Cogn Sci 8: 315-324. [DOI] [PubMed] [Google Scholar]
- Rainer G, Miller EK (2000) Effects of visual experience on the representation of objects in the prefrontal cortex. Neuron 27: 179-189. [DOI] [PubMed] [Google Scholar]
- Rainer G, Augath M, Trinath T, Logothetis NK (2002) The effect of image scrambling on visual cortical BOLD activity in the anesthetized monkey. NeuroImage 16: 607-616. [DOI] [PubMed] [Google Scholar]
- Riches IP, Wilson FA, Brown MW (1991) The effects of visual stimulation and memory on neurons of the hippocampal formation and the neighboring parahippocampal gyrus and inferior temporal cortex of the primate. J Neurosci 11: 1763-1779. [DOI] [PMC free article] [PubMed] [Google Scholar]
- Rolls ET, Baylis GC, Hasselmo ME, Nalwa V (1989) The effect of learning on the face selective responses of neurons in the cortex in the superior temporal sulcus of the monkey. Exp Brain Res 76: 153-164. [DOI] [PubMed] [Google Scholar]
- Rosano C, Krisky CM, Welling JS, Eddy WF, Luna B, Thulborn KR, Sweeney JA (2002) Pursuit and saccadic eye movement subregions in human frontal eye field: a high-resolution fMRI investigation. Cereb Cortex: 12: 107-115. [DOI] [PubMed] [Google Scholar]
- Rossion B, Pourtois G (2004) Revisiting Snodgrass and Vanderwart's object pictorial set: the role of surface detail in basic-level object recognition. Perception 33: 217-236. [DOI] [PubMed] [Google Scholar]
- Sawamura H, Vogels R, Orban GA (2004) Single cell investigation of stimulus adaptation in monkey inferior temporal cortex. Soc Neurosci Abstr 30: 824.1. [Google Scholar]
- Schwartz EL, Desimone R, Albright TD, Gross CG (1983) Shape recognition and inferior temporal neurons. Proc Natl Acad Sci USA 80: 5776-5778. [DOI] [PMC free article] [PubMed] [Google Scholar]
- Sereno AB, Maunsell JH (1998) Shape selectivity in primate lateral intraparietal cortex. Nature 395: 500-503. [DOI] [PubMed] [Google Scholar]
- Sobotka S, Ringo JL (1993) Investigation of long-term recognition and association memory in unit responses from inferotemporal cortex. Exp Brain Res 96: 28-38. [DOI] [PubMed] [Google Scholar]
- Sunaert S, Van Hecke P, Marchal G, Orban GA (1999) Motion-responsive regions of the human brain. Exp Brain Res 127: 355-370. [DOI] [PubMed] [Google Scholar]
- Tootell RB, Dale AM, Sereno MI, Malach R (1996) New images from human visual cortex. Trends Neurosci 19: 481-489. [DOI] [PubMed] [Google Scholar]
- Tootell RB, Mendola JD, Hadjikhani NK, Ledden PJ, Liu AK, Reppas JB, Sereno MI, Dale AM (1997) Functional analysis of V3A and related areas in human visual cortex. J Neurosci 17: 7060-7078. [DOI] [PMC free article] [PubMed] [Google Scholar]
- Tootell RB, Hadjikhani NK, Vanduffel W, Liu AK, Mendola JD, Sereno MI, Dale AM (1998) Functional analysis of primary visual cortex (V1) in humans. Proc Natl Acad Sci USA 95: 811-817. [DOI] [PMC free article] [PubMed] [Google Scholar]
- Tootell RB, Tsao D, Vanduffel W (2003) Neuroimaging weighs in: humans meet macaques in “primate” visual cortex. J Neurosci 23: 3981-3989. [DOI] [PMC free article] [PubMed] [Google Scholar]
- Tsao DY, Freiwald WA, Knutsen TA, Mandeville JB, Tootell RB (2003) Faces and objects in macaque cerebral cortex. Nat Neurosci 6: 989-995. [DOI] [PMC free article] [PubMed] [Google Scholar]
- Vanduffel W, Fize D, Mandeville JB, Nelissen K, Van Hecke P, Rosen BR, Tootell RB, Orban GA (2001) Visual motion processing investigated using contrast agent-enhanced fMRI in awake behaving monkeys. Neuron 32: 565-577. [DOI] [PubMed] [Google Scholar]
- Vanduffel W, Fize D, Peuskens H, Denys K, Sunaert S, Todd JT, Orban GA (2002) Extracting 3D from motion: differences in human and monkey intraparietal cortex. Science 298: 413-415. [DOI] [PubMed] [Google Scholar]
- Vogels R (1999) Categorization of complex visual images by rhesus monkeys. Part 2: single-cell study. Eur J Neurosci 11: 1239-1255. [DOI] [PubMed] [Google Scholar]
- Vogels R, Sary G, Orban GA (1995) How task-related are the responses of inferior temporal neurons? Vis Neurosci 12: 207-214. [DOI] [PubMed] [Google Scholar]
- Vuilleumier P, Henson RN, Driver J, Dolan RJ (2002) Multiple levels of visual object constancy revealed by event-related fMRI of repetition priming. Nat Neurosci 5: 491-499. [DOI] [PubMed] [Google Scholar]