

Abstract
During brain anoxia or ischemia, a decrease in the level of ATP leads to a sudden decrease in transmembrane ion gradients [anoxic depolarization (AD)]. This releases glutamate by reversing the operation of glutamate transporters, which triggers neuronal death. By whole-cell clamping CA1 pyramidal cells, we investigated the energy stores that delay the occurrence of the AD in hippocampal slices when O2 and glucose are removed. With glycolytic and mitochondrial ATP production blocked in P12 slices, the AD occurred in ∼7 min at 33°C, reflecting the time needed for metabolic activity to consume the existing ATP and phosphocreatine, and for subsequent ion gradient decrease. Allowing glycolysis fueled by glycogen, in the absence of glucose, delayed the AD by 5.5 min, whereas superfused glucose prevented the AD for >1 h. With glycolysis blocked, the latency to the AD was 6.5 min longer when mitochondria were allowed to function, demonstrating that metabolites downstream of glycolysis (pyruvate, citric acid cycle intermediates, and amino acid oxidation) provide a significant energy store for oxidative phosphorylation. With glycolysis blocked but mitochondria functioning, superfusing lactate did not significantly delay the AD, showing that ATP production from lactate is much less than that from endogenous metabolites. These data demonstrate a preferential role for glycolysis in preventing the AD. They also define a hierarchy of pool sizes for hippocampal energy stores and suggest that brain ATP production from glial lactate may not be significant in conditions of energy deprivation.
Keywords: anoxia, ischemia, lactate, ATP, anoxic depolarization, glucose
Introduction
Stroke (ischemia) and perinatal asphyxia (anoxia) are major causes of brain damage, in which much of the neuronal death is triggered by glutamate release (Choi and Rothman, 1990). This release results from a fall in ATP concentration, which inhibits the plasma membrane Na+/K+-ATPase and allows transmembrane ion gradients to decrease. This decrease is slow at first, but after a few minutes, an abrupt increase in [K+]o to ∼60 mm depolarizes neurons to -20 mV, an event called anoxic depolarization (AD) (Hansen, 1985; Erecinska and Silver, 1994). The AD is associated with a large release of glutamate, resulting from the decrease in ion gradients reversing glutamate transporters (Szatkowski et al., 1990; Madl and Burgesser, 1993; Roettger and Lipton, 1996; Rossi et al., 2000).
Whether an AD occurs during transient ischemia and its time of occurrence will be determined by how much stored energy the brain has to maintain ion gradients in the face of a temporary interruption of its energy supply. Brain ATP is derived mainly from glucose; glycolysis is followed by oxidative phosphorylation in mitochondria (see Fig. 1). It has been suggested (but see Chih et al., 2001b) that neuronal activity-evoked glycolysis (Pellerin et al., 1998; Magistretti and Pellerin, 1999) or almost all glycolysis (Sibson et al., 1998) is in glia, which export lactate to neurons as a substrate for their mitochondria. Because neurons consume most brain energy (Attwell and Laughlin, 2001), this lactate export might explain how the main energy store of the brain (assumed to be glial glycogen) (Gruetter, 2003; Brown, 2004) could sustain the activity of the neurons during energy deprivation, but no information is available on which CNS energy stores delay the occurrence of the AD.
Figure 1.

Schematic diagram of energy production pathways inhibited in this study. Conversion of glucose (or glycogen) to pyruvate by glycolysis generates two ATP molecules and can be inhibited with iodoacetate (IAA). G6P, Glucose-6-phosphate. Pyruvate is converted to acetyl CoA to feed the citric acid cycle, which generates two GTP molecules (convertible to ATP) and exports NADH and FADH2 to the electron transport chain, complexes 1, 3, and 4 (C1, C3, and C4) of which extrude H+ across the mitochondrial membrane to power ATP synthesis (29 ATP/glucose) (Rolfe and Brown, 1997). C1, C3, and C4 can be inhibited with rotenone, antimycin, and cyanide. ATP is used primarily to fuel ion pumping (Attwell and Laughlin, 2001), indicated here as the plasma membrane sodium pump. Short-term ATP reserves occur as phosphocreatine (PCr) and as nucleotide triphosphates (NTP) other than ATP (UTP, GTP, CTP).
Here, we examine the effect of different types of metabolic inhibition on hippocampal area CA1 using the glutamate receptors in pyramidal cells to monitor the large increase in [glutamate]o produced by the AD. There were five aims, as follows: (1) to ascertain the extent to which glycolysis can delay the regenerative decrease in ion gradients that generates the AD, because plasma membrane ion pumps may be preferentially fueled by glycolysis (Rosenthal and Sick, 1992); (2) to determine the period for which glycogen can sustain glycolysis in the absence of extracellular glucose; (3) to test whether superfused lactate can prevent the AD from occurring when glycolysis is blocked, as expected if most ATP is generated from lactate supplied to neurons from glia; (4) to compare the effect of a commonly used mitochondrial blocker, cyanide, with that of other blockers (rotenone, antimycin), because cyanide can potentiate or inhibit NMDA receptors according to their subunit composition (Patel et al., 1994; Arden et al., 1998); and (5) to examine whether, in addition to preventing oxidative phosphorylation, removal of oxygen had direct effects on membrane currents contributing to the AD, because some K+ and Na+ currents can sense oxygen directly and are activated or inhibited when O2 is removed (Jiang and Haddad, 1994; Hammarstrom and Gage, 2000). Our results demonstrate a preferential role for glycolysis in preventing the AD.
Materials and Methods
Electrophysiology. Pyramidal cells in hippocampal area CA1 were whole-cell clamped to use their NMDA and AMPA receptors to monitor the sudden inward current associated with the increase in glutamate concentration that is triggered by the decrease in ion gradients occurring at the time of the AD (Rossi et al., 2000). The time of the AD recorded in this way is indistinguishable from that recorded with extracellular field recording (Allen et al., 2004), showing that neither the presence of ATP in the internal solution for the whole-cell clamped cell (see below) nor the clamping of the voltage of that cell affects the generation of the AD. Thus the clamped cell acts simply as a sensor of the ion gradient decrease and glutamate release, which is produced by the large number of surrounding cells. Using whole-cell clamping to record the time of the AD offers two advantages over using extracellular field potential recording. First, the change in extracellular potential associated with the AD becomes very small if the AD onset is slow; thus whole-cell clamping gives more definite information on whether an AD has occurred. Indeed, it is only by the use of whole-cell clamping that we could be sure that there had not been a slow AD occurring in the experiments described below when glucose was present. Second, whereas measuring the AD onset by field recording only gives data on the time of the AD, using whole-cell clamping enables us to examine, in addition, the time course of the pre-AD and post-AD current changes generated by ischemia and to monitor exocytotic transmitter release as miniature synaptic currents. Hippocampal slices, 225 μm thick, were prepared from postnatal day 12 (P12) rats (or in some experiments, P28 rats, as noted in Results) as described by Allen et al. (2004), with Na-kynurenate (1 mm) in the slicing solution to block glutamate receptors, and were recorded 2-5 h after slicing, at which time glycogen levels should have almost completely recovered from the slicing process (Fiala et al., 2003). Recordings were at 33 ± 1°C, with slices submerged in flowing solution (10 ml/min), which normally contained the following (in mm): 126 NaCl, 24 NaHCO3, 1 NaH2PO4, 2.5 KCl, 2 MgCl2, 2.5 CaCl2, and 10 glucose, bubbled with 95% O2/5% CO2, pH 7.4. Cells were whole-cell voltage clamped with a pipette solution containing the following (in mm): 130 KCl, 5 NaCl, 10 HEPES, 10 BAPTA, 2 MgATP, and 2 MgCl2, pH adjusted to 7.2 with KOH. Pipette series resistance was ∼5MΩ before compensation by ∼60% to reduce it to ∼2MΩ. The large size of the current changes evoked by ischemia (up to 6 nA at the peak of the AD) implies that, even after compensation, significant series resistance voltage errors will inevitably occur [a detailed analysis is presented in the study by Hamann et al. (2002)]. Data are presented here without correction for this, because the series resistance was similar in different experimental conditions, and correcting for series resistance voltage errors would not alter the conclusions reached. Junction potentials were compensated. Cells were clamped at -33 mV to enhance the current generated by NMDA receptors. Miniature spontaneous IPSCs (sIPSCs) were analyzed as described by Allen and Attwell (2004). In a small number of experiments, noninvasive recording of the time of the anoxic depolarization was performed by recording the field potential with an extracellular recording electrode (a patch pipette filled with external solution) placed in the pyramidal cell proximal apical dendrite layer (Rader and Lanthorn, 1989). Evoked synaptic transmitter release was studied by recording the field EPSP in the stratum radiatum in response to 0.1 Hz stimulation of the Schaffer collaterals using a glass pipette and quantified as the initial slope of the field EPSP (fEPSP).
Choice of agents to mimic energy deprivation. Experiments mimicking brain ischemia in vitro inhibit glycolytic and mitochondrial ATP production by removing glucose and O2 but often use metabolic blockers as well (Reiner et al., 1990). This is because, in open-recording chambers, oxygen from the room air can rapidly diffuse through the solution to the tissue, preventing true inhibition of oxidative phosphorylation as would occur in vivo. In these experiments, energy deprivation was simulated by replacing 10 mm glucose with 7 mm sucrose and/or bubbling with 95% N2/5% CO2 and, in some experiments, as described in Results, glycolysis was blocked with iodoacetate (2 mm), and oxidative phosphorylation was blocked with rotenone (100 μm) and antimycin (100 μm) or NaCN (1 mm). Using 100 μm antimycin alone to block mitochondrial ATP production (along with iodoacetate to block glycolysis and removal of oxygen and glucose) produced an AD with the same latency as that seen with rotenone present as well (429 ± 16 s in 5 cells and 440 ± 17 s in 29 cells, respectively; p = 0.6). Reducing the antimycin concentration to 50, 25, or 10 μm also produced an AD with the same latency (423 ± 11, 430 ± 22, and 499 ± 61 s, respectively, five cells for each; p values compared with 100 μm antimycin plus rotenone were 0.43, 0.75, and 0.39, respectively), although the time of occurrence was more variable when 10 μm antimycin was used. This suggests that block of complex 3 alone is sufficient to block mitochondrial ATP production and that 25 μm antimycin is a sufficient concentration. Using rotenone alone to block mitochondrial ATP production (along with iodoacetate to block glycolysis and removal of oxygen and glucose) delayed the AD by ∼2 min (to 569 ± 42 s; p = 0.033; five cells), suggesting that rotenone alone may not completely prevent mitochondrial ATP production. This may be because it blocks the electron transport chain at complex 1 (see Fig. 1), and thus any metabolites that can enter the chain at complex 2 [such as reduced flavin adenine dinucleotide (FADH2)] will still be able to generate ATP (in the presence of residual oxygen), or because the rotenone dose used was not saturating. When Na-lactate was added, it replaced NaCl.
Experimental design and data analysis. Every cell studied was from a different slice. Experiments comparing different metabolic blockers were done in an alternating interleaved manner (one cell with one condition, followed by another cell with the other condition, etc.). Data are presented as mean ± SEM. p values are from Student's two-tailed t tests.
Simulation of diffusion into and out of the hippocampal slice. The glucose distribution through the extracellular space of the slice was calculated by solving the following modified diffusion equation:
 |
1 |
where c is the concentration, x is the distance through the slice, D is the diffusion coefficient [assumed to be 7.6 × 10⁻¹⁰ m2 s-1, the value for glutamine (Longsworth, 1953)], λ and α are the tortuosity factor and extracellular volume fraction (1.7 and 0.13, respectively) (McBain et al., 1990), and U and K are the maximum uptake rate and EC50 for glucose uptake. We set K = 1.6 mm (Erecinska and Silver, 1994) and set U to 0.055 mol/m3/s to reproduce a glucose uptake rate of 0.013 mol/m3/s (equivalent to the mean uptake rate of 79 μmol/100 g per minute measured for rat hippocampus) (Sokoloff et al., 1977) at the measured normal extracellular brain glucose level of 0.5 mm (Fellows et al., 1992), assuming for simplicity that hippocampal slices at 33°C have the same glucose uptake rate as in vivo hippocampus. (Because brain slices, particularly at P12, may be less energetically demanding than the adult in vivo brain, the effect of assuming a lower glucose uptake rate is also considered in Results.) The steady-state distribution of glucose across the slice was determined by allowing the simulation to run until a steady state was reached. To simulate glucose diffusion out of the slice, after this steady state was reached, the glucose concentration at the surface of the slice was stepped to zero and Equation 1 was solved to determine the time course of glucose removal from the slice. The resulting amount of glucose uptake remaining at different times was obtained by transforming the concentration at each point through the equation Uc/(c + K). To estimate the time needed for drugs to diffuse into the slice, the simulation was run with U set to zero (i.e., ignoring uptake of drugs into the cells), and the concentration at the center of the slice was found to reach one-half the value at the surface in <20 s.
Results
Experiments are on slices from P12 rats except where stated otherwise.
The AD response to block of glycolysis and oxidative phosphorylation
Figure 1 is a diagram of energy production in the brain, with glycolysis consuming external glucose and internal glycogen, and with most (94%) (Rolfe and Brown, 1997) of the ATP being produced by mitochondria (possible compartmentation of metabolic function between neurons and glia will be considered later). There are several potential energy reservoirs in this scheme that can delay the decrease in the ion gradients maintained by the plasma membrane Na+/K+-ATPase when supplies of external glucose and O2 are cut off. ATP can be made from phosphocreatine, glycolysis can use glucose-6-phosphate derived from glycogen as a substrate, and (if glucose levels fall while O2 is still present, as in hypoglycemia) metabolites downstream of glycolysis such as pyruvate can be used by mitochondria until they are used up.
To test the response of pyramidal cells to severe energy deprivation, we first removed external oxygen and glucose and simultaneously blocked glycolysis with iodoacetate (2 mm) and mitochondrial ATP production with a combination of rotenone (100 μm) and antimycin (100 μm). The resulting current response of a cell in a P12 slice, clamped at -33 mV, is shown in Figure 2A. For the first ∼7 min, the current became slightly more inward, but then (440 ± 17 s after the start of ischemia in 29 slices) a large inward current occurred (the AD current), which sagged back over ∼30 s to a more slowly decaying plateau of inward current. Applying glutamate receptor blockers during this plateau suppressed much of the inward current, showing that it was mediated by glutamate release, as shown previously by Rossi et al. (2000) using cyanide as a mitochondrial blocker, and in Figure 8 below.
Figure 2.
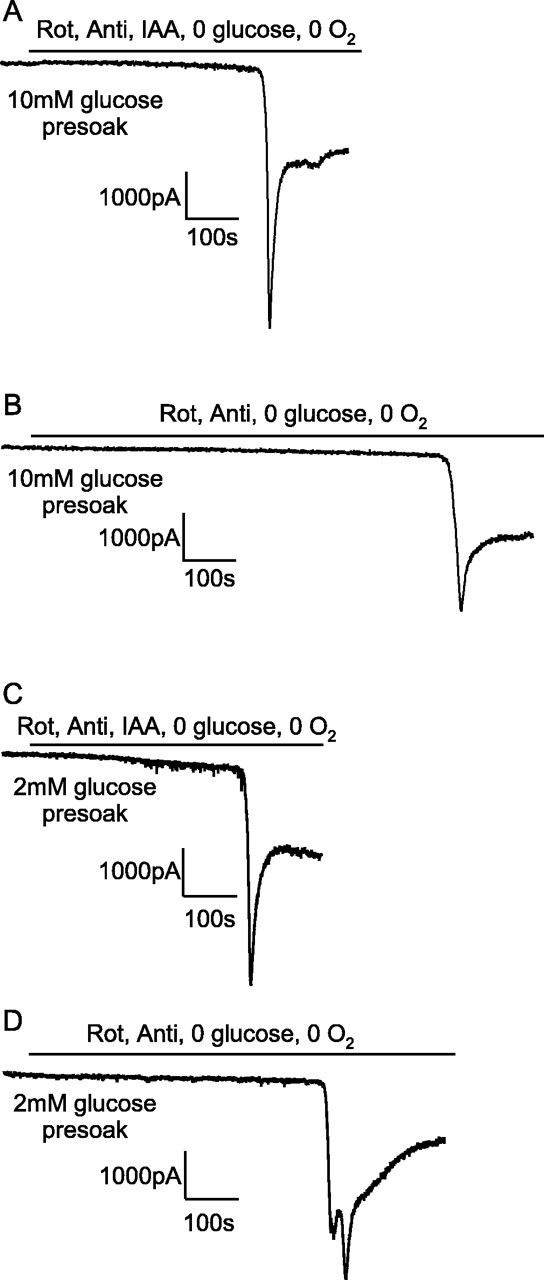
Current response at -33 mV of CA1 pyramidal cells to simulated ischemia. A, B, Slices were presoaked in solution containing 10 mm glucose. C, D, Slices were presoaked in solution containing 2 mm glucose. A, C, Ischemia simulated by application of 100 μm rotenone (Rot) and 100 μm antimycin (Anti) (to block oxidative phosphorylation) and 2 mm iodoacetate (IAA) (to block glycolysis) in oxygen- and glucose-free solution. B, D, Ischemia simulated by application of 100 μm rotenone and 100 μm antimycin (to block oxidative phosphorylation) in oxygen- and glucose-free solution (no iodoacetate present). The cell in D showed a second transient inward current after the AD.
Figure 8.
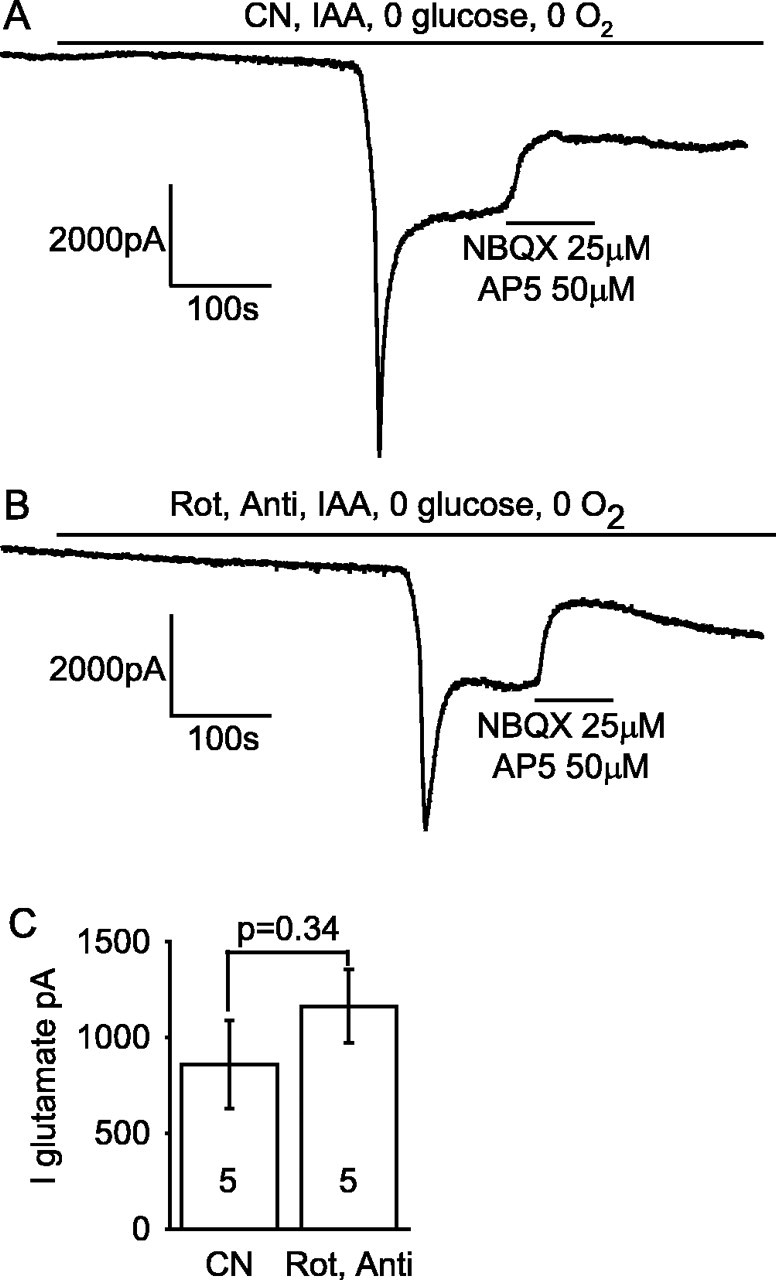
Glutamate receptor blockers reveal a similar amplitude of glutamate-mediated post-AD plateau current independent of how oxidative phosphorylation is inhibited. A, Application of 25 μm 2,3-dihydroxy-6-nitro-7-sulfonyl-benzo[f]quinoxaline (NBQX) (to block AMPA receptors) and 50 μm AP-5 (to block NMDA receptors) to the post-AD plateau induced by cyanide (CN) (to block oxidative phosphorylation) and iodoacetate (IAA) (to block glycolysis) in oxygen- and glucose-free solution. B, Application of NBQX and AP-5 to the post-AD plateau current induced by rotenone (Rot) and antimycin (Anti) (to block oxidative phosphorylation) and iodoacetate in oxygen- and glucose-free solution. C, The amplitude of the glutamate-blockable current was not significantly different between the two methods of blocking oxidative phosphorylation. Bold numbers indicate the number of cells studied.
Glycolysis fueled by glycogen delays the AD when mitochondria are blocked
Repeating the experiment of Figure 2A with iodoacetate omitted, to allow glycolysis to occur in the absence of external glucose using glucose-6-phosphate derived from glycogen (Fig. 1), the latency of the AD was increased by 5.5 min (from ∼7.5 to ∼13 min; p = 10-5) (Fig. 2B; also see mean data in Fig. 4A). The amplitude of the AD was also reduced (see Fig. 4B), suggesting that allowing glycolysis to continue reduces the severity or the speed of the ion gradient decrease occurring at the time of the AD, resulting in less glutamate release or more time for desensitization of glutamate receptors to occur.
Figure 4.
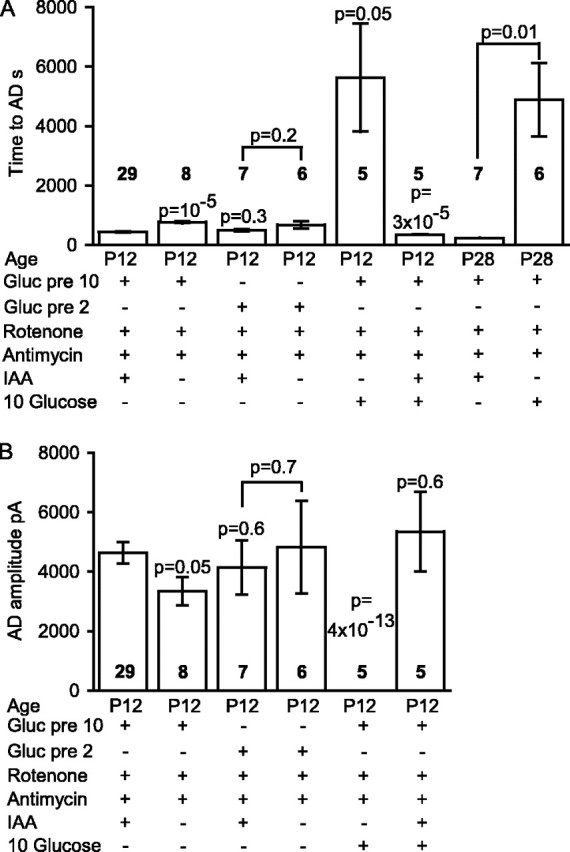
Summary of time taken for the AD to occur and the amplitude of the AD current in the ischemic conditions presented in Figures 2 and 3. A, Time taken for the AD to occur. For the fifth and eighth bars, no AD occurred, and the bar shows the recording duration with no AD. B, Amplitude of the AD current. In both graphs, the numbers in bold represent the number of cells; p values above bars compare values to the first condition [slice presoaked in 10 mm glucose; application of solution containing rotenone, antimycin, and iodoacetate (IAA); oxygen and glucose free], whereas p values between bars compare the indicated conditions. Gluc pre 10 or Gluc pre 2, Glucose was present at 10 or 2 mm before ischemia. No P28 data are shown for AD amplitude, because in most of these experiments the AD latency was determined solely by extracellular recording.
Glucose remaining in the extracellular space of the slice after it has been removed from the superfusate could still be taken up and used to generate ATP in the absence of iodoacetate, but the extra 5.5 min delay is unlikely to reflect the time needed for glucose to diffuse out of the slice. Simulation of glucose diffusion out of the slice, and of the resulting decline in glucose uptake (see Materials and Methods), showed that glucose uptake should be reduced to <10% of its initial value (averaged across the slice) 17 s after removing glucose from the superfusate (see Materials and Methods); assuming a 10-fold lower glucose uptake rate than is seen in vivo (e.g., if there is less energy consumption when excitatory input from outside the slice is removed) would only prolong this to 60 s. Therefore, these data suggest that (with mitochondria inhibited) glycogenolysis provides a reserve of ATP production that lasts ∼5.5 min in ischemic conditions.
To check this interpretation of the data, we repeated this experiment after depleting glycogen stores by superfusing with solution containing 2 mm glucose (instead of the normal 10 mm, replaced by sucrose) for at least 1 h before applying the ischemic solution. Simulations of the diffusion of glucose into the slice (see Materials and Methods) suggested that, with 10 mm superfused glucose, the extracellular glucose concentration at the center of the slice will be 3 mm and the mean [glucose]o through the slice will be 5.2 mm, whereas with 2 mm superfused glucose, the extracellular glucose concentration at the center of the slice will be 0.17 mm and the mean [glucose]o through the slice will be 0.66 mm, which is more similar to the extracellular glucose concentration of 0.5 mm measured in vivo by a zero net flux microdialysis method (Fellows et al., 1992). The predicted mean [glucose] values are higher but still different (9.4 mm instead of 5.2 mm and 1.66 mm instead of 0.66 mm) if we assume that hippocampal slices have, for example, only 10% of the glucose uptake rate of in vivo hippocampus (see Materials and Methods). Thus, after incubation in the lower glucose solution, a decrease in glycogen stores and a lower intracellular glucose concentration are expected and, indeed, have been found by Lipton (1989) (lower glycogen, cf. their Table 1 data for 0 min with their Fig. 2) and Folbergrova et al. (1997) (lower glucose).
Using ischemic solution containing rotenone, antimycin, and iodoacetate (and no glucose or O2), the latency to the AD was not significantly different (p = 0.3) after superfusion of 2 mm glucose solution and after 10 mm glucose solution (Fig. 2C; also see mean data in Fig. 4A). However, when the effect of omitting iodoacetate was tested after superfusion of 2 mm glucose (Fig. 2D), the increase in latency described above after superfusion of 10 mm glucose was reduced from 5.5 to 3 min (see Fig. 4A), and this prolongation was not significant (p = 0.23), consistent with glycogen stores having been depleted.
Glycolysis fueled by glucose prevents the AD when mitochondria are blocked
If mitochondria are inhibited but glucose is present (e.g., in anoxia), extra production of ATP will be provided by glycolysis fueled by glucose on top of that fueled by glycogen breakdown. To investigate this, we applied rotenone and antimycin in solution bubbled with N2 but containing 10 mm glucose (and no iodoacetate). Because glycolysis normally produces only 6% of the total ATP generated by the sequential operation of glycolysis and oxidative phosphorylation (Rolfe and Brown, 1997) (i.e., two of the total of 31 ATP molecules produced per glucose as shown in Fig. 1), the latency to the AD in this condition might be expected to be only slightly prolonged compared with the situation with no glucose present as in Figure 2B. Contrary to this expectation, the presence of 10 mm glucose prevented an AD from occurring in five cells that we recorded from for over 40 min (Fig. 3A), one of which was recorded for 3.75 h with no AD occurring (mean recording time, 5627 ± 1817 s) (Fig. 4A). Including iodoacetate in the solution to prevent the 10 mm glucose present from being metabolized resulted in a normal early AD in all five cells studied (Figs. 3B, 4). Similarly, after 1 h of superfusion with 2 mm glucose, the maintained presence of 2 mm glucose (in the rotenone- and antimycin-containing solution) greatly delayed the AD. The AD latency was increased (p = 0.003) from 676 ± 126 s in six slices with glucose removed during metabolic inhibition (Fig. 2D) to 3395 ± 444 s in five slices with 2 mm glucose present (four cells showed a very late AD, and one cell showed no AD by 4962 s of recording) (data not shown). Thus glycolysis can prevent or greatly delay the occurrence of the AD.
Figure 3.
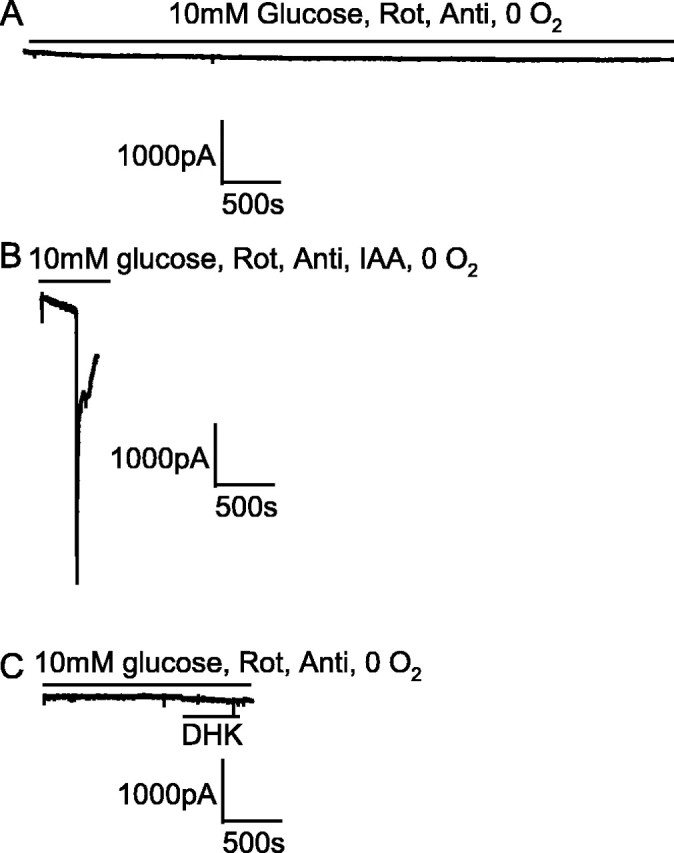
Glycolysis sustained by the presence of 10 mm glucose prevented an AD from occurring in the presence of blockers of oxidative phosphorylation. Note the slow time scale compared with the other figures. A, Blocking oxidative phosphorylation [with 100 μm rotenone (Rot) and 100 μm antimycin (Anti)] in oxygen-free solution containing 10 mm glucose did not induce an AD after 1 h. B, Repeating the experiment in A but adding 2 mm iodoacetate (IAA) to block glycolysis produced an AD as expected after 6 min. C, Blocking the glutamate transporter GLT-1 by application of 200 μm DHK to a slice made ischemic in the same way as in A did not induce an AD.
Interestingly, external glucose prevented not only the anoxic depolarization from occurring but also the massive increase in spontaneous release of GABA-containing vesicles that normally occurs in the first few minutes of ischemia (Allen and Attwell, 2004; Allen et al., 2004). Normally, the fall in ATP levels in ischemia leads to an increase in sIPSC rate, from 1-2 Hz in control conditions to ∼33 Hz after 4 min of ischemia (Allen and Attwell, 2004), whereas with mitochondria inhibited in the presence of 10 mm glucose, the sIPSC rate after 4 or even 40 min of metabolic inhibition (1.15 ± 0.34 and 1.98 ± 0.47 Hz, respectively) was not significantly increased (p = 0.86 and 0.18, respectively) from its preischemic value (1.23 ± 0.28 Hz in four cells). Thus the presence of glucose maintains presynaptic transmembrane ion gradients sufficiently to prevent the increase in [Ca2+]i, which triggers the normal increase in sIPSC rate (Allen and Attwell, 2004).
In case the protective effect of external glucose was caused by ATP production in the young (P12) animals used here being more dependent on glycolysis than is the case in older animals (Clark et al., 1993; Nabetani et al., 1995), we repeated this experiment in slices from P28 rats (in which enzymes of aerobic metabolism are at adult levels) (Clark et al., 1993). The same abolition of the AD by 10 mm glucose was obtained: in the absence of glucose, the latency to the AD in N2-bubbled solution containing rotenone, antimycin, and iodoacetate was ∼4 min (230 ± 8s; n = 7; i.e., approximately one-half of the latency seen in P12 slices), but in the presence of 10 mm glucose and in the absence of iodoacetate, no AD was seen for >1 h in six cells (recording time with no AD was 3 h for one cell and had a mean value of 4890 ± 1230 s) (Fig. 4A).
Because it has been suggested that much of the glycolysis of the brain occurs in astrocytes (Pellerin et al., 1998; Sibson et al., 1998; Magistretti and Pellerin, 1999), which also express a large fraction of the glutamate transport capacity of the brain in the form of the glutamate transporter GLT-1 (Lehre et al., 1995), we considered whether the apparent importance of glycolysis for preventing the AD was related to a need to keep astrocytes polarized to power uptake by GLT-1 (Levy et al., 1998). To test this, in three cells exposed for ∼20 min to rotenone and antimycin in N2-bubbled solution containing 10 mm glucose, we applied the GLT-1 blocker dihydrokainate (DHK; 200 μm) to determine whether the resulting cessation of glutamate uptake would allow [glu]o to increase and suddenly trigger an AD. Experimentally, no AD occurred (Fig. 3C), suggesting that glucose does not prevent an AD by maintaining glial glutamate uptake (although we cannot rule out the possibility that the residual uptake by the minority glial transporter GLAST, which is not blocked by DHK, is sufficient to prevent the glutamate concentration from rising).
Oxygen-sensing channels do not determine the latency of the AD
Oxygen deprivation may directly inhibit K+ channels (Jiang and Haddad, 1994) and increase Na+ channel opening (Hammarstrom and Gage, 2000), both of which would tend to promote an earlier and larger AD. To test this, we applied solution lacking glucose and containing iodoacetate to block glycolysis and applied solution containing rotenone and antimycin to block mitochondrial ATP production, bubbled with 95% O2/5% CO2; we then compared the response (Fig. 5A) with that produced by application of the same solution bubbled with 95% N2/5% CO2 (Fig. 2A). The latency to the AD was not significantly different (p = 0.47) in the presence and absence of oxygen (Fig. 5B), indicating no significant contribution of these O2-sensing channels to determining the time of the AD. However, the amplitude of the AD current was reduced in oxygen-containing solution (Fig. 5C), and this may be a result of an absence of low [O2]-induced opening of oxygen-sensitive Na+ channels or block of K+ channels.
Figure 5.

O2-sensing ion channels do not affect the time at which the AD occurs. A, An AD occurs in solution containing 100 μm rotenone (Rot), 100 μm antimycin (Anti), and 2 mm iodoacetate (IAA) (glucose free; slice presoaked in 10 mm glucose) bubbled with O2, just as when the solution was bubbled with N2 (Fig. 2 A). The small steps on the trace are in response to voltage jumps to check series resistance. B, The time of the AD was not affected by the presence of oxygen in the ischemia solution. C, The amplitude of the AD current was reduced when oxygen was present in the ischemia solution. Bold numbers show numbers of cells.
Metabolites downstream of glycolysis form an energy store to feed mitochondria
Applying iodoacetate alone in solution lacking oxygen and glucose (Fig. 6A) produced an AD with a latency that was 1 min longer than (not significantly different from; p = 0.11) that seen when rotenone and antimycin were included in the solution (Fig. 2A). However, when iodoacetate alone was applied in solution that lacked glucose but was bubbled with oxygen (Fig. 6B), the AD took an extra 5 min to occur (p = 0.003; n = 13) (Fig. 6D). This suggests that there are sufficient substrates downstream of the glyceraldehyde-3-phosphate dehydrogenase (GAPDH) enzyme, which is inhibited by iodoacetate (Fig. 1), for mitochondria to generate 5 min worth of ATP when oxygen is present. Again, the amplitude of the AD current was smaller in the presence of oxygen (Fig. 6E).
Figure 6.
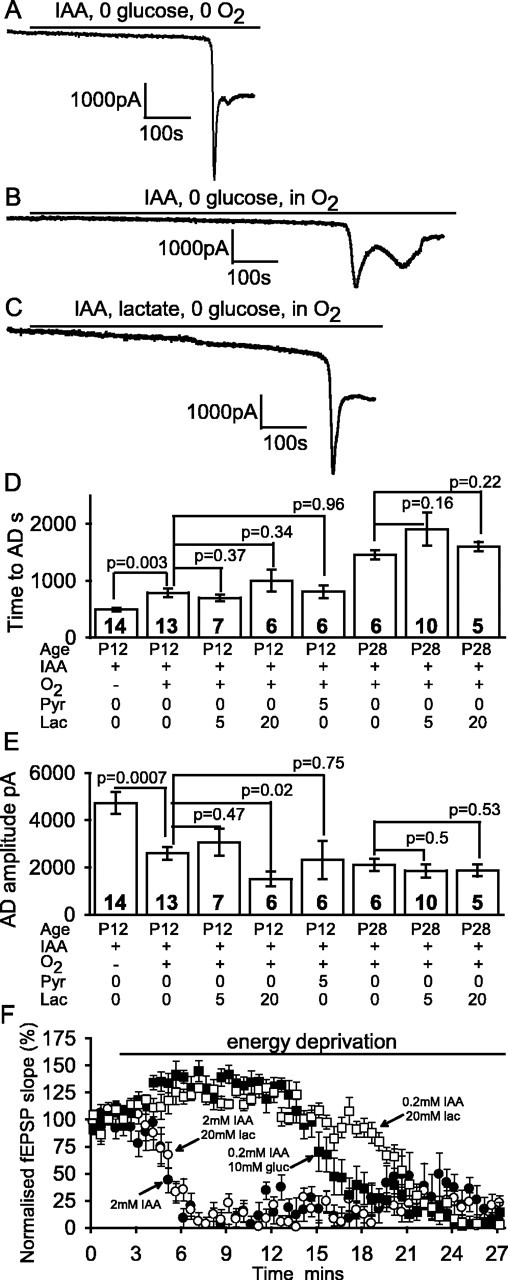
Blocking glycolysis alone is sufficient to induce an AD. A-C, Data from P12 slices. A, Blocking glycolysis with 2 mm iodoacetate (IAA) in oxygen- and glucose-free solution led to an AD after 8 min. B, Adding oxygen to the solution used in A delayed the AD. C, Adding 5 mm lactate to the solution as in B had no effect on the time at which the AD occurred. D, Mean time to the AD in the conditions of A-C and with 5 mm pyruvate (Pyr) or 20 mm lactate (Lac) present for P12 slices and with 0, 5, or 20 mm lactate present for P28 slices. E, Mean amplitude of the AD. Bold numbers denote the number of cells studied. F, Decline of the field EPSP initial slope (normalized to value before metabolic inhibition) evoked by 0.1 Hz stimulation of the Schaffer collaterals in the presence (from t = 2 min) of 2 mm iodoacetate (and no glucose), 2 mm iodoacetate and 20 mm lactate, 0.2 mm iodoacetate and 10 mm glucose (gluc), and 0.2 mm iodoacetate and 20 mm lactate.
In case free-radical production by mitochondria in the presence of O2 (Turrens, 2003) affected the time to the AD, we tested the effect of the cell-permeant free-radical scavenger Mn(III)tetrakis(4-benzoic acid) porphyrin (MnTBAP; 200 μm), in which the slices were soaked for 30 min before recording and which was also present in the superfusion solution (Vergun et al., 2001). MnTBAP had no effect on the latency to the AD (754 ± 149 s in six slices; p = 0.39 compared with no MnTBAP present) when iodoacetate was applied in the presence of oxygen, suggesting that free-radical generation plays an insignificant role in determining the AD latency.
We independently estimated the ATP-generating power of metabolites downstream of glycolysis by comparing the latency to the AD in the oxygen-bubbled iodoacetate-containing solution (Fig. 6B) with that in the same solution to which rotenone and antimycin had been added to block mitochondria (Fig. 5A). The presence of the mitochondrial blockers reduced the time to the AD by nearly 6.5 min (p = 0.0005) (compare the second column in Fig. 5B with the second column in Fig. 6D). This is slightly longer than the 5 min change seen when oxygen was omitted (Fig. 6A,B), which may reflect the presence of a small amount of residual oxygen in the N2-bubbed iodoacetate-containing solution of Figure 6A, which would slightly increase the latency to the AD.
Lactate oxidation does not delay the AD when glycolysis is inhibited
According to the suggestion that activity-evoked glycolysis, or almost all glycolysis, is in glia, which export lactate to neurons as a substrate for their mitochondria (Pellerin et al., 1998; Sibson et al., 1998; Magistretti and Pellerin, 1999), one might expect that with oxygen present during inhibition of glycolysis, neuronal ATP levels could be maintained if mitochondria are fueled by the superfusion of lactate. Thus, if the AD is primarily produced by a decrease in neuronal transmembrane ion gradients (see Discussion), then the AD evoked by iodoacetate in the presence of oxygen ought to be greatly delayed, or even prevented, by superfusion of lactate.
Experimentally, however, including 5 mm lactate in the solution (a concentration reported to maintain synaptic transmission in the absence of glucose) (Schurr et al., 1988; Saitoh et al., 1994) did not prevent the AD evoked by iodoacetate (Fig. 6C), which occurred (in seven cells) at a time not significantly altered (p = 0.37) from when lactate was absent. Lactate also did not prevent the increase in spontaneous release of GABA-containing vesicles that normally occurs during metabolic inhibition (Allen and Attwell, 2004; Allen et al., 2004); after 4 min in iodoacetate, the sIPSC rate in four cells had increased from a preiodoacetate value of 2.8 ± 1.3 Hz in four cells to 13.9 ± 2.8 Hz, which is less than the 33 Hz seen with combined inhibition of glycolysis and mitochondria (Allen and Attwell, 2004), presumably because some ATP is initially still being made by mitochondria. The presence of 5 mm lactate had no significant effect on this increase (the IPSC rate increased from 2.3 ± 0.6 to 11.2 ± 3.3 Hz in four cells; p = 0.55 compared with no lactate). Thus the presence of lactate does not prevent [ATP] from falling sufficiently in presynaptic terminals to evoke a large increase in spontaneous transmitter release.
Similarly, 5 mm pyruvate did not affect the AD latency (p = 0.96) in six cells and neither did 20 mm lactate in seven cells (p = 0.34) (Fig. 6D). In case this lack of effect of lactate was caused by ATP production in the young (P12) animals used here being more dependent on glycolysis than is the case in older animals (Clark et al., 1993; Nabetani et al., 1995), we repeated this experiment in slices from P28 rats (in which the enzymes of aerobic metabolism are at adult levels) (Clark et al., 1993). Again, neither 5 nor 20 mm lactate significantly delayed the AD (Fig. 6D). Its latency changed from 1457 ± 78 s in six slices without lactate (twice as long as in P12 slices) to 1860 ± 301 s in 10 slices with 5 mm lactate (p = 0.16), whereas for 20 mm lactate, the latency was 1603 ± 80 s in five slices (p = 0.22 compared with no lactate present).
To assess whether lactate might initially support synaptic transmission (although it cannot prevent the anoxic depolarization from occurring eventually), we performed an experiment similar to that shown in Figure 4 from Izumi et al. (1994), measuring the field EPSP evoked by stimulating the Schaffer collaterals in P28 slices. Iodoacetate evoked an inhibition of the fEPSP slope (Fig. 6F), which fell to 50% of its initial value in ∼3 min [significantly faster than the 12 min seen by Izumi et al. (1994) when they applied iodoacetate in the presence of glucose], and this was followed by a small recovery of the fEPSP. The initial depression of the fEPSP is attributable to adenosine release suppressing synaptic glutamate release (Fowler, 1990), and the subsequent recovery (Fowler, 1992) may reflect inhibition of the function of G-protein-coupled adenosine receptors when the GTP concentration falls in presynaptic terminals. Again, contrary to Izumi et al. (1994), we found that when 20 mm lactate was present, there was no change in the decline of the fEPSP (Fig. 6F).
We attribute the faster fEPSP decay that we see in iodoacetate and the lack of effect of lactate to the fact that Izumi et al. (1994) used a low concentration of iodoacetate (0.2 mm), which blocks glycolysis incompletely (Zeevalk et al., 1995). Fitting a Michaelis-Menten relationship to the data of Zeevalk et al. (1995) on the [iodoacetate] dependence of glycolysis inhibition in retina, we estimate that 0.2 mm iodoacetate only blocks glycolysis by 53%, whereas the 2 mm that we use blocks it by 92%. Furthermore, Izumi et al. (1994) also left glucose present in the solution (presumably because if glycolysis was blocked, it would not be metabolized). Repeating our experiment using only 0.2 mm iodoacetate with 10 mm glucose present, we found that the decay of the fEPSP slope to 50% of its initial size was delayed by 11 min (Fig. 6F), consistent with some ATP being produced from external glucose and intracellular glycogen by unblocked glycolysis. Furthermore, if we used 0.2 mm iodoacetate with 20 mm lactate (but no glucose) present, the fEPSP decay was delayed by an additional 4.5 min (Fig. 6F), mimicking in part the protective effect of lactate observed by Izumi et al. (1994).
Together, these data suggest that when glycolysis is completely blocked (with 2 mm iodoacetate), the amount of ATP made from lactate by mitochondria is too small to significantly delay the inhibition of the fEPSP, but if some ATP is being made from glycogen by glycolysis (in only 0.2 mm iodoacetate), the addition of lactate-derived ATP can delay the fEPSP inhibition. In our experiments, the presence of lactate did not prevent the fEPSP from eventually being greatly reduced. This is not a discrepancy with the data of Izumi et al. (1994), who found that the fEPSP was only suppressed by 35% after 30 min in lactate, for two reasons. First, it appears that they had glucose present in their lactate-containing solution [Izumi et al. (1994), their Table 2 legend], which would have continued to make ATP via partially blocked glycolysis. Second, their recordings were at 30°C and ours were at 33°C. Assuming a Q10 of 3, we would expect that the time needed for the fEPSP to start its rapid decline in 0.2 mm iodoacetate would be prolonged from the 18 min in Figure 6F to 25 min, which is similar to the recording time of Izumi et al. (1994). Thus, if they had recorded for a longer period of time, without glucose in the lactate-containing solution, they would presumably have seen the large decrease in fEPSP in lactate-containing solution that we observed.
Blocking mitochondria with cyanide gives an earlier AD than with rotenone/antimycin
We compared the effect of blocking mitochondrial function with cyanide (Reiner et al., 1990; Ferreira et al., 1997) with the effect of using rotenone and antimycin (Fig. 7), because cyanide also modulates NMDA receptor activation (Patel et al., 1994; Arden et al., 1998). Solution containing iodoacetate and cyanide (1 mm) and lacking O2 and glucose produced an AD (Fig. 7A), that was similar to that seen with rotenone and antimycin (Fig. 2A), except that it occurred ∼1.5 min earlier, after 6 min instead of 7.5 min (significantly different, p = 2.6 × 10⁻⁵). Applying glutamate receptor blockers during the post-AD plateau suppressed much of the inward current (Fig. 8A), showing that it was mediated by glutamate release (Rossi et al., 2000); much of the rest of the inward current is generated by GABA release (Allen et al., 2004), and ECl was 0 mV in these experiments so GABAA receptors generate an inward current. The amplitude of the glutamate-mediated current was not significantly different between ischemia induced by glucose- and oxygen-free solution containing rotenone, antimycin, and iodoacetate or containing cyanide and iodoacetate (Fig. 8B,C).
Figure 7.
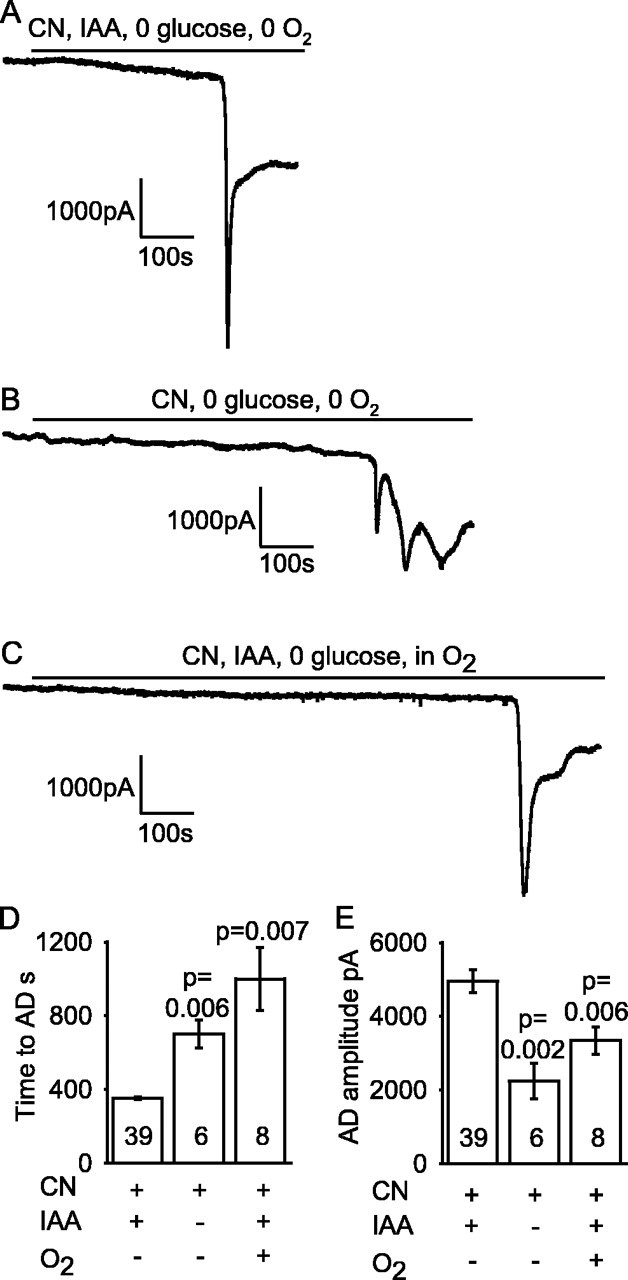
Use of cyanide to block oxidative phosphorylation. A, Ischemia induced by applying oxygen- and glucose-free solution containing 1 mm cyanide (CN) (to block oxidative phosphorylation) and 2 mm iodoacetate (IAA) (to block glycolysis). B, Omitting iodoacetate when blocking oxidative phosphorylation using cyanide (in oxygen- and glucose-free solution) delayed the time to the AD (this cell showed repeated depolarizing currents after the AD). C, Adding oxygen to glucose-free solution containing 1 mm cyanide and 2 mm iodoacetate delayed the time to the AD. D, Mean time to the AD in A-C. E, Mean amplitude of the AD in A-C. Bold numbers show the number of cells studied. p values compare the second and third bars with the first bar in D and E.
Omitting iodoacetate from the cyanide-containing solution to allow glycolysis driven by glycogen breakdown prolonged the latency to the AD by 6 min (Fig. 7B,D) (p = 0.006), as described above when mitochondria were inhibited with rotenone and antimycin.
Surprisingly, if oxygen was present in the solution containing iodoacetate and cyanide and lacking glucose, the AD was delayed by nearly 11 min (p = 0.007; n = 7) (Fig. 7C,D). In contrast, oxygen had no prolonging effect when mitochondria were blocked with rotenone and antimycin (Fig. 5). This suggests that cyanide does not completely block mitochondria (oxygen itself may reduce the cyanide block) (Delhumeau et al., 1994).
The response to simple removal of oxygen and glucose
Figure 9A shows the response to removal of oxygen and glucose from the superfusion solution, without any metabolic blockers being added. The latency to the AD (Fig. 9D, first column) was 4 min longer (p = 0.04) than when rotenone and antimycin were added as well (Fig. 4A, second column) (both in the absence of iodoacetate), presumably because in an open-recording chamber, it is hard to remove all of the oxygen from the superfusing solution, and thus it is hard to completely inhibit mitochondrial ATP production from the substrate produced by glycogen breakdown. Consistent with the presence of a significant amount of residual O2, simple removal of glucose (leaving oxygen present) produced an AD with a latency (p = 0.4) similar to that seen when oxygen and glucose were both removed (Fig. 9B,D). However, the amplitude of the AD current was reduced in the presence of oxygen (Fig. 9E).
Figure 9.

Response of CA1 pyramidal cells to oxygen and glucose deprivation without metabolic blockers. A, Application of oxygen- and glucose-free solution to a pyramidal cell in a slice that had been presoaked in 10 mm glucose induced an AD after ∼18 min. B, Applying glucose-free solution in the presence of oxygen induced an AD at a time not significantly different from when oxygen was absent. C, Oxygen and glucose deprivation in a slice that had been presoaked in 2 mm glucose solution led to an earlier AD. D, Mean time to AD. E, Mean amplitude of the AD current. Bold numbers indicate the number of cells studied. p values compare the second and third bars with the first bar in D and E. Gluc pre 10 or Glu pre 2, Glucose was present at 10 or 2 mm before ischemia.
To check the role of glycogen breakdown, the experiment removing oxygen and glucose was repeated after soaking slices for at least 1 h in solution containing 2 mm glucose to lower the glycogen stores and intracellular glucose levels of the cells (as done for Fig. 2C,D). After this treatment, the latency to the AD seen when glucose and O2 were removed was reduced by 6.5 min (p = 0.005), as shown in Figure 9, C and D, again implying a significant role for glycogenolysis in delaying the AD.
Estimation of the relative size of hippocampal energy stores
In this section, we use the data above to estimate the relative sizes of ATP reserves provided by various biochemical stores in slices from P12 rats. Most brain ATP is used to power ion pumping (Ames, 1992; Rolfe and Brown, 1997; Attwell and Laughlin, 2001). Therefore, we focus on the supply of ATP to the Na+ pump, which prevents the decrease in ion gradients causing the AD.
How long can ATP stores sustain Na+ pumping during severe metabolic inhibition?
When glucose and oxygen are removed at the same time that blockers of ATP production by mitochondria and glycolysis are applied, it takes ∼7.5 min (at 33°C) before the AD occurs in P12 hippocampal slices (Fig. 2). Part of this time will reflect the time needed for the ATP concentration to fall below the level needed to sustain operation of the plasma membrane Na+/K+-ATPase (the catalytic site for ATP hydrolysis has an EC50 value of only 0.4 μm, but the pump may stop working when [ATP] falls below the level needed to activate lower affinity, EC50 = ∼0.4 mm, ATP binding sites) (Dagani and Erecinska, 1987). The remainder of the time will reflect the period needed for ion gradients to decrease once the Na+/K+-ATPase has stopped. The free ATP is initially 2.7 mm (Folbergrova et al., 1997), and the hippocampus (in vivo) consumes ATP at a rate of 0.4 mm/s, calculated from the measured glucose utilization at 37°C of 79 μmol/100 g per minute (Sokoloff et al., 1977), assuming that 31 ATP molecules are produced per glucose (Rolfe and Brown, 1997), and thus when ATP synthesis stops, the existing ATP should be consumed in 2.7/0.4 = 6.8 s at 37°C, or 10.5 s at 33°C, which we use (assuming a Q10 of 3). In addition, ATP can be generated from phosphocreatine and from other nucleoside triphosphates (Fig. 1). The phosphocreatine concentration is twice as high as that of ATP (Raley and Lipton, 1990; Folbergrova et al., 1997), whereas the concentrations of UTP, GTP, and CTP (which can be converted to ATP) when added together give approximately one-third the level of ATP (Pissarek et al., 1999). Thus, phosphocreatine is expected to contribute sufficient ATP to power ∼21 s of ion pumping, whereas other nucleoside triphosphates will power 3.5 s of pumping. These durations will be increased in our experiments if the metabolic activity of hippocampal slices is lower than that of in vivo hippocampus, for example, because of the removal of excitatory input from outside the hippocampus, or if energy use is downregulated in the first few minutes of energy deprivation (as measured in cultured neurons after 1 h of energy deprivation) (Munns et al., 2003).
Glycogenolysis delays the AD by 5.5 min
When hippocampal slices were exposed to severe metabolic inhibition (removal of glucose and oxygen and addition of rotenone and antimycin) but glycolysis was allowed to occur (i.e., no iodoacetate was applied), the AD occurred 5.5 min later (Fig. 2B), and this prolongation was reduced (indeed was not significant) for slices presoaked in low glucose, consistent with glycogen stores (and intracellular glucose) being the source of the extra latency (Fig. 2C,D). If we ignore metabolic compartmentation within the slice by assuming that energy stored as glycogen predominantly in glia (Rosenberg and Dichter, 1985; Kato et al., 1989; Ignacio et al., 1990) can be freely passed to neurons (e.g., as lactate) (Cambray-Deakin et al., 1988; Dringen et al., 1993; Pellerin et al., 1998; Sibson et al., 1998; Magistretti and Pellerin, 1999) and also assume that with mitochondria blocked there is no change in the rate of ATP consumption or in the time needed for ion gradients to decrease after the sodium pump has stopped, then it appears that glycogenolysis can provide ∼5.5 min worth of ATP to maintain sodium pumping and other energy-consuming processes within the cell. Glycogen therefore provides a greater energy store than either free ATP or phosphocreatine.
Energy stored in metabolites downstream of GAPDH
Comparison of the latency to the AD produced by iodoacetate in solution including or lacking oxygen, or in oxygen-containing solution containing or lacking mitochondrial blockers, suggested that already generated products of glycolysis, downstream of the GAPDH enzyme that iodoacetate inhibits, can feed into mitochondria and generate ∼6.5 min worth of ATP. Pyruvate, lactate, citric acid cycle intermediates, nicotinamide adenine dinucleotide (NADH), FADH2, and amino acid oxidation may all contribute to this tail of substrate provision to mitochondria. Fatty acid metabolism, which generates FADH2 for mitochondria, could also theoretically contribute to this increase in ATP production. However, fatty acid oxidation is reported to be of little significance in the brain because of the absence of the enzyme 3-ketoacyl-CoA thiolase (Yang et al., 1987).
Discussion
We investigated the role of different metabolic pathways in preventing the anoxic depolarization produced by energy deprivation in hippocampal slices. Formation of ATP from glycogen (via glycolysis) or from pyruvate, citric acid cycle intermediates, and amino acids (via oxidative phosphorylation) can delay the AD. During transient ischemia, hypoglycemia, or anoxia, these energy reserves might prevent an AD from occurring and be neuroprotective (Swanson and Choi, 1993; Gruetter, 2003). Our data indicate a particularly important role for glycolysis in this regard: when mitochondria are blocked, external glucose prevents an AD from occurring for hours, whereas when glycolysis is blocked, lactate-driven oxidative phosphorylation does not significantly delay the AD.
External glucose prevents the AD from occurring
Even with mitochondrial ATP production blocked, external glucose was sufficient to prevent the AD from occurring. This is surprising, because normally glycolysis provides only 6% of the ATP of the brain (assuming glycolysis does not become more important in brain slices). This might imply that only a small fraction of the ATP production of the brain is needed to prevent the AD. However, when mitochondria are inhibited, ATP production by glycolysis is increased, by the Pasteur effect, by a factor of 4-5 because of increased activity of phosphofructokinase, hexokinase, and glucose transport (Lowry et al., 1964; Drewes and Gilboe, 1973; Depré et al., 1998), and thus there should be much more ATP production than is normally generated by glycolysis. Although P12 animals may rely less on oxidative phosphorylation than older animals and maintain membrane potentials and neuronal excitability through glycolysis alone (Clark et al., 1993; Nabetani et al., 1995), we found identical results in older (P28) rat slices when the oxidative phosphorylation system is mature; i.e., external glucose was sufficient to prevent the AD.
Lactate oxidation does not delay the AD
Although some papers report that lactate supports neuronal activity in the absence of glucose in CA1 (Schurr et al., 1988; Izumi et al., 1994, 1997) and optic nerve (Brown et al., 2003), others find that although lactate helps to maintain ATP levels, it does not allow normal neuronal activity in CA1 (Chih et al., 2001a) and CA3 (Takata and Okada, 1995; Wada et al., 1998). Lactate is converted into pyruvate, which produces ATP via oxidative phosphorylation (Fig. 1), and thus with glycolysis but not mitochondria inhibited, one might expect lactate to maintain the majority of the ATP production and to prevent the AD. When glycolysis was inhibited with iodoacetate, however, adding 5-20 mm lactate did not delay the AD either in P12 or in P28 rats (Fig. 6C,D) and did not prevent an increase in sIPSC frequency or inhibition of excitatory synaptic transmission (Fig. 6F). Thus, in our experiments, mitochondria do not produce significant ATP from superfused lactate (and hence not from lactate released by glia) when glycolysis is inhibited.
Our data are consistent with the findings of Takata and Okada (1995) and Wada et al. (1998) that replacing glucose with lactate abolished synaptic transmission in <20 min (in guinea pig CA3 and dentate gyrus). In contrast, in rat CA1, Schurr et al. (1988) found that replacing glucose by lactate preserved synaptic function, and Izumi et al. (1994) (Fig. 4) found that after 30 min in iodoacetate, the field EPSP was reduced by 80% with glucose present but reduced by only 35% in 10 mm lactate. The results obtained by Schurr et al. (1988) may reflect the use of an interface chamber rather than submerged slices, but the apparent discrepancy with Izumi et al. (1994) resulted from their use of a low concentration of iodoacetate, which does not completely block glycolysis (see Results) and leaving glucose in their solutions. When we used their low concentration of iodoacetate and left glucose in the solution, it took longer for the fEPSP to be inhibited, as expected if ATP could still be made from glycogen and glucose by a glycolysis pathway that was only partially blocked (Fig. 6F). In addition, having lactate present (without glucose) further delayed the inhibition of the fEPSP. Thus, when glycolysis is completely blocked, the amount of ATP made from lactate by mitochondria is too small to delay the inhibition of the fEPSP, but if some ATP is made from glycogen when glycolysis is only partly blocked, the addition of lactate-derived ATP can delay (but not prevent) the fEPSP inhibition.
Metabolic compartmentation
Metabolic compartmentation in the brain, within cells or between cell types, may explain some of our results. It has been suggested (Raffin et al., 1992; Rosenthal and Sick, 1992) that the plasma membrane Na+/K+-ATPase is preferentially fueled by ATP produced from glycolysis (although it is unclear why mitochondrially produced ATP cannot diffuse to plasma membrane Na+ pumps, and an increase in glycolytic rate via the Pasteur effect might explain why mitochondrial block has relatively little effect). Consistent with a metabolic compartmentation within cells in which glycolysis powers ion pumping, glycolytic enzymes have been detected in synaptic locations where energy use on ion pumping is high (Wu et al., 1997; Ikemoto et al., 2003). This could explain why fueling glycolysis with glucose while blocking mitochondria prevents an AD; glycolytic ATP might allow the Na+/K+-ATPase to function sufficiently to maintain transmembrane ion gradients. Indeed, external glucose maintained presynaptic ion gradients sufficiently to prevent the massive spontaneous exocytosis of GABA-containing vesicles that is normally triggered by energy deprivation.
Alternatively, if glycolysis is mostly in glia, which export lactate to neurons to be metabolized by their mitochondria (Pellerin et al., 1998; Sibson et al., 1998; Magistretti and Pellerin, 1999) (but see Chih et al., 2001b), then our data might suggest that the key step in triggering the AD is a decrease in glial [ATP], leading to glial depolarization, which releases K+ and reduces glutamate uptake. This would explain why inhibition of (mainly glial) glycolysis with iodoacetate is sufficient to produce an AD after ∼8 min (Fig. 6A,D), whereas inhibition of (mainly neuronal) mitochondria with rotenone and antimycin (but no iodoacetate) produces an AD only after ∼13 min (Figs. 2B, 4A). It would also explain why an AD can be prevented for >1 h when glucose is present during mitochondrial inhibition (Fig. 3A). Finally, if maintaining ATP levels in glia were important for preventing an AD, it would explain why evolution has placed most glycogen in glia rather than neurons: during metabolic inhibition, the ATP level in glia could be maintained by glycogenolysis.
However, it is not clear why a decreased ATP concentration in glia should trigger an AD. The ATP consumption and the expected K+ leak when the sodium pump is inhibited are both larger in neurons than in glia (Attwell and Laughlin, 2001), suggesting that stopping ATP production will cause neuronal [ATP] to fall faster than glial [ATP] and that neurons will contribute more to the increase in [K+]o, which slows and then reverses glutamate transporters, releasing the glutamate that generates the AD (Rossi et al., 2000). The possibility that the AD is triggered by a decrease in glial ion gradients slowing or reversing the main GLT-1 glutamate transporter in glia is contradicted by the fact that blocking or knocking out GLT-1 does not alter the time of the AD (Rossi et al., 2000; Hamann et al., 2002), even when mitochondria are blocked (Fig. 3C). In contrast, knocking out the neuronal transporter EAAC1 delays the AD threefold (Gebhardt et al., 2002), suggesting that the transporters that release glutamate are mainly in neurons. For these reasons, one might expect a decreased ATP level in neurons, rather than glia, to be the factor precipitating the AD.
O2-sensing ion channels do not influence AD latency
The latency of the AD seen during metabolic inhibition with rotenone, antimycin, iodoacetate, and glucose removal was not affected by the presence or absence of oxygen (Fig. 5), suggesting that O2-sensing channels do not play a role in determining the AD latency.
Comparison of cyanide and rotenone/antimycin as mitochondrial blockers
The AD produced using cyanide as a mitochondrial blocker (with iodoacetate to block glycolysis) was similar to that seen when blocking mitochondria with rotenone plus antimycin, but the AD latency was reduced by 20% when using cyanide. The potentiating action of cyanide on NMDA receptors containing NR2A subunits (Patel et al., 1994; Arden et al., 1998), together with the fact that the AD is mostly produced by activation of NMDA receptors (Rossi et al., 2000), seems a likely explanation for this slight acceleration.
A hierarchy of energy stores
The estimates of energy stores in P12 slices described in Results can be summarized as the following hierarchy of times (at 33°C) for which ATP can be produced by the different stores: pyruvate/citric acid cycle intermediates/amino acid oxidation when mitochondria are functioning (390 s) > glycogen when mitochondria are inhibited (330 s) > phosphocreatine (21 s) > ATP (10.5 s) > other nucleoside triphosphates (3.5 s). If a metabolic insult is of limited duration (e.g., a clot is rapidly cleared from a blood vessel), these stores may be able to prevent an AD from occurring and thus prevent the massive release of glutamate by transporter reversal, which triggers neuronal death.
Footnotes
This work was supported by the Wellcome Trust, the European Union, and a Wolfson-Royal Society Award to D.A. and by Chevening and Overseas Research Student awards to R.K. N.J.A. and R.K. were in the 4 year PhD Program in Neuroscience at University College London.
Correspondence should be addressed to David Attwell, Department of Physiology, University College London, Gower Street, London WC1E 6BT, UK. E-mail: D.Attwell@ucl.ac.uk.
N. J. Allen's present address: Department of Neurobiology, Stanford University School of Medicine, Stanford, CA 94305-5125.
Copyright © 2005 Society for Neuroscience 0270-6474/05/250848-12$15.00/0
N.J.A. and R.K. contributed equally to this work.
References
- Allen NJ, Attwell D (2004) The effect of simulated ischaemia on spontaneous GABA release in area CA1 of the juvenile rat hippocampus. J Physiol (Lond) 561: 485-498. [DOI] [PMC free article] [PubMed] [Google Scholar]
- Allen NJ, Rossi DJ, Attwell D (2004) Sequential release of GABA by exocytosis and reversed uptake leads to neuronal swelling in simulated ischemia of hippocampal slices. J Neurosci 24: 3837-3849. [DOI] [PMC free article] [PubMed] [Google Scholar]
- Ames III A (1992) Energy requirements of CNS cells as related to their function and to their vulnerability to ischemia: a commentary based on studies on retina. Can J Physiol Pharmacol [Suppl] 70: S158-S164. [DOI] [PubMed] [Google Scholar]
- Arden SR, Sinor JD, Potthof WK, Aizenman E (1998) Subunit-specific interactions of cyanide with the N-methyl-d-aspartate receptor. J Biol Chem 273: 21505-21511. [DOI] [PubMed] [Google Scholar]
- Attwell D, Laughlin SB (2001) An energy budget for signaling in the grey matter of the brain. J Cereb Blood Flow Metab 21: 1133-1145. [DOI] [PubMed] [Google Scholar]
- Brown AM (2004) Brain glycogen re-awakened. J Neurochem 89: 537-552. [DOI] [PubMed] [Google Scholar]
- Brown AM, Tekkok SB, Ransom BR (2003) Glycogen regulation and functional role in mouse white matter. J Physiol (Lond) 549: 501-512. [DOI] [PMC free article] [PubMed] [Google Scholar]
- Cambray-Deakin M, Pearce B, Morrow C, Murphy S (1988) Effects of neurotransmitters on astrocyte glycogen stores in vitro J Neurochem 51: 1852-1857. [DOI] [PubMed] [Google Scholar]
- Chih CP, He J, Sly TS, Roberts Jr EL (2001a) Comparison of glucose and lactate as substrates during NMDA-induced activation of hippocampal slices. Brain Res 893: 143-154. [DOI] [PubMed] [Google Scholar]
- Chih CP, Lipton P, Roberts Jr EL (2001b) Do active neurons really use lactate rather than glucose? Trends Neurosci 24: 573-578. [DOI] [PubMed] [Google Scholar]
- Choi DW, Rothman SM (1990) The role of glutamate neurotoxicity in hypoxic-ischemic neuronal death. Annu Rev Neurosci 13: 171-182. [DOI] [PubMed] [Google Scholar]
- Clark JB, Bates TE, Cullingford T, Land JM (1993) Development of enzymes of energy metabolism in the neonatal mammalian brain. Dev Neurosci 15: 174-180. [DOI] [PubMed] [Google Scholar]
- Dagani F, Erecinska M (1987) Relationships among ATP synthesis, K+ gradients, and neurotransmitter amino acid levels in isolated rat brain synaptosomes. J Neurochem 49: 1229-1240. [DOI] [PubMed] [Google Scholar]
- Delhumeau G, Cruz-Mendoza AM, Gomez Lojero C (1994) Protection of cytochrome c oxidase against cyanide inhibition by pyruvate and alpha-ketoglutarate: effect of aeration in vitro Toxicol Appl Pharmacol 126: 345-351. [DOI] [PubMed] [Google Scholar]
- Depré C, Rider MH, Hue L (1998) Mechanisms of control of heart glycolysis. Eur J Biochem 258: 277-290. [DOI] [PubMed] [Google Scholar]
- Drewes L, Gilboe D (1973) Glycolysis and the permeation of glucose and lactate in the isolated perfused dog brain during anoxia and postanoxic recovery. J Biol Chem 248: 2489-2496. [PubMed] [Google Scholar]
- Dringen R, Gebhardt R, Hamprecht B (1993) Glycogen in astrocytes: possible function as lactate supply for neighboring cells. Brain Res 623: 208-214. [DOI] [PubMed] [Google Scholar]
- Erecinska M, Silver IA (1994) Ions and energy in mammalian brain. Prog Neurobiol 43: 37-71. [DOI] [PubMed] [Google Scholar]
- Fellows LK, Boutelle MG, Fillenz M (1992) Extracellular brain glucose levels reflect local neuronal activity: a microdialysis study in awake freely moving rats. J Neurochem 59: 2141-2147. [DOI] [PubMed] [Google Scholar]
- Ferreira IL, Duarte CB, Carvalho AP (1997) “Chemical ischemia” in cultured retina cells: the role of excitatory amino acid receptors and of energy levels on cell death. Brain Res 768: 157-166. [DOI] [PubMed] [Google Scholar]
- Fiala JC, Kirov SA, Feinberg MD, Petrak LJ, George P, Goddard A, Harris KM (2003) Timing of neuronal and glial ultrastructure disruption during brain slice preparation and recovery in vitro J Comp Neurol 465: 90-103. [DOI] [PubMed] [Google Scholar]
- Folbergrova J, Li PA, Uchino H, Smith ML, Siesjo BK (1997) Changes in the bioenergetic state of rat hippocampus during 2.5 min of ischemia, and prevention of cell damage by cyclosporin A in hyperglycemic subjects. Exp Brain Res 114: 44-50. [DOI] [PubMed] [Google Scholar]
- Fowler JC (1990) Adenosine antagonists alter the synaptic response to in vitro ischemia in the rat hippocampus. Brain Res 509: 331-334. [DOI] [PubMed] [Google Scholar]
- Fowler JC (1992) Escape from inhibition of synaptic transmission during in vitro hypoxia and hypoglycemia in the hippocampus. Brain Res 573: 169-173. [DOI] [PubMed] [Google Scholar]
- Gebhardt C, Korner R, Heinemann U (2002) Delayed anoxic depolarizations in hippocampal neurons of mice lacking the excitatory amino acid carrier 1. J Cereb Blood Flow Metab 22: 569-575. [DOI] [PubMed] [Google Scholar]
- Gruetter R (2003) Glycogen: the forgotten cerebral energy store. J Neurosci Res 74: 179-183. [DOI] [PubMed] [Google Scholar]
- Hamann M, Rossi DJ, Marie H, Attwell D (2002) Knocking out the glial glutamate transporter GLT-1 reduces glutamate uptake but does not affect hippocampal glutamate dynamics in early simulated ischaemia. Eur J Neurosci 15: 308-314. [DOI] [PubMed] [Google Scholar]
- Hammarstrom AK, Gage PW (2000) Oxygen-sensing persistent sodium channels in rat hippocampus. J Physiol (Lond) 529: 107-118. [DOI] [PMC free article] [PubMed] [Google Scholar]
- Hansen AJ (1985) Effect of anoxia on ion distribution in the brain. Physiol Rev 65: 101-148. [DOI] [PubMed] [Google Scholar]
- Ignacio PC, Baldwin BA, Vijayan VK, Tait RC, Gorin FA (1990) Brain isozyme of glycogen phosphorylase: immunohistological localization within the central nervous system. Brain Res 529: 42-49. [DOI] [PubMed] [Google Scholar]
- Ikemoto A, Bole DG, Ueda T (2003) Glycolysis and glutamate accumulation into synaptic vesicles. J Biol Chem 278: 5929-5940. [DOI] [PubMed] [Google Scholar]
- Izumi Y, Benz AM, Zorumski CF, Olney JW (1994) Effects of lactate and pyruvate on glucose deprivation in rat hippocampal slices. NeuroReport 5: 617-620. [DOI] [PubMed] [Google Scholar]
- Izumi Y, Benz AM, Katsuki H, Zorumski CF (1997) Endogenous monocarboxylates sustain hippocampal synaptic function and morphological integrity during energy deprivation. J Neurosci 17: 9448-9457. [DOI] [PMC free article] [PubMed] [Google Scholar]
- Jiang C, Haddad GG (1994) A direct mechanism for sensing low oxygen levels by central neurons. Proc Natl Acad Sci USA 91: 7198-7201. [DOI] [PMC free article] [PubMed] [Google Scholar]
- Kato K, Shimizu A, Kurobe N, Takashi M, Koshikawa T (1989) Human brain-type glycogen phosphorylase: quantitative localization in human tissues determined with an immunoassay system. J Neurochem 52: 1425-1432. [DOI] [PubMed] [Google Scholar]
- Lehre KP, Levy LM, Ottersen OP, Storm-Mathisen-J, Danbolt NC (1995) Differential expression of two glial glutamate transporters in the rat brain: quantitative and immunocytochemical observations. J Neurosci 15: 1835-1853. [DOI] [PMC free article] [PubMed] [Google Scholar]
- Levy LM, Warr O, Attwell D (1998) Stoichiometry of the glial glutamate transporter GLT-1 expressed inducibly in a Chinese hamster ovary cell line selected for low endogenous Na+-dependent glutamate uptake. J Neurosci 18: 9620-9628. [DOI] [PMC free article] [PubMed] [Google Scholar]
- Lipton P (1989) Regulation of glycogen in the dentate gyrus of the in vitro guinea pig hippocampus: effect of combined deprivation of glucose and oxygen. J Neurosci Methods 28: 147-154. [DOI] [PubMed] [Google Scholar]
- Longsworth LG (1953) Diffusion measurements at 25° of aqueous solutions of amino acids, peptides and sugars. J Am Chem Soc 75: 5705-5709. [Google Scholar]
- Lowry OH, Passonneau JV, Hasselberger FX, Schulz DW (1964) Effect of ischemia on known substrates and cofactors of the glycolytic pathway in brain. J Biol Chem 239: 18-30. [PubMed] [Google Scholar]
- Madl JE, Burgesser K (1993) Adenosine triphosphate depletion reverses sodium-dependent, neuronal uptake of glutamate in rat hippocampal slices. J Neurosci 13: 4429-4444. [DOI] [PMC free article] [PubMed] [Google Scholar]
- Magistretti PJ, Pellerin L (1999) Cellular mechanisms of brain energy metabolism and their relevance to functional brain imaging. Phil Trans R Soc Lond B Biol Sci 354: 1155-1163. [DOI] [PMC free article] [PubMed] [Google Scholar]
- McBain CJ, Traynelis SF, Dingledine R (1990) Regional variation of extracellular space in the hippocampus. Science 249: 674-677. [DOI] [PubMed] [Google Scholar]
- Munns SE, Meloni BP, Knuckey NW, Arthur PG (2003) Primary cortical neuronal cultures reduce cellular energy utilization during anoxic energy deprivation. J Neurochem 87: 764-772. [DOI] [PubMed] [Google Scholar]
- Nabetani M, Okada Y, Kawai S, Nakamura H (1995) Neural activity and the levels of high energy phosphates during deprivation of oxygen and/or glucose in hippocampal slices of immature and adult rats. Int J Dev Neurosci 13: 3-12. [DOI] [PubMed] [Google Scholar]
- Patel MN, Peoples RW, Yim GK, Isom GE (1994) Enhancement of NMDA responses by cyanide. Neurochem Res 19: 1319-1323. [DOI] [PubMed] [Google Scholar]
- Pellerin L, Pellegri G, Bittar PG, Charnay Y, Bouras C, Martin JL, Stella N, Magistretti PJ (1998) Evidence supporting the existence of an activity-dependent astrocyte-neuron lactate shuttle. Dev Neurosci 20: 291-299. [DOI] [PubMed] [Google Scholar]
- Pissarek M, Reinhardt R, Reichelt C, Manaenko A, Krauss G, Illes P (1999) Rapid assay for one-run determination of purine and pyrimidine nucleoside contents in neocortical slices and cell cultures. Brain Res Brain Res Protoc 4: 314-321. [DOI] [PubMed] [Google Scholar]
- Rader RK, Lanthorn TH (1989) Experimental ischemia induces a persistent depolarization blocked by decreased calcium and NMDA antagonists. Neurosci Lett 99: 125-130. [DOI] [PubMed] [Google Scholar]
- Raffin CN, Rosenthal M, Busto R, Sick TJ (1992) Glycolysis, oxidative metabolism, and brain potassium ion clearance. J Cereb Blood Flow Metab 12: 34-42. [DOI] [PubMed] [Google Scholar]
- Raley KM, Lipton P (1990) NMDA receptor activation accelerates ischemic energy depletion in the hippocampal slice and the demonstration of a threshold for ischemic damage to protein synthesis. Neurosci Lett 110: 118-123. [DOI] [PubMed] [Google Scholar]
- Reiner PB, Laycock AG, Doll CJ (1990) A pharmacological model of ischemia in the hippocampal slice. Neurosci Lett 119: 175-178. [DOI] [PubMed] [Google Scholar]
- Roettger V, Lipton P (1996) Mechanism of glutamate release from rat hippocampal slices during in vitro ischemia. Neuroscience 75: 677-685. [DOI] [PubMed] [Google Scholar]
- Rolfe DFS, Brown GC (1997) Cellular energy utilization and molecular origin of standard metabolic rate in mammals. Physiol Rev 77: 731-758. [DOI] [PubMed] [Google Scholar]
- Rosenberg PA, Dichter MA (1985) Glycogen accumulation in rat cerebral cortex in dissociated cell culture. J Neurosci Methods 15: 101-112. [DOI] [PubMed] [Google Scholar]
- Rosenthal M, Sick TJ (1992) Glycolytic and oxidative metabolic contributions to potassium ion transport in rat cerebral cortex. Can J Physiol Pharmacol [Suppl] 70: S165-S169. [DOI] [PubMed] [Google Scholar]
- Rossi DJ, Oshima T, Attwell D (2000) Glutamate release in severe brain ischaemia is mainly by reversed uptake. Nature 403: 316-321. [DOI] [PubMed] [Google Scholar]
- Saitoh M, Okada Y, Nabetani M (1994) Effect of mannose, fructose and lactate on the preservation of synaptic potentials in hippocampal slices. Neurosci Lett 25: 125-128. [DOI] [PubMed] [Google Scholar]
- Schurr A, West CA, Rigor BM (1988) Lactate-supported synaptic function in the rat hippocampal slice preparation. Science 240: 1326-1328. [DOI] [PubMed] [Google Scholar]
- Sibson NR, Dhankar A, Mason GF, Rothman DL, Behar KL, Shulman RG (1998) Stoichiometric coupling of brain glucose metabolism and glutamatergic neuronal activity. Proc Natl Acad Sci USA 95: 316-321. [DOI] [PMC free article] [PubMed] [Google Scholar]
- Sokoloff L, Reivich M, Kennedy C, Des Rosiers MH, Patlak CS, Pettigrew KD, Sakaurada O, Shinohara M (1977) The [14C]deoxyglucose method for the measurement of local cerebral glucose utilization: theory, procedure and normal values in the conscious and anesthetized albino rat. J Neurochem 28: 897-916. [DOI] [PubMed] [Google Scholar]
- Swanson RA, Choi DW (1993) Glial glycogen stores affect neuronal survival during glucose deprivation in vitro J Cereb Blood Flow Metab 13: 162-169. [DOI] [PubMed] [Google Scholar]
- Szatkowski M, Barbour B, Attwell D (1990) Nonvesicular release of glutamate from glial cells by reversed electrogenic glutamate uptake. Nature 348: 443-446. [DOI] [PubMed] [Google Scholar]
- Takata T, Okada Y (1995) Effects of deprivation of oxygen or glucose on the neural activity in the guinea pig hippocampal slice—intracellular recording study of pyramidal neurons. Brain Res 683: 109-116. [DOI] [PubMed] [Google Scholar]
- Turrens JF (2003) Mitochondrial formation of reactive oxygen species. J Physiol (Lond) 552: 335-344. [DOI] [PMC free article] [PubMed] [Google Scholar]
- Vergun O, Sobolevsky AI, Yelshansky MV, Keelan J, Khodorov BI, Duchen MR (2001) Exploration of the role of reactive oxygen species in glutamate neurotoxicity in rat hippocampal neurones in culture. J Physiol (Lond) 531: 147-163. [DOI] [PMC free article] [PubMed] [Google Scholar]
- Wada H, Okada Y, Uzuo T, Nakamura H (1998) The effects of glucose, mannose, fructose and lactate on the preservation of neural activity in hippocampal slices from the guinea pig. Brain Res 788: 144-150. [DOI] [PubMed] [Google Scholar]
- Wu K, Aoki C, Elste A, Rogalski-Wilk AA, Siekevitz P (1997) The synthesis of ATP by glycolytic enzymes in the postsynaptic density and the effect of endogenously generated nitric oxide. Proc Natl Acad Sci USA 94: 13273-13278. [DOI] [PMC free article] [PubMed] [Google Scholar]
- Yang SY, He XY, Schulz H (1987) Fatty acid oxidation in rat brain is limited by the low activity of 3-ketoacyl-coenzyme A thiolase. J Biol Chem 262: 13027-13032. [PubMed] [Google Scholar]
- Zeevalk GD, Schoepp D, Nicklas WJ (1995) Excitotoxicity at both NMDA and non-NMDA glutamate receptors is antagonized by aurintricarboxylic acid: evidence for differing mechanisms of action. J Neurochem 64: 1749-1758. [DOI] [PubMed] [Google Scholar]