Abstract
For decades, dental schools in the United States have endured a significant faculty shortage. Studies have determined that the top 2 sources of dental faculty are advanced education programs and private practice. Those who have completed both DDS and PhD training are considered prime candidates for dental faculty positions. However, there is no national database to track those trainees and no evidence to indicate that they entered academia upon graduation. The objective of this study was to assess outcomes of dental school–affiliated oral sciences PhD program enrollment, graduates, and placement between 1994 and 2016. Using the American Dental Association annual survey of advanced dental education programs not accredited by the Commission on Dental Accreditation and data obtained from 22 oral sciences PhD programs, we assessed student demographics, enrollment, graduation, and placement. Based on the data provided by program directors, the average new enrollment was 33, and graduation was 26 per year. A total of 605 graduated; 39 did not complete; and 168 were still in training. Among those 605 graduates, 211 were faculty in U.S. academic institutions, and 77 were faculty in foreign institutions. Given that vacant budgeted full-time faculty positions averaged 257 per year during this period, graduates from those oral sciences PhD programs who entered academia in the United States would have filled 9 (3.6%) vacant faculty positions per year. Therefore, PhD programs have consistently generated only a small pipeline of dental school faculty. Better mentoring to retain talent in academia is necessary. Stronger support and creative funding plans are essential to sustain the PhD program. Furthermore, the oral sciences PhD program database should be established and maintained by dental professional organizations to allow assessments of training models, trends of enrollment, graduation, and placement outcomes.
Keywords: academic, education, outcomes, dental schools, survey, demographics
Introduction
The 2014 American Dental Education Association survey of vacant budgeted faculty positions revealed a prolonged faculty shortage over the preceding 2 decades (Kennedy and Hunt 1998; American Dental Education Association 2014–2015; Wanchek et al. 2016). There continues to be a need for more faculty to support dental education. Among the 66 dental schools in the United States, 28 offered PhD training in oral or biomedical sciences between 1994 and 2016. The American Dental Association (ADA) surveys these PhD program enrollments and graduates annually. However, no analytic data exist regarding trends of new enrollment for these PhD programs or the placement of their graduates. Upon graduation, these PhD students are presumed to be prime candidates for dental school faculty positions; however, there is no evidence to validate or disprove such an assumption. This lack of oral sciences PhD program–specific data has made it difficult to gauge how many students are in training and how many graduates hold faculty positions to support the education and research mission of the dental profession.
Well-qualified dental faculty are essential to achieve the educational, patient care, and research missions of dental schools. Yet, as the U.S. economy sustains its vigor, the income difference between practicing dentists and academics continues to widen; thus, attracting dental graduates or practitioners to academia becomes more challenging. U.S. dental schools are consequently confronted with the problem of a chronic faculty shortage (Kennedy and Hunt 1998). Between 1994 and 2015, vacant budgeted full-time faculty positions averaged 257 per year (Wanchek et al. 2015). Between 2006 and 2010, a significant decrease from 374 to 194 positions occurred as schools experienced budget cuts (Wanchek et al. 2015). From 2011 to 2014, about 15% (or 38.5) of those vacant budgeted full-time faculty positions were basic sciences and research positions (Wanchek et al. 2015), which may be best filled by individuals who have completed a rigorous graduate training program with significant research experiences.
According to Wanchek et al. (2015), the primary sources of new faculty aged 30 to 39 y included private practice (32.8%), advanced dental education (25.2%), and faculty positions at other schools (15.6%). Men were more likely (57.9%) than women (46.8%) to enter academia from private practice. Female faculty (19.2%) were more likely than male faculty (9.8%) to come from advanced degree programs. Recruiting students in graduate studies to enter academia has been a consistent approach; therefore, sustaining rigorous graduate programs is a potential strategy to build a stable pipeline of dental faculty. Although the ADA surveys enrollment and graduates of advanced dental education programs on an annual basis, no aggregate data analyses exist to allow a confident projection of trends in enrollment, graduates, and placement.
The purpose of this study was to collect and analyze available data from ADA annual surveys and dental school–affiliated PhD programs from 1994 to 2016 (ADA Health Policy Institute 1994–2016). The objective was to examine program data to understand whether the oral sciences PhD programs were consistently enrolling students and to determine what percentage of those PhD students entered the dental faculty workforce upon completion of their training.
Methods and Materials
The study protocol was reviewed and exempted by the Institutional Review Board at the University of Michigan.
Oral sciences PhD program enrollment and graduation data were collected from the ADA annual survey of advanced dental education in oral sciences from 1994 to 2016 (ADA Health Policy Institute 1994–2016). The specific table used is entitled “Dental School Enrollment and Graduates of Advanced Programs Not Accredited by the Commission on Dental Accreditation.” Basic science PhD programs were included in this study, such as oral biology, craniofacial biology, biomaterials, microbiology, anatomy, histology, pathology, physiology, epidemiology, and oral sciences, whereas clinical sciences programs were excluded (e.g., anesthesiology, restorative dentistry, dental diagnostic sciences, dental implantology, operative dentistry, preventive dentistry).
Each ADA survey contains data from the previous academic year. Survey data from 1993 were obtained to calculate the new enrollment in 1994. The data extracted from ADA annual surveys were compiled, and the number of newly enrolled students and graduates per year was analyzed.
Separately, a survey to obtain PhD program affiliation, year founded, student and graduate demographics, degree type, and placement data was constructed, reviewed, and exempted by the Institutional Review Board at the University of Michigan. Following an Internet search and website review of 66 dental schools in the United States in July 2016 and institutional training programs (T32) funded by the National Institute for Dental and Craniofacial Research in September 2016, 28 PhD programs were identified and their directors contacted by email to provide study objective and project description. Next, program directors were immediately telephoned to invite their participation and to answer their questions about the study. Of those 28 PhD programs, 3 enrolled students within the study time frame but were inactive in 2016. Follow-up phone calls and emails at monthly intervals continued from November 2016 to April 2017 to encourage participation.
The survey of program directors requested that all program students be listed chronologically and anonymously. In addition, year of initial enrollment, degree type, year of graduation, sex, ethnicity, placement, and location were required. Students who did not complete their training or students who were still in training at the time of survey were included in the analyses.
Because oral sciences PhD programs differ significantly in terms of degrees offered, years in operation, number of students enrolled, and so on, we targeted an 80% response rate. The assumption was that having data sets from the majority of the PhD programs would allow meaningful data analyses and a scientific report of study outcomes. Data sets from the ADA and program surveys were compiled, cross-checked, and analyzed. When discrepancies were encountered between those data sets, the program directors of interest were contacted, and their confirmed reports were used as the source of correct information. Excel spreadsheets were created, and statistical analyses and graphs were constructed (Microsoft Office 2011). Specifically, we used chi-square analyses for comparisons and set the level of statistical significance at P < 0.01. This study was conducted in compliance with the “Recommendations for the Conduct, Reporting, Editing, and Publication of Scholarly Work in Medical Journals” (International Committee of Medical Journal Editors 2016), and the STROBE checklist (Institute of Social and Preventive Medicine 2007) was referenced for the preparation of the study protocol and report.
Results
ADA surveys from 1993 to 2016 were obtained from the Hatcher Graduate Library at the University of Michigan and the ADA Library. The specific table containing PhD program enrollment and graduate data was compared with the same data points from the year before to determine the number of new enrollment and graduates. These numbers and the number of programs with active enrollment were calculated for academic years 1994 to 2015.
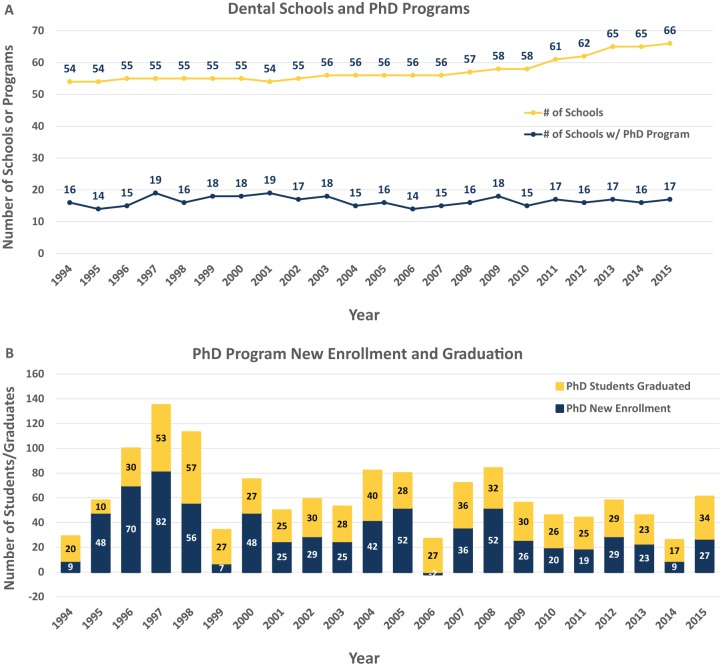
According to the ADA annual surveys, although the number of dental schools in the United States has increased, the number of oral sciences PhD program remained unchanged from 1994 to 2016. Over the most recent 5 y, among the 65 or 66 dental schools, 21 had active PhD programs, of which 16 or 17 programs were enrolling new PhD students (Fig. 1A; note that the number of dental schools and programs fluctuated by 1 each during the time span—thus, the dual values for each). On average, 33 students per year were enrolled during the study period (Fig. 1B). A decrease of enrollment to 21 students per year occurred between 2011 and 2015. The number of program graduates was approximately 30 per year over the study period and approximately 26 per year in the most recent 5 y.
Figure 1.
The American Dental Association annual survey of oral sciences PhD programs in the United States from 1994 to 2015: (A) number of dental schools and number of oral sciences PhD programs and (B) PhD program new enrollment and graduates. The new enrollment count in 2006 may be a result of attrition, reporting errors, or underreporting.
Data from those 22 surveys completed by program directors were cross-checked against data from the ADA annual surveys; then, program data were analyzed to assess student demographics, degree type, time to degree, location, and placement.
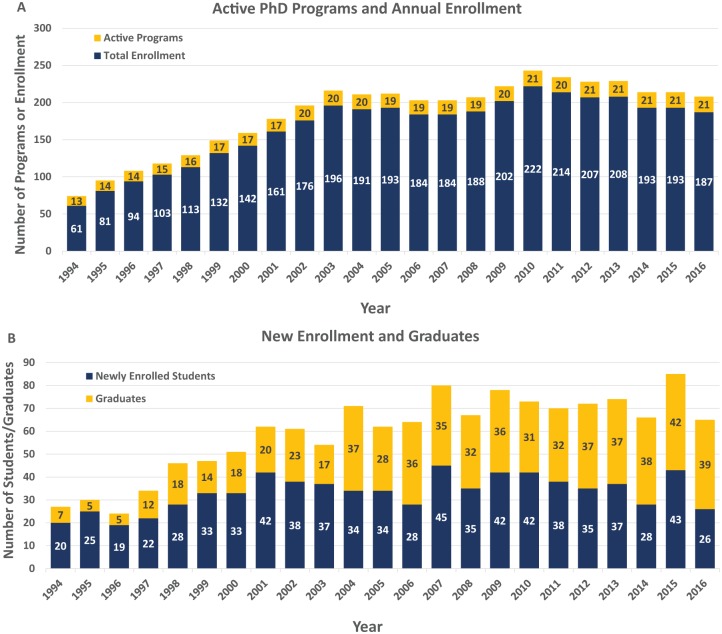
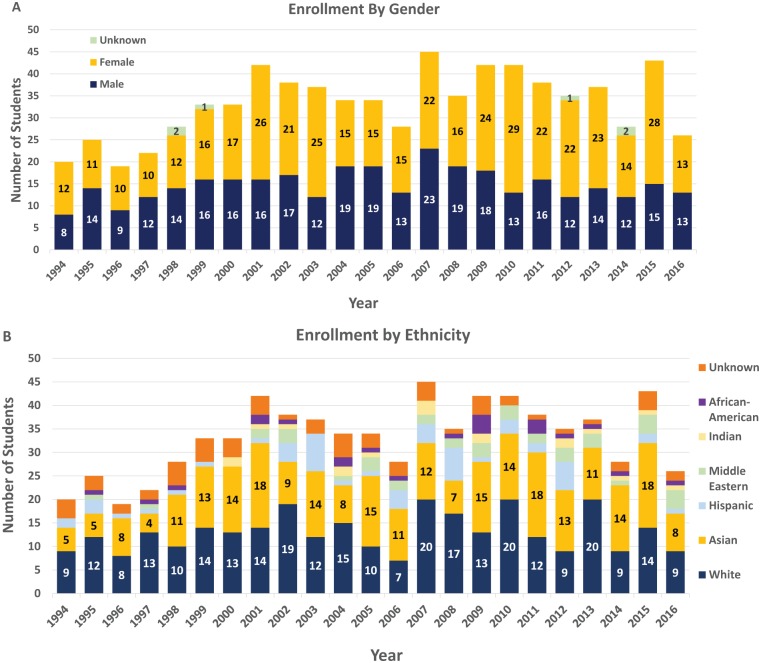
The primary affiliations of the 22 programs surveyed were as follows: 10 programs were based in dental schools, 7 in health science centers, and 5 in graduate schools. Active collaboration between the primary affiliation and other academic units was common. The program directors reported a total of 812 students enrolled and/or graduated between 1994 and 2016. Among those students, 41 enrolled before 1994 and 771 after 1994; 605 graduated; 39 did not complete; and 168 were still in the program. The average new enrollment was 33 per year and graduation was 26 per year from 1994 to 2016. Over the most recent 5 y, while new enrollment remained the same, the number of graduates had increased to 34 per year (Fig. 2). Of the 812 students and graduates reported in these surveys, there were more females (54.7%) than males (44.5%; Fig. 3A). Students’ ethnicities were reported as White (39.1%), Asian (34.7%), Hispanic (7.1%), Middle Eastern (5.2%), Black (2.9%), Indian (2.4%), and unknown/not reported (8.6%; Fig. 3B).
Figure 2.
Oral sciences PhD programs from 1994 to 2016 based on the data from 22 programs: (A) number of programs and total enrollment and (B) number of new enrollment and graduates.
Figure 3.
Oral sciences PhD programs from 1994 to 2016 based on the data from 22 programs: (A) total enrollment by sex and (B) total enrollment by ethnicity.
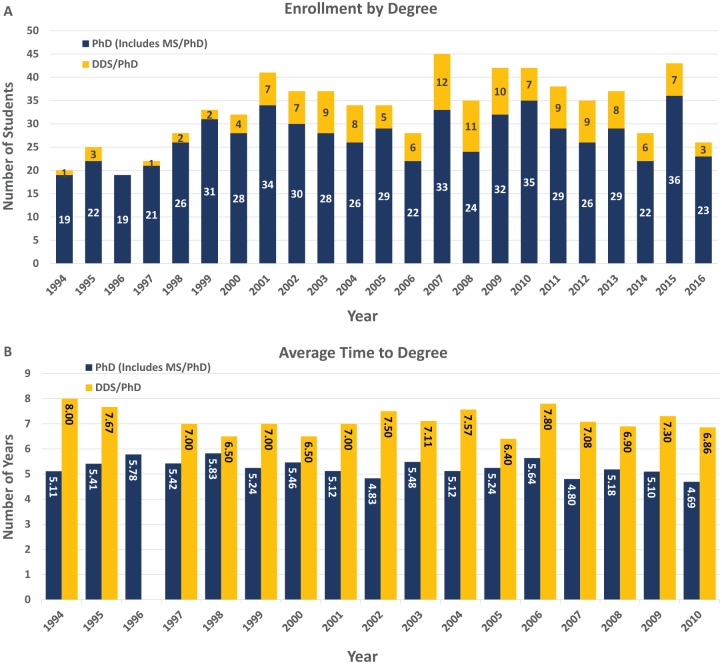
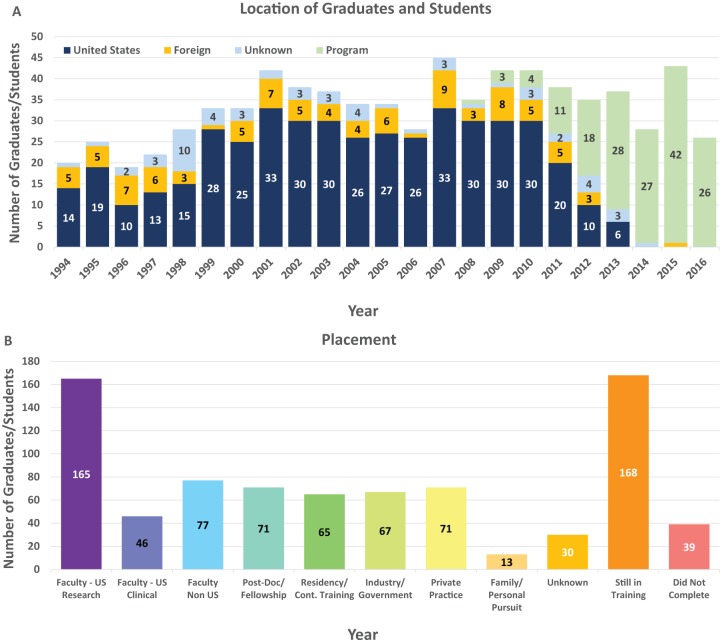
The majority of the students pursued a PhD (80%), while those who pursued a DDS/PhD (18%) or MS/PhD (2.0%) accounted for only 20% of the enrollees (Fig. 4A). For PhD students, it took an average of >5 y to complete their PhD training, with an annual duration of degree completion ranging between 4.69 and 5.83 y. For DDS/PhD students, it took >7 y, with the annual duration of degree completion ranging from 6.40 to 8.00 y (Fig. 4B). The attrition rate was 5.1% for DDS/PhD training and 4.6% for PhD training (P > 0.01; Appendix Fig. 1A). Among the graduates, 75.5% resided in the United States, 14.9% outside the United States, and 9.6% unknown (Fig. 5A).
Figure 4.
Oral sciences PhD program students’ and graduates’ (A) degree type and (B) time to degree from 1994 to 2016 based on the data from 22 programs. There were no DDS/PhD graduates in 1996.
Figure 5.
Oral sciences PhD program students’ and graduates’ (A) location and (B) placement from 1994 to 2016 based on the data from 22 programs. Data from each year represent the location or placement of the individuals who were first enrolled in that year.
When students’ and graduates’ locations were evaluated by degree type, the majority of DDS/PhD graduates (94.8%) remained in the United States, while 72% of the PhD graduates resided in the United States, 17.6% were outside the United States, and 10.4% were unknown (Appendix Fig. 1B). Among those 605 graduates, 211 (34.9%) were faculty in the U.S. academic institutions; 77 (12.7%) were faculty in foreign institutions; 67 (11.1%) were employed in industry/government agencies; 71 (11.7%) worked in private practice; 71 (11.7%) were in postdoctoral training; and 65 (10.7%) were in residency/continued training (Fig. 5B). When compared with the DDS/PhD group (29.7%), a significantly higher percentage of the PhD graduates entered academia (50.8%; P < 0.01). Twenty-six (28.6%) DDS/PhD graduates entered private practice, as opposed to only 45 (8.8%) PhD graduates (P < 0.01; Appendix Fig. 2A).
More female graduates (14.1%) than male graduates (8.4%) pursued postdoctoral fellowship or residency training, but the difference was not statistically significant. Likewise, more female graduates (2.3%) than male graduates (0.8%) engaged in family care or personal pursuits; this difference was also not statistically significant (P > 0.01). The number of male graduates in faculty positions were similar to the number of female graduates in faculty positions (P > 0.01). Furthermore, 18.2% of male graduates and 16.7% of female graduates were affiliated with academic institutions in the United States. There was no difference in the likelihood of selecting private practice as a career option between female and male graduates (Appendix Fig. 2B). When compared with the White graduates, non-White graduates were no less likely to enter academia in the United States or private practice (P > 0.01; Appendix Fig. 2C).
The ratio of graduates who entered academia in the United States was 119 of 280 (42.5%) in 1994 to 2003 and 70 of 283 (24.7%) in 2004 to 2013. This comparative result may seem concerning. However, note that significantly more graduates in 2004 to 2013 held faculty positions in foreign institutions (49 vs. 28) and more graduates continued to pursue postdoctoral or specialty training (100 vs. 33) than the group in 1994 to 2003 (Appendix Table). It will be important to follow up on the career choices of those individuals in continued training.
The currently enrolled graduate students reflected changing demographics. The racial/ethnic breakdown of the 168 students who were still in training at the time of this survey was as follows: 63 students, White; 64, Asian; 17, Middle Eastern; 5, Hispanic; 5, African American; 4, Indian; and 10, unknown or not reported. Among these students, 127 were pursuing PhD (75.6%) training and 41 (24.4%), DDS/PhD training. Among the 605 graduates, significantly more individuals completed PhD training (85%) than DDS/PhD training (15%; P < 0.01).
According to program directors’ reports, 211 oral sciences PhD graduates entered academia in the United States between 1994 and 2016. Given that vacant faculty positions averaged 257 per year from 1994 to 2015, graduates from those 22 oral sciences PhD programs who entered academia in the United States would have filled only 3.6% of the vacant dental faculty positions per year during this period.
Discussion
In this study, the oldest oral sciences PhD program in the United States, as reported by program directors, was founded in 1964. More than half the 22 oral sciences PhD programs were affiliated with either health science centers or graduate schools, although their students conducted dissertation research with dental school faculty. Programs primarily affiliated with dental schools also collaborated with other academic units to broaden didactic and dissertation research options for their PhD students. The program director survey participation rate was 78.6%. While this fell short of the targeted 80% rate, the compiled data accounted for 104% of the enrollment and 92.5% of the graduation data of the ADA annual surveys from 1994 to 2016.
Based on the ADA annual surveys, a decrease of oral sciences PhD enrollment occurred—from an average of 39 per year in 1994 to 2010 to 21 per year in 2011 to 2015—yet the graduation rate was sustained at 26 per year during this period. However, based on the program directors’ survey, 22 programs collectively enrolled an average of 33 new students per year in 1994 to 2016 and the same in 2011 to 2015. The number of graduates was 26 per year in 1994 to 2016 and 34 per year in 2011 to 2015. Significant discrepancies between the survey data from the ADA and program directors were observed, which likely resulted from underreporting to the ADA (Figs. 1B, 2B). The ADA annual survey captured only the number of dentists, foreign or U.S. trained, in the PhD program. Students with a bachelor or MS degree who entered oral sciences PhD training would not have been reported in the ADA surveys. Based on the program directors’ data, the annual new enrollment from 16 to 17 PhD programs had not changed, while there was a significant increase in graduation during the most recent 5 y. Sustaining PhD training requires significant resources that may include, but are not limited to, the number of funded faculty mentors and funding streams, such as training grants, fellowships, and R01-level research grants. Research funding and school priorities often affect academic program admissions and student support. At the national level, the policy shift resulting in diminishing institutional training grant positions and encouraging individual training grant applications likely influence program admissions.
When findings of this study are compared with the published benchmarks of the outcomes of 1,860 MD/PhD program graduates in 2000 to 2005 (Andriole and Jeffe 2016), interesting similarities and differences become apparent. Over half (52.4%) the MD/PhD program graduates had full-time faculty appointments. Graduates with high debt levels were significantly less likely to have full-time faculty appointments. Graduates with substantial research had a greater propensity for academic careers, while sex was not an influencing factor. The racial and ethnic diversity of MD/PhD program graduates has increased over the past 20 y, which is a significant change not yet observed in oral sciences PhD programs. In the MD/PhD cohort, underrepresented minority graduates and Asian/Pacific Islander graduates were less likely than White graduates to hold full-time faculty appointments, although our study outcomes differ in that Asian students and students of underrepresented minority background were equally likely to hold full-time faculty positions as compared with White students. However, according to our study, only 29.7% of oral sciences DDS/PhD graduates entered academia. The high level of student debt and the income difference between academics and practitioners are likely the significant factors influencing career choice. Enhancing mentoring and research experiences will be important to recruit and retain talents in academia (John et al. 2011; Gironda et al. 2013). From 1994 to 2004, 12.6% of oral sciences PhD students had an underrepresented minority background, which increased to 14% from 2005 to 2015, although this change was not statistically significant (P > 0.01). Despite the effort of inclusion, Profile for Success programs, and undergraduate research mentoring programs (Johnson et al. 2013), additional measures will need to be taken to effect a significant increase of diversity within the oral sciences graduate student body.
Note that not all dental faculty hired may have entered through the pipeline described here. Some faculty members receive PhD training outside of programs that reside within universities or academic health centers with dental schools. The programs analyzed in the present study would not have captured such individuals.
More than 80% of the program graduates with known locations resided in the United States. Since this survey did not ask for students’ country of origin, we cannot deduce how many foreign students decided to stay in the United States after completing their PhD training. While significantly more female than male graduates of advanced degree programs became dental faculty (Wanchek et al. 2015; Gadbury-Amyot et al. 2016), male and female graduates of oral sciences PhD programs were equally likely to hold a faculty position after completing their PhD training.
Compared with 2005—when James Rogér (2008) conducted a survey of DDS-DMD/PhD dual-degree training opportunities in U.S. dental schools—significantly more programs in the recent decade offered DDS/PhD training positions and better-structured curricula (personal communication with program directors) to strengthen students’ academic experience. The attrition rate of DDS/PhD programs (5.1%) was no different from that of PhD programs (4.6%) from 1994 to 2016. A higher percentage of students were currently receiving DDS/PhD training when compared with the percentage in the group who had already graduated.
Three programs provided training grant tables from which trainee information was extracted to complete the study survey. Students not funded by training grant, if any, would have been left out. The MS/PhD students were combined in the PhD category in the program directors’ survey, although many program directors reported the MS/PhD students separately. As reported, the study period comprised only 16 MS/PhD students; as such, the data related to MS/PhD students should not be considered complete.
This study did not survey PhD program funding mechanisms or academic models of the DDS/PhD training. A follow-up survey of programs with a focus on finance, student loan, support needs, and support mechanisms may provide critical insights to devise a sustainable plan for oral science graduate training. Additional studies to determine predictors that distinguish the group of graduates who were faculty from the group that entered private practice would shed light into how to best mentor students and retain talents in academia.
The National Institutes of Health cap of institutional research training grant direct cost may have decreased the available training positions. However, oral sciences PhD programs managed to continue their activities through a combined strategy involving dental school funding streams, specialty foundation funding, and institutional scholarships. Many DDS/PhD and PhD students are expected to secure National Research Service Awards (F series) to support their academic pursuits.
Our ultimate goal is to demonstrate the outcomes of oral sciences PhD programs in the United States. With the results of this pilot study, we hope to engage oral sciences PhD program directors, the Council on Dental Education and Licensure of the ADA, the Commission on Dental Accreditation, and the American Dental Education Association to devote effort toward establishing, maintaining, and making available an oral sciences PhD program database and to periodically assess programs’ impact on dental education, research, and faculty workforce.
Author Contributions
C.R. Herzog, contributed to data analysis and interpretation, critically revised the manuscript; D.W. Berzins, P. DenBesten, R.L. Gregory, K.M. Hargreaves, R.L.W. Messer, M. Mina, M.P. Mooney, M.L. Paine, C. Phillips, R.B. Presland, R.G. Quivey, F.A. Scannapieco, J.F. Sheridan, K.K.H. Svoboda, P.C. Trackman, M.P. Walker, S.G. Walker, CY. Wang, contributed to data acquisition and interpretation, critically revised the manuscript; J.C.C. Hu, contributed to conception, design, data acquisition, and interpretation, drafted and critically revised the manuscript. All authors gave final approval and agree to be accountable for all aspects of the work.
Supplementary Material
Acknowledgments
We thank Matthew C. Mikkelsen, manager of education surveys at the ADA Health Policy Institute, for his assistance in obtaining selected ADA survey documents and Emily Springfield, instructional learning expert at the University of Michigan School of Dentistry, for her advice in survey construction. The Office of Research at the University of Michigan School of Dentistry provided support for carrying out the program director survey study. Specifically, we thank Kimberly Smith, who helped with the survey design, distribution, organization of the completed surveys, and generation of graphs, and Pat Schultz and Manette London, who helped with survey design and proofreading. We acknowledge colleagues who contributed program-specific data: Dr. Robert A. Burne, associate dean for research, distinguished professor and chair, Department of Oral Biology, College of Dentistry, University of Florida; Dr. Douglas S. Darling, professor emeritus at the School of Dentistry, University of Louisville; Dr. Keith L. Kirkwood, professor, Department of Oral Biology, School of Dental Medicine, University at Buffalo; Dr. Sheila E. Stover, director, Rural Outreach Programs and Grad Program in Endodontics, Dental Surgical Sciences, School of Dentistry, Marquette University. We thank the following individuals, who provided assistance in data collection: Muneeza Irfani, training grants coordinator, University of California, Los Angeles; Roger Mraz, program administrator, University of California, San Francisco; Karina Kearney, program coordinator, University of Missouri, Kansas City; Cathy Drdul, program coordinator, State University of New York, Buffalo; Nicole Beaumont, administrator, Center for Oral Biology, University of Rochester; Meagan Solloway, administrative assistant, University of North Carolina; Christine Bitzel, administrative assistant, The Ohio State University; Lynn M. Marendo, administrative assistant, University of Pittsburgh; Temo Garcia, Office of External Affairs, School of Dentistry, University of Texas Health Science Center at San Antonio; Denise Dorman, College of Dentistry, University of Florida.
Footnotes
A supplemental appendix to this article is available online.
This study was supported by the University of Michigan School of Dentistry.
The authors declare no potential conflicts of interest with respect to the authorship and/or publication of this article.
ORCID ID: K.K.H. Svoboda,  https://orcid.org/0000-0003-0820-3067
References
- American Dental Association. 1994-2010. Survey of advanced dental education. Advanced dental education programs not accredited by the Commission on Dental Accreditation: enrollment and graduates table. Chicago (IL): ADA Health Policy Institute; http://www.adacatalog.org [Google Scholar]
- American Dental Association. 2011-2015. Survey of advanced dental education. Advanced dental education programs not accredited by the Commission on Dental Accreditation: enrollment and graduates table. Chicago (IL): ADA Health Policy Institute; http://www.ada.org/edreports [Google Scholar]
- American Dental Education Association. 2014. –2015. Deans’ briefing book. Washington (DC): American Dental Education Association; [accessed 28 Nov 2017]. http://www.adea.org/deansbriefing/. [Google Scholar]
- Andriole DA, Jeffe DB. 2016. Predictors of full-time faculty appointment among MD-PhD program graduates: a national cohort study. Med Educ Online. 21:30941. [DOI] [PMC free article] [PubMed] [Google Scholar]
- Gadbury-Amyot CC, Pyle MA, Van Ness CJ, Overman PR, West KP. 2016. Which way to lean? A national study of women dental faculty members’ career aspirations and choices. J Dent Educ. 80(12):1392–1404. [PubMed] [Google Scholar]
- Gironda MW, Bibb CA, Lefever K, Law C, Messadi D. 2013. A program to recruit and mentor future academic dentists: successes and challenges. J Dent Educ. 77(3):292–299. [PubMed] [Google Scholar]
- Institute of Social and Preventive Medicine. 2007. STROBE recommendations and checklist: version 4. Bern (Switzerland): University of Bern; [accessed 2017 Nov 28]. https://strobe-statement.org/index.php?id=available-checklists. [Google Scholar]
- International Committee of Medical Journal Editors. 2016. Recommendations for the conduct, reporting, editing, and publication of scholarly work in medical journals; [accessed 2017 Nov 28]. http://www.icmje.org/icmje-recommendations.pdf. [PubMed]
- John V, Papageorge M, Jahangiri L, Wheater M, Cappelli D, Frazer R, Sohn W. 2011. Recruitment, development, and retention of dental faculty in a changing environment. J Dent Educ. 75(1):82–89. [PubMed] [Google Scholar]
- Johnson KP, Woolfolk M, May KB, Inglehart MR. 2013. Effect of an enrichment program on DAT scores of potential dental students from disadvantaged backgrounds. J Dent Educ. 77(8):1063–1071. [PubMed] [Google Scholar]
- Kennedy JE, Hunt RJ. 1998. Meeting the demand for future dental faculty. Washington (DC): American Association of Dental Schools; [accessed 2017 Nov 28]. http://www.adea.org/publications/Pages/75thAnniversarySummitReport.aspx. [Google Scholar]
- Rogér JM. 2008. The academic dental careers fellowship program: a pilot program to introduce dental students to academia. J Dent Educ. 72(4):438–447. [PubMed] [Google Scholar]
- Wanchek T, Cook B, Anderson E, Duranleau L, Valachovic R. 2015. Dental school vacant budgeted faculty positions, academic years 2011–12 through 2013–14. J Dent Educ. 79(10):1230–1242. [PubMed] [Google Scholar]
- Wanchek T, Cook BJ, Slapar F, Valachovic RW. 2016. Dental schools vacant budgeted faculty positions, academic year 2014–15. J Dent Educ. 80(8):1012–1022. [Google Scholar]
Associated Data
This section collects any data citations, data availability statements, or supplementary materials included in this article.


