

Abstract
Long-term potentiation (LTP) of AMPA receptor-mediated synaptic transmission at hippocampal CA1 synapses has been extensively studied, but the mechanisms responsible for its expression remain unresolved. We tested a hypothesis that there are multiple, developmentally regulated expression mechanisms by directly comparing LTP in hippocampal slices obtained from rats of two ages. At postnatal day 12 (P12), LTP was fully accounted for by an increase in potency (mean amplitude of responses excluding failures). This was associated with either an increase in AMPA receptor single-channel conductance (γ) or no change in γ, suggesting an increase in the number of AMPA receptors. At P6, LTP was explained by an additional two mechanisms. In the majority of neurons, LTP was associated with an increase in success rate and a decrease in paired-pulse facilitation. In the remaining neurons, LTP was attributable to an increase in potency. However, in contrast to P12 neurons, the potency increase was associated with a decrease in γ, suggesting the insertion of receptors with lower γ. We conclude that there are multiple expression mechanisms for LTP at CA1 synapses that are developmentally regulated. These findings suggest that a single class of synapse uses a number of different molecular mechanisms to produce long-term changes in synaptic strength.
Keywords: CA1, LTP, development, probability of release, AMPA receptor, conductance
Introduction
Long-term potentiation (LTP) has been the subject of intense investigation because it provides a convenient experimental system for investigating synaptic mechanisms that are likely to be involved in learning and memory (Bliss and Collingridge, 1993). The most extensively studied form of LTP is that exhibited by synapses between CA3 and CA1 pyramidal neurons in the hippocampus. Here it has been established that LTP is induced by the transient synaptic activation of NMDA receptors. However, the actual change that sustains the enhancement of AMPA receptor-mediated synaptic transmission has been the subject of intense debate (Bliss and Collingridge, 1993; Malinow, 1994; Kullmann and Siegelbaum, 1995; Malenka and Nicoll, 1999). There is evidence for a postsynaptic change that is likely to be an increase in the number of synaptic AMPA receptors (N) (Shi et al., 1999; Hayashi et al., 2000; Lu et al., 2001; Pickard et al., 2001) or an increase in their single-channel conductance (γ) (Benke et al., 1998; Poncer et al., 2002). However, there is also evidence that LTP can be expressed as a presynaptic increase in l-glutamate release, which could result from an enhancement in the probability of release (Pr) (Stevens and Wang, 1994; Bolshakov and Siegelbaum, 1995) or in the amount of l-glutamate released from vesicles as a result of an alteration in fusion pore kinetics (Choi et al., 2000; Renger et al., 2001).
In the hippocampus, both Pr (Hessler et al., 1993; Rosenmund et al., 1993; Allen and Stevens, 1994) and N (Nusser et al., 1998; Petralia et al., 1999; Takumi et al., 1999) are highly variable between synapses. The differences are amplified during development, because synaptic maturation is associated with changes in vesicle pool size (Renger et al., 2001; Mozhayeve et al., 2002) and AMPA receptor number (Durand et al., 1996; Liao and Malinow 1996; Nusser et al., 1998; Liao et al., 1999; Petralia et al., 1999; Pickard et al., 2000; Zhu et al., 2000). It is therefore possible that there are multiple expression mechanisms for LTP that depend on the developmental stage of the synapse and that contribute to synapse maturation.
In a previous investigation (Benke et al., 1998), we found two expression mechanisms for LTP at CA1 synapses in slices from postnatal day 13 (P13) to P15 (termed P14) rats: an increase in γ and, most likely, an increase in N. To test the hypothesis that two developmentally regulated expression mechanisms overlap at this age, we studied LTP at an earlier stage of development, P6. To our surprise, we observed two different expression mechanisms for LTP. The first can be explained by either an increase in Pr or an increase in the number of functional release sites (n), the new sites having a higher Pr than the existing sites. The second is most readily explained by the postsynaptic insertion of AMPA receptors that have, paradoxically, lower γ. These results reveal a hitherto unexpected diversity in the mechanisms that are used to express LTP at a single class of synapse.
Materials and Methods
Transverse hippocampal slices were obtained from 5- to 7-d-old (P6) and 11- to 13-d-old (P12) rats and perfused with extracellular medium comprising the following (in mm): 124 NaCl, 3 KCl, 1.25 NaH2PO4, 1 MgSO4, 26 NaHCO3, 2 CaCl2, 15 glucose, 2 ascorbic acid, and 0.05 picrotoxin (saturated with 95% O2-5% CO2 at room temperature). Whole-cell voltage-clamp recordings from the soma or proximal apical dendrites of CA1 pyramidal cells were made under visual control using infrared illumination and differential interference contrast optics (Stuart et al., 1993; Benke et al., 1998). Whole-cell electrodes (6-10 MΩ) were filled with a solution containing the following (in mm): 130 Cs methane sulfonate, 10 HEPES, 0.5 EGTA, 4 Mg-ATP, 0.3 Na-GTP, 5 QX-314, and 8 NaCl, pH 7.25 (285 mOsm). Schaffer collateral-commissural fibers were stimulated using a fine insulated platinum monopolar or bipolar electrode positioned under visual control 30-60 μm from the recording site. EPSCs were evoked by delivering a pair of stimuli (70 msec interval) at a frequency of 0.5 Hz. The stimulus intensity was set so as to evoke a mixture of successes and failures of synaptic transmission. Baseline recordings were made at a holding potential of -70 mV; LTP was induced by depolarizing to 0 mV for 40 stimuli at baseline frequency and stimulus intensity. Baseline periods were restricted to 100 trials to reduce the problem of washout of LTP induction mechanisms, which is particularly rapid with whole-cell dendritic recordings. Only recordings with stable baseline responses were used (Xiao et al., 2004); pairing resulted in LTP in ∼50% of experiments. Recordings were made using an Axopatch 1-D (Axon Instruments, Foster City, CA), and data were filtered at 5 kHz, digitized at 10 kHz, and stored on computer using the LTP program (Anderson and Collingridge, 2001).
EPSC amplitude and estimated series resistance were displayed online. Series resistance was remeasured off-line by fitting the mean whole-cell capacitance transient, evoked by a -1 mV step before each stimulus pair, with a double-exponential function and extrapolating to the peak of the current. Whole-cell capacitance was also calculated from the double-exponential fit [C = (c1τ1 + c2τ2)/ΔV]. Input resistance was obtained from the steady-state current at the end of the voltage step. EPSC amplitude was measured by averaging the current over two 3 msec time windows, one immediately before the stimulus artifact and the other positioned at the peak of the response. Failures were visually identified. Mean EPSC amplitude was calculated by averaging all successes and failures, and potency was measured by averaging successes only. The paired-pulse ratio (PPR) was determined by delivering two stimuli of identical strength with an interpulse interval of 70 msec. This interval was used to allow time for the first EPSC of the pair to decay sufficiently to enable nonstationary fluctuation analysis to be performed. PPR was calculated as mean EPSC amplitude (second pulse; EPSC2)/mean EPSC amplitude (first pulse; EPSC1). Changes in success rate (SR) and potency were modeled using a simple Poisson distribution: potency ratio (EPSC2/EPSC1) = (ln[1 - SR2]/ln[1 - SR1])(SR1/SR2), or two-site binomial distribution: potency ratio (EPSC2/EPSC1) = ([1 - (1 - SR2)1/2]SR1)/([1 - (1 - SR1)1/2]SR2), where SR1 and SR2 are the success rates of EPSC1 and EPSC2, respectively. The rise and decay phases of mean EPSCs were fit by single-exponential functions, and EPSC kinetics are expressed as the time constants of these fits. Peak-scaled nonstationary fluctuation analysis of EPSCs (Robinson et al., 1991; Traynelis et al., 1993) was performed as described previously (Benke et al., 1998). Synaptic currents were aligned at their point of maximum rise and averaged. The average response waveform was scaled to the peak of each individual response, and the variance of the fluctuation of the decay around the mean was calculated. The variance was divided into bins of equal current decrement and averaged for all responses and was plotted against mean current amplitude of the EPSC decay. The single-channel current was then estimated by fitting the data to the following: σ2 = iI - I2/N + b1, where σ2 is the variance, I is the mean current, N is the number of channels activated at the peak, i is the single-channel current, and b1 is the background variance (Sigworth, 1980). The single-channel conductance (γ) is then γ = i/V, where V is the driving force (holding potential - assumed reversal potential of 0 mV). To obtain the most accurate estimate for γ, different portions of the data were fitted, and the goodness-of-fit was assessed using a least-squares algorithm and by eye (Benke et al., 1998). Within a given experiment, when comparing experimental manipulations, the same fraction of the data were always used for the fit. All values are expressed as mean ± SEM. Statistical significance was assessed using two-tailed paired or unpaired Student's t tests as appropriate (p < 0.05 considered significant).
Results
A comparison of LTP at P6 and P12
The primary aim of the study was to investigate the mechanisms of expression of pairing-induced LTP in P6 neurons. However, we interleaved some experiments from P12 neurons, the results of which were very similar to a larger data set (of P14 neurons) published previously (Benke et al., 1998). Whole-cell voltage-clamp recordings were performed from the proximal apical dendrites, or the soma for some P6 neurons, of CA1 pyramidal cells, and EPSCs were evoked by local minimal stimulation (Fig. 1a,b). Analysis of P12 neurons showed that LTP (223 ± 21%; n = 9) was fully accounted for by an increase in potency (mean amplitude of responses excluding failures; 216 ± 18%) (Fig. 1c), and there was little change in success rate (1 - failure rate; 104 ± 5%) (Fig. 1e). Indeed, potency and amplitude changes were strongly correlated (Fig. 1c). In contrast, analysis of P6 neurons showed that LTP (234 ± 15%; n = 40) was associated with changes in potency alone, success rate alone, or both parameters (Fig. 1d,f). On average, potency was increased to 155 ± 8%, and success rate was increased to 164 ± 14% (n = 40). LTP was not associated with a change in the kinetics of EPSCs at either P6 or P12 (Fig. 1g,h).
Figure1.
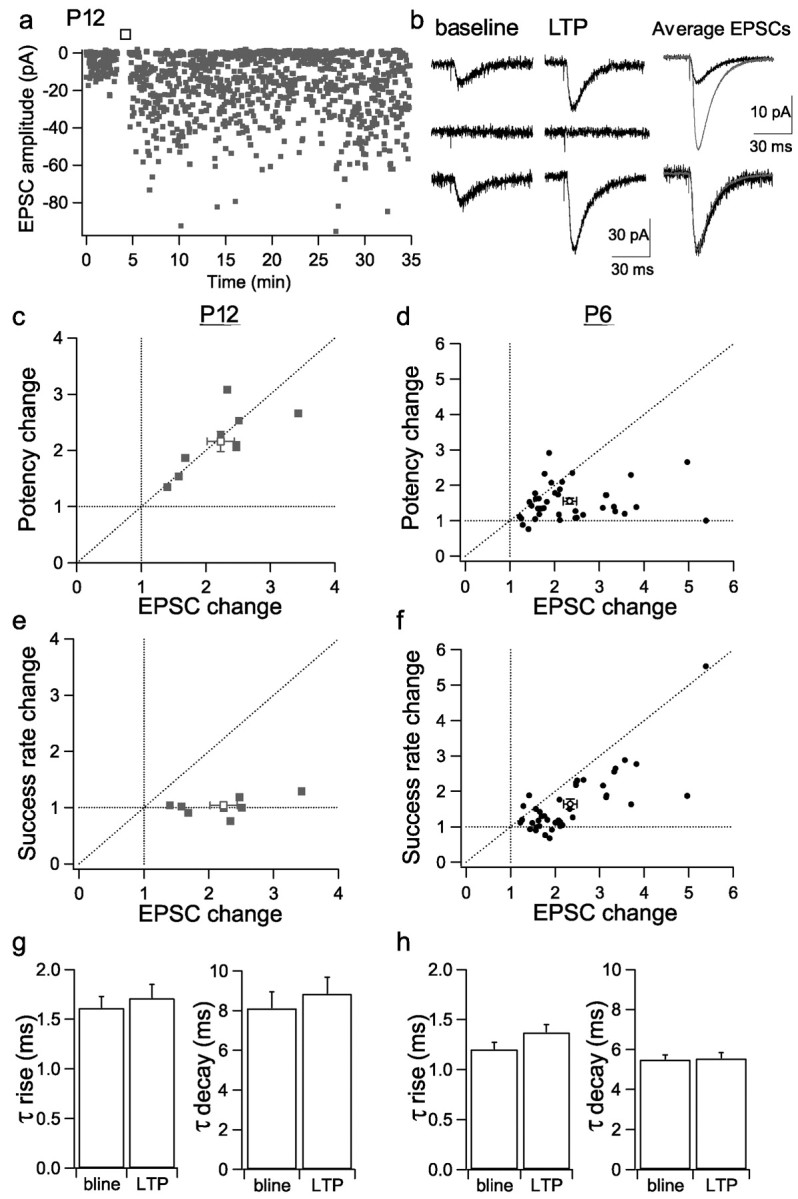
Different LTP expression mechanisms at P6 and P12. a, Response amplitude versus time for a representative P12 experiment. In this and subsequent time course plots, the open bar indicates where the pairing protocol was applied to induce LTP. b, Example of single EPSCs from the baseline and LTP periods for the experiment in a and average EPSCs (baseline, black; LTP, gray) superimposed and peak scaled (bottom). c, Potency change (LTP/baseline) versus EPSC amplitude change (LTP/baseline) for P12 experiments (filled symbols; open symbols show mean ± SEM values in c-f). d, Potency change versus EPSC amplitude change for P6 experiments. e, Success rate (1 - failure rate) change (LTP/baseline) versus EPSC amplitude change (LTP/baseline) for P12 experiments. f, Success rate change versus EPSC amplitude change for P6 experiments. g, Mean EPSC τ rise and τ decay for baseline (bline) and LTP periods in P12 experiments. h, Mean EPSC τ rise and τ decay for baseline and LTP periods in P6 experiments.
Changes in paired-pulse facilitation with LTP
In all experiments, two pulses (70 msec interval) were delivered per trial to determine whether the PPR was altered during LTP. P6 neurons exhibited a large range of baseline PPR values (0.67-3.83; mean, 1.79 ± 0.10; n = 40) (Fig. 2a) and, on average, showed a decrease in PPR after LTP induction (to 1.22 ± 0.04; p < 0.001) (Fig. 2d). However, there was a large degree of variation between neurons in the effect of LTP on PPR. The amount of change in PPR was found to be strongly correlated with the baseline PPR value, such that the higher the baseline value, the greater the reduction in PPR with LTP (r = -0.91; n = 40; p < 0.001; slope of -0.90) (Fig. 2b). PPR was stable in P6 cells that did not express LTP (baseline, 1.73 ± 0.14; after pairing, 1.75 ± 0.19; n = 19) (Fig. 2d). P12 neurons, in contrast, had a smaller range of baseline PPR values (0.94-1.68; mean, 1.41 ± 0.07; n = 9), which showed little change with LTP (1.27 ± 0.09) (Fig. 2c). Interestingly, after the induction of LTP, the mean PPR value was very similar between the P6 and P12 groups of neurons (Fig. 2d).
Figure2.

PPR changes with LTP are dependent on age and initial PPR.a, PPR during baseline and LTP for P6 experiments. b, PPR change (LTP PPR-baseline PPR) versus baseline PPR for P6 experiments. These parameters were significantly correlated (r =-0.91; n = 40; p < 0.001; slope of -0.90).c,PPR during baseline and LTP for P12 experiments. d, Mean PPR values before and after pairing for P6 experiments showing LTP (circles), P6 experiments not showing LTP (triangles), and P12 experiments (squares). e, Mean EPSCs for the baseline period of a P6 experiment subdivided into first pulse successes and first pulse failures and the mean second pulse EPSCs superimposed. f, Second pulse success rate after first pulse successes versus second pulse success rate after first pulse failures for the baseline period of P6 (circles) and P12 (squares) experiments. Because second pulse success rate was similar after successes and failures, axon conduction failures are unlikely to contribute significantly to synaptic failures.
Axon conduction failures do not contribute significantly to success rate
The use of paired-pulse stimulation allowed us to determine whether our observed success rates accurately reflected the probability of l-glutamate release in response to an invading action potential or whether there was a contribution from axon conduction failures. This can be determined by comparing the mean second pulse response to the paired-pulse stimulation after either first pulse failures or first pulse successes (Fig. 2e). If a significant number of first pulse failures result from conduction failures, the average amount of paired-pulse facilitation after first pulse failures would be less than that after first pulse successes (Stevens and Wang, 1995; Isaac et al., 1996). For both the P6 and P12 neurons, second pulse success rate was not significantly greater after first pulse successes than first pulse failures (Fig. 2f), indicating that axon conduction failures do not contribute to the variability of the synaptic response in our experiments.
Changes in potency and success rate with LTP at P6
The expression of LTP at P12 by an increase in potency, with little change in success rate or PPR, is consistent with previous reports of a postsynaptic locus at this age (i.e., increase in N or γ). However, the changes in success rate and PPR associated with LTP in many P6 neurons suggest that another mechanism contributes to LTP expression earlier in development. To investigate this mechanism further, it was necessary to distinguish those P6 neurons expressing LTP by a change in success rate from those expressing LTP by a change in potency. However, this process is complicated by the fact that an increase in success rate will cause an increase in potency when multiple synapses are being activated. The influence of this effect varies considerably between recordings, depending on the quantal content of the responses [product of the number of release sites (n) and their Pr]. To determine the effect of an increase in success rate on potency in each neuron, the baseline paired-pulse success rate ratio and baseline paired-pulse potency ratio were calculated (Fig. 3a,b). The baseline success rate ratio (second pulse/first pulse; range, 0.81-3.20) (Fig. 3c) reflects an increase in Pr attributable to paired-pulse facilitation (Zucker, 1989), which will depend on the initial Pr of the release site(s) being activated (Dobrunz and Stevens, 1997). If only one release site is activated, the baseline potency ratio (second pulse/first pulse) will be 1, but when more than one release site contributes to the EPSC, the second pulse increase in Pr will cause the potency ratio to increase (range, 0.81-2.19) (Fig. 3c) (Stevens and Wang, 1995). For each P6 recording, the increase in potency resulting from the paired-pulse increase in success rate was obtained from the baseline paired-pulse potency and success rate ratios. These were then compared with the potency and success rate changes with LTP to estimate whether the increase in potency with LTP could be solely accounted for by the change in success rate or whether an additional mechanism was required to account for it. The neurons fell into two groups. In one group (n = 17), the potency increase with LTP (1.92 ± 0.09) was much greater than the baseline paired-pulse potency ratio (1.21 ± 0.05), whereas the success rate change with LTP (1.14 ± 0.08) was similar to or less than the baseline paired-pulse success rate ratio (1.29 ± 0.07). The potency increase with LTP in these cells therefore could not be explained by the increase in success rate. Consistent with this, the predicted potency increase for the LTP success rate changes in these cells, using a Poisson release model that assumes multiple release sites of low Pr (Stevens and Wang, 1995; Isaac et al., 1996, 1998), was 1.10 ± 0.06, significantly less than the observed potency increase (p < 0.01; n = 17). In the remaining neurons (n = 23), the increase in success rate with LTP (2.01 ± 0.20) was generally larger than the increase in potency with LTP (1.28 ± 0.08). Indeed, the potency increase could be accounted for by the increase in success rate, as demonstrated by its similarity to the value of 1.26 ± 0.07 (n = 23) predicted for these cells with a Poisson release model. It is therefore likely that the potency increase with LTP in this group of cells is attributable solely to an increase in quantal content.
Figure 3.

Different LTP expression mechanisms at P6. a, First pulse and second pulse EPSC amplitude versus time for the baseline period of a P6 experiment. The baseline paired-pulse success rate ratio and baseline paired-pulse potency ratio were calculated for each experiment. b, Average EPSC (all successes and failures) for the baseline period in a. Bottom, First pulse and second pulse potency (average of successes only) showing the baseline paired-pulse potency ratio. c, Baseline paired-pulse potency ratio (second pulse/first pulse) versus baseline paired-pulse success rate ratio (second pulse/first pulse) for P6 experiments. d, LTP potency change versus EPSC amplitude change for P6 experiments, subdivided into P6(a) (open circles), P6(b) (filled circles), and P6(a/b) (triangles) on the basis of whether the change in potency with LTP could be accounted for by the change in success rate.
To summarize, we found that the potency increase with LTP in 23 cells (128 ± 8%) could be fully accounted for by the increase in success rate (201 ± 20%). LTP in these cells can therefore be explained by an increase in quantal content alone. The cells will be referred to as group P6(a) (Fig. 3d, open circles; pooled data are shown in Fig. 4a). In the other 17 cells, the potency increase was greater than expected from the change in success rate. In 14 of these cells, the change in success rate was small (range, 67-126%; mean, 100 ± 4%), and the LTP was predominantly mediated by an increase in potency (193 ± 11%). These changes are similar to those seen at P12 and are consistent with a change in quantal amplitude alone. The cells will be referred to as group P6(b) (Fig. 3d, filled circles; pooled data are shown in Fig. 4e). In the remaining three cells, there was both an increase in success rate (178 ± 8%) and an increase in potency (191 ± 19%), which was greater than could be accounted for by the success rate change alone [the cells will be referred to as P6(a/b)] (Fig. 3d, triangles).
Figure 4.

LTP involves a large reduction in PPR in P6(a) neurons. a, Mean EPSC amplitude (normalized to baseline) versus time for P6(a) experiments (n = 23). The data were analyzed in bins of 50 trials. b, Mean PPR versus time for P6(a) experiments (n = 23). c, Paired-pulse responses from an example P6(a) experiment, before and after the induction of LTP. d, Average baseline (black) and LTP (gray) EPSCs (all successes and failures) superimposed to show the magnitude of the LTP and scaled by the first pulse to show the reduction in PPR (bottom). e, Mean EPSC amplitude (normalized to baseline) versus time for P6(b) experiments (n = 14). f, Mean PPR versus time for P6(b) experiments (n = 14). g, Paired-pulse responses from an example P6(b) experiment, before and after the induction of LTP. h, Average baseline (black) and LTP (gray) EPSCs (all successes and failures) superimposed to show the magnitude of the LTP and scaled by the first pulse to show the lack of change in PPR (bottom).
Changes in quantal content with LTP in P6(a) neurons
The potency and success rate changes associated with LTP in P6(a) neurons are consistent with an expression mechanism involving an increase in quantal content alone. Quantal content changes can be attributable to alterations in either Pr or n. To investigate which of these parameters changes in P6(a) neurons, we examined the paired-pulse ratio before and after LTP induction. Examples and summary data for LTP and PPR in P6 neurons are shown in Figure 4 [a-d, P6(a); e-h, P6(b)]. We observed that P6(a) neurons had a significantly higher baseline paired-pulse ratio (1.96 ± 0.15; n = 23) than P6(b) neurons (1.44 ± 0.04; n = 14; p < 0.05) (Fig. 5a,b), indicating a lower baseline Pr. Furthermore, LTP in P6(a) neurons was associated with a significantly larger reduction in PPR (-0.76 ± 0.15; n = 23) than LTP in P6(b) neurons (-0.20 ± 0.08; n = 14; p < 0.01) (Figs. 4b,f, 5a,b). The large reduction in PPR in P6(a) neurons is consistent with an increase in Pr with LTP. It is also consistent with an increase in n, provided that the new sites have a higher Pr than the existing functional ones. In either case, P6(a) neurons clearly exhibited a different LTP expression mechanism to P6(b) or P12 neurons.
Figure 5.

LTP in P6(a) neurons is likely to involve an increase in Pr. a, PPR during baseline and LTP for P6 experiments, subdivided into P6(a) (open circles), P6(b) (filled circles), and P6(a/b) (triangles). b, Mean PPR values during baseline and LTP for P6(a) neurons (open circles; n = 23), P6(b) neurons (filled circles; n = 14), and P12 neurons (squares; n = 9). c, LTP success rate change versus baseline paired-pulse success rate ratio for P6(a) experiments. These parameters were significantly correlated (r = 0.75; n = 23; p < 0.001; slope of 1.19). d, LTP potency change versus baseline paired-pulse potency ratio for P6(a) experiments. These parameters were significantly correlated (r = 0.80; n = 23; p < 0.001; slope of 0.92). e, LTP success rate change versus EPSC amplitude change for putative single release site P6(a) recordings. f, LTP potency change versus EPSC amplitude change for putative single release site P6(a) recordings.
Additional analysis compared the magnitude of the changes in success rate and potency during paired-pulse facilitation with those during LTP. It was found that the P6(a) neurons showed a significant correlation between baseline paired-pulse success rate ratio and the increase in success rate with LTP (r = 0.75; n = 23; p < 0.001; slope of 1.19) (Fig. 5c). In addition, there was a significant correlation between baseline paired-pulse potency ratio and the potency increase with LTP (r = 0.80; n = 23; p < 0.001; slope of 0.92) (Fig. 5d). In contrast, no significant correlation was found between these parameters for P6(b) neurons (data not shown). These data suggest that the magnitude of the success rate increase with LTP is inversely related to the initial Pr of the release sites and provide evidence for an increase in Pr as the expression mechanism of P6(a) LTP.
LTP at putative single release sites in P6(a) neurons
In a subset of P6(a) neurons, the baseline paired-pulse potency ratio was ∼1 (range, 0.96-1.03; mean, 0.99 ± 0.01; n = 8). These neurons had a mean baseline success rate of 26 ± 7% and a baseline paired-pulse success rate ratio of 1.91 ± 0.24, resulting in substantial paired-pulse facilitation (PPR of 1.92 ± 0.06; n = 8). According to modeling using either binominal (two-release site; p < 0.01) or Poisson (p < 0.01) statistics, these recordings appear to involve a single release site (Stevens and Wang, 1995). LTP in this subset of putative single release site P6(a) experiments was associated with a large increase in success rate (246 ± 47%) but no significant change in potency (107 ± 5%; n = 8) (Fig. 5e,f). This lack of change in potency with LTP is more readily explained by an increase in Pr rather than by an increase in n. This is further supported by the finding that the paired-pulse potency ratio was unchanged at ∼1 after LTP induction (range, 0.84-1.07; mean, 0.98 ± 0.03; n = 8), consistent with the generation of responses by a single release site after LTP induction.
EPSC kinetics and passive properties at P6 and P12
Given the marked differences in the expression of LTP between P6(a) and P6(b) neurons, we examined several basic parameters in these groups and the P12 neurons. Compared with P12 neurons, P6 neurons had lower whole-cell capacitance (p < 0.001) (Fig. 6a) and higher input resistance (RIN; p < 0.001) (Fig. 6b), consistent with younger animals having smaller neurons with less complex dendritic aborizations. EPSCs at P6 had faster kinetics (rise and decay time constants) than at P12 (p < 0.05) (Fig. 6c). Comparison of the two groups of P6 neurons showed that P6(a) cells had significantly lower whole-cell capacitance than P6(b) cells [P6(a), 36.3 ± 2.7 pF (n = 23); P6(b), 55.3 ± 4.1 pF (n = 14); p < 0.001] (Fig. 6d) and significantly faster EPSC decay time constants [P6(a), 4.9 ± 0.3 msec (n = 23); P6(b), 6.4 ± 0.4 msec (n = 14); p < 0.05] (Fig. 6e). At P6, EPSC decay was found to be linearly correlated with whole-cell capacitance (r = 0.83; n = 40; p < 0.001) (Fig. 6f). The large variation in whole-cell capacitance of P6 neurons (Fig. 6f) suggests a heterogeneity in maturation at this age. The results are consistent with P6(a) neurons being smaller and less mature than P6(b) neurons and therefore suggest a developmental regulation in the expression mechanisms of LTP.
Figure 6.

LTP expression is related to neuronal development. a, Mean whole-cell capacitance for P6 (n = 40) and P12 (n = 9) neurons. For all graphs in this figure, *p < 0.05, and error bars represent SEM. b, Mean input resistance (RIN) for P6 (n = 40) and P12 (n = 9) neurons. c, Mean EPSC τ rise (left) and τ decay (right) for P6 (n = 40) and P12 (n = 9) neurons. d, Mean whole-cell capacitance for P6(a) (n = 23) and P6(b) (n = 14) neurons. e, Mean EPSC τ decay for P6(a) (n = 23) and P6(b) (n = 14) neurons. f, EPSC τ decay versus whole-cell capacitance for P6 neurons [P6(a), open circles; P6(b), filled circles; P6(a/b), triangles]. These parameters were significantly correlated (r = 0.83; n = 40; p < 0.001).
Evidence for the rapid insertion of AMPA receptors with a lower γ
In a subset of neurons at P6 and P12, the series resistance of the dendritic recording was low enough to permit γ to be estimated by the application of peak-scaled nonstationary fluctuation analysis (Benke et al., 1998, 2001) (Fig. 7). LTP at P12 (potency change, 202 ± 13%) was either associated with an increase in γ (between 132 and 206%; n = 3) (Fig. 7d) or no change in γ (n = 2) (Fig. 7d), as reported previously for a larger data set of P14 neurons (Benke et al., 1998). In contrast, in no P6 neuron did γ increase during LTP. Indeed, on average, γ was reduced to 88 ± 4% of control (n = 10; p < 0.05). However, when these P6 neurons were subdivided into P6(a) and P6(b) groups, it was found that the P6(a) neurons showed no significant change in γ (98 ± 1%; n = 5) (Fig. 7a,c,e). Unexpectedly, the P6(b) neurons all showed a small decrease in γ with LTP (77 ± 3% of control; n = 5; p < 0.05) (Fig. 7b,c,e) despite an increase in potency to 184 ± 14% (Fig. 7f).
Figure 7.

AMPA receptor single-channel conductance (γ) shows a small decrease with LTP in P6(b) neurons. a, EPSC decay variance versus EPSC decay amplitude for peak-scaled nonstationary fluctuation analysis for an example P6(a) neuron during baseline (black squares) and LTP (gray circles). Lines are fits to the data (y = ix-x2/N + b1; see Materials and Methods). For this neuron, baseline γ = 5.1 pS; LTP γ = 4.9 pS. b, EPSC decay variance versus EPSC decay amplitude for an example P6(b) neuron (as for a). For this neuron, baseline γ = 7.0 pS; LTP γ = 5.1 pS. c, All γ estimates obtained for P6 neurons before and after the induction of LTP [P6(a), open circles; P6(b), filled circles]. d, Allγ estimates obtained for P12 neurons before and after the induction of LTP. e, Mean normalized γ values for the three groups of neurons during baseline and LTP (same symbols as for c and d). f, Mean γ change (LTP/baseline) versus mean potency change (LTP/baseline) for the three groups of neurons (same symbols as for c and d).
Discussion
In the present study, we observed several different forms of LTP at CA1 synapses that are developmentally regulated. The results at P12 are consistent with our previous study at P14 (Benke et al., 1998), which identified two forms of LTP that we termed LTPγ and LTPN. At P6, LTP is accounted for by two different mechanisms. One form, termed LTPP, is associated with a pronounced increase in success rate and decrease in paired-pulse facilitation. The other form is associated with an increase in potency and resembles LTPN but paradoxically is accompanied by a decrease in γ.
The possible molecular changes underlying these forms of LTP can be divided into postsynaptic modifications of AMPA receptor properties [increase in N, opening probability (Po), or γ], postsynaptic changes downstream of AMPA receptors (e.g., in passive membrane properties), an increase in the number of functional release sites (n), and presynaptic changes in Pr or in the amount or rate of l-glutamate released from vesicles. A change in the mean open time of AMPA receptor channels can be discounted because it would result in a pronounced slowing of the EPSC (Benke et al., 2001), which was not observed in this study. Structural changes, e.g., growth of spines (Engert and Bonhoeffer, 1999; Maletic-Savatic et al., 1999), are unlikely to occur over the time span investigated here.
Molecular basis of LTPP
A striking finding of the present study was the subset of P6 neurons in which LTP was associated with a marked increase in success rate and decrease in paired-pulse facilitation. These neurons had a high baseline paired-pulse ratio, presumably reflecting a low Pr. The results are consistent with the expression of LTP by an increase in Pr or by an increase in n provided that the new participating synapses had a high Pr. We believe that the correlation between baseline paired-pulse success rate ratio and success rate change with LTP, together with the lack of change in potency with LTP in putative single release site recordings, suggest that the more likely mechanism for this form of LTP is an increase in Pr at existing synapses.
A low Pr at neonatal synapses has been suggested to contribute to the high incidence of “silent” synapses at this age (Gasparini et al., 2000). An increase in Pr with LTP may result from an increase in the size of the readily releasable pool of vesicles (Rosenmund and Stevens, 1996; Dobrunz and Stevens, 1997), which has been shown to increase during maturation of hippocampal synapses in culture (Renger et al., 2001; Mozhayeve et al., 2002). More recently, silent synapses in early development have been proposed to be attributable to a transient fusion pore mode of vesicle exocytosis, which limits the concentration of l-glutamate in the synaptic cleft to below that required for activation of low-affinity AMPA receptors (Choi et al., 2000; Renger et al., 2001). Furthermore, LTP induction causes a switch to a rapid and complete mode of vesicle exocytosis that releases sufficient l-glutamate to activate AMPA receptors (Choi et al., 2000). Such an alteration in fusion pore kinetics could account for the increase in success rate observed with LTPP in the present study.
Presynaptic changes associated with LTP have been reported previously from antibody (Malgaroli et al., 1995; Antonova et al., 2001) and FM1-43 (Ryan et al., 1996; Zakharenko et al., 2001) labeling of synaptic vesicles in cultured hippocampal neurons and hippocampal slices. Recently, LTP has been shown to involve an increase in the probability of transmission at CA1 synapses by optical quantal analysis (Emptage et al., 2003). However, investigations of presynaptic expression mechanisms using paired-pulse analysis have yielded mixed results. Most have reported no consistent change in PPR with LTP (McNaughton, 1982; Anwyl et al., 1989; Muller and Lynch, 1989; Zalutsky and Nicoll, 1990; Manabe et al., 1993; Christie and Abraham, 1994; Schulz et al., 1994; Asztely et al., 1996), which is likely to be attributable to the maturity of the synapses studied. However, in two reports from adult CA1 neurons, PPR decreased with LTP (Kuhnt and Voronin, 1994; Kleschevnikov et al., 1996). Alterations in PPR that were dependent on the initial PPR (Schulz et al., 1994; Kleschevnikov et al., 1996) and bidirectional changes that are likely to reflect the unsilencing of synapses (Poncer and Malinow, 2001) have also been observed.
An alternative expression mechanism for LTPP is an increase in n attributable to the insertion of AMPA receptors at silent synapses containing only NMDA receptors (Kullmann, 1994, Isaac et al., 1995, Liao et al., 1995). Indeed, the unsilencing of silent synapses is most prominent early in hippocampal development (Durand et al., 1996; Liao and Malinow, 1996). Although unsilencing can result from presynaptic modifications, immunocytochemical experiments have provided evidence that the synaptic activation of NMDA receptors can lead to the rapid insertion of native AMPA receptors (Lu et al., 2001) into silent synapses (Pickard et al., 2001). This mechanism of LTP expression has been proposed recently to reverse activity-dependent silencing of AMPA receptor signaling at immature CA1 synapses (Xiao et al., 2004).
Molecular basis of LTPN
We proposed previously that the form of LTP that did not involve an increase in γ at P14 may be attributable to an increase in N, although we could not discount changes in Po (Benke et al., 1998). Molecular mechanisms exist for the rapid regulation of AMPA receptor surface expression (Malinow and Malenka, 2002), and N is highly variable at hippocampal synapses (Nusser et al., 1998; Petralia et al., 1999; Takumi et al., 1999). Furthermore, LTP has been shown to be associated with AMPA receptor insertion (Shi et al., 1999; Hayashi et al., 2000; Zhu et al., 2000; Lu et al., 2001; Pickard et al., 2001; Shi et al., 2001). We therefore favor a change in receptor number as the more likely mechanism.
LTPN at P6 is associated with an increase in potency, with little change in success rate or PPR, similar to its counterpart at P14. However, it displays one important difference: a small but significant decrease in γ. The most plausible explanation is an increase in N but with a different subunit composition or phosphorylation state of the newly inserted receptors. It is known that there is a developmental change in the subunit composition of synaptic AMPA receptors, with a decrease in glutamate receptor subunit 4 (GluR4) expression (Zhu et al., 2000) and increase in GluR2 expression (Pickard et al., 2000; Zhu et al., 2000; Kumar et al., 2002), and that high-frequency activity at cerebellar synapses can cause rapid AMPA receptor subunit rearrangement (Liu and Cull-Candy, 2000). Alternatively, the newly inserted receptors may contain unphosphorylated GluR1, resulting in lower γ (Derkach et al., 1999).
Molecular basis of LTPγ
We proposed previously that LTPγ may be attributable to Ca2+/calmodulin-dependent protein kinase II (CaMKII)-dependent phosphorylation of AMPA receptors that leads to these receptors spending more time in their high conductance states (Benke et al., 1998). In support of this hypothesis, LTP is associated with CaMKII-dependent phosphorylation of GluR1 (Barria et al., 1997; Lee et al., 2000), which has been shown to increase the contribution of high conductance states (Derkach et al., 1999). Furthermore, expression of active CaMKII in CA1 pyramidal cells leads to an increase in γ (Poncer et al., 2002). Consistent with the restriction of this expression mechanism to more mature synapses is the finding that the CaMKII dependence of LTP only emerges between P10 and P17 (Yasuda et al., 2003).
Conclusions
Many different mechanisms have been proposed to underlie the expression of LTP at CA1 synapses (Bliss and Collingridge, 1993; Malinow, 1994; Kullmann and Siegelbaum, 1995; Malenka and Nicoll, 1999). In part, this may be attributable to differences in experimental conditions; for example, inducing LTP with a tetanus might evoke additional mechanisms to inducing LTP by pairing, because of the high-frequency activation of presynaptic fibers. However, the finding that multiple forms of LTP are observed under identical conditions over a short developmental period may explain some of the controversy. We propose a series of mechanisms for LTP expression in which LTPP is attributable to an increase in quantal content and is the most immature form of LTP. This is suggested from the significantly lower whole-cell capacitance of P6 neurons expressing LTPP. We suggest that LTPN is a developmentally intermediate form of LTP that may act to provide a larger pool of receptors that can subsequently be modified by other mechanisms and that LTPγ is a relatively mature form of LTP. The different forms of LTP would provide a powerful and flexible mechanism for the activity-dependent construction of neuronal circuits during development.
Footnotes
Correspondence should be addressed to Dr. Mary J. Palmer, Medical Research Council Centre for Synaptic Plasticity, Department of Anatomy, University of Bristol, Bristol, BS8 1TD, UK. E-mail: m.j.palmer@bristol.ac.uk.
This work was supported by the Medical Research Council and the Wellcome Trust. We are most grateful to the late Prof. Leon Voronin for his helpful comments.
Copyright © 2004 Society for Neuroscience 0270-6474/04/244903-09$15.00/0
References
- Allen C, Stevens CF (1994) An evaluation of causes for unreliability of synaptic transmission. Proc Natl Acad Sci USA 91: 10380-10383. [DOI] [PMC free article] [PubMed] [Google Scholar]
- Anderson WW, Collingridge GL (2001) The LTP program: a data acquisition program for on-line analysis of long-term potentiation and other synaptic events. J Neurosci Methods 108: 71-83. [DOI] [PubMed] [Google Scholar]
- Antonova I, Arancio O, Trillat A-C, Wang H-G, Zablow L, Udo H, Kandel ER, Hawkins RD (2001) Rapid increase in clusters of presynaptic proteins at onset of long-lasting potentiation. Science 294: 1547-1550. [DOI] [PubMed] [Google Scholar]
- Anwyl R, Mulkeen D, Rowan MJ (1989) The role of N-methyl-d-aspartate receptors in the generation of short-term potentiation in the rat hippocampus. Brain Res 503: 148-151. [DOI] [PubMed] [Google Scholar]
- Asztely F, Xiao MY, Gustafsson B (1996) Long-term potentiation and paired-pulse facilitation in the hippocampal CA1 region. NeuroReport 7: 1609-1612. [DOI] [PubMed] [Google Scholar]
- Barria A, Muller D, Derkach V, Griffith LC, Soderling TR (1997) Regulatory phosphorylation of AMPA-type glutamate receptors by CaM-KII during long-term potentiation. Science 276: 2042-2045. [DOI] [PubMed] [Google Scholar]
- Benke TA, Lüthi A, Isaac JTR, Collingridge GL (1998) Modulation of AMPA receptor unitary conductance by synaptic activity. Nature 393: 793-797. [DOI] [PubMed] [Google Scholar]
- Benke TA, Lüthi A, Palmer MJ, Wikstrom MA, Anderson WW, Isaac JTR, Collingridge GL (2001) Mathematical modelling of non-stationary fluctuation analysis for studying channel properties of synaptic AMPA receptors. J Physiol (Lond) 537: 407-420. [DOI] [PMC free article] [PubMed] [Google Scholar]
- Bliss TVP, Collingridge GL (1993) A synaptic model of memory: long-term potentiation in the hippocampus. Nature 361: 31-39. [DOI] [PubMed] [Google Scholar]
- Bolshakov VY, Siegelbaum SA (1995) Regulation of hippocampal transmitter release during development and long-term potentiation. Science 269: 1730-1734. [DOI] [PubMed] [Google Scholar]
- Choi S, Klingauf J, Tsien RW (2000) Postfusional regulation of cleft glutamate concentration during LTP at “silent synapses.” Nat Neurosci 3: 330-336. [DOI] [PubMed] [Google Scholar]
- Christie BR, Abraham WC (1994) Differential regulation of paired-pulse plasticity following LTP in the dentate gyrus. NeuroReport 5: 385-388. [DOI] [PubMed] [Google Scholar]
- Derkach V, Barria A, Soderling TR (1999) Ca2+/calmodulin-kinase II enhances channel conductance of α-amino-3-hydroxy-5-methyl-4-isoxazolepropionate type glutamate receptors. Proc Natl Acad Sci USA 96: 3269-3274. [DOI] [PMC free article] [PubMed] [Google Scholar]
- Dobrunz LE, Stevens CF (1997) Heterogeneity of release probability, facilitation, and depletion at central synapses. Neuron 18: 995-1008. [DOI] [PubMed] [Google Scholar]
- Durand GM, Kovalchuk Y, Konnerth A (1996) Long-term potentiation and functional synapse induction in developing hippocampus. Nature 381: 71-75. [DOI] [PubMed] [Google Scholar]
- Emptage NJ, Reid CA, Fine A, Bliss TVP (2003) Optical quantal analysis reveals a presynaptic component of LTP at hippocampal Schaffer-associational synapses. Neuron 38: 797-804. [DOI] [PubMed] [Google Scholar]
- Engert F, Bonhoeffer T (1999) Dendritic spine changes associated with hippocampal long-term synaptic plasticity. Nature 399: 66-70. [DOI] [PubMed] [Google Scholar]
- Gasparini S, Savianne C, Voronin LL, Cherubini E (2000) Silent synapses in the developing hippocampus: lack of functional AMPA receptors or low probability of glutamate release? Proc Natl Acad Sci USA 97: 9741-9746. [DOI] [PMC free article] [PubMed] [Google Scholar]
- Hayashi Y, Shi SH, Esteban JA, Piccini A, Poncer JC, Malinow R (2000) Driving AMPA receptors into synapses by LTP and CaMKII: requirement for GluR1 and PDZ domain interaction. Science 287: 2262-2267. [DOI] [PubMed] [Google Scholar]
- Hessler NA, Shirke AM, Malinow R (1993) The probability of transmitter release at a mammalian central synapse. Nature 366: 569-572. [DOI] [PubMed] [Google Scholar]
- Isaac JTR, Nicoll RA, Malenka RC (1995) Evidence for silent synapses: Implications for the expression of LTP. Neuron 15: 427-434. [DOI] [PubMed] [Google Scholar]
- Isaac JTR, Hjelmstad GO, Nicoll RA, Malenka RC (1996) Long-term potentiation at single fibre inputs to hippocampal CA1 pyramidal cells. Proc Natl Acad Sci USA 93: 8710-8715. [DOI] [PMC free article] [PubMed] [Google Scholar]
- Isaac JTR, Lüthi A, Palmer MJ, Anderson WW, Benke TA, Collingridge GL (1998) An investigation of the expression mechanism of LTP of AMPA receptor-mediated synaptic transmission at hippocampal CA1 synapses using failures analysis and dendritic recordings. Neuropharmacology 37: 1399-1410. [DOI] [PubMed] [Google Scholar]
- Kleschevnikov AM, Sokolov MV, Kuhnt U, Dawe GS, Stephensen JD, Voronin LL (1996) Changes in paired-pulse facilitation correlate with induction of long-term potentiation in area CA1 of rat hippocampal slices. Neuroscience 76: 829-843. [DOI] [PubMed] [Google Scholar]
- Kuhnt U, Voronin LL (1994) Interation between paired-pulse facilitation and long-term potentiation in area CA1 of guinea-pig hippocampal slices: application of quantal analysis. Neuroscience 62: 391-397. [DOI] [PubMed] [Google Scholar]
- Kullmann DM (1994) Amplitude fluctuations of dual-component EPSCs in hippocampal pyramidal cells: implications for long-term potentiation. Neuron 12: 1111-1120. [DOI] [PubMed] [Google Scholar]
- Kullmann DM, Siegelbaum SA (1995) The site of expression of NMDA receptor-dependent LTP: new fuel for an old fire. Neuron 15: 997-1002. [DOI] [PubMed] [Google Scholar]
- Kumar SS, Bacci A, Kharazia V, Huguenard JR (2002) A developmental switch of AMPA receptor subunits in neocortical pyramidal cells. J Neurosci 22: 3005-3015. [DOI] [PMC free article] [PubMed] [Google Scholar]
- Lee HK, Barbarosie M, Kameyama K, Bear MF, Huganir RL (2000) Regulation of distinct AMPA receptor phosphorylation sites during bidirectional synaptic plasticity. Nature 405: 955-999. [DOI] [PubMed] [Google Scholar]
- Liao D, Malinow R (1996) Deficiency in induction but not expression of LTP in hippocampal slices from young rats. Learn Mem 3: 138-149. [DOI] [PubMed] [Google Scholar]
- Liao D, Hessler NA, Malinow R (1995) Activation of postsynaptically silent synapses during pairing-induced LTP in CA1 region of hippocampal slice. Nature 375: 400-404. [DOI] [PubMed] [Google Scholar]
- Liao D, Zhang X, O'Brien R, Ehlers MD, Huganir RL (1999) Regulation of morphological postsynaptic silent synapses in developing hippocampal neurons. Nat Neurosci 2: 37-43. [DOI] [PubMed] [Google Scholar]
- Liu S-QJ, Cull-Candy SG (2000) Synaptic activity at calcium-permeable AMPA receptors induces a switch in receptor subtype. Nature 405: 454-548. [DOI] [PubMed] [Google Scholar]
- Lu W-Y, Man H-Y, Ju W, Trimble WS, MacDonald JF, Wang YT (2001) Activation of synaptic NMDA receptors induces membrane insertion of new AMPA receptors and LTP in cultured hippocampal neurons. Neuron 29: 243-254. [DOI] [PubMed] [Google Scholar]
- Malenka RC, Nicoll RA (1999) Long-term potentiation—a decade of progress? Science 285: 1870-1874. [DOI] [PubMed] [Google Scholar]
- Maletic-Savatic M, Malinow R, Svoboda K (1999) Rapid dendritic morphogenesis in CA1 hippocampal dendrites induced by synaptic activity. Science 283: 1923-1927. [DOI] [PubMed] [Google Scholar]
- Malgaroli A, Ting AE, Wendland B, Bergamaschi A, Villa A, Tsien RW, Scheller RH (1995) Presynaptic component of long-term potentiation visualized at individual hippocampal synapses. Science 268: 1624-1628. [DOI] [PubMed] [Google Scholar]
- Malinow R (1994) LTP: desperately seeking resolution. Science 266: 1195-1196. [DOI] [PubMed] [Google Scholar]
- Malinow R, Malenka RC (2002) AMPA receptor trafficking and synaptic plasticity. Annu Rev Neurosci 25: 103-126. [DOI] [PubMed] [Google Scholar]
- Manabe T, Wyllie DJA, Perkel DJ, Nicoll RA (1993) Modulation of synaptic transmission and long-term potentiation: effects on paired-pulse facilitation and EPSC variance in the CA1 region of the hippocampus. J Neurophysiol 70: 1451-1459. [DOI] [PubMed] [Google Scholar]
- McNaughton BL (1982) Long-term synaptic enhancement and short-term potentiation in rat fascia dentata act through different mechanisms. J Physiol (Lond) 324: 249-262. [DOI] [PMC free article] [PubMed] [Google Scholar]
- Mozhayeve MG, Sara Y, Liu X, Kavalali ET (2002) Development of vesicle pools during maturation of hippocampal synapses. J Neurosci 22: 654-665. [DOI] [PMC free article] [PubMed] [Google Scholar]
- Muller D, Lynch G (1989) Evidence that changes in presynaptic calcium currents are not responsible for long-term potentiation in hippocampus. Brain Res 479: 290-299. [DOI] [PubMed] [Google Scholar]
- Nusser Z, Lujan R, Laube G, Roberts JDB, Molnar E, Somogyi P (1998) Cell type and pathway dependence of synaptic AMPA receptor number and variability in the hippocampus. Neuron 21: 545-559. [DOI] [PubMed] [Google Scholar]
- Petralia RS, Esteban JA, Wang Y-X, Partridge JG, Xhao H-M, Wenthold RJ, Malinow R (1999) Selective acquisition of AMPA receptors over postnatal development suggests a molecular basis for silent synapses. Nat Neurosci 2: 31-36. [DOI] [PubMed] [Google Scholar]
- Pickard L, Noël J, Henley JM, Collingride GL, Molnar E (2000) Developmental changes in synaptic AMPA and NMDA receptor distribution and AMPA receptor subunit composition in living hippocampal neurons. J Neurosci 20: 7922-7931. [DOI] [PMC free article] [PubMed] [Google Scholar]
- Pickard L, Noel J, Duckworth JK, Fitzjohn SM, Henley JM, Collingridge GL, Molnar E (2001) Transient synaptic activation of NMDA receptors leads to the insertion of native AMPA receptors at hippocampal neuronal plasma membranes. Neuropharmacology 41: 700-713. [DOI] [PubMed] [Google Scholar]
- Poncer JC, Malinow R (2001) Postsynaptic conversion of silent synapses during LTP affects synaptic gain and transmission dynamics. Nat Neurosci 4: 989-996. [DOI] [PubMed] [Google Scholar]
- Poncer JC, Esteban JA, Malinow R (2002) Multiple mechanisms for the potentiation of AMPA receptor-mediated transmission by α-Ca2+/calmodulin-dependent protein kinase II. J Neurosci 22: 4406-4411. [DOI] [PMC free article] [PubMed] [Google Scholar]
- Renger JJ, Egles C, Liu G (2001) A developmental switch in neurotransmitter flux enhances synaptic efficacy by affecting AMPA receptor activation. Neuron 29: 469-484. [DOI] [PubMed] [Google Scholar]
- Robinson HPC, Sahara Y, Kawai N (1991) Nonstationary fluctuation analysis and direct resolution of single channel currents at postsynaptic sites. Biophys J 59: 295-304. [DOI] [PMC free article] [PubMed] [Google Scholar]
- Rosenmund C, Stevens CF (1996) Definition of the readily releasable pool of vesicles at hippocampal synapses. Neuron 16: 1197-1207. [DOI] [PubMed] [Google Scholar]
- Rosenmund C, Clements JD, Westbrook GL (1993) Nonuniform probability of glutamate release at a hippocampal synapse. Science 262: 754-757. [DOI] [PubMed] [Google Scholar]
- Ryan TA, Ziv NE, Smith SJ (1996) Potentiation of evoked vesicle turnover at individually resolved synaptic boutons. Neuron 17: 125-134. [DOI] [PubMed] [Google Scholar]
- Schulz PE, Cook EP, Johnston D (1994) Changes in paired-pulse facilitation suggest presynaptic involvement in long-term potentiation. J Neurosci 14: 5325-5337. [DOI] [PMC free article] [PubMed] [Google Scholar]
- Shi S-H, Hayashi Y, Petralia RS, Zaman SH, Wenthold RJ, Svoboda K, Malinow R (1999) Rapid spine delivery and redistribution of AMPA receptors after synaptic NMDA receptor activation. Science 284: 1811-1816. [DOI] [PubMed] [Google Scholar]
- Shi S-H, Hayashi Y, Esteban JA, Malinow R (2001) Subunit-specific roles governing AMPA receptor trafficking to synapses in hippocampal pyramidal neurons. Cell 105: 331-343. [DOI] [PubMed] [Google Scholar]
- Sigworth FJ (1980) The variance of sodium channel fluctuations at the node of Ranvier. J Physiol (Lond) 307: 97-129. [DOI] [PMC free article] [PubMed] [Google Scholar]
- Stevens CF, Wang Y (1994) Changes in reliability of synaptic function as a mechanism for plasticity. Nature 371: 704-707. [DOI] [PubMed] [Google Scholar]
- Stevens CF, Wang Y (1995) Facilitation and depression at single central synapses. Neuron 14: 795-802. [DOI] [PubMed] [Google Scholar]
- Stuart GL, Dodt H-U, Sakmann B (1993) Patch-clamp recordings from the soma and dendrites of neurons in brain slices using infrared video microscopy. Pflügers Arch 423: 511-518. [DOI] [PubMed] [Google Scholar]
- Takumi Y, Ramírez-León V, Laake P, Rinvik E, Otterson OP (1999) Different modes of expression of AMPA and NMDA receptors in hippocampal synapses. Nat Neurosci 2: 618-624. [DOI] [PubMed] [Google Scholar]
- Traynelis SF, Silver RA, Cull-Candy SG (1993) Estimated conductance of glutamate receptor channels activated during EPSCs at the cerebellar mossy fiber-granule cell synapse. Neuron 11: 279-289. [DOI] [PubMed] [Google Scholar]
- Xiao M-Y, Wasling P, Hanse E, Gustafsson B (2004) Creation of AMPA-silent synapses in the neonatal hippocampus. Nat Neurosci 7: 236-243. [DOI] [PubMed] [Google Scholar]
- Yasuda H, Barth AL, Stellwagen D, Malenka RC (2003) A developmental switch in the signalling cascades for LTP induction. Nat Neurosci 6: 15-16. [DOI] [PubMed] [Google Scholar]
- Zakharenko SS, Zablow L, Siegelbaum SA (2001) Visualization of changes in presynaptic function during long-term synaptic plasticity. Nat Neurosci 4: 711-717. [DOI] [PubMed] [Google Scholar]
- Zalutsky RA, Nicoll RA (1990) Comparison of two forms of long-term potentiation in single hippocampal neurons. Science 248: 1619-1624. [DOI] [PubMed] [Google Scholar]
- Zhu JJ, Esteban JA, Hatashi Y, Malinow R (2000) Postnatal synaptic potentiation: delivery of GluR4-containing AMPA receptors by spontaneous activity. Nat Neurosci 3: 1098-1106. [DOI] [PubMed] [Google Scholar]
- Zucker RS (1989) Short-term synaptic plasticity. Annu Rev Neurosci 12: 13-31. [DOI] [PubMed] [Google Scholar]