

Abstract
Parkinson's disease pathogenesis proceeds through several phases, culminating in the loss of dopaminergic neurons of the substantia nigra (SN). Although the 1-methyl-4-phenyl-1,2,3,6-tetrahydropyridine (MPTP) model of oxidative SN injury is frequently used to study degeneration of dopaminergic neurons in mice and non-human primates, an understanding of the temporal sequence of molecular events from inhibition of mitochondrial complex 1 to neuronal cell death is limited. Here, microarray analysis and integrative data mining were used to uncover pathways implicated in the progression of changes in dopaminergic neurons after MPTP administration. This approach enabled the identification of small, yet consistently significant, changes in gene expression within the SN of MPTP-treated animals. Such an analysis disclosed dysregulation of genes in three main areas related to neuronal function: cytoskeletal stability and maintenance, synaptic integrity, and cell cycle and apoptosis. The discovery and validation of these alterations provide molecular evidence for an evolving cascade of injury, dysfunction, and cell death.
Keywords: Parkinson's disease, MPTP, gene expression, microarray, cytoskeleton, mouse
Introduction
Parkinson's disease (PD) is a clinical syndrome triggered by disparate mechanisms. That the clinical and neuropathological features are indistinguishable among the different forms suggests a convergent, shared pathway (Maguire-Zeiss and Federoff, 2003). After genetic, neurotoxicant, and/or an undefined insult, injured dopamine neurons are posited to mount a variety of sequential cell autonomous responses, some compensatory and others maladaptive. One significant challenge is to construct the temporal sequence of biochemical events that presage the irreversible loss of ventral midbrain dopamine neurons. Elucidating the earliest shared steps of this cascade and focusing on successful strategies by the cell to overcome insults may be crucial to the development of novel effective therapeutics.
The development of animal model systems, such as intoxication with 1-methyl-4-phenyl-1,2,3,6-tetrahydropyridine (MPTP), provides the necessary tools to initiate a careful molecular analysis of the progression of the substantia nigra (SN) dopamine injury and death. MPTP is a known neurotoxicant inducer of parkinsonism in human patients (Davis et al., 1979; Langston et al., 1983) that has subsequently been modeled extensively in mice as well as non-human primates (for review, see Beal, 2001; Przedborski et al., 2001). MPTP crosses the blood brain barrier and is subsequently converted to the neurotoxic metabolite 1-methyl-4-phenyl pyridinium (MPP+), a substrate of the dopamine transporter (DAT) (Chiba et al., 1985; Javitch et al., 1985). MPP+ enters the dopaminergic neuron where it inhibits mitochondrial complex I, precipitating severe ATP depletion (Ramsay et al., 1986; Hoppel et al., 1987; Mizuno et al., 1987). This energy crisis initiates a chain of events, culminating in the inability to release sufficient amounts of dopamine (Wesemann et al., 1993; Bezard et al., 2000), locomotor deficits (Chassain et al., 2001; Tillerson et al., 2002), and, ultimately, apoptosis of tyrosine hydroxylase (TH)-positive neurons in the SN (Dipasquale et al., 1991; Cruz-Sanchez et al., 1993; Mochizuki et al., 1994; Ali et al., 1998; Brooks et al., 1999; Mandir et al., 1999; Viswanath et al., 2001). MPP+ toxicity stimulates the generation of oxygen-free radicals and nitric oxide (NO), which can promote oxidative damage to macromolecules including cellular proteins implicated in PD pathogenesis such as TH and α-synuclein (Pennathur et al., 1999; Souza et al., 2000; Paxinou et al., 2001; Park et al., 2002). The pathology of MPTP intoxication affects only TH-positive neurons, sparing SN GABAergic neurons and glial populations (Przedborski and Vila, 2003).
The demonstration of a shared pathogenic cascade among the differently triggered forms of PD requires a characterization of the molecular changes accompanying the temporal evolution of midbrain dopamine injury, dysfunction, and cell death. Identification of consensus molecular responses is aided by the application of robust exploratory methods that permit cataloging of changes in gene expression. Here, mRNA profiling by two leading oligonucleotide array systems, Affymetrix GeneChips and Amersham CodeLink, was used to reveal candidate molecules that are dysregulated during MPP+-induced injury of the mouse SN in a chronic MPTP model of PD. Different time points were examined to discriminate temporal patterns of gene expression in this model. Applying three separate data mining methods, we found consistent downregulation of genes encoding proteins functioning in the maintenance of the cytoskeleton, neurotransmitter release, and trophic signaling in the SN. Additionally, decline in cell cycle regulatory genes is suggestive of abortive mitosis and death of postmitotic neurons.
Materials and Methods
Mice and MPTP treatment. Male C57BL/6J mice were used at 10 weeks of age. The mice received a total of four injections of MPTP-HCl (30 mg/kg, i.p.; n = 48) or an equal volume of 0.9% sterile saline [mouse control (MC); n = 24] over 8 d. The first and second doses were separated by 16 hr, followed 7 d later by two doses, also 16 hr apart (Brooks et al., 1999). Mice were killed at either 24 hr [mouse MPTP early (MME); n = 24 MPTP; n = 12 saline] or 7 d [mouse MPTP late (MML); n = 24 MPTP; n = 12 saline] after the final neurotoxicant dose. The SN was dissected bilaterally from six like-treated mice, pooled, and RNA was prepared from Trizol homogenates per the manufacturer's (Invitrogen, San Diego, CA) protocol to yield four samples of MPTP-treated SN and two samples of saline-treated SN at each time point. Clustering and principal component analysis (PCA) show that there are no major differences between the four saline-treated SN samples (killed at different times) with respect to gene expression. Therefore, for data analysis, the two samples of saline-treated mice from each time point were grouped together, so that each of the three treatment groups (MC, MME, and MML) consisted of four samples.
Characterization of MPTP-induced lesion. Additional male C57BL/6J mice (2-3 months of age) were given injections of MPTP as above. For neuronal counts of TH-positive cells in the SN, mice were killed at either 7 or 21 d postlesion by transcardial perfusion with 4% paraformaldehyde (PFA), pH 7.2 (n = 6 per treatment group). Brains were removed and postfixed in 4% PFA for 24 hr, followed by immersion in 20% sucrose in 0.1 m phosphate buffer, pH 7.2, for 3 d and immersion in 30% sucrose for 3 d. The brains were snap-frozen in isopentane cooled to -30°C and stored at -80°C until they were cryostat sectioned to a thickness of 25 μm. Immunohistochemistry was performed to identify TH-reactive cells in the SN of MPTP- and saline-injected mice. Briefly, sections were blocked in PBS containing 1% normal goat serum (Jackson ImmunoResearch, West Grove, PA) for 3 hr, followed by incubation in primary antibody (rabbit anti-TH; 1:100; Chemicon, Temecula, CA) overnight at 4°C. After being washed in PBS, sections were incubated with goat antirabbit secondary antibodies (1:4000; Jackson ImmunoResearch) for 1.5 hr at room temperature. Immunopositive cells were visualized by diaminobenzidine (Vector Laboratories, Burlingame, CA) reaction. Neuronal counts were performed using the unbiased stereological software module of MCID Elite 6.0 (Imaging Research, St. Catherines, Canada) with the aid of a Provis microscope (Olympus, New Hyde Park, NY). Heminigra from six random sections was counted for each mouse. Total counts were determined for each heminigra, and statistical comparison between total counts of each group was performed using Student's t test.
Additional mice were given injections of MPTP or saline as above and killed at 7 d postlesion to measure the levels of the DAT protein in the striatum as an additional indication of the extent of the lesion (n = 3 per group). Brains were removed fresh and microdissected using a 1 mm brain block to isolate the corpus striatum. Protein was extracted by homogenization in NP-40 (Tergitol; Sigma, St. Louis, MO) lysis buffer and quantified using the BCA protein determination method (Bio-Rad, Hercules, CA). For Western blots, protein samples were diluted to equivalent volumes containing 20 μg of protein and boiled in an equal volume of Laemmli SDS boiling buffer (Sigma) for 10 min. Samples were loaded into a 12% SDS-polyacrylamide gel and separated by electrophoresis for 3 hr at 100 V. Proteins were transferred to polyvinylidene difluoride membrane (Amersham Biosciences, Piscataway, NJ) for 1.5 hr at 300 mA. Membranes were blocked overnight at 4°C in Tris-buffered saline-Tween 20 (TBST) containing 5% nonfat dried milk to prevent nonspecific binding. Primary antibodies were added (rat anti-DAT; 1:500; Chemicon) and incubated at 4°C for 72 hr. Membranes were washed with TBST three times, and secondary antibodies (goat anti-rat; 1:4000; Jackson ImmunoResearch) were added and incubated at room temperature for 1.5 hr. Antibody complexes were visualized using enhanced chemiluminescence (PerkinElmer Life Sciences, Norwalk, CT) and exposure to film (Hyperfilm; Amersham Bioscience).
Sample preparation and microarrays. Total RNA (10 μg) from each sample (n = 4 samples per treatment group) was used to generate cDNA that was modified at the 3′ end to contain an initiation site for T7 RNA polymerase per the manufacturer's (SuperChoice; Invitrogen) protocol. The cDNA synthesis product (∼1 μg) was used in an in vitro transcription (IVT) reaction containing biotinylated UTP and CTP, which were used for detection after hybridization to the U74A microarray per the manufacturer's (Enzo, Farmingdale, NY) protocol. The full-length IVT product (20 μg) was subsequently fragmented in 200 mm Tris-acetate, pH 8.1, 500 mm KOAc, and 150 mm MgOAc at 94°C for 35 min. Hybridization of 10 μg of fragmented product, staining, and washing of all arrays were performed in the Affymetrix fluidics module as per the manufacturer's protocol. Streptavidin phycroerythrin stain (Molecular Probes, Eugene, OR) was used as the fluorescent conjugate used to detect hybridized target sequences. The detection and quantitation of target hybridization was performed with a GeneArray Scanner (Hewlett Packard/Affymetrix, Palo Alto, CA) set to scan each array twice.
After hybridization, 200 μl of each hybridization sample was removed from the Affymetrix fluidics module and added back to 100 μl of unused hybridization sample solution. This solution was vacuum dried and resuspended in 50% formamide. The samples were then loaded onto CodeLink Mouse UniSet I bioarrays (Amersham Biosciences) and hybridized according to the manufacturer's protocol. The posthybridization secondary labeling with streptavidin-cyanine 5 and washing of the bioarrays were performed according to the manufacturer's protocol, followed by detection using an Axon 4000B scanner (Axon Instruments, Foster City, CA) and quantitation using the CodeLink Scanning and Expression Analysis software (version 2.3; Amersham Biosciences).
Data analysis. Raw intensity data were analyzed for each Affymetrix array using two methods: Affymetrix Microarray Suite (MAS) version 5.0 software with the U74A mask file in place to yield “signal” values for each probe set and dChip software (available at www.dchip.org) to determine the model-based expression index (MBEI) of each gene (Li and Wong, 2001). To ascertain gene expression changes in MPTP-treated mice compared with saline-treated controls, three data mining methods were used: MAS 5.0 t test, dChip, and Statistical Analysis of Microarrays (SAM). For comparative analyses in MAS 5.0, all arrays were scaled to a target intensity of 500. The t test is a standard statistical measure performed in Affymetrix Data Mining Tool software version 3.0 to determine which genes were significantly different between the MPTP and saline groups (p < 0.01). dChip software was used to determine differentially expressed genes (using the MBEI for each probe set) (Li and Wong, 2001). Last, SAM was used to identify differentially expressed genes (using the MAS 5.0 signal for each probe set) as described (Tusher et al., 2001). These tools yielded three different “gene lists” for each of the MPTP groups. The list of significant genes from each independent method was imported into SAS 8.0 (SAS Institute, Inc., Cary, NC). Each of the files was merged based on the probe_id, and a variable was created to count the number of times the gene was found significant (maximum, 3). The merged gene set was exported into a comma-delimited file and loaded into FileMakerPro for ease in searching. The table was queried to report those genes found in three of three independent analysis lists. From this table, the most consistently called significant genes for each MPTP versus saline comparison was determined.
Raw intensity data from the CodeLink bioarrays were analyzed in Microsoft Excel (Microsoft, Redmond, WA) using a standard homoscedastic Student's t test comparison of each of the two MPTP-treated sample sets (MME and MML) to the control saline sample set (MMC) using both p < 0.001 and p < 0.01 as significance cutoffs. Only the fold changes >1.5 were considered. To evaluate changes in gene expression on Affymetrix and CodeLink arrays, we compared the lists of significant genes by name. We were able to detect greater overlap using the gene name than the accession number, possibly because many genes are recorded under more than one accession number.
Clustering. Hierarchical clustering was performed in dChip (version 1.1). A filtered gene list was created for 12 samples to be clustered (MC 1-4, MME 1-4, and MML 1-4) that satisfied the following criteria: (1) gene is present in ≥40% of arrays; and (2) coefficient of variance exceeds a threshold 0.1 ≤ SD/mean ≤ 20. Thus, only genes that were affected by the treatment (i.e., excluding invariant “housekeeping” genes) and present in the samples were used to cluster samples. PCA was also performed in dChip using the same filtered gene list. PCA was performed in language R (www.R-project.org) using the merged significant gene lists to confirm that differentially expressed genes were capable of distinguishing between treatment groups.
Validation. Selected gene expression changes were validated using quantitative real-time reverse transcription (RT)-PCR (qRTPCR) (ABI Sequence Detector 7700; PerkinElmer Life Sciences). Dual-label primer probe sets (Synthegen, Houston, TX; IDT, Coralville, IA) were designed against genes from Affymetrix and CodeLink arrays. cDNA was prepared from DNase I-treated total RNA (2 μg) isolated from the SN of saline- and MPTP-treated mice as above. At the conclusion of the reverse transcriptase reaction, samples were diluted to 100 μl, and 3 μl was used in each 7700 amplification. The amount of gene-specific template was estimated from a standard curve for each target and normalized to the amount of the transcription factor BFCOL1, which remained unchanged after MPTP treatment. Transcript changes from the microarrays were considered validated if the qRTPCR expression difference was in the correct direction and p < 0.05 by Student's t test or ANOVA.
Combined immunocytochemistry/in situ hybridization. Animals were treated with MPTP or saline as above for the MME group and perfused with 4% PFA (n = 4 per condition). Brains were removed, postfixed in PFA, and dehydrated in sucrose before freezing in isopentane. Cryostat sections (25 μm) were mounted such that saline and MPTP sections were located on the same slides. Sections were processed immunocytochemically for TH to identify dopamine neurons (Chemicon) as above and then hybridized to either sense or antisense in vitro transcribed [33P]-labeled probes to MAP-2, Pur-α, and DAT. The method for combined immunocytochemisty (ICC)/in situ hybridization (ISH) has been described in detail previously (Chow et al., 1998; Callahan et al., 1999). Slides were dipped in NTB-2 emulsion (Eastman Kodak, Rochester, NY) and developed 2-4 weeks later. Grain counts over 100-200 TH-immunopositive neurons were performed using a Provis microscope (Olympus) with the aid of an MCID Elite 6.0 software program (Imaging Research). The MCID software enabled the ability to capture the identical image into two channels. In one channel, a filter (F12) was applied to the image to remove the immunocytochemical stain from the image and enhance grain identification. This method facilitates accurate grain counting as verified previously (Callahan et al., 1999). Raw counts and grain density per cell data were exported to Microsoft Excel X (Microsoft) for comparison of MPTP and saline using Student's t test.
Results
MPTP lesion
MPTP is widely used to model nigrostriatal injury in rodents and non-human primates, however the dosing paradigms vary widely. Our laboratory has previously reported nearly complete degeneration of SN dopaminergic neurons and loss of DAT in the striatum by 12 d postlesion using the injection method described above (Brooks et al., 1999). Because we are interested in gene expression changes occurring in dopaminergic neurons after MPTP intoxication, we chose for our study two time points before 12 d, 24 hr and 7 d postlesion. Furthermore, we used a more sensitive technique for analysis of cell number in the SN, unbiased stereological counting. Using this technique, we determined that there was only a 35% reduction in TH-positive neurons in the SN at 7 d, which represents the stabilized lesion, because animals killed 21 d postlesion also had a 35% reduction in the number of TH-positive neurons (Fig. 1A). As a second method to evaluate the extent of MPTP-induced damage, we performed Western blotting for the DAT in the lesioned striatum. This marker is a sensitive indicator of damage or death to projecting dopaminergic nigrostriatal neurons. In contrast with the TH-positive cell counts, we observed a much more severe depletion of dopaminergic nerve terminals, as evidenced by nearly complete loss of DAT in this tissue (Fig. 1B).
Figure 1.
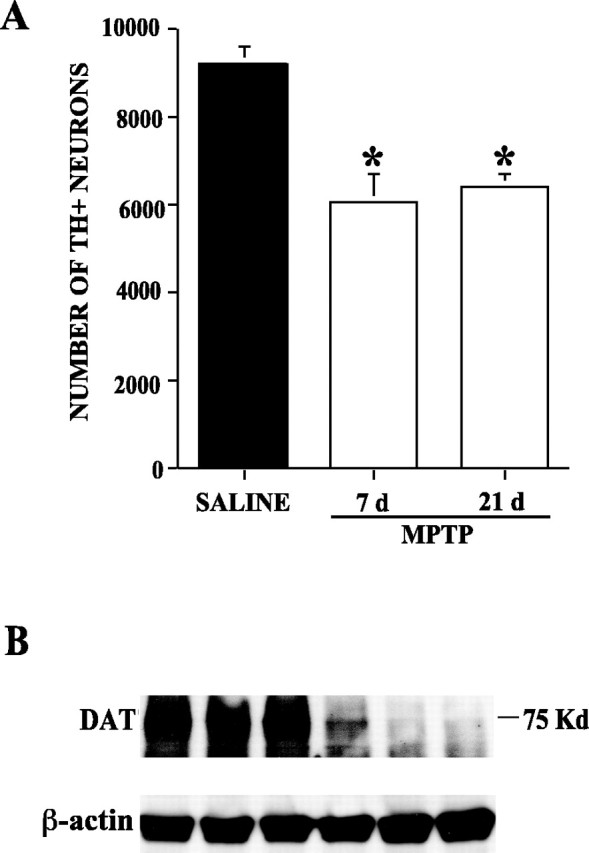
Analysis of MPTP-induced injury. Unbiased stereology was used to count the number of TH-positive neurons after four doses of MPTP at either 7 or 21 d after the last dose. There was a significant reduction in the number of TH-positive cells in MPTP mice compared with saline-injected mice at both time points (*p < 0.01). The 35% loss of cells appears to be stable, because additional death did not occur between 7 and 21 d (A). Data expressed as mean + SEM. MPTP also caused the selective loss of DAT protein in the striatum, an indication of the number of dopaminergic axons that innervate target cells there (B). Western blot illustrates striatum DAT levels from each of three mice for each group that when scanned densitometrically were significantly reduced compared with control (*p < 0.01).
Analysis of the SN
Gene expression differences between MPTP- and saline-treated mice may underlie critical pro-death and compensatory responses to injury in the SN. To explore these changes, we used two oligonucleotide microarray technologies and several data mining algorithms. Of 12,654 genes on the Affymetrix U74A array, we identified 1161 genes with expression that significantly differed from saline-treated mice at the early sacrifice time after MPTP treatment (MC vs MME groups) by t test (p < 0.01) (Table 1). Using the dChip software, 474 genes were significantly different at this time point in the SN (p < 0.01), and by SAM, there were 380 genes identified (Table 1). These three individual gene lists were merged to create a single list of 138 consistently changed genes. In parallel, we analyzed the samples using Amersham CodeLink arrays, which rely on a single probe for target hybridization. Therefore, data were analyzed using only a t test to compare the MME and MC groups. A total of 729 genes, 425 of which were also present on Affymetrix U74A GeneChips, were identified as significantly differentially expressed (p < 0.01), with 389 upregulated genes and 340 downregulated genes. All gene expression data and significantly differentially expressed gene lists are available as supplemental material (available at www.jneurosci.org/cgi/content/full/24/34/9445/DC1).
Table 1.
Number of differentially expressed genes by each method
|
|
ttest |
dChip |
SAM |
Merge |
CodeLink |
|---|---|---|---|---|---|
| MME | 1161 | 474 | 380 | 138 | 729 |
| MML |
637 |
978 |
221 |
86 |
763 |
Using microarray expression profiling (from either array platform), in the MME group, which was killed 24 hr after MPTP treatment, there were a number of genes related to cell adhesion, synaptic activity, and axonal transport whose expression was downregulated. Adhesion-related molecules included nectin-like 1 (necl-1), cadherin 13, E-selectin ligand, and carcinoembryonic antigen-related cell adhesion molecule 1. This group of gene products, along with others, appears to participate in cell-cell contact, perhaps at the sites of synapses in the case of necl-1 (for review, see Takai et al., 2003). The synapse-associated genes synapsin 3, syntaxin-binding protein 4, N-ethylmaleimide sensitive fusion protein, and Cadps (Ca2+-dependent activator for secretion) were altered. The primary defect was seen in members of the kinesin superfamily (KIF 5a, 2c, 1a, and 1b) but also included other important transport stability elements such as microtubule-associated (MAP) proteins 2, 4, and 6 and ELK L motif kinase (Emk). Upregulated genes at the early time point were identified only by CodeLink arrays and included several caspases, Ca2+ calmodulin-dependent kinase 2, and chromogranin B. The profile obtained from our integrative microarray analysis strongly suggests that among the alterations occurring in the SN MME lesion, the SN neuronal population may be rendered widely incapable of effective anterograde or retrograde communication with target neurons.
At the later time point, fewer overall changes in gene expression were observed for both array platforms in the SN, suggesting a partial return to baseline by 7 d after MPTP intoxication. From the Affymetrix U74A arrays, we compared MC and MML samples by a t test, dChip, and SAM. There were 637 genes changed by t test (p < 0.01), 978 by dChip (p < 0.01), and 221 genes by SAM (Table 1). The merged three individual lists generated a single list of 86 consistently modulated genes. Using the CodeLink technology, we obtained 763 significantly changed genes, of which 431 probes were also present on Affymetrix arrays. Of the 763 genes, 438 were upregulated and 325 were downregulated. The full data set is available as supplemental material (available at www.jneurosci.org/cgi/content/full/24//34/9445/DC1).
There were fewer decreased transcripts unique to the 7 d time point, but some interesting changes were noted in the synapse-related genes synapsin 1, syntaxin-binding protein 1, vesicle-associated membrane protein 2 (VAMP2), synaptotagmin 4, and synaptogyrin 1, which suggest continued impairment of synaptic transmission. The upregulated genes at this time point were osmotic stress protein 94, VAMP8, synphilin, cyclin-dependent kinase (cdk) inhibitor p19, and cdk 5 regulatory subunits p39 and p19. In addition, the cdk 5 regulatory subunit p35 transcript was decreased in the MML SN. These expression changes may indicate an alteration in the postmitotic status of SN neurons.
Many gene products were altered at both time points after MPTP, suggesting a sustained response program in the SN. A number of genes were significantly differentially expressed in MME and MML samples by either one or both array platforms. Notable genes with expression that was increased in both groups were two ubiquitin conjugating enzymes, one ubiquitin E3 ligase, three ribosomal proteins, RNA helicase RCK, brain-derived neurotrophic factor, tau, and caspase-3. Downregulated genes at both time points included pur-α, E-selectin ligand, serine arginine-rich protein kinase 2 (SRPK 2), Emk, stearoyl coenzyme A desaturase (SCD), RAN GTPase activating protein, Ras GTPase activating protein SH3 domain-binding protein, the NMDA glutamate receptor ζ 1, and Hu antigen D (ELAV).
In addition, we evaluated changes in the expression of genes called significant by both microarray platforms, Affymetrix and CodeLink. Although both platforms identified many differentially expressed genes, only a few of these were found common to both. At the early sacrifice point, there were 11 identical gene expression changes between MME and MC samples (Fig. 2A). At the 7 d point, there were 12 identical gene expression changes (Fig. 2B). Of these, four genes were changed (downregulated) at both time points (Emk, pur-α, SRPK 2, and E-selectin ligand) (Fig. 2C).
Figure 2.
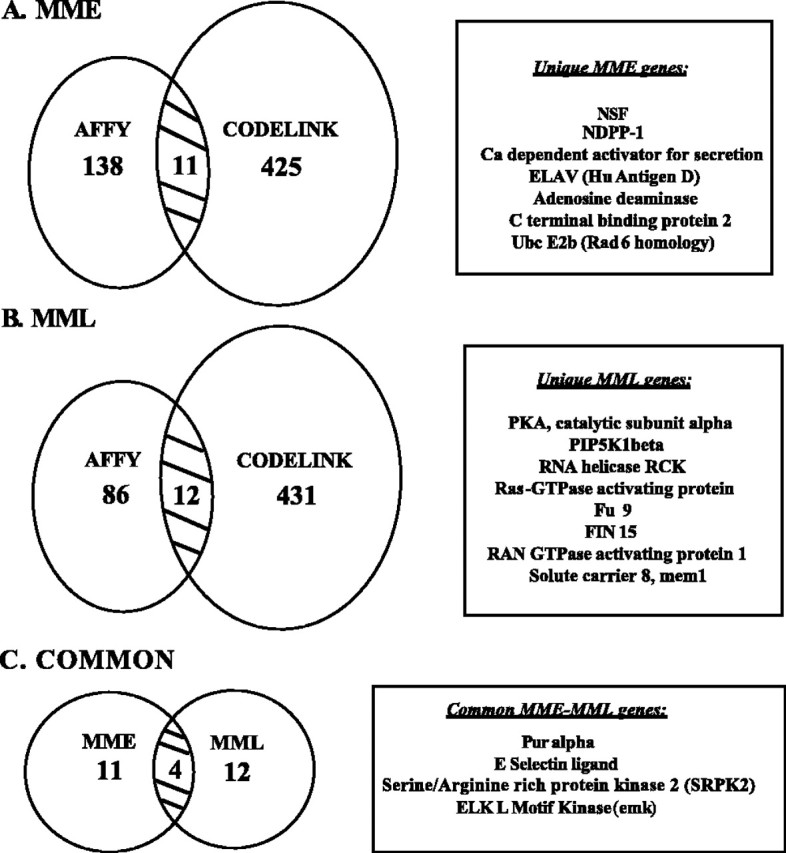
Comparison of significant genes identified by two array platforms. We hypothesized that gene changes important for MPTP pathophysiology would be identified by both Affymetrix and CodeLink arrays. Only genes present on both array platforms were included in the analysis. The overlap was determined by comparing gene information associated with the probe of each platform, using only genes that were significantly differentially expressed (for MME, 425 of 729 genes; for MML, 431 of 763 genes overlapped). Although there were hundreds of gene expression changes that surpassed the significance cutoff, only 11 (A; MME vs MC) or 12 (B; MML vs MC) genes were consistently altered by ALL methods for both array platforms in our study. Of these, four were downregulated at both of the time points examined after MPTP treatment (C).
Validation
Selected transcripts whose expression change was significant by microarray were examined using qRTPCR (Table 2). Genes selected for validation were those with expression changes that were either among the ones most consistently called significant by both platforms and/or most apparently important with respect to known dopaminergic functions. Not all genes thought to be important in this injury model have been validated to date. A majority of the selected genes were validated in one or both MPTP-treated groups compared with saline-injected controls (20 of 32 or 62.5%). The highest success in validation was for genes found to be significant by both array platforms (10 of 11 or 91%). Genes found significant only by the CodeLink technology validated successfully at the rate of 72.7% (8 of 11), whereas those significant only by Affymetrix arrays validated 20% of the time (2 of 10). The expression changes of several genes (E-selectin ligand, synphilin, caspase-3, and SCD) failed to validate the expression change seen in microarray analysis. A potential role for these gene products in MPTP toxicity is not ruled out, because other studies implicate caspase-3 and synphilin in SN degeneration (see Discussion). Of the other genes with an expression change that was not confirmed by qRTPCR, many were initially identified as significant by one or more of the Affymetrix analysis techniques only. Importantly, validation of expression levels of genes related to axonal transport, synapses, and cell cycle was successful.
Table 2.
Validation by qRTPCR of selected gene expression changes in the MPTP-treated SN
|
Gene namea |
Direction of change |
Arrayb |
qRTPCRc (p < 0.05?) |
|---|---|---|---|
| 14-3-3 γ | Decrease | B | Yes |
| Acetylcholinesterase | Decrease | B | Yes |
| Alix | Decrease | A | No |
| Anion exchanger 3 | Decrease | A | No |
| BAP 135 homolog | Decrease | A | No |
| BDNF | Increase | B | Yes |
| Capping protein β1 | Decrease | A | No |
| Caspase-1 | Increase | C | ND |
| Caspase-3 | Increase | C | No |
| Caspase-8/FADD Regulator | Increase | C | ND |
| Cdk5r (p35) | Decrease | C | Yes |
| Cdk5r2 (p39) | Increase | C | Yes |
| Cdkn2d (p19) | Increase | C | No |
| DAT | Decrease | C | Yes |
| DNA-binding proteind | Decrease | A | No |
| Dynein | Decrease | B | ND |
| Emk | Decrease | B | Yes |
| E-selectin ligand | Decrease | B | No |
| KIF1A | Decrease | C | Yes |
| KIF5A | Decrease | C | Yes |
| KIF1B | Decrease | C | Yes |
| KIFC2 | Decrease | B | Yes |
| Map-2 | Decrease | C | Yes |
| Na/K ATPase | Decrease | A | No |
| NSF | Decrease | B | Yes |
| NIMA | Decrease | C | ND |
| Pur-α | Decrease | B | Yes |
| RANGAP 1 | Decrease | B | Yes |
| RASGAP (G3bp) | Decrease | B | Yes |
| SRPK2 | Decrease | B | Yes |
| SCDd | Decrease | A | No |
| Synapsin 3 | Decrease | C | ND |
| Synaptogyrin 1 | Decrease | C | ND |
| Synaptogyrin 3 | Decrease | C | ND |
| Synaptotagmin 4 | Decrease | C | ND |
| Synaptotagmin 10 | Decrease | C | ND |
| Synphilin | Increase | C | No |
| Syntaxin 1d | Decrease | A | Yes |
| Tau | Increase | B | ND |
| TH | Decrease | C | Yes |
| Tubulin β-3 | Increase | C | ND |
| Ubiquitind | Increase | A | ND |
| UCHL 1 | Decrease | A | Yes |
| VATP subunit D |
Decrease |
A |
No |
The full names and accession numbers of genes are available as supplemental material (available at www.jneurosci.org/cgi/content/full/24/34/9445/DC1).
The gene was found to be significantly differentially expressed on Affymetrix arrays only (A), CodeLink arrays only (C), or on both arrays (B).
Gene expression levels were compared between saline- and MPTP-treated SN samples. Differences in the correct direction that exceeded the cutoff of p < 0.05 were considered to validate the microarray changes. ND, Not determined.
Not represented on the CodeLink platform.
To further validate transcript changes with respect to TH-positive neurons, we performed combined ICC/ISH for a few selected target mRNAs known to encode proteins important to neuronal function. From among the genes that were successfully validated by qRTPCR, we chose to examine expression of MAP-2, pur-α, and DAT by ISH in dopamine neurons in the SN. Quantitative comparison of grain density over TH-positive neurons in MME SN compared with MC SN showed that DAT, pur-α, and MAP-2 messages were significantly reduced in MPTP-treated TH-positive cells, indicating that these changes occurred in the same cell population targeted by the MPTP treatment (Fig. 3).
Figure 3.

ISH to validate selected gene expression changes in dopamine neurons. Quantitative grain density counts were obtained for three genes that were identified as significantly differentially expressed between MPTP- and saline-treated mice and validated by qRTPCR. These genes were MAP-2, DAT, and Pur-α. Significant reductions in grain density were observed over TH-immunopositive neurons for MAP-2, DAT, and Pur-α (*p < 0.05). Data presented are mean + SEM.
Clustering analysis
To assess whether gene expression changes underlie the biological effects of MPTP, clustering analyses was performed in dChip. We predicted that the pattern of expression levels of a subset of genes could correctly sort the samples (arrays) into their treatment groups. Selecting genes that were called “present” in at least 40% of arrays, and also excluding genes that exhibit minor variation across arrays (0.1 ≤ SD/mean MBEI ≤ 20), a filtered gene list was created. This list is enriched in potentially important genes that are not only expressed in the mouse SN but are regulated under oxidative injury (i.e., are not housekeeping genes). We found that the filtered gene list successfully segregated the 12 SN samples (MC 1-4, MME 1-4, and MML 1-4) into their respective experimental groups based solely on their pattern of expression (Fig. 4). Furthermore, from the clustering dendrogram, it was apparent that the MML (7 d) samples were more closely related to control (MC) samples than to MME (24 hr time point), suggesting cellular compensation and return to baseline at this later time point. Of 23 functionally defined gene groups tested, 12 clustered the samples in this manner (Fig. 5). Interestingly, two groups, those genes called “transcription factor binding” and “signal transducer,” successfully clustered samples into their respective treatment groups, but this dendrogram showed that the two MPTP-treated groups were more closely related to each other than either was to the control group (Fig. 5). The remaining nine functional groups were unable to correctly cluster the samples by treatment (i.e., MME and MML samples were intermingled with MC samples).
Figure 4.

Effective sample clustering by informative genes. Affymetrix U74A probe sets were filtered by dChip to yield a 2102 member gene list for use in sample clustering. The expression patterns of these genes in the 12 arrays (saline and chronic MPTP treatments) segregated arrays into the proper treatment groups. Although all arrays are correctly partitioned by injury status, the analysis showed that the MML group was more closely related to the control group, possibly indicating some transcriptional recovery at this later time point. Numbers represent the four samples (arrays) in each of the three groups.
Figure 5.

Sample clustering by groups of functionally similar genes. Using Affymetrix U74A GeneChip data, 23 groups of genes having the same general cell function were tested for their ability to cluster the 12 SN samples from saline (MC; n = 4), MPTP early (MME; n = 4) and MPTP late (MML; n = 4). The dendrograms indicate the distance between groups. Below each dendrogram are the gene class names that created it, with the number of genes in that class in parentheses. The majority of gene groups that were able to correctly segregate the 12 samples into the three disease states did so indicating that the MML group was more closely related to the controls than the MME group. However, two gene groups were identified that not only correctly assigned each sample to the appropriate treatment group, but the expression of these genes was more similar between the two MPTP time points than either MPTP group was to controls. Nine of the functional gene groups failed to correctly segregate samples into three distinct treatment groups.
To further demonstrate that genes identified as significantly different between MPTP- and saline-treated SN were informative with respect to injury status, we performed PCA with the merged list of genes from each treatment. When the 12 samples were plotted in the two dimensions defined by PC1 and PC2, there was significant separation between the four control samples (MC 1-4), the four chronic, late time MPTP animals (MML1-4), and the four chronic, early time MPTP animals (MME 1-4) (Fig. 6). This analysis also highlights the observation that MML samples appear closer to controls than do MME samples, although the two MPTP treatment groups are clearly segregated from the saline group.
Figure 6.

PCA of MPTP-treated samples. PCA of the Affymetrix GeneChip data indicates that each treatment group's samples occupy nonoverlapping areas in the two-dimensional space defined by PC1 and PC2. The samples can also be seen to fall into two different pairings: one in which the controls and MPTP late samples (▪) share the bottom left area and the MPTP early samples (▧) are alone in the top right area, and another in which the controls (□) are alone in the far left area, whereas the two MPTP groups occupy the right side of the space. These are precisely the two different pairings seen in hierarchical clustering.
Discussion
Selection of microarrays and data mining methods
Our approach to identifying novel pathway changes in the MPTP-damaged SN is based on the determination of the significant gene expression changes across several data mining methodologies and array platforms. The Affymetrix GeneChip system is among the most widely used platforms for oligonucleotide microarray experiments. However, it is apparent from our merged data analysis that the agreement as to which gene expression changes exceed a threshold of significance is quite low. It has also been noted that Affymetrix oligonucleotide arrays fail to accurately predict differences in genes expressed at low levels (Blalock et al., 2003; Irizarry et al., 2003). We therefore applied our samples to a single probe oligonucleotide array, CodeLink, that has the advantage of mimicking fluid-phase hybridization kinetics and is believed to facilitate the detection of smaller gene expression changes. Indeed, only the CodeLink array detected significantly increased genes in MME samples. Importantly, genes identified as significantly changed by both array platforms were validated most often, 91% of the time, indicating that our novel integrative data mining approach afforded the best prediction of genes changed.
Anatomical, pathological, and cell type considerations
The microarray data reported here were obtained from cells within a well delineated nucleus of brain tissue, the SN. Therefore, the mRNA analyzed was provided by both SN glial and neuronal populations. Because MPTP administration affects microglia and astroglia (Wu et al., 2002; Muramatsu et al., 2003; Furuya et al., 2004), it cannot be concluded that the changes identified by the microarray analysis occur exclusively within the neuronal compartment. However, several points help orient the conclusions drawn from these analyses. First, TH-positive neurons, although a small fraction of the total number of SN neurons, are uniquely vulnerable to the MPTP injury and are those that succumb in this paradigm. This suggests that the gene expression contributions from this subpopulation are likely to be marked relative to the nonvulnerable populations and, accordingly, could contribute substantially to the measured profiles evolving over time in the MME and MML samples. Second, the alterations in transcripts that are neuronal specific must derive from either the TH-positive or TH-negative, presumptive GABAergic, neurons. Given the fact that GABAergic neurons neither uptake nor respond to MPP+, the only plausible mechanisms that could support a contribution to the observed gene dysregulation are circuit related or bystander. To the former point, previous work with an MPTP mouse model found a significant decrease in GABAB mRNA by ISH within the SN pars compacta (Calon et al., 2001). Because our array studies did not detect alteration in this transcript within either the MME or MML suggests the signal contribution and likely overall GABAergic neuronal contributions are quite small relative to the changes within the TH-positive population. Third, we used combined ISH and ICC to quantitate three transcripts (MAP-2, pur-α, and DAT) shown by array analyses to be altered by MPTP treatment. We found that grain densities for MAP-2, pur-α, and DAT were significantly decreased over dopaminergic neurons of MME-treated mice compared with grain densities over MC TH-positive neurons. These data indicate that at the single dopaminergic cell level, we have validated gene expression changes determined by microarray analysis. In aggregate, these considerations support the conclusion that of the observed gene expressions, those encoding neuron-specific gene products, reflect changes within the TH-positive subpopulation. We note that changes in non-cell type-specific transcripts (e.g., cell cycle, signal transduction, cytoskeletal, or cell adhesion) could arise from alterations in other cellular compartments including microglia and astroglia. Extensive combination of double ICC with ISH (Callahan et al., 2002) will be required to address which of these cell types are associated with specific mRNA changes.
Although cell loss is an evident part of the MPTP injury response as evidenced by a 35% cell loss by 7 d after MPTP treatment, it is unlikely that the reductions of message detected by microarray analysis are attributable to cell loss. We base this statement on the following observations. First, equivalent cRNA (+10 μg) was loaded onto the microarrays for each treatment group. Second, substantial gliosis was not observed in this paradigm for MPTP treatment of mice based on cresyl violet analysis of the MME group (data not shown). Thus, the gene alterations reported by microarray analysis here are likely attributable to alterations within transcripts of surviving neurons and glia and are not the result of cell loss. This statement is supported by our ISH data. Specifically, analysis of individual TH-positive neurons revealed a reduction of three messages that were also reduced by microarray analysis. Given that TH-positive neurons comprise a relatively small fraction of total cells within the SN, it is possible that modest, but important, changes within this compartment could have been masked by proportional dilution of their signal. Other methods such as laser capture dissection, followed by microarray analyses in which faithful recovery of RNA from this subpopulation occurs in sufficient quantities, is necessary to identify such putative gene expression changes.
Clustering analysis
Unsupervised PCA was used to evaluate the time-dependent response to nigrostriatal injury. Rather than a linear shift in the molecular space occupied by the SN samples, our study showed that MML samples were closer to controls than MME samples (Figs. 4, 5, 6). We favor the interpretation that many genes with an expression that is perturbed early are returned to their normal level 1 week later. Additional time points would be needed to determine whether the MPTP-treated SN expression profile returns to normal or moves further from controls in a pattern that would imply cell death. The data presented here underscore the molecular plasticity of the gene signature of SN neurons. We report a gene signature that indicates substantial changes in expression in many genes initially after injury, followed by a return to near normal levels for a number of key functional genes. This return occurs in the face of a reduction of the population of TH-positive neurons, suggesting compensation. Our data predict the gene signature of PD will be highly dependent on the time of analysis because surviving SN neurons appear to possess the repertoire to regulate expression within surviving TH-positive neurons in the setting of cell loss.
Unsupervised hierarchical clustering highlighted the importance of the functional classification in segregating MPTP- and saline-treated SN (Fig. 5). The majority of gene classes indicated that the MML and MC SN were most transcriptionally similar. Genes related to signal transduction pathways and transcription factor binding segregated all eight MPTP-treated samples into a separate branch than controls, indicating that they may play a role in the ongoing injury response. Several groups, most notably those associated with cell death, failed to segregate samples by treatment group. Perhaps, even in a mouse model in which the disease process is compressed into weeks rather than years, not all cells are equally receptive to injury nor enact equally efficacious survival programs and, therefore, would not undergo cell death simultaneously.
A model of injury
MPTP has been studied extensively in both mice and non-human primates as a selective mediator of dopaminergic cell compromise and death (Wesemann et al., 1993; Kowall et al., 2000; Chassain et al., 2001; Przedborski et al., 2001; Tillerson et al., 2002). We observed a 35% reduction in the number of TH-positive neurons in the SN after our MPTP treatments, consistent with results from other studies using a semi-chronic MPTP paradigm (Hayley et al., 2004). Previous work appears to have overestimated the extent of cell death resulting from this dosing schedule, perhaps because of the alternate methods used (retrograde fluorogold labeling) (Brooks et al., 1999). Fluorogold has been shown to be a toxic molecule under certain circumstances (Garrett et al., 1991) and, in combination with MPTP, may have rendered SN neurons far more vulnerable to death. We observed a severe depletion of dopaminergic axon terminals in the striatum as reported previously (Brooks et al., 1999), as evidenced by loss of DAT protein in this brain region. These findings, taken with the gene expression results reported here, support the notion that the earliest site of injury in this model is the presynaptic terminal of the dopaminergic neuron, and it is the loss of connectivity with the target cell population(s) that may underlie phenotypic abnormalities in disease.
There has emerged a sequence of events that result ultimately in the loss of ventral midbrain dopamine neurons. After administration of MPTP, its conversion to MPP+, DAT-mediated uptake, and blockade of complex I of the respiratory chain are well recognized to produce free radicals and loss of capacity to generate ATP. NO synthase appears necessary to generate NO that in midbrain neurons reacts with OH- to form peroxynitrite (ONOO-) (Dawson and Dawson, 1998; Ryu et al., 2002). Subsequent macromolecular damage to dopaminergic neuronal proteins, lipids, and genomic DNA ensues (Souza et al., 2000; Lee and Charlton, 2001; Park et al., 2002).
There is evidence for a mitochondrial-to-nuclear signal after inhibition of the electron transport chain that results in the regulation of nuclear-encoded transcripts (Suzuki et al., 1998; Brill and Bennett, 2003). Our analysis did not uncover changes in gene expression that directly link reduced ATP production and oxygen radical generation to the alteration of transcript levels at two time points after injury. Examination of earlier time points might reveal changes in the expression of a gene(s) that is responsive to reactive oxygen species and can direct the downstream changes we observe.
The functional consequences of MPTP-regulated transcripts appear to impinge on cellular viability through two discrete paths. First, we found that cytoskeletal architecture and associated maintenance functions are impaired, suggesting cells are less capable to manufacture, release, and uptake dopamine. Second, multiple trophic signal transduction processes and cell cycle controls are affected and are consistent with the apoptosis described by others in this model (Mandir et al., 1999; Mochizuki et al., 2001).
Cytoskeletal maintenance and synaptic integrity
One important cell biological domain affected by MPTP treatment is the cytoskeletal network. There are decreases in gene expression of the molecular motors of the cell, kinesin (KIF-2C, KIF1B, KIF1A, KIF5A), and dynein, at early time points, as well as differences in the messages encoding microtubule-associated proteins (MAP-2 and tau). Loss of kinesin and dynein expression render cells defective in axonal transport (Kondo et al., 1994; Takemura et al., 1996; Su et al., 1997; Martin et al., 1999). One of the most downregulated genes in our MPTP model was Emk. Emk phosphorylates tau, MAP-2, and MAP-4, thereby reducing their affinity for microtubules and destabilizing them (Drewes et al., 1997). Additional studies have shown that disruption of Emk function results in loss of cellular polarity (Bohm et al., 1997). Although not yet examined in neurons, Emk expression is likely important for the regulation of neuronal polarity through interactions with cytoskeletal elements.
Our results suggest that a key part of the evolving cascade of injury after MPTP is axonal degeneration and loss of synapses. We observed decreased expression of synapsin 3, synaptotagmin 4 and 10, and synaptogyrin 1 and 3 in the SN of MPTP-treated mice. The Ca2+-dependent activator for secretion transcript shows a sustained decrease in the SN after MPTP delivery. These alterations in gene products that are important for vesicular docking and transmitter release could affect the ability of dopaminergic neurons in the SN to release sufficient DA into the striatum. In aggregate, defects in cytoskeletal function and secretory dynamics likely account for the rapid and sustained failure of dopaminergic neurotransmission after MPTP injury.
Cell cycle and apoptosis
A small number of gene expression alterations pertain to the mitotic status of SN cells. Reduction of Pur-α, a multifunctional RNA- and DNA-binding protein, is expected to manifest effects on proliferation, transcription, translation, and targeting of proteins to various subcellular compartments. Pur-α binds dendritic targeting motifs and aids in their attachment to microtubules (Kobayashi et al., 2000; Ohashi et al., 2000). Pur-α through binding of the retinoblastoma protein inhibits cell cycle progression (Itoh et al., 1998; Stacey et al., 1999; Darbinian et al., 2001). Diminished expression may release cell cycle regulatory control and perhaps initiate apoptosis in postmitotic neurons. Changes in expression for different cdk5 regulatory components were detected by both arrays and validated. Although abortive cell cycle progression has been implicated in neuronal apoptosis in Alzheimer's disease (Vincent et al., 1997, 1998; Dranovsky et al., 2001; Tomashevski et al., 2001), its role in PD is less secure (Shirvan et al., 1997). One transcriptional target of Pur-α is TGF-β (Thatikunta et al., 1997), a noted survival factor for midbrain dopaminergic neurons (Poulsen et al., 1994). These findings suggest Pur-α downregulation elicits many secondary events that jeopardize cell viability and perhaps trigger apoptosis in MPTP-lesioned dopamine neurons.
It would be supportive of the generally held belief that model systems capitulate human disease, albeit in a compressed time frame, if our studies were able to detect gene expression changes consistent with existing literature from the study of human PD. In fact, several of the genes identified by the arrays are known components of Lewy bodies (synphilin, 14-3-3 proteins, tau, ubiquitin) (Ubl et al., 2002; Ishizawa et al., 2003). Thus, although we do not observe any Lewy body-like inclusions in this MPTP model, it appears that cells residing in the SN enact a transcriptional response similar to that seen in the human brain. Tubulins are substrates of parkin-mediated ubiquitination and degradation, and failure to ubiquitinate tubulin is a major source of toxicity for cells (Ren et al., 2003). We observed tubulin dysregulation (increased β-3 isoform) in the SN of MPTP-treated animals, which could potentially overwhelm the proteosomal system and contribute to the impairment of axonal transport and presynaptic function. Mutations in the gene ubiquitin C-terminal hydrolase (UCHL1) have been implicated in familial PD (Leroy et al., 1998). The UCHL1 message was decreased in the mouse SN after MPTP treatment, possibly placing an additional burden on the cellular degradation machinery.
Overall, our study identified a set of dysregulated genes in the SN that we posit are responsible for dopaminergic neuron injury, dysfunction, and death. Whether the MPTP-induced gene expression alterations represent a pathway shared by other models of parkinsonism and, most importantly, the human disease will require comparison of gene expression signatures across these entities.
Footnotes
This work was supported by Rochester Nathan Shock Center Grants P30AG18254 and RO1 ES09391 to H.J.F. and a Glenn/American Federation for Aging Research fellowship to R.M.M. We thank Dr. S. Przedborski for helpful discussion of MPTP treatments and the Nathan Shock Center of Excellence Bioinformatics and Microarray Core Facilities at the University of Rochester for array handling and processing. We thank Drs. W. J. Bowers, L. Henricksen, K. Maguire-Zeiss, and H. Yeh for critical reading and discussion of this manuscript.
Correspondence should be addressed to Dr. Howard J. Federoff, Center for Aging and Developmental Biology, Aab Institute for Biomedical Research, University of Rochester, Box 645, 601 Elmwood Avenue, Rochester, NY 14642. E-mail: howard_federoff@urmc.rochester.edu.
Copyright © 2004 Society for Neuroscience 0270-6474/04/249445-10$15.00/0
R.M.M. and L.M.C. contributed equally to this work.
References
- Ali RR, Reichel MB, de Alwis M, Kanuga N, Kinnon C, Levinsky RJ, Hunt DM, Bhattacharya SS, Thrasher AJ (1998) Adeno-associated virus gene transfer to mouse retina. Hum Gene Ther 9: 81-86. [DOI] [PubMed] [Google Scholar]
- Beal F (2001) Experimental models of Parkinson's disease. Nat Rev Neurosci 2: 325-332. [DOI] [PubMed] [Google Scholar]
- Bezard E, Jaber M, Gonon F, Boireau A, Bloch B, Gross CE (2000) Adaptive changes in the nigrostriatal pathway in response to increased 1-methyl-4-phenyl-1,2,3,6-tetrahydropyridine-induced neurodegeneration in the mouse. Eur J Neurosci 12: 2892-2900. [DOI] [PubMed] [Google Scholar]
- Blalock EM, Chen K-C, Sharrow K, Herman JP, Porter NM, Foster TC, Landfield PW (2003) Gene microarrays in hippocampal aging: statistical profiling identifies novel processes correlated with cognitive impairment. J Neurosci 23: 3807-3819. [DOI] [PMC free article] [PubMed] [Google Scholar]
- Bohm H, Brinkmann V, Drab M, Henske A, Kurzchalia TV (1997) Mammaliam homologues of C. elegans PAR-1 are asymmetrically localized in epithelial cells and may influence their polarity. Curr Biol 7: 603-606. [DOI] [PubMed] [Google Scholar]
- Brill II LB, Bennett Jr JP (2003) Dependence on electron transport chain function and intracellular signaling of genomic responses in SH-SY5Y cells to the mitochondrial neurotoxin MPP+. Exp Neurol 181: 25-38. [DOI] [PubMed] [Google Scholar]
- Brooks AI, Chadwick CA, Gelbard HA, Cory-Slechta DA, Federoff HJ (1999) Paraquat elicited neurobehavioral syndrome caused by dopaminergic neuron loss. Brain Res 823: 1-10. [DOI] [PubMed] [Google Scholar]
- Callahan L, Vaules W, Coleman P (1999) Quantitative decrease in synaptophysin message expression and increase in cathepsin D message expression in Alzheimer disease neurons containing neurofibrillary tangles. J Neuropathol Exp Neurol 58: 275-287. [DOI] [PubMed] [Google Scholar]
- Callahan LM, Vaules WA, Coleman PD (2002) Progressive reduction of synaptophysin message in single neurons in Alzheimer disease. J Neuropathol Exp Neurol 61: 384-395. [DOI] [PubMed] [Google Scholar]
- Calon F, Lavertu N, Lemieux AM, Morissette M, Goulet M, Grondin R, Blanchet PJ, Bedard PJ, Di Paolo T (2001) Effect of MPTP-induced denervation on basal ganglia GABA(B) receptors: correlation with dopamine concentrations and dopamine transporter. Synapse 40: 225-234. [DOI] [PubMed] [Google Scholar]
- Chassain C, Eschalier A, Durif F (2001) Assessment of motor behavior using a video system and a clinical rating scale in parkinsonian monkeys lesioned by MPTP. J Neurosci Methods 111: 9-16. [DOI] [PubMed] [Google Scholar]
- Chiba K, Trevor A, Castagnoli Jr N (1985) Active uptake of MPP+, metabolite of MPTP, by brain synaptosomes. Biochem Biophys Res Commun 128: 1228-1232. [DOI] [PubMed] [Google Scholar]
- Chow N, Cox C, Callahan L, Weimer J, Guo L, Coleman P (1998) Expression profiles of multiple genes in single neurons of Alzheimer's disease. Proc Natl Acad Sci USA 95: 9620-9634. [DOI] [PMC free article] [PubMed] [Google Scholar]
- Cruz-Sanchez FF, Cardozo A, Ambrosio S, Tolosa E, Mahy N (1993) Plasticity of the nigrostriatal system in MPTP-treated mice. Mol Chem Neuropathol 19: 163-176. [DOI] [PubMed] [Google Scholar]
- Darbinian N, Gallia GL, King J, Del Valle L, Johnson EM, Khalili K (2001) Growth inhibition of glioblastoma cells by human pur(alpha). J Cell Physiol 189: 334-340. [DOI] [PubMed] [Google Scholar]
- Davis GC, Williams AC, Markey SP, Ebert MH, Caine ED, Reichert CM, Kopin IJ (1979) Chronic parkinsonism secondary to intravenous injection of meperidine analogs. Psychiatry Res 1: 249-254. [DOI] [PubMed] [Google Scholar]
- Dawson VL, Dawson TM (1998) Nitric oxide in neurodegeneration. Prog Brain Res 118: 215-229. [DOI] [PubMed] [Google Scholar]
- Dipasquale B, Marini M, Youl RJ (1991) Apoptosis and DNA degradation by 1-methyl-4-phenylpyridinium ion (MPP+) in neurons. Biochem Biophys Res Commun 181: 1442-1448. [DOI] [PubMed] [Google Scholar]
- Dranovsky A, Vincent I, Gregori L, Schwarzman A, Colflesh D, Enghild J, Strittmatter W, Davies P, Goldgaber D (2001) Cdc 2 phosphorylation of nucleolin demarcates mitotic stages and Alzheimer's disease pathology. Neurobiol Aging 105: 639-650. [DOI] [PubMed] [Google Scholar]
- Drewes G, Ebneth A, Preuss U, Mandelkow EM, Mandelkow E (1997) MARK, a novel family of protein kinases that phosphorylate microtubule-associated proteins and trigger microtubule disruption. Cell 89: 297-308. [DOI] [PubMed] [Google Scholar]
- Furuya T, Hayakawa H, Yamada M, Yoshimi K, Hisahara S, Miura M, Mizuno Y, Mochizuki H (2004) Caspase-11 mediates inflammatory dopaminergic cell death in the 1-methyl-4-phenyl-1,2,3,6-tetrahydropyridine mouse model of Parkinson's disease. J Neurosci 24: 1865-1872. [DOI] [PMC free article] [PubMed] [Google Scholar]
- Garrett WT, McBride RL, Williams JKJ, Feringa ER (1991) Fluor-Gold's toxicity makes it inferior to True Blue for long-term studies of dorsal root ganglion neurons and motoneurons. Neurosci Lett 128: 137-139. [DOI] [PubMed] [Google Scholar]
- Hayley S, Crocker SJ, Smith PD, Shree T, Jackson-Lewis V, Przedborski S, Mount M, Slack R, Anisman H, Park DS (2004) Regulation of dopaminergic loss by Fas in a 1-methyl-4-phenyl-1,2,3,6-tetrahydropyridine model of Parkinson's disease. J Neurosci 24: 2045-2053. [DOI] [PMC free article] [PubMed] [Google Scholar]
- Hoppel CL, Greenblatt D, Kwok HC (1987) Inhibition of mitochondrial respiration by analogs of 4-phenylpyridine and 1-methyl-4-phenylpyridinium cation (MPP+), the neurotoxic metabolite of MPTP. Biochem Biophys Res Commun 148: 684-693. [DOI] [PubMed] [Google Scholar]
- Irizarry RA, Bolstead BM, Collin F, Cope LM, Hobbs B, Speed TP (2003) Summaries of Affymetrix GeneChip probe level data. Nucleic Acids Res 31: 1-8. [DOI] [PMC free article] [PubMed] [Google Scholar]
- Ishizawa T, Mattila P, Davies P, Wang D, Dickson DW (2003) Colocalization of tau and alpha-synuclein epitopes in Lewy bodies. J Neuropathol Exp Neurol 62: 389-397. [DOI] [PubMed] [Google Scholar]
- Itoh H, Wortman MJ, Kanovsky M, Uson RR, Gordon RE, Alfano N, Johnson EM (1998) Alterations in Pur(alpha) levels and intracellular localization in the CV-1 cell cycle. Cell Growth Differ 9: 651-665. [PubMed] [Google Scholar]
- Javitch JA, D'Amato RJ, Strittmatter SM, Snyder SH (1985) Parkinsonism-inducing neurotoxin N-methyl-4-phenyl-1,2,3,6-tetrahydropyridine: uptake of the metabolite N-methyl-4-phenylpyridine by dopamine neurons explains selective toxicity. Proc Natl Acad Sci USA 82: 2173-2177. [DOI] [PMC free article] [PubMed] [Google Scholar]
- Kobayashi S, Agui K, Kamo S, Li Y, Anzai K (2000) Neural BC1 RNA associates with pur alpha, a single-stranded DNA and RNA binding protein, which is involved in teh transcription of the BC1 RNA gene. Biochem Biophys Res Commun 277: 341-347. [DOI] [PubMed] [Google Scholar]
- Kondo S, Sato-Yoshitake R, Noda Y, Aizawa H, Nakata T, Matsuura Y, Hirokawa N (1994) KIF3A is a new microtubule-based anterograde motor in the nerve axon. J Cell Biol 125: 1095-1107. [DOI] [PMC free article] [PubMed] [Google Scholar]
- Kowall NW, Hantraye P, Brouillet E, Beal MF, McKee AC, Ferrante RJ (2000) MPTP induces alpha-synuclein aggregation in the substantia nigra of baboons. NeuroReport 11: 211-213. [DOI] [PubMed] [Google Scholar]
- Langston JW, Ballard P, Tetrud JW, Irwin I (1983) Chronic parkinsonism in humans due a product of meperidine analog synthesis. Science 219: 979-980. [DOI] [PubMed] [Google Scholar]
- Lee ES, Charlton CG (2001) 1-Methyl-4-phenyl-pyridinium increases S-adenosyl-l-methionine dependent phospholipid methylation. Pharmacol Biochem Behav 70: 105-114. [DOI] [PubMed] [Google Scholar]
- Leroy E, Boyer R, Auburger G, Leube B, Ulm G, Mezey E, Harta G, Brownstein MJ, Jonnalagada S, Chernova T, Dehejia A, Lavedan C, Gasser T, Steinbach PJ, Wilkinson KD, Polymeropoulos MH (1998) The ubiquitin pathway in Parkinson's disease. Nature 395: 451-452. [DOI] [PubMed] [Google Scholar]
- Li C, Wong WH (2001) Model-based analysis of oligonucleotide arrays: expression index computation and outlier detection. Proc Natl Acad Sci USA 98: 31-36. [DOI] [PMC free article] [PubMed] [Google Scholar]
- Maguire-Zeiss KA, Federoff HJ (2003) Convergent pathobiologic model of Parkinson's disease. Ann NY Acad Sci 991: 152-166. [DOI] [PubMed] [Google Scholar]
- Mandir AS, Przedborski S, Jackson-Lewis V, Wang Z-Q, Simbulan-Rosenthal CM, Smulson ME, Hoffman BE, Guastella DB, Dawson VL, Dawson TM (1999) Poly(ADP-ribose) polymerase activation mediates 1-methyl-4-phenyl-1,2,3,6-tetrahydropyridine (MPTP)-induced parkinsonism. Proc Natl Acad Sci USA 96: 5774-5779. [DOI] [PMC free article] [PubMed] [Google Scholar]
- Martin M, Iyadurai SJ, Gassman A, Gindhart Jr JG, Hays TS, Saxton WM (1999) Cytoplasmic dynein, the dynactin complex, and kinesin are interdependent and essential for fast axonal transport. Mol Biol Cell 10: 3717-3728. [DOI] [PMC free article] [PubMed] [Google Scholar]
- Mizuno Y, Saitoh T, Sone N (1987) Inhibition of mitochondrial alpha-ketoglutarate dehydrogenase by 1-methyl-4-phenylpyridinium ion. Biochem Biophys Res Commun 143: 971-976. [DOI] [PubMed] [Google Scholar]
- Mochizuki H, Nakamura N, Nishi K, Mizuno Y (1994) Apoptosis is induced by 1-methyl-4-phenylpyridinium ion (MPP+) in a ventral mesencephalic-striatal co-culture. Neurosci Lett 170: 191-194. [DOI] [PubMed] [Google Scholar]
- Mochizuki H, Hayakawa H, Migita M, Tanaka R, Suzuki A, Shimo-Nakanishi Y, Urabe T, Yamada M, Tamayose K, Shiumada T, Miura M, Mizuno Y (2001) An AAV-derived Apaf-1 dominant negative inhibitor prevents MPTP toxicity as antiapoptotic gene therapy for Parkinson's disease. Proc Natl Acad Sci USA 98: 10918-10923. [DOI] [PMC free article] [PubMed] [Google Scholar]
- Muramatsu Y, Kurosaki R, Watanabe H, Michimata M, Matsubara M, Imai Y, Araki T (2003) Expression of S-100 protein is related to neuronal damage in MPTP-treated mice. Glia 42: 307-313. [DOI] [PubMed] [Google Scholar]
- Ohashi S, Kobayashi S, Omori A, Ohara S, Omae A, Muramatsu T, Li Y, Anzai K (2000) The single-stranded DNA- and RNA-binding proteins Pur alpha and pur beta link BC1 RNA to microtubules through binding to the dendrite targeting RNA motifs. J Neurochem 75: 1781-1790. [DOI] [PubMed] [Google Scholar]
- Park SU, Ferrer JV, Javitch JA, Kuhn DM (2002) Peroxynitrite inactivates the human dopamine transporter by modification of cysteine 342: potential mechanism of neurotoxicity in dopamine neurons. J Neurosci 22: 4399-4405. [DOI] [PMC free article] [PubMed] [Google Scholar]
- Paxinou E, Chen Q, Weisse M, Giasson BI, Norris EH, Rueter SM, Trojanowski JQ, Lee VM-Y, Ishiropoulos H (2001) Induction of α-synuclein aggregation by intracellular nitrative insult. J Neurosci 21: 8053-8061. [DOI] [PMC free article] [PubMed] [Google Scholar]
- Pennathur S, Jackson-Lewis V, Przedborski S, Heinecke JW (1999) Mass spectrometic quantification of 3-nitrotyrosine, ortho-tyrosine and o,o′-dityrosine in brain tissue of 1-methyl-4-phenyl-1,2,3,6-tetrahydro-pyridine-treated mice, a model of oxidative stress in Parkinson's disease. J Biol Chem 274: 34621-34628. [DOI] [PubMed] [Google Scholar]
- Poulsen KT, Armanini MP, Klein RD, Hynes MA, Phillips HS, Rosenthal A (1994) TGF beta 2 and TGF beta 3 are potent survival factors for midbrain dopaminergic neurons. Neuron 13: 1245-1252. [DOI] [PubMed] [Google Scholar]
- Przedborski S, Vila M (2003) The 1-methyl-4-phenyl-1,2,3,6-tetrahydro-pyridine mouse model: a tool to explore the pathogenesis of Parkinson's disease. Ann NY Acad Sci 991: 189-198. [PubMed] [Google Scholar]
- Przedborski S, Jackson-Lewis V, Naini AB, Jakowec M, Petzinger G, Miller R, Akram M (2001) The Parkinsonian toxin 1-methyl-4-phenyl-1,2,3,6-tetrahydopyridine (MPTP): a technical review of its utility and safety. J Neurochem 76: 1265-1274. [DOI] [PubMed] [Google Scholar]
- Ramsay RR, Dadgar J, Trevor A, Singer TP (1986) Energy-driven uptake of N-methyl-4-phenylpyridine by brain mitochondria mediates the neurotoxicity of MPTP. Life Sci 39: 2503-2508. [DOI] [PubMed] [Google Scholar]
- Ren Y, Zhao J, Feng J (2003) Parkin binds to α/β tubulin and increases their ubiquitination and degradation. J Neurosci 23: 3316-3324. [DOI] [PMC free article] [PubMed] [Google Scholar]
- Ryu JK, Shin WH, Kim J, Joe EH, Lee YB, Cho KG, Oh YJ, Kim SU, Jin BK (2002) Trisialoganglioside GT1b induces in vivo degeneration of nigral dopaminergic neurons: role of microglia. Glia 38: 15-23. [DOI] [PubMed] [Google Scholar]
- Shirvan A, Ziv I, Barzilai A, Djaldeti R, Zilkh-Falb R, Michlin T, Melamed E (1997) Induction of mitosis-related genes during dopamine-triggered apoptosis in sympathetic neurons. J Neural Transm 50: 67-78. [DOI] [PubMed] [Google Scholar]
- Souza JM, Giasson BI, Chen Q, Lee VMY, Ishiropoulos H (2000) Dityrosine crosslinking promotes formation of stable alpha-synuclein polymers. J Biol Chem 275: 18344-18349. [DOI] [PubMed] [Google Scholar]
- Stacey DW, Hitomi M, Kanovsky M, Gan L, Johnson EM (1999) Cell cycle arrest and morphological alterations following microinjection of NIH3T3 cells with Pur alpha. Oncogene 18: 4254-4261. [DOI] [PubMed] [Google Scholar]
- Su QN, Namikawa K, Toki H, Kiyama H (1997) Differential display reveals transcriptional up-regulation of the motor molecules for both anterograde and retrograde axonal transport during nerve regeneration. Eur J Neurosci 9: 1542-1547. [DOI] [PubMed] [Google Scholar]
- Suzuki H, Kumagai T, Goto A, Sugiura T (1998) Increase in intracellular hydrogen peroxide and upregulation of a nuclear respiratory gene evoked by impairment of mitochondrial electron transfer in human cells. Biochem Biophys Res Commun 249: 542-545. [DOI] [PubMed] [Google Scholar]
- Takai Y, Irie K, Shimizu K, Sakisaka T, Ikeda W (2003) Nectins and nectin-like molecules: roles in cell adhesion, migration, and polarization. Cancer Sci 94: 655-667. [DOI] [PMC free article] [PubMed] [Google Scholar]
- Takemura R, Nakata T, Okada Y, Yamazaki H, Zhang Z, Hirokawa N (1996) mRNA expression of KIF1A, KIF1B, KIF2, KIF3A, KIF3B, KIF4, KIF5, and cytoplasmic dynein during axonal regeneration. J Neurosci 16: 31-35. [DOI] [PMC free article] [PubMed] [Google Scholar]
- Thatikunta P, Sawaya BE, Denisova L, Cole C, Yusibova G, Johnson EM, Khalili K, Amini S (1997) Identification of a cellular protein that binds to Tat-responsive element of TGF-beta promoter in glial cells. J Cell Biochem 67: 466-477. [PubMed] [Google Scholar]
- Tillerson JL, Caudle WM, Reveron ME, Miller GW (2002) Detection of behavioral impairments correlated to neurochemical deficits in mice treated with moderate doses of 1-methyl-4-phenyl-1,2,3,6-tetrahydropyridine. Exp Neurol 178: 80-90. [DOI] [PubMed] [Google Scholar]
- Tomashevski A, Hussman J, Jin LW, Nochlin D, Vincent I (2001) Constitutive Wee1 activity in adult brain neurons with M phase-type alterations in Alzheimer neurodegeneration. J Alzheimers Dis 3: 195-207. [DOI] [PubMed] [Google Scholar]
- Tusher VG, Tibshirani R, Chu G (2001) Significance analysis of microarrays applied to the ionizing radiation response. Proc Natl Acad Sci USA 98: 5116-5121. [DOI] [PMC free article] [PubMed] [Google Scholar]
- Ubl A, Berg D, Holzmann C, Kruger R, Berger K, Arzberger T, Bornemann A, Riess O (2002) 14-3-3 Protein is a component of Lewy bodies in Parkinson's disease-mutation analysis and association studies of 14-3-3 eta. Brain Res Mol Brain Res 108: 33-39. [DOI] [PubMed] [Google Scholar]
- Vincent I, Jicha G, Rosado M, Dickson DW (1997) Aberrant expression of mitotic cdc2/cyclin B1 kinase in degenerating neurons of Alzheimer's disease brain. J Neurosci 17: 3588-3598. [DOI] [PMC free article] [PubMed] [Google Scholar]
- Vincent I, Zheng JH, Dickson DW, Kress Y, Davies P (1998) Mitotic phosphoepitopes precede paired helical filaments in Alzheimer's disease. Neurobiol Aging 19: 287-296. [DOI] [PubMed] [Google Scholar]
- Viswanath V, Wu T, Boonplueang R, Chen S, Stevenson FF, Yantiri F, Yang L, Beal MF, Andersen JK (2001) Caspase-9 activation results in downstream caspase-8 activation and bid cleavage in 1-methyl-4-phenyl-1,2,3,6-tetrahydropyridine-induced Parkinson's disease. J Neurosci 21: 9519-9528. [DOI] [PMC free article] [PubMed] [Google Scholar]
- Wesemann W, Grote C, Clement HW, Block F, Sontag KH (1993) Functional studies on monoaminergic transmitter release in parkinsonism. Prog Neuropsychopharmacol Biol Psychiatry 17: 487-499. [DOI] [PubMed] [Google Scholar]
- Wu DC, Jackson-Lewis V, Vila M, Tieu K, Teismann P, Vadseth C, Choi DK, Ischiropoulos H, Przedborski S (2002) Blockade of microglial activation is neuroprotective in the 1-methyl-4-phenyl-1,2,3,6-tetrahydropyridine mouse model of Parkinson disease. J Neurosci 22: 1763-1771. [DOI] [PMC free article] [PubMed] [Google Scholar]