

Abstract
Stimulus-specific neuronal responses are a striking characteristic of several sensory systems, although the synaptic mechanisms underlying their generation are not well understood. The songbird nucleus HVC (used here as a proper name) contains projection neurons (PNs) that fire temporally sparse bursts of action potentials to playback of the bird's own song (BOS) but are essentially silent when presented with other acoustical stimuli. To understand how such remarkable stimulus specificity emerges, it is necessary to compare the auditory-evoked responsiveness of the afferents of HVC with synaptic responses in identified HVC neurons. We found that inactivating the interfacial nucleus of the nidopallium (NIf) could eliminate all auditory-evoked subthreshold activity in both HVC PN types, consistent with NIf serving as the major auditory afferent of HVC. Simultaneous multiunit extracellular recordings in NIf and intracellular recordings in HVC revealed that NIf population activity and HVC subthreshold responses were similar in their selectivity for BOS and that NIf spikes preceded depolarizations in all HVC cell types. These results indicate that information about the BOS as well as other auditory stimuli is transmitted synaptically from NIf to HVC. Unlike HVC PNs, however, HVC-projecting NIf neurons fire throughout playback of BOS as well as non-BOS stimuli. Therefore, temporally sparse BOS-evoked firing and enhanced BOS selectivity, manifested as an absence of suprathreshold responsiveness to non-BOS stimuli, emerge in HVC. The transformation to a sparse auditory representation parallels differences in NIf and HVC activity patterns seen during singing, which may point to a common mechanism for encoding sensory and motor representations of song.
Keywords: auditory, tuning, songbird, in vivo intracellular, vocal learning, communication, zebra finch, neuronal interaction, temporal sparseness
Introduction
Neurons with remarkably specific stimulus-response properties characterize higher order sensory areas of the CNS. These include face- and motion-sensitive cells in primate visual cortex (Maunsell and Newsome, 1987; Rolls, 1992; Sugase et al., 1999), whisker-selective neurons in rodent barrel cortex (Welker, 1976), pulse-echo-sensitive neurons in bat auditory cortex (Suga et al., 1978; Kawasaki et al., 1988; Fitzpatrick et al., 1993), and space-specific neurons in owl auditory midbrain (Knudsen and Konishi, 1978; Wagner et al., 1987). Perhaps the most selective auditory neurons yet described are in the songbird telencephalic nucleus HVC (used here as a proper name), a sensorimotor nucleus essential to learned vocalizations (see Fig. 1A). HVC projection neurons (PNs) fire sparse bursts of action potentials in response to auditory playback of the bird's own song (BOS) and are essentially unresponsive to other acoustic stimuli (Margoliash, 1983, 1986; Lewicki and Arthur, 1996; Mooney, 2000). This stimulus specificity distinguishes HVC PNs from neurons in primary auditory areas of the avian telencephalon (Lewicki and Arthur, 1996). Elucidation of how BOS selectivity in HVC arises can identify the origins of this stimulus specificity and inform models of auditory-guided vocal learning, because different HVC PN types innervate either song patterning or vocal plasticity pathways (Dutar et al., 1998; Kubota and Taniguchi, 1998; Mooney, 2000).
Figure 1.

Schematic of the zebra finch song system and anatomic convergence to and divergence from HVC. A, Schematic of the song system. Black lines indicate the vocal motor pathway, and gray lines indicate the anterior forebrain pathway. The area under HVC, known as “HVC shelf,” is the area to which field L projects. B, Schematic of HVC afferents (mMAN, Uva, and NIf) and efferents (RA and area X) and recording paradigm. For the experiments in this paper, multiunit extracellular and intracellular recordings were made from NIf, and intracellular recordings were made from individual HVC neurons, including HVCRA, HVCX, and HVCInt. DLM, Dorsolateral part of the medial thalamus; HVC, nucleus HVC of the nidopallium; HVCInt, HVC interneurons; HVCRA, HVC neurons that project to RA; HVCX, HVC neurons that project to area X; LMAN, lateral magnocellular nucleus of the anterior nidopallium; L, field L; mMAN, medial magnocellular nucleus of the anterior nidopallium; NIf, interfacial nucleus of the nidopallium; OV, ovoidalis; RA, robust nucleus of the arcopallium; Uva, nucleus uvaeformis; X, area X.
In several systems, stimulus-selective sensory responses result from the convergence of multiple afferents with different response properties (Jagadeesh et al., 1993; Ferster et al., 1996; Vidyasagar et al., 1996; Kawasaki and Guo, 1998; Pena and Konishi, 2001; Brecht and Sakmann, 2002; Perez-Orive et al., 2002; Higley and Contreras, 2003; Monier et al., 2003). A major limitation to our understanding of how BOS-evoked responses are generated is that the full complement of HVC auditory afferents remains uncharacterized (Kelley and Nottebohm, 1979; Fortune and Margoliash, 1995; Bottjer et al., 1989) (see Fig. 1B). Extracellular studies suggested that the interfacial nucleus of the nidopallium (NIf) functions as a source of auditory input to HVC but could not address whether NIf interacts cooperatively with other HVC auditory afferents to facilitate auditory-evoked action-potential activity (see Fig. 1B) (Wild, 1994; Vates et al., 1997; Janata and Margoliash, 1999; Boco and Margoliash, 2001; Cardin and Schmidt, 2004). By simultaneously inactivating NIf while recording intracellularly from HVC, we show that NIf activity is necessary for auditory-evoked synaptic activity in HVC.
A further challenge to understanding how auditory representations of the BOS are generated and transformed in the songbird's brain is that HVC contains several distinct cell types (see Fig. 1B), including interneurons and the two different PNs. To better understand how BOS representations may be transformed between NIf and HVC, we compared BOS-evoked multiunit NIf activity with simultaneous subthreshold activity in individual HVC PNs and interneurons. We found that suprathreshold BOS selectivity in NIf closely paralleled subthreshold selectivity in individual HVC neurons, indicating that information about the BOS and other stimuli is transmitted synaptically from NIf to HVC; however, individual HVC-projecting NIf neurons (NIfHVC) fired throughout BOS playback, unlike the phasic BOS-evoked firing of HVC PNs. NIf neurons also fired to other stimuli that evoked only subthreshold responses in HVC. These differences in NIf and HVC firing patterns suggest that temporally sparse BOS-evoked firing and an enhanced selectivity for the BOS arise in HVC. Because HVC PNs generate sparse activity during singing, these results may point to a common mechanism for encoding sensory and motor representations of song.
Parts of this paper have been published previously in abstract form (Coleman and Mooney, 2002).
Materials and Methods
General methods for these procedures have been described previously (Mooney, 2000; Rosen and Mooney, 2000).
Subjects. Experiments were performed using 88 adult (135-650 d after hatch) male zebra finches (Taeniopygia guttata) in accordance with a protocol approved by the Duke University Institutional Animal Care and Use Committee. All birds used in this study were bred and reared in our colony.
Stimuli. Before each experiment, songs were recorded from a male zebra finch placed in a sound-isolation chamber with a female zebra finch (Industrial Acoustics Company, Bronx, NY). Songs were amplified and low-pass filtered at 10 kHz, digitized at 20 or 22.05 kHz, and stored on a hard drive. Songs were recorded and edited using custom software (LabView, National Instruments, Austin, TX; written by M. Rosen, F. Livingston, and Ramani Balu). Edited songs included two or three motifs, the largest repeated unit in the bird's song, and were typically 2-4 sec in duration. Stimuli that were presented included the following: (1) the BOS; (2) BOS played in reverse (REV), in which the temporal structure of individual syllables and the global syllable order are reversed; (3) BOS with the syllable order reversed (BOS-RO), in which the temporal order of individual syllables is preserved, but the syllable sequence is reversed; (4) song from a conspecific (i.e., zebra) finch (CON); and (5) white noise bursts, consisting of four to five bursts of white noise (each 50-100 msec in duration). Stimuli were presented at ∼70 dB sound pressure level (SPL), measured with a sound level meter (rms, A-weighted), with an interstimulus interval of 5 ± 1 sec.
Surgery. Animals were anesthetized with 20% urethane (60-100 μl total; Sigma, St. Louis, MO) administered into the pectoral muscle in 20-30 μl aliquots at 30 min intervals. In a few cases when needed, birds were administered halothane (Abbott Labs, Chicago, IL) via inhalation immediately before surgery. Lidocaine ointment (2.5%; Astra, Westborough, MA) was applied to the scalp, after which the scalp was dissected along the midline. The approximate x-y location of NIf was marked on the skull using stereotaxic coordinates (provided by Dr. J. M. Wild, University of Auckland, Auckland, New Zealand). Briefly, the marking pipette was set at interaural zero and then moved 0.3 mm caudal to the bifurcation of the midsagittal sinus by rotating the head angle of the bird in the stereotaxic apparatus. The skull overlying NIf was then marked at a position 1 mm rostral and 1.7 mm lateral from the bifurcation. In addition, the skull overlying HVC was marked at 0 mm rostral and 2.4 mm lateral to the bifurcation. A stainless steel post was then attached to the rostral part of the bird's skull with dental cement and cyanoacrylate. Once the cement hardened, the bird was removed from the stereotaxic device and placed in a sound-attenuating chamber (Industrial Acoustics Company) on an air table (TMC, Peabody, MA). The bird's head was immobilized via the mounted post, and its body temperature was maintained via an electric blanket set at 37°C (Harvard Apparatus, Holliston, MA). All recordings were made at a 50-55° head angle in the recording chamber. Small craniotomies were made over HVC and NIf, and the dura was slit open with an insect pin. Recording electrodes were lowered into NIf and HVC using a one-dimensional hydraulic micromanipulator (Soma Scientific, Irvine, CA). NIf typically was encountered at a depth of 1.8-2.2 mm and HVC at a depth of ∼0.3-0.8 mm from the surface of the brain. The NIf electrode was always lowered into the brain at a vertical orientation; to perform simultaneous recordings from the ipsilateral NIf and HVC, the HVC electrode was lowered into the brain at 15° below vertical.
Electrophysiology and song presentation. For extracellular recordings, multiunit activity in NIf was recorded using either glass micropipettes or carbon fiber electrodes (0.4-0.8 MΩ; Kation Scientific, Minneapolis, MN). Glass electrodes were pulled on a vertical puller to have a long taper, and the tip was broken to a diameter of 10-30 μm. The electrodes were tip-filled with 0.5% tetramethylrhodamine dextran (3000 MW; Molecular Probes, Eugene, OR) in 1 m NaCl to facilitate post hoc visualization of the electrode tip. The remainder of the electrode was filled with 1 m NaCl. Extracellular signals were amplified via an A-M Systems model 1700 differential amplifier (Everett, WA) and bandpass filtered between 300 Hz and 5 kHz. Intracellular recordings were made with sharp electrodes (100-180 MΩ; borosilicate glass, BF100-50-10; Sutter Instruments, Novato, CA) filled with 2 m KAc. All intracellular electrodes were first tip-filled with 5% neurobiotin in 2 m KAc. Recordings were amplified via an AxoClamp 2B amplifier (Axon Instruments, Foster City, CA) and low-pass filtered at 3 kHz. All recordings were digitized at 10 or 11.025 kHz and stored on a PC. All intracellular recordings were obtained in bridge mode, in which the bridge was balanced by offsetting the electrode series resistance to 200 pA, 50 msec current injections before the cell was impaled. The bridge was checked periodically and rebalanced as needed during the recording session.
NIf was identified based on its electrophysiological properties and its response to playback of BOS and REV (see Fig. 2). As noted previously (Janata and Margoliash, 1999) and described here, NIf produces spontaneous bursts of activity and responds more to presentation of BOS than to REV, two features that distinguish it from the surrounding tissue. Initially, placement of the recording electrode in NIf was confirmed anatomically, by iontophoretic (+5 μA alternating on/off current, for 20 min) dye injections or by electrolytic lesions (-10 μA for 15 sec) at the recording site. Once NIf was located, intracellular recordings were obtained from individual HVC neurons that were identified based on their firing properties and response to current injection (Dutar et al., 1998; Kubota and Taniguchi, 1998; Mooney, 2000). Intracellular recordings from NIf neurons were made after first locating NIf with a carbon fiber electrode. In several (n = 5 of 14) of the NIf intracellular recordings, the location and identity of the neuron were confirmed by intracellular staining with neurobiotin and subsequent visualization of a cell body within the boundaries of NIf and axon terminals extending into HVC (i.e., NIfHVC neurons). We believe that the entire population of NIf neurons that we sampled here were most likely NIfHVC neurons because their spontaneous, DC-, and song-evoked firing patterns were similar to the identified NIfHVC neurons and because intracellular recordings made in vitro are heavily biased to projection neurons (our personal observations). In addition, the response strength (RS) of identified NIfHVC neurons and the RS of the unidentified NIf neurons were not statistically different (see Results and Fig. 12 A).
Figure 2.

NIf auditory responses. A, Bottom row, Oscillograms of song stimuli, including BOS, BOS in reverse (REV), BOS in which the syllable order is reversed (BOS-RO), and conspecific song (CON). Middle row, Multiunit extracellular recording from NIf showing responses to a single playback of each auditory stimulus. Dotted line indicates approximate location of threshold set for unit detection. Top row, PSTH of NIf multiunit activity in response to 20 iterations of each auditory stimulus. B, Average response strength (mean ± SEM) of NIf multiunit activity to each auditory stimulus. The response strength to BOS was significantly greater than to all other stimuli presented, and the response strength to BOS-RO was significantly greater than that to REV and CON. *p < 0.05.C, Comparison of the selectivity for BOS over REV of action potential activity in NIf-surround and NIf, and subthreshold activity in HVCRA neurons, using the d′ metric. d′ values for NIf and NIf-surround were calculated from the units per second at each recording site; d′ values for HVCRA were calculated from subthreshold responses. Black filled squares are d′ values from single recording sites in field L and NIf or single HVCRA neurons. Gray open squares are mean values (± SEM) for each group. D, Anatomic localization of a subset of NIf recording sites with their selectivity (d′) for BOS over REV. NIf has been collapsed in the lateral to medial extent. Inset, Outline of a sagittal section of a zebra finch brain to show the location of NIf relative to other structures. Scale bar, 1 mm. LaM, Mesopallial lamina; PSL, pallial-subpallial lamina.
Figure 12.

Comparison of auditory-evoked action potential activity of single NIf neurons with individual HVC neurons. A, Response strength of action potential activity in individual NIf neurons. All recorded NIf neurons (black bars) were subdivided into two groups: one in which NIfHVC neurons were positively identified anatomically (n = 5; gray bars) and the second in which the NIf neurons were unidentified (n = 7; white bars). For a given stimulus, the response strengths of these three groups were statistically similar (ANOVA). B, Comparison of d′ values for action potential activity in NIf (single unit), HVCRA, HVCX, HVCInt neurons. BOS was compared with REV, CON, and BOS-RO; only HVCInt was significantly different for REV and CON (*p < 0.05). C, Comparison of response strength for action potential activity in NIf and the three HVC neuron types. *p < 0.05. D, Comparison of the relative degree of temporally sparse firing in response to BOS playback in NIf neurons and all three HVC neuron types. HVC PNs (HVCRA and HVCX) have a larger sparseness index (i.e., fire more sparsely) to BOS than do HVCInt or NIf neurons. Black squares indicate temporal sparseness index for individual neurons; open squares indicate mean (±SEM). The temporal sparseness index for NIf neurons was subdivided into those that were either unidentified (black squares) or anatomically identified as NIfHVC neurons (gray circles). Because two of the NIf neurons had the same temporals parseness index (0.15), one is shown as a star behind the circle representing the other.
NIf inactivation. To inactivate NIf, GABA (250 mm in 1 m NaCl; Research Biochemicals, Natick, MA) was pressure ejected with a Picospritzer (15-40 msec pulses at 10-20 psi; General Valve, Fairfield, NJ) into NIf through the NIf recording electrode. The location and extent of GABA application was inferred post hoc from the distribution of rhodamine dextran (3000 MW) that was added to the GABA solution for a 0.5% final concentration (see Fig. 3C). One experiment was excluded in which subsequent histological analysis revealed that there was no rhodamine in the recording area, suggesting that no GABA was ejected from the pipette. The effect of GABA on NIf activity was monitored through the same electrode that contained the GABA solution.
Figure 3.

NIf inactivation abolishes BOS-evoked action potential responses in HVC. A, Raw data showing the abolition of BOS-evoked activity in HVC after GABA application to NIf. Bottom trace, Oscillogram of song stimuli. Middle trace, Multiunit extracellular recording of NIf. Top trace, Multiunit extracellular recording of the ipsilateral HVC. Left, Before GABA application, BOS presentation increased activity in both NIf and HVC. Right, GABA application to NIf immediately before BOS stimulation completely abolished the BOS response in HVC (note puff artifact denoting time of GABA application). Calibration: 2 sec. B, Changes in HVC response strength before, during, and after GABA application in NIf for the experiment shown in A. Each bar represents the normalized response strength (units per second) to each sequential BOS stimulation. Normalized responses were calculated as the response strength to each BOS presentation, divided by the average pre-GABA response strength. GABA was applied to NIf after the 21st BOS presentation for five iterations (arrowheads). After GABA application, the HVC response strength to BOS recovered to baseline levels. C, Rhodamine labeling relative to NIf location in serial sagittal sections from the experiment in A and B. Top panel, Photomicrographs of rhodamine localization relative to NIf. The boundary of NIf was determined from dark-field illumination of the same section (data not shown) and is outlined by the white dotted line. Arrowhead in the left image points to the electrode track. Arrows point to the drawing of the outline of NIf and rhodamine labeling that was used to generate the serial sections. Bottom panel, Serial sagittal sections in which NIf is outlined in black, and the location of recovered rhodamine labeling is in gray. Dorsal (D) is up; rostral (R) is right. Scale bar: C, D, 200 μm. D, Summary maps of rhodamine localization relative to NIf for each GABA inactivation experiments. In each case, a standard outline of NIf (as in Fig. 2 D) is used for each experiment, and the location of rhodamine labeling within NIf is illustrated in gray. The top left example is the same example illustrated in C. Percentages refer to the reduction in HVC BOS-evoked response strength during GABA application.
In some NIf inactivation experiments, HVC action-potential activity was monitored with an extracellular carbon fiber electrode. In these experiments, at least 20 iterations of BOS were presented before GABA was ejected from the recording electrode. After a baseline response was established, GABA was puffed into the preparation between each stimulus presentation for three to five iterations of the presented auditory stimuli (i.e., once every 5-10 sec). Auditory presentations continued without GABA application until evoked HVC activity recovered to pre-GABA levels. The response strength (see below) was calculated for each BOS presentation before, during, and after GABA application. Control injections consisted of 0.5% rhodamine dextran in 1 m NaCl.
In other NIf inactivation experiments, GABA application to NIf was paired with intracellular recordings from HVC neurons. In these experiments, at least 10 iterations of each auditory stimulus were presented before GABA was applied to NIf. GABA was then applied to NIf between each auditory presentation for three to five iterations of the entire set of auditory stimuli. The effect of NIf inactivation on HVC responses was calculated off-line in MatLab (The MathWorks, Natick, MA) in which the integral of the subthreshold response to each BOS playback was calculated, relative to the baseline resting membrane potential. In all of these calculations, action potentials were removed from the subthreshold response by clipping the spikes near their threshold (the point at which the membrane potential became regenerative). To normalize the responses, the HVC neuron response for each BOS presentation during and after GABA application in NIf was divided by the mean pre-GABA responses (10-11 iterations) to obtain the percentage change in HVC neuron response. The maximum percentage change of each neuron to BOS presentation after GABA application was used to calculate the mean maximum change for all experiments.
Data analysis. Many aspects of the analysis of intracellular data use methods described previously (Mooney, 2000; Rosen and Mooney, 2003). NIf activity was quantified off-line in LabView. The threshold for detecting units within NIf multiunit activity was set visually by the user at an amplitude above background that excluded the smaller amplitude events (see Fig. 2). Our aim for setting a high threshold was to include events from larger neurons and cell bodies and to exclude the activity of fibers of passage. Although we did not analyze the number of neurons that contributed to the multiunit activity, we estimate that these multiunit recordings sample the activity of 5-10 individual NIf neurons.
The NIf multiunit activity and the action potential response of HVC neurons were calculated using the RS, which is the difference in mean firing rate during the stimulus and the mean firing rate during a prestimulus baseline period of similar duration. A similar approach was used to measure subthreshold responses from intracellular recordings in HVC, where the positive area measured between the median-filtered average membrane potential during the prestimulus period and the baseline mode was subtracted from the positive area measured between the stimulus-related waveform and the baseline mode. Similar measurements were made to estimate the magnitude of song-evoked hyperpolarizations in HVCX neurons (Mooney, 2000, his Fig. 9). The responses for either firing rate or subthreshold activity were expressed as z-scores. The z-score takes the difference between the response during the stimulus and the baseline response and divides that by the SD of that difference and is calculated by the following:
 |
Figure 9.
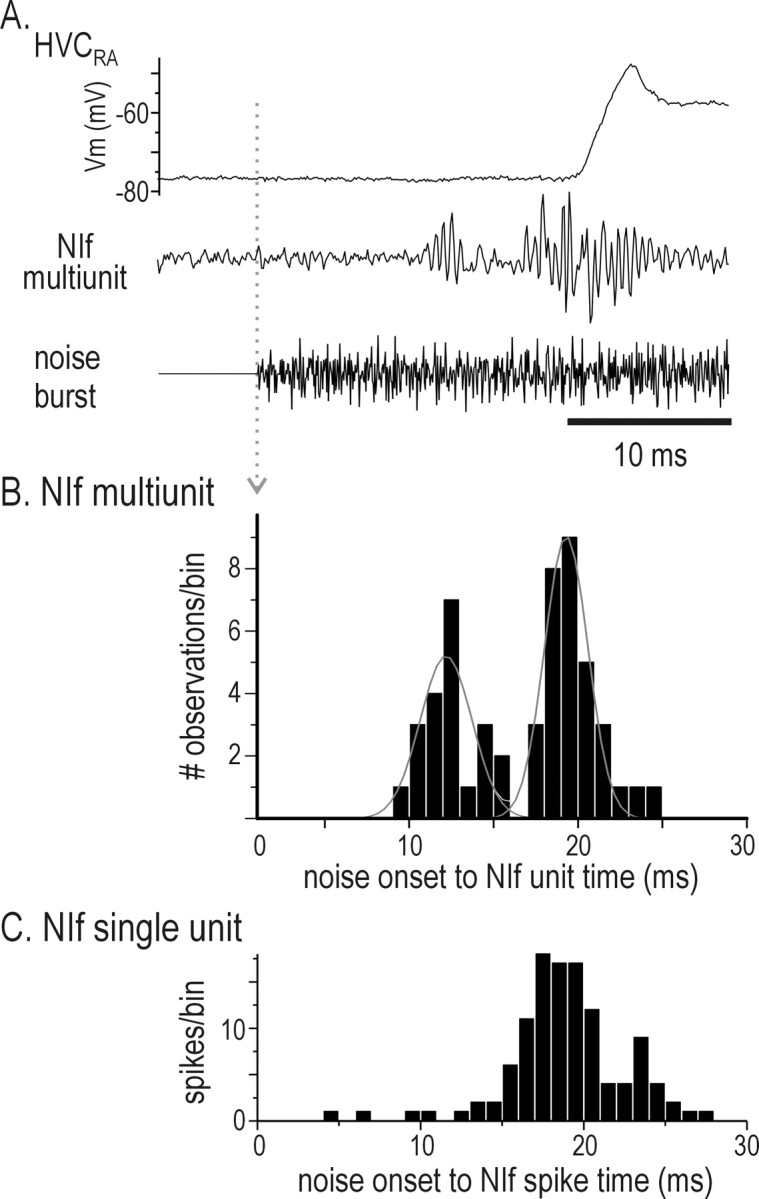
Timing of NIf multiunit and single-unit activity and subthreshold response in an HVCRA neuron to a white noise burst. A, Response of NIf (middle trace) and HVCRA (top trace) to a single presentation of a white noise burst (bottom trace). Note the two different bursts of action potential activity generated in NIf. B, Timing of NIf activity relative to the onset of the white noise burst. The frequency histogram shows the onset times for all NIf units that we recorded (see Materials and Methods for determination of onset times). The binned onset times for all NIf recordings were fit with two Gaussians (gray lines). Bin size = 1 msec. The histogram in B has the same time scale and is aligned with the noise burst onset in A (gray dotted line with arrow). C, Histogram of action potential activity from an intracellularly recorded NIf neuron that projects to HVC (NIfHVC), relative to noise burst onset (time 0). The response is the result of 100 noise burst presentations. This neuron did not have any current injected through the recording electrode. Bin size = 1 msec. The histogram is aligned with the noise burst onset in A and B.
where S̄ is the mean response during the stimulus, B̄ is the mean response during a baseline period, and the denominator is the SD of (S-B). For subthreshold responses, positive area z-scores refer to depolarizing responses, and negative area z-scores refer to hyperpolarizing responses.
One method to quantify neuronal selectivity for one stimulus versus another is the d′ value, which provides a statistical measure for the discriminability between two stimuli (Green and Swets, 1966). The d′ value is computed by the following equation:
 |
where R is the response strength to the stimulus (STIM), R̄ is the mean value of R, and σ2 is its variance. For our analyses, the selectivity for BOS (STIM1) was compared with each of three stimuli: REV, BOS-RO, and CON (STIM2). A d′ > 0.5 was used as the criterion for deeming a response selective (Solis and Doupe, 1997).
One limitation of using d′ values to assess relative responsiveness is that they are sensitive to response variability as well as response strength. Therefore, to compare the response of a neuron to two different stimuli without incorporating measures of variability, we also used the selectivity index (Solis and Doupe, 1997) as follows:
 |
Neurons preferring stimulus 1 (STIM1, i.e., BOS) over STIM2 (i.e., REV, CON, or BOS-RO) will have a similarity index near 1, those preferring STIM2 over STIM1 will have an index near 0, and those with no preference for either stimulus will have a value of 0.5.
Spike-triggered averages. Spike-triggered averages (STAs) were calculated to measure the relative timing of auditory-evoked changes in NIf multiunit activity and changes in HVC neuron membrane potential. STAs were calculated off-line in LabView from paired NIf and HVC neuron recordings during both song-evoked auditory responses and white noise bursts. Briefly, STAs were calculated by averaging the median-filtered HVC neuron membrane potential relative to NIf multiunit activity (NIf units) exceeding a user set trigger threshold (i.e., trigger events). STAs were calculated for a time window ±200 msec relative to the trigger event. STAs during song presentation were calculated from NIf activity elicited during playback of the entire stimulus. To correct for stimulus coordination artifacts, we shuffled NIf and HVC records from different trials and generated a shuffled STA that was then subtracted from the raw STA to generate a corrected STA that captured the trial-to-trial correlation at the two sites (Perkel et al., 1967; Ts'o et al., 1986).
A more accurate assessment of timing of auditory-evoked activity in NIf and HVC requires measuring stimulus-evoked response onset latencies. Such measurements are made more complicated by using song, a complex acoustical stimulus, during which the spike discharge is not reliably predicted by the stimulus onset. Therefore, we used white noise bursts to measure absolute evoked onset latencies in NIf and HVC and noise-evoked STAs to more accurately measure the relative timing of auditory-evoked activity in these two nuclei. The noise-evoked STAs of HVC neuron membrane potential were calculated from NIf multiunit activity that occurred within a narrow (∼3-5 msec) time window 18-25 msec after the onset of white noise bursts. To determine the exact placement of the window, we first estimated the onset time for a given NIf multiunit recording by binning (bin size = 1 msec) all events that exceeded the user set trigger threshold. The largest bin (i.e., the most frequently occurring onset time) was then used to center the trigger window for calculating STAs. The onsets of STA peaks were estimated with a cumulative sum analysis. For this analysis we calculated the cumulative sum of the mean STA from 20 msec before and 30 msec after the NIf trigger event and designated the peak onset to be 5% of the maximum response. The cumulative sum did not reach a plateau, because the membrane potential did not return to baseline levels within the STA window. Therefore, we designated the maximum cumulative sum value to be the value at 30 msec after the NIf trigger event, which included the peak and the initial decay of the post-spike STA.
Temporal sparseness index. To compare the relative temporal sparseness of action potential activity of NIf and HVC neurons, we calculated a “temporal sparseness index.” To calculate a sparseness index for each neuron, we first constructed peristimulus time histograms (PSTHs) (25 msec bins) and then determined the fraction of bins occupied with spikes during song presentation that exceeded the mean prestimulus activity level (average number of spikes per bin). This fraction was then subtracted from 1 to yield the index. Thus, a neuron that fired action potentials throughout song would have a sparseness index of 0, whereas a neuron that fired only very sparsely would have a sparseness index approaching 1. In addition to calculating a temporal sparseness index for HVC neurons recorded during simultaneous NIf and HVC experiments, we also used data from previous intracellular recordings of identified HVC neurons from 20 animals, 19 of which were adults and 1 of which was a 72-d-old juvenile. Some of these data have been used in a previous publication (Mooney, 2000).
Histology. After each recording session, birds were deeply anesthetized with equithesin and transcardially perfused with 0.9% saline, followed by 4% paraformaldehyde (PFA) in 25 mm NaPO4 buffer. Brains were removed from the skull and postfixed in 4% PFA with 30% sucrose overnight at 4°C, blocked sagittally, and sectioned on a freezing microtome at 50 μm. Neurobiotin-filled neurons were further processed by incubating the sections in avidin-Alexafluor 488 (Molecular Probes) and visualized using epifluorescence illumination. Extracellularly applied rhodamine dextran was also visualized using epifluorescence. To determine the position of the NIf recording site, drawings were made of the lesions from cresyl violet-stained sections or rhodamine labeling. Once these drawings were made, a composite schematic of all NIf recording sites was drawn, as shown in Figure 2 D. To determine the location of rhodamine labeling relative to NIf location after GABA application, photomicrographs or digital images of the rhodamine labeling were superimposed on images of the same section viewed under combined dark-field and fluorescent illumination. In some cases, images of rhodamine labeling were superimposed on images of the same section after it had been stained further with cresyl violet to delineate the boundaries of NIf.
Results
A necessary step in understanding how selective auditory representations of the BOS are generated in HVC involves a comparison of activity in its auditory afferent(s) with subthreshold activity in single HVC neurons. To date, the degree to which a single auditory afferent can account for auditory-evoked subthreshold activity in HVC neurons remains unclear because direct comparisons of the activity in a candidate auditory afferent and subthreshold activity in the various HVC neuron types have not been made. We therefore (1) characterized auditory-evoked suprathreshold activity in NIf and compared across birds the BOS selectivity of NIf responses with subthreshold activity in identified HVC neurons, (2) tested the necessity of NIf activity for auditory-evoked suprathreshold and subthreshold activity in identified HVC neurons, (3) directly compared NIf multiunit activity with subthreshold activity in identified HVC neurons within birds, and (4) measured the BOS-evoked activity of identified NIf neurons that project to HVC.
NIf auditory response properties
Of the direct anatomic inputs to HVC, NIf is the most likely source of auditory input to HVC (Janata and Margoliash, 1999; Cardin and Schmidt, 2004) (Fig. 1B). To examine the degree to which the auditory responses of NIf can account for the subthreshold responses in HVC neurons, we first recorded NIf activity with a multiunit extracellular electrode and presented BOS, temporal variants of BOS (REV and BOS-RO), and conspecific song (CON). A representative recording (Fig. 2A) displays three general features of the NIf response: (1) excitatory responses to a wide range of auditory stimuli, including the songs of other zebra finches, (2) a stronger response to BOS than all other song types presented, and (3) a BOS-evoked response that was sustained over much of the stimulus duration. These responses are qualitatively similar to auditory-evoked subthreshold activity in HVC neurons, especially those that project to the song premotor nucleus RA (HVCRA) (Mooney, 2000).
The general features of NIf multiunit activity for this exemplar were representative of the NIf multiunit activity across birds. Playback of BOS and BOS-RO always elicited a significant excitation of NIf (80 of 80 NIf recordings for BOS and 74 of 74 NIf recordings for BOS-RO; p < 0.05) (see Fig. 7B). In addition, playback of CON elicited a significant excitatory response in 78% (57 of 73) of the NIf recordings, and REV elicited a significant response in 66% (53 of 80) of the NIf recordings. The mean BOS-evoked response was significantly greater than that evoked by any other song type (p < 0.05; ANOVA; n = 80 recordings in 41 animals) (Fig. 2B). The mean response strength to both BOS and BOS-RO (23.9 ± 1.8 and 18.7 ± 1.7 units/sec, respectively) was greater than that to either reverse REV or CON (5.6 ± 0.7 and 8.1 ± 0.96 units/sec, respectively; p < 0.05; Tukey HSD), which did not differ significantly from each other (p > 0.05; Tukey HSD) (Fig. 2B). Although, like HVC, NIf responds more to BOS than to the other auditory stimuli, the high proportion of sites excited by CON and REV distinguishes NIf from HVC and other song-related brain nuclei (Margoliash, 1986; Doupe and Konishi, 1991; Margoliash et al., 1994; Lewicki and Arthur, 1996).
Figure 7.

NIf multiunit activity and HVC subthreshold activity are comparable in both their response to auditory stimuli and their selectivity for BOS versus non-BOS stimuli. A, Comparison of auditory-evoked z-score values in simultaneously recorded NIf and HVC neurons. z-score values were calculated for four different auditory stimulations: BOS (dark gray squares), REV (light gray circles), BOS-RO (gray triangles), and CON (stars). Top row, z-score values for NIf activity and subthreshold responses in HVCRA and HVCInt were distributed evenly about the unity line for all auditory stimuli presented. Bottom row, z-score comparisons were made for HVCX neurons when HVCX neurons were either near resting membrane potential (no current; left) or when HCVX neurons were hyperpolarized (right). The z-score values for HVCX neurons near resting membrane potential are calculated using the negative area response to auditory presentation, whereas the z-score values for HVCX neurons that were hyperpolarized were calculated using the positive area response to auditory presentations. z-score values for NIf activity and subthreshold activity in HVCX neurons that were hyperpolarized were distributed evenly about the unity line, whereas z-score values calculated with no current were smaller, on average, than NIf multiunit activity z-scores. Significance levels are shown in Table 1. B, NIf activity and HVC subthreshold responses have a similar selectivity for BOS over non-BOS stimuli. The d′ values (BOS vs REV, BOS vs CON, BOS vs BOS-RO) for NIf firing rate are plotted against the d′ values for the subthreshold activity in simultaneously recorded HVC neurons. The d′ values for HVCX neurons are plotted for HVCX neurons close to their resting membrane potential and for HVCX neurons that were hyperpolarized. Black diagonal line is the unity line.
Population comparisons of NIf activity and subthreshold activity in HVC
The response strength measurements indicate that NIf neurons at the population level are selective for BOS over the other stimuli tested (i.e., NIf is BOS selective). We were curious to know the extent to which the suprathreshold BOS selectivity seen in NIf paralleled the selectivity of subthreshold responses seen in HVC. We first focused on HVCRA neurons because their subthreshold responses to acoustical stimulation are depolarizing from the resting membrane potential and therefore more straightforward to analyze than those in other HVC cell types (Mooney, 2000). The d′ value provides one method by which the selectivity for BOS over other stimuli can be quantified (Solis and Doupe, 1997) (see Materials and Methods). Here, we calculated the d′ value for BOS over REV for NIf multiunit activity and compared those values with the subthreshold responses of HVCRA neurons measured with intracellular recordings [these HVCRA d′ values are comparable with those reported in Mooney (2000)]. Both NIf multiunit activity and subthreshold responses in HVCRA neurons were very selective for BOS over REV, as indicated by d′ ≫ 0.5 (Fig. 2C) (NIf d′NIf = 2.56 ± 0.14, n = 80; subthreshold d′HVC-RA = 3.65 ± 0.43, n = 20). In addition, the d′ value for the HVC subthreshold response was significantly larger than the NIf d′ value for NIf multiunit activity (p < 0.05; ANOVA; Tukey HSD). We also compared subthreshold d′ values of HVCRA neurons with d′ values of multiunit activity in brain regions surrounding NIf. The regions surrounding NIf, on average, were significantly less selective for BOS over REV than regions in NIf or HVC (Fig. 2C) (NIf surround d′ = 0.27 ± 0.27; n = 22; p < 0.05; ANOVA; Tukey HSD). These indirect, across-bird comparisons suggest that the suprathreshold selectivity in NIf, rather than regions immediately surrounding NIf, more closely matches the subthreshold selectivity in HVC.
In initial experiments, we confirmed the anatomic location of our NIf recording sites by marking them with either electrolytic lesions or iontophoretic injections of rhodamine dextran (n = 32). At each recording site, we assessed the auditory selectivity for BOS over REV using the d′ metric and then superimposed the d′ score for a given site on a composite anatomical diagram of the regions from which we recorded (Fig. 2D). A notable feature of sites within the anatomically defined borders of NIf compared with adjacent brain regions was the selectivity for BOS over REV, reflected in the observation that nearly all recordings sites (29 of 32) within NIf had a d′ >1. These results suggest a sharp increase in auditory selectivity in NIf from surrounding auditory regions, including field L.
NIf is necessary for HVC auditory activity
To test directly whether NIf activity was necessary for auditory-evoked action-potential activity in HVC, we reversibly inactivated NIf with GABA application while monitoring HVC activity with an extracellular recording electrode (n = 7 NIf inactivations in five animals). As demonstrated recently (Cardin and Schmidt, 2004), we found that NIf inactivation was accompanied by a marked reduction or abolition of all auditory-evoked action-potential activity in HVC (Fig. 3A,B). Overall, the BOS-evoked HVC response strength decreased 93-99% (mean ± SD, 95.9 ± 2.5%) immediately (<2 sec) after GABA application to NIf. The effects of NIf inactivation on HVC were reversible, and the auditory-evoked spiking in HVC reappeared within 5-60 sec after GABA application to NIf was discontinued. In addition to abolishing auditory-evoked activity in HVC, GABA application to NIf also abolished the spontaneous bursts seen in HVC during control recordings (data not shown). In contrast, control injections of vehicle only (saline and rhodamine dextran) into NIf did not significantly alter BOS-evoked response strength in HVC (n = 3 sites in two birds; p = 0.09; paired t test). These data indicate that NIf provides excitatory input to HVC and that NIf activity is necessary for auditory-evoked spiking in HVC.
To assess the approximate anatomical location of focus of GABA application, we mixed rhodamine dextran with the GABA solution. Rhodamine labeling was distributed within NIf and extended to its dorsal border (Fig. 3C,D, left topmost trace for experiment in Fig. 3A; Fig. 3D for all inactivation experiments). Although labeling sometimes extended beyond the dorsal border of NIf, because of the orientation of our recording-inactivation electrode, we never detected auditory-evoked activity in this region. These results suggest that the abolition of HVC auditory activity is caused by GABA application in NIf and not by spread to surrounding regions outside of NIf.
NIf is the main source of auditory input to both HVC projection neuron types
Although GABA inactivation of NIf reduces both spontaneous and auditory-evoked action potential generation in HVC, NIf may act permissively with other HVC auditory afferents to enable auditory-evoked spiking in HVC and generate song-selective responses. In addition, the extracellular HVC recordings that we made here did not allow us to distinguish between the different HVC neuron cell types, which could receive auditory input from different sources. Specifically, previous studies show that HVC PNs that innervate a subregion of the basal ganglia homolog, area X (HVCX neurons), part of a pathway essential to vocal plasticity, show a mixture of hyperpolarizing and depolarizing responses to BOS playback, unlike the purely depolarizing responses evoked in HVCRA neurons (Mooney, 2000; Mooney et al., 2001). Thus, it was necessary to determine the effect of NIf inactivation on song-evoked subthreshold activity in identified HVC neuron subtypes. To examine the contribution of NIf activity to auditory-evoked activity in both HVC PN types, we measured synaptic activity in identified HVC neurons with intracellular electrodes and applied GABA to NIf (n = 5 HVCRA neurons in four animals; n = 4 HVCX neurons in four animals) (Fig. 4). In the most dramatic case, GABA application completely and reversibly abolished spontaneous and BOS-evoked depolarizations in an HVCRA neuron (Fig. 4A). In the four other HVCRA neurons, BOS-evoked synaptic activity also was greatly reduced, although not completely abolished (Fig. 4B) (mean maximum decrease for all experiments = 70.7 ± 10.2%; n = 5). NIf inactivation also abolished or greatly reduced synaptic activity in HVCX neurons (Fig. 4C,D). In three of these cells, hyperpolarizing current was injected into the cell to render the BOS-evoked response entirely depolarizing, simplifying comparisons of activity between the two areas. In one of these cells, GABA application in NIf resulted in an almost complete abolition of spontaneous and BOS-evoked activity in HVCX (Fig. 4C); the response of this neuron recovered to 80.5% of the pre-GABA level after GABA application was discontinued. In the other two cells, BOS-evoked synaptic activity in HVCX was reduced but not abolished during GABA application to NIf (Fig. 4D). In these three cases, there was a 64.7 ± 12.2% mean maximum decrease in synaptic response during NIf inactivation. In the fourth HVCX neuron, the membrane potential was maintained at rest (approximately -70 mV) and displayed a net hyperpolarizing response during BOS playback. In this case, GABA application in NIf abolished the BOS-evoked hyperpolarization. In sum, these experiments show that NIf activity is necessary for most or all of the spontaneous and song-evoked synaptic activity in both HVC PN subtypes and indicates that NIf is the major source of auditory input to HVC. In addition, these data suggest that both types of HVC projection neurons receive input (either directly or indirectly) from a common source, NIf.
Figure 4.

NIf inactivation abolishes or reduces auditory-evoked subthreshold activity in both HVC projection neurons subtypes, HVCRA and HVCX. A, Before GABA application to NIf (red trace), BOS presentation elicited a depolarizing response in an HVCRA neuron. After GABA application to NIf, there was an almost total absence of the BOS-evoked subthreshold response (black trace). The BOS-evoked subthreshold response in HVCRA recovered to near pre-GABA controls after GABA application ceased (cyan trace). B, In another bird, the application of GABA to NIf resulted in a reduction (black trace) of the BOS-evoked response an HVCRA neuron, as compared with pre-GABA response (red trace). The recording was lost immediately after GABA application, so recovery was not observed. C, GABA application to NIf resulted in the near abolition of BOS-evoked activity in an HVCX neuron, which recovered after GABA application ceased. Color conventions are as in A and B. D, In another bird, GABA inactivation of NIf resulted in a reduction in the BOS-evoked synaptic response in an HVCX neuron. The recording was lost immediately after GABA application, so recovery was not observed. B, D, Recordings from opposite hemispheres of the same bird. Calibration for all traces: 500 msec.
Direct NIf and HVC comparisons from simultaneous recordings
To examine more closely the transformation of auditory activity between NIf and HVC, we compared directly the auditory activity in a small population of NIf neurons with subthreshold activity in HVC neurons by recording simultaneously from these areas. We initially focused on the relationship between NIf multiunit activity and membrane potential changes in HVCRA neurons because their purely depolarizing patterns of subthreshold activity simplify comparisons (Mooney, 2000). We first give a brief qualitative description of these results and then provide a more quantitative assessment of the auditory-related activity in NIf and HVCRA neurons.
Qualitative measures of auditory responsiveness in NIf and HVC
Qualitatively, we noted that spontaneous bursts of NIf multiunit activity were closely associated with bursts of PSPs in HVCRA neurons, although the HVCRA neuron usually showed little or no spontaneous action-potential discharge (Fig. 5A). These spontaneous PSPs were preceded by NIf activity, as predicted from our inactivation experiments (Fig. 5A, bottom right). As with spontaneous activity, NIf multiunit activity paralleled the subthreshold activity in HVCRA neurons during auditory stimulation (Fig. 5B). To examine the auditory-evoked activity in NIf and HVC, we presented BOS and temporally manipulated versions of BOS, as well as noise bursts, while recording simultaneously from NIf and HVCRA neurons (Figs. 5B, 6). The correspondence between NIf activity and subthreshold activity in HVCRA is shown during playback of a single presentation of each auditory stimulus (Fig. 5B) or multiple presentations of each stimulus (Fig. 6A). These representative traces show a correspondence between auditory-evoked activity in NIf and subthreshold activity in HVC, but also reveal discordance in the types of auditory stimuli that could elicit action-potential activity in each area. Although only the BOS and BOS-RO routinely elicited action-potential responses in HVCRA neurons, all stimuli, including noise bursts, evoked action-potential activity in NIf (Fig. 2). The ability of white noise bursts to elicit action potentials in NIf and subthreshold activity in HVC neurons (Fig. 5B, rightmost recording) was useful in determining the auditory latencies in these two areas (see Figs. 9, 10).
Figure 5.
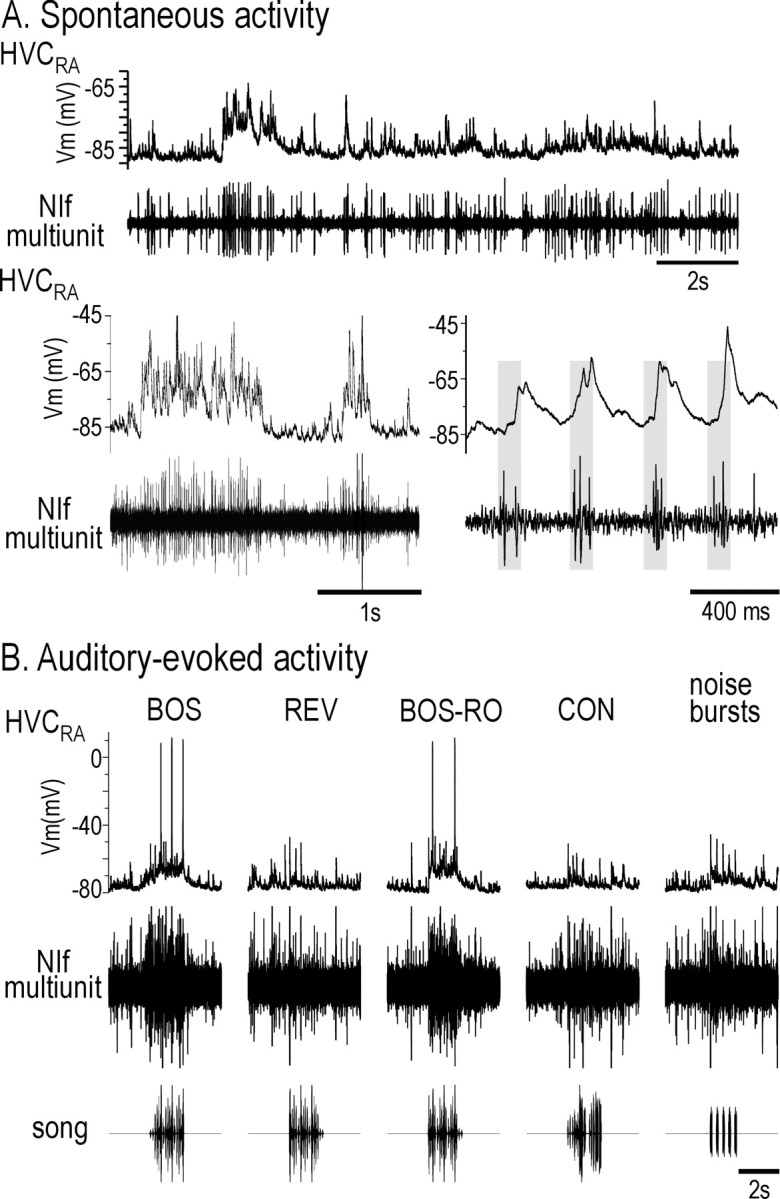
Spontaneous and auditory-evoked action-potential activity in NIf is similar to subthreshold activity in HVCRA neurons. A, Spontaneous activity in NIf and HVCRA. The top trace and two bottom traces are recordings from two different NIf-HVCRA pairs. The bottom right trace shows that NIf multiunit activity precedes depolarizing PSPs in the HVCRA neuron. B, Raw data showing the response of simultaneously recorded NIf and HVCRA to auditory stimuli. The bottom row shows the stimuli presented, and the middle and top rows show the multiunit response of NIf and intracellularly recorded response in HVCRA, respectively, to a single presentation of each of the auditory stimuli. The noise burst stimulus is five sequential presentations of short duration (50 msec) white noise bursts. Both NIf and the HVCRA neuron respond best to BOS and BOS-RO and less so to the other auditory stimuli. Although NIf fires to all stimuli presented, HVCRA fires only to BOS and BOS-RO. Note the onset response in NIf and the HVCRA neuron to white noise bursts. No current was being injected into the HVCRA neuron during this recording.
Figure 6.
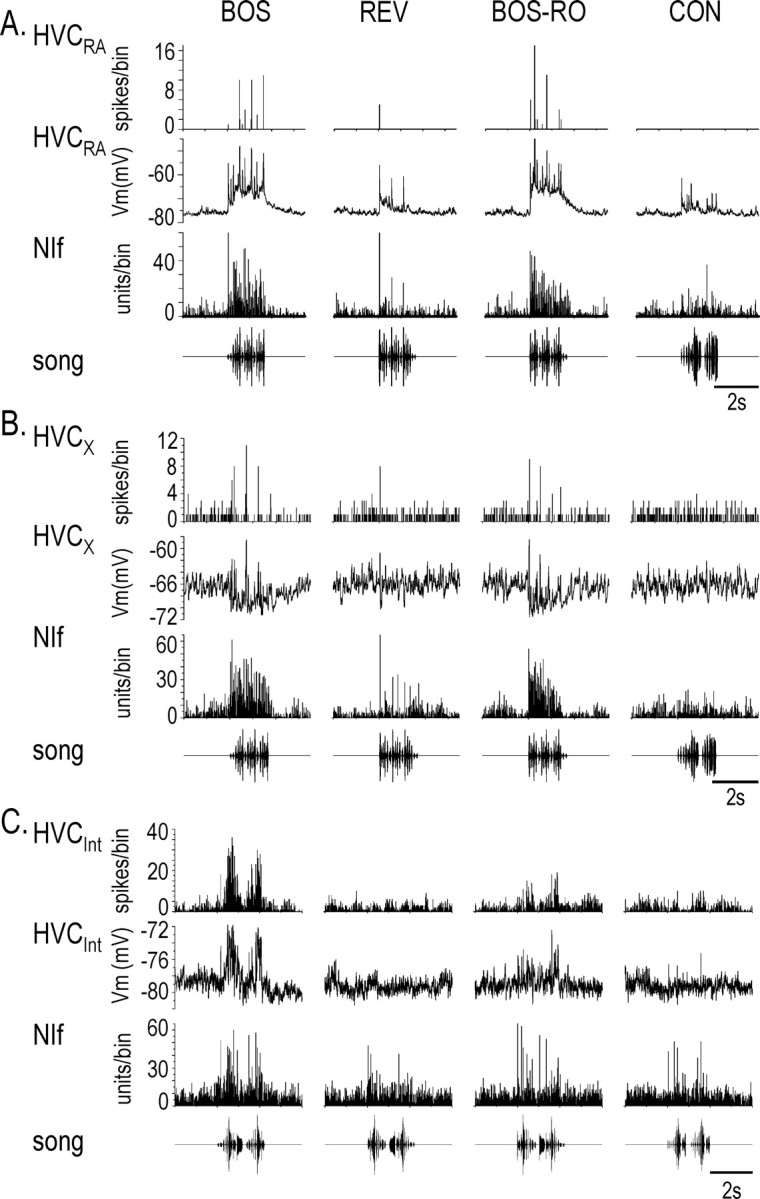
Cumulative action potential responses in NIf and the three HVC neuron cell types and average subthreshold responses in HVC neurons to auditory stimulation. A-C, Bottom row, song presentation; third row, PSTH for NIf units; second row, median-filtered, average membrane potential for each HVC neuron; top row, PSTH for spikes generated in the HVC neuron. Bin size = 25 msec. A and B are recordings from the same hemisphere of the same bird. A, Auditory-evoked response in NIf and HVCRA. Each stimulus elicited increased multiunit activity in NIf and a net depolarization in the HVCRA neuron. BOS and BOS-RO elicited the largest excitation of NIf and HVCRA. This is the same simultaneously recorded NIf and HVCRA pair shown in Figure 5B, in response to 10 iterations of each auditory stimulus. B, Auditory-evoked responses in NIf and HVCX. Presentation of BOS and BOS-RO resulted in increased firing in NIf and a net hyperpolarization of the HVCX membrane potential (10 iterations of each auditory stimulus were presented). There was little change in the HVCX membrane potential during playback of REV and CON. No current was being injected into the HVCX neuron during this recording. C, Auditory-evoked responses in NIf and HVCInt. Auditory presentation elicited a concomitant excitation in NIf and HVCInt neurons during playback of BOS and BOS-RO. There was little excitation in NIf and HVCInt during playback of REV and CON (10 iterations of each auditory stimulus). Tonic hyperpolarizing current (-0.47 nA) was injected into HVCInt during the recording.
Figure 10 .

Spike-triggered averages of each HVC neuron cell type membrane potential, calculated from NIf multiunit activity elicited by the onset of noise bursts. Top row, NIf STA peaks in HVCRA and HVCInt were depolarizing. STA peaks in HVCX were biphasic, with an initial depolarizing peak and later hyperpolarizing peak, when the HVCX neurons were near resting membrane potential (no current); STA peaks were monophasic and depolarizing when HVCX neurons were tonically hyperpolarized. Gray lines indicate individual STAs; black line indicates average STA. Black vertical line at 0 msec indicates time of NIf trigger event. Bottom row, Estimation of the peak onset time with the cusum of the average STA for each HVC neuron. The peak onset time was set to 5% of the cusum maximum (dotted line), set at 30 msec after the unit time. The peak onset time is illustrated by the arrowheads.
Previous studies have shown that different subthreshold events underlie temporally sparse BOS-evoked firing patterns in the two HVC PN types (Mooney, 2000; Mooney et al., 2001), raising the possibility that the functional relationship between NIf and HVC varies with PN cell type. These different subthreshold responses involve sustained depolarization of HVCRA and net hyperpolarization of HVCX (Mooney, 2000). The subthreshold responses of HVCX arise from a combination of excitation and inhibition, the latter of which is thought to be driven by HVCInt (Mooney, 2000; Rosen and Mooney, 2003). Therefore, we also examined the relationship between NIf activity and subthreshold activity in either HVCInt or HVCX (Fig. 6B,C). Like simultaneously recorded NIf multiunit activity, HVCInt was more strongly depolarized (Fig. 6A,C) in response to BOS and BOS-RO than to REV or CON. Furthermore, HVCX neurons had a larger hyperpolarizing response to BOS and BOS-RO than to REV or CON (Fig. 6B). These results are consistent with the idea that BOS-evoked hyperpolarizations in HVCX neurons are caused by feedforward inhibition from NIf through interposed HVCInt neurons.
Quantitative measures of auditory responsiveness in NIf and HVC
Quantitatively, NIf responsiveness to all song types presented here paralleled the evoked subthreshold activity in HVC neurons. Using z-scores, we compared the responsiveness of simultaneously recorded NIf multiunit activity and subthreshold activity of identified HVC neurons with the playback of different song stimuli (Fig. 7A). When the z-score values for NIf multiunit activity were plotted against the z-score values of subthreshold responses for either HVCRA or HVCInt neurons, points clustered evenly around the unity line (Fig. 7A) (see Table 1 for statistical comparisons). Thus, within-bird comparisons reveal that the strength of auditory-evoked NIf multiunit activity parallels subthreshold activity for all auditory stimuli in HVCInt and for all stimuli except REV in HVCRA.
Table 1.
z-score values for simultaneously recorded multiunit NIF activity and subthreshold activity HVC neurons
|
|
NIf |
HVCRA |
p |
n |
NIf |
HVCInt |
p |
n |
NIf |
HVCX Oi |
p |
n |
NIf |
HVCX hyp. |
p |
n |
|---|---|---|---|---|---|---|---|---|---|---|---|---|---|---|---|---|
| BOS | 2.74 ± 0.36 | 3.03 ± 0.52 | 0.647 | 17 | 2.07 ± 0.26 | 1.88 ± 0.32 | 0.554 | 12 | 2.62 ± 0.32 | 1.23 ± 0.30 | 0.004 | 20 | 2.89 ± 0.42 | 2.25 ± 0.39 | 0.099 | 15 |
| REV | 0.48 ± 0.13 | 0.85 ± 0.13 | 0.047 | 17 | 0.49 ± 0.18 | 0.34 ± 0.38 | 0.370 | 12 | 0.85 ± 0.13 | −0.05 ± 0.13 | <0.001 | 20 | 0.79 ± 0.17 | 0.77 ± 0.23 | 0.669 | 15 |
| BOS-RO | 1.63 ± 0.20 | 2.25 ± 0.61 | 0.345 | 12 | 2.06 ± 0.34 | 1.87 ± 0.30 | 0.638 | 11 | 1.91 ± 0.24 | 1.03 ± 0.30 | <0.001 | 20 | 2.34 ± 0.39 | 2.26 ± 0.36 | 0.916 | 14 |
| CON |
0.93 ± 0.17 |
1.04 ± 0.18 |
0.672 |
11 |
1.12 ± 0.35 |
0.73 ± 0.18 |
0.139 |
11 |
1.00 ± 0.14 |
−0.15 ± 0.11 |
0.003
|
10 |
0.92 ± 0.21 |
0.99 ± 0.20 |
0.669 |
14 |
Values are mean ± SEM. p values are calculated from paired t test; *p<0.05 is in bold.
The relationship between song-evoked NIf activity and subthreshold activity HVCX neurons depended on the HVC neuron membrane potential. When HVC neurons were near their resting membrane potential (-68.4 ± 1.5 mV), the BOS-evoked response was net hyperpolarizing (Fig. 6B), a feature most accurately calculated by the z-score value from the negative change in membrane potential area (negative area z-score) (Mooney, 2000). HVCX negative area z-score values at the resting membrane potential were significantly different from z-score values for simultaneously recorded NIf multiunit activity (Fig. 7A, bottom left, Table 1). This difference in z-score values could be attributable to additional inhibitory components from HVCInt to HVCX that mask excitatory inputs from NIf. To reduce the contribution of this inhibitory component, which is caused in part by a potassium current that reverses at approximately -85 mV (Rosen and Mooney, 2003), and enhance the excitatory component of the subthreshold response, we hyperpolarized the HVCX neurons (-84.3 ± 1.9 mV) and compared their positive area z-score values with z-score values of simultaneously recorded NIf multiunit activity. In contrast to the negative z-score values calculated near the resting membrane potential, the positive area z-scores calculated when HVCX neurons were hyperpolarized were not significantly different from z-scores of NIf multiunit activity (p > 0.05) (Fig. 7A, bottom right, Table 1). These results suggest that the difference in z-score values for NIf activity and subthreshold input in HVCX neurons near resting membrane potential could be attributable to contributions from synaptically interposed HVCInt neurons.
Within-bird comparisons of the selectivity for BOS over other stimuli in NIf and HVC
The comparisons of NIf multiunit activity and HVCRA subthreshold responses across different birds suggested an increase in selectivity between these two sites (Fig. 2C). This difference could be caused by variations in selectivity across birds, rather than a difference between sites within individual birds. To distinguish between these two possibilities, we simultaneously recorded NIf multiunit activity and HVC subthreshold activity and calculated d′ values at these two sites to compare the selectivity for BOS over other auditory stimuli (i.e., REV, BOS-RO, and CON). This comparison revealed a similar selectivity for BOS over REV and over CON in these two areas of the same bird (Fig. 7B). When the d′ values for the NIf multiunit activity of BOS versus the three other auditory stimuli were plotted against the subthreshold d′ value for HVCRA and HVCInt neurons, resultant points were distributed evenly about the unity line (mean d′ BOS vs REV: HVCRA, 3.99 ± 0.43; NIf, 3.92 ± 0.52; paired t test; p = 0.904; n = 17; HVCInt, 2.89 ± 0.44; NIf, 2.89 ± 0.25; p = 0.996; n = 13; mean d′ BOS versus CON: HVCRA, 3.65 ± 0.68; NIf, 3.07 ± 0.47; p = 0.316; n = 11; HVCInt, 2.61 ± 0.60; NIf, 2.24 ± 0.18; p = 0.552; n = 10; mean d′ BOS versus BOS-RO: HVCRA, 0.96 ± 0.30; NIf, 1.13 ± 0.22; p = 0.516; n = 12; HVCInt, 0.93 ± 0.37; NIf, 0.72 ± 0.33; p = 0.573; n = 9). In contrast, when HVCX neurons were at their resting potential, d′ values calculated from NIf multiunit activity and subthreshold activity in HVCX neurons were significantly different for all comparisons except BOS versus BOS-RO (mean d′ BOS versus REV; HVCX, 2.26 ± 0.47; NIf, 3.03 ± 0.37, paired t test, p = 0.178, n = 20: mean d′ BOS versus CON: HVCX, 2.21 ± 0.51; NIf, 2.84 ± 0.36; p = 0.226; n = 20; mean d′ BOS versus BOS-RO: HVCX, 0.50 ± 0.26; NIf, 1.17 ± 0.20; p = 0.004; n = 21). In this case, the d′ value usually was larger in NIf than in HVCX, likely reflecting inhibition onto HVCX from HVCInt neurons (Mooney, 2000; Rosen and Mooney, 2003). Consistent with this idea, when HVCX neurons were tonically hyperpolarized, their subthreshold d′ values were not significantly different from those calculated in NIf (mean d′ BOS versus REV: HVCX, 2.88 ± 0.51; NIf, 3.52 ± 0.52; paired t test; p = 0.125; n = 15; mean d′ BOS versus CON: HVCX, 2.42 ± 0.39; NIf, 3.23 ± 0.39; mean d′ BOS versus BOS-RO: HVCX, 1.12 ± 0.30; NIf, 1.32 ± 0.30). Cumulatively, these data indicate that BOS selectivity in a small population of NIf neurons, quantified using d′ values, equals the selectivity of the subthreshold activity in different HVC neuron types.
Correlations between NIf activity and membrane potential changes in HVC neurons
To examine correlations in NIf activity with changes in HVC membrane potential, we calculated the STA of the HVC neuron membrane potential relative to NIf trigger events (see Materials and Methods). As predicted from the average subthreshold responses (Fig. 6), STAs of HVCRA and HVCInt neurons showed a net depolarizing membrane potential offset during playback of BOS and BOS-RO, whereas HVCX neurons showed a net hyperpolarizing offset (Fig. 8A, Table 2). In HVCRA neurons and HVCX neurons, the membrane potential offsets generated during playback of BOS and BOS-RO were significantly larger than the membrane potential shift elicited by playback of REV and CON (p < 0.05; ANOVA; Tukey HSD). In HVCInt, the membrane potential offset to BOS was significantly greater than that to REV and CON (p < 0.05; ANOVA; Tukey HSD) but was not different from that to BOS-RO. The response to BOS-RO was not different from that of either REV or CON (p > 0.05; ANOVA; Tukey HSD).
Figure 8.

Auditory stimulation resulted in a net shift in membrane potential in HVC neurons and peaks in the membrane potential that were correlated with NIf multiunit activity. A, STAs of membrane potential changes in each HVC cell type calculated relative to NIf trigger events revealed a net depolarization in HVCRA to BOS and BOS-RO and in HVCInt neurons to BOS. STAs calculated during BOS and BOS-RO resulted in a net hyperpolarization in HVCX neurons when these cells were left near their resting membrane potential. In addition, these STAs contained a peak after the NIf trigger event time (black line at 0 msec). The horizontal dotted line in each graph denotes the membrane potential of the neuron before auditory presentation. B, Example of the STA that remained (subtracted, thick black line) after the STA from a shuffled NIf and HVCRA neuron response to BOS (gray line) was subtracted from the raw STA response (thin black line). The subtracted STA accounts for ∼70% of the raw STA. C, Percentage of the BOS response relative to the shuffled response for each HVC cell type. Black filled squares indicate individual responses; open squares indicate mean response (±SEM). The responses for the HVCX peak and trough are given as different values.
Table 2.
Membrane potential offsets in HVC neurons during song presentation
|
BOS |
n |
REV |
n |
BOS-RO |
n |
CON |
n |
||
|---|---|---|---|---|---|---|---|---|---|
| HVCRA | 6.7 ± 0.55mV | 9 | 2.3 ± 0.4 mV | 9 | 5.2 ± 1.0 mV | 9 | 2.6 ± 0.55mV | 9 | |
| HVCX | −1.52 ± 0.55mV | 13 | 0.38 ± 0.22mV | 13 | −1.49 ± 0.49mV | 13 | 0.07 ± 0.26mV | 12 | |
| HVCInt
|
3.22 ± 0.56 |
14 |
0.85 ± 0.38 |
12 |
2.31 ± 0.49 |
14 |
1.28 ± 0.5 |
12 |
|
In addition to a correlated shift in membrane potential during song playback, STAs also showed that NIf multiunit activity preceded membrane potential peaks in all HVC neuron subtypes. Song-evoked NIf multiunit activity preceded depolarizing peaks in HVCRA and HVCInt neurons and mixed depolarizing and hyperpolarizing peaks in HVCX neurons (Fig. 8 A). We subtracted any stimulus coordination artifact from the STA by first shuffling the BOS-evoked responses to generate a shuffled STA and then subtracting the shuffled STA from the raw song-evoked STA (Fig. 8 B). On average, the STAs remaining after subtraction of the shuffled STA accounted for more than half of the STA peak depolarization elicited during BOS presentation in all cell types (HVCRA, 65.8 ± 7.6%, n = 11; depolarizing peak in HVCX with no current injection, 67.4 ± 6.3%, n = 14; hyperpolarizing trough in HVCX, 59.1 ± 11.1%, n = 7; HVCInt, 71.0 ± 7.1%, n = 14). These data indicate that NIf activity and subthreshold responses in HVC covary on a trial-by-trial basis.
Onset latencies of NIf and HVC auditory activity
To obtain an accurate assessment of the timing of auditory-evoked activity in NIf, we measured onset response latencies to short-duration (50-100 msec) white noise bursts (Fig. 9). Multiunit NIf activity was elicited at two distinct latencies after the noise burst onset: Gaussian fits of the responses were centered at 12.2 ± 0.27 and 19.3 ± 0.14 msec, respectively (Fig. 9B) (n = 52). Because multiunit recordings cannot distinguish between NIf neurons that project to HVC (NIfHVC) and other NIf subpopulations, we recorded intracellularly from NIf neurons and delivered noise bursts to the bird to define the auditory-evoked spike onset latencies of NIfHVC neurons. These neurons fired action potentials with a 20.4 ± 0.7 msec delay from the noise burst onset (range, 15-26; n = 14) (Fig. 9C), which overlapped with the longer latency peak of the noise-evoked NIf multiunit activity. Of the 14 NIf neurons from which we recorded, 5 were adequately filled to provide anatomical confirmation that they projected to HVC (i.e., NIfHVC neurons).
Previous cross-correlation analyses of extracellular activity in NIf and HVC have left unresolved whether NIf and HVC receive a common auditory input or form a serial auditory pathway (Janata and Margoliash, 1999). To more precisely estimate the relative timing of noise-evoked activity in these two areas, we paired extracellular recordings in NIf with intracellular recordings in HVC and calculated STAs of HVC neuron membrane potential from NIf trigger events. Given that the intracellular recordings that we made here showed that NIfHVC neurons had relatively long latency onset responses, we calculated the STAs from a narrow window around the longer latency component of the NIf multiunit activity (see Materials and Methods). In eight such simultaneous recordings of NIf multiunit activity and single HVCRA neurons, the resultant STAs were monophasic and positive, with a peak that followed the NIf trigger event by 6.5 ± 0.67 msec (Fig. 10). To determine the peak onset, we calculated the cumulative sum response of the mean STA during the time period shown in Figure 10 (-10 to 30 msec relative to NIf trigger event time), because this time frame captures both baseline and the peak response. We set the peak onset at 5% of the cumulative sum maximum (Fig. 10). Using this method, there was a 1.8 msec delay from the longer latency NIf trigger event to the onset of the HVCRA STA peak. Similar recordings from NIf and HVCInt resulted in STAs that were positive with a peak that followed the NIf trigger event (5.8 ± 0.3 msec) and a peak onset that followed the NIf trigger event by 1.9 msec (n = 7). Recordings from NIf and HVCX neurons near their resting potential resulted in STAs that were usually (five of six) biphasic, with an initial positive peak occurring after the NIf trigger event followed by a hyperpolarizing response (n = 6). The hyperpolarizing component is likely caused by inhibitory input from HVCInt. To reduce the contribution of this inhibitory component, we calculated STAs of HVCX neurons held at more hyperpolarized membrane potentials (-84.3 ± 4.1 mV; n = 9). These STAs were monophasic, with a depolarizing peak after the NIf trigger event (7.3 ± 1.06 msec). The cumulative sum calculation indicated that the STA onsets occurred 1.6 msec after the NIf unit time, similar to the delay between NIf and HVCRA activity. In summary, recordings from all HVC cell types revealed that positive STA peaks followed NIf action potential activity, a feature that suggests that NIf provides either direct or indirect excitatory input to all HVC cell types in response to auditory stimulation.
Comparison of NIf multiunit and single-unit activity
Although individual HVC PNs fire temporally sparse BOS-evoked action potentials, multiunit NIf activity was sustained throughout much of BOS playback (Figs. 5B, 6A,B). The difference in output activity at these two sites could indicate that a temporally sparse representation of the BOS emerges in HVC; however, multiunit recordings from NIf could not resolve whether individual NIfHVC neurons fire action potentials throughout song playback or instead fire only at distinct times during BOS playback. In the latter case, the more sustained NIf activity seen with multiunit recordings may reflect the activity of several individual NIf neurons that fire at different times during BOS presentation. To determine the extent to which NIf multiunit activity reflected the action-potential activity of individual NIf neurons, we recorded intracellularly from NIf neurons (n = 14 neurons in seven animals). We found that individual NIf neurons did not fire at one particular time during BOS stimulation and that their activity qualitatively resembled NIf multiunit activity recorded from the same hemisphere (Fig. 11). A subset of these neurons (n = 5) was positively identified as NIfHVC neurons by neurobiotin staining and post hoc visualization of their labeled axon terminals in HVC (data not shown). We compared the response strength of identified NIfHVC neurons with that of the unidentified NIf neurons and found that these two groups were not significantly different for all auditory stimuli (unpaired t test; BOS, p = 0.76; REV, p = 0.55; BOS-RO, p = 0.35; CON, p = 0.56) (Fig. 12A). Because there was no significant difference in these two groups, we pooled data collected from all intracellularly recorded NIf neurons for the results presented in the following section.
Figure 11.

Comparison of song-evoked multiunit NIf activity with single-unit NIfHVC activity. Bottom panel, Oscillogram of song stimuli; third panel, response of a NIfHVC neuron to a single playback of each song stimulus. In this recording, no current was being injected through the recording electrode. Second panel, PTSH of the action potential response of this neuron to 20 iterations of each song presentation. Top panel, PSTH of the multiunit activity of the same NIf to 20 iterations of each song presentation.
Individual NIf neuron output compared with individual HVC neuron output
Previous studies have suggested that selectivity for BOS over other auditory stimuli may be enhanced within HVC. Our comparisons of multiunit NIf activity and subthreshold activity in HVC neurons suggest a close correspondence in selectivity (measured by the d′ metric) at these two sites, at least at the population level. One remaining issue, however, is whether the selectivity of NIf output at the single-unit level differs from the selectivity of individual HVC PNs and interneurons. We found that the mean d′ values for individual NIf neurons were not significantly different from the mean d′ values that we calculated for HVC PNs and interneurons (d′ BOS versus REV: NIf, 1.29 ± 0.23, n = 14; HVCRA, 1.53 ± 0.34, n = 14; HVCX, 0.59 ± 0.31, n = 19; HVCInt, 2.54 ± 0.47, n = 9; p > 0.05; ANOVA; d′ BOS versus CON: NIf, 1.26 ± 0.23, n = 12; HVCRA, 1.72 ± 0.58, n = 8; HVCX, 0.68 ± 0.29, n = 18; HVCInt, 0.27 ± 0.51; p > 0.05; ANOVA; d′ BOS versus BOS-RO: NIf, 0.25 ± 0.24, n = 12; HVCRA, 0.74 ± 0.34, n = 9; HVCX, 0.41 ± 0.21, n = 19; HVCInt, 0.69 ± 1.23, n = 8; p > 0.05; ANOVA) (Fig. 12B). These comparisons indicate that BOS selectivity, as measured with the d′ value, does not differ between the output of NIf and the output of HVC.
The d′ metric incorporates both the difference in response strength to two stimuli and response variability (see Materials and Methods). Therefore, similar d′ values in NIf and HVC cannot be assumed to reflect similar response strength differences at the two sites. To determine the degree to which similar d′ values in NIf and HVC can be attributed to similar response strength differences, we also calculated a selectivity index for all cell types, in both NIf and HVC (see Materials and Methods) (Solis and Doupe, 1997). This index involves a within-cell comparison of responsiveness with two different stimuli without the potential confound of response variability. Similar to the d′ analysis, we found that there was no difference in the selectivity indices between NIf and HVC (BOS-REV: NIf, 0.75 ± 0.05; HVCRA, 0.86 ± 0.08; HVCX, 0.93 ± 0.16; HVCInt, 1.27 ± 0.22; ANOVA; p > 0.05; BOS-CON: NIf, 0.54 ± 0.04; HVCRA, 0.75 ± 0.08; HVCX, 0.62 ± 0.12; HVCInt, 0.69 ± 0.03; ANOVA; p > 0.05; BOS-RS: NIf, 0.73 ± 0.04; HVCRA, 1.33 ± 0.32; HVCX, 0.81 ± 0.2; HVCInt, 0.94 ± 0.08; ANOVA; p > 0.05). This result suggests to us that the similar d′ values measured in NIf and HVC are attributable to differences in relative response strengths rather than differences in response variability.
Although d′ values and selectivity index measurements do not differ significantly between the output of NIf and HVC, HVC PNs typically did not fire to non-BOS stimuli and thus appeared qualitatively more selective than NIf neurons. To quantify this difference in NIf and HVC firing patterns, we compared the suprathreshold response strength in NIfHVC neurons with those of HVC neurons. For all stimuli presented, the action potential response strength of individual NIf neurons was significantly greater than the action potential RS of HVC PNs (ANOVA; p < 0.05; Tukey HSD). Furthermore, the action potential response strength of NIf neurons was significant for all stimuli tested (one sampled t test, compared with 0; p < 0.05), whereas REV and CON often failed to evoke any action-potential responses in HVC neurons (one sampled t test, RS compared with 0; HVCRA: REV, p = 0.61; CON, p = 0.47; HVCX: REV, p = 0.08; CON, p < 0.05; HVCInt: REV, p = 0.12; CON, p = 0.17). As predicted by comparisons of NIf multiunit activity and the action potential activity of HVC PNs, these results indicate that an enhanced selectivity for the BOS, characterized by a lack of responsiveness to non-BOS stimuli (i.e., REV and CON) emerges within HVC.
Another notable feature of the BOS-evoked response in HVC is its temporal sparseness, with some PNs firing only one action potential burst per song motif (i.e., the largest repeated song unit). To determine whether a temporally sparse response to the BOS also emerges within HVC, we calculated a temporal sparseness index for action-potential activity in both NIf and HVC (see Materials and Methods). We found that both HVC PN types had significantly greater sparseness indices than NIf neurons and that the temporal sparseness index for NIf and HVCInt were not significantly different (Fig. 12C) (p < 0.0125; Wilcoxon test, corrected for multiple comparisons; 3 df). In sum, these data indicate that a temporally sparse response to the BOS emerges within HVC.
Discussion
We found that auditory-evoked NIf activity paralleled. The subthreshold responses in individual HVC neurons and that NIf activity is necessary for the expression of subthreshold and suprathreshold auditory-evoked activity in HVC. Furthermore, NIf and HVC differ in their auditory-evoked firing patterns, with HVC PNs firing more sparsely to BOS playback and often not at all to non-BOS stimuli, whereas NIfHVC neurons fire throughout all auditory stimuli. These results indicate that an enhanced selectivity for the BOS emerges in HVC.
NIf as the source of auditory input to HVC
Historically, the identification of the auditory input of HVC has been difficult to resolve because of pronounced anatomical convergence from NIf, medial magnocellular nucleus of the anterior nidopallium (mMAN), nucleus uvaeformis (Uva), and possibly field L, the primary auditory telencephalon of the bird. Of these various afferents, Uva does not display auditory responses (Wild, 1994), and mMAN likely derives its auditory input indirectly from HVC (Vates et al., 1996), leaving NIf and field L as the two potential sources of ascending auditory input to HVC. Field L makes only a sparse direct input to HVC, and the response properties of field L do not match the synaptic responses seen in HVCRA neurons (Fig. 2) (Lewicki and Arthur, 1996). We propose that NIf provides the major source of auditory input to HVC and that the contributions of field L to the auditory responses in HVC are likely to be indirect, either through NIf or via the caudolateral mesopallium [caudolateral hyperstriatum ventrale in Vates et al. (1996)].
Selective responses to specific sensory cues can arise from convergence of inputs originating from either multiple or single areas of the brain (Suga et al., 1978; Kawasaki et al., 1988; Heiligenberg, 1989; Carr and Konishi, 1990; Rolls, 1992; Fitzpatrick et al., 1993; Vidyasagar et al., 1996; Pena and Konishi, 2001; Brecht and Sakmann, 2002; Pena and Konishi, 2002; Perez-Orive et al., 2002; Higley and Contreras, 2003). The generation of BOS selectivity in HVC neurons could be the result of afferents from multiple sources that converge onto individual HVC neurons. Although previous reports have shown that NIf inactivation abolished spontaneous and auditory-evoked spiking in HVC (Boco and Margoliash, 2001; Cardin and Schmidt, 2004), these studies did not exclude the possibility that other auditory afferents contributed to the response of HVC but was required NIf activity to permit BOS-evoked spiking in HVC neurons. We found, however, that NIf inactivation removes almost all of the subthreshold activity in HVC neurons, indicating that NIf is the major auditory afferent. Although our inactivation experiments do not fully exclude the possibility that field L contributes to the auditory-evoked response in HVC, this possibility seems unlikely, because field L neurons that project near or into HVC are distributed diffusely across a large area (Vates et al., 1996). In addition, our experiments do not exclude the possibility that NIf acts presynaptically within HVC to gate the activity of other HVC afferents or that additional auditory inputs dependent on HVC activity (i.e., mMAN) also contribute to HVC auditory responses in control recordings.
Convergent input to individual HVC neurons could arise from multiple neurons within NIf. Two findings from the present study consistent with this model are the concordance between NIf multiunit activity and HVC neuron subthreshold responses to auditory stimuli and the increased response strength of NIf multiunit activity compared with NIf single-unit activity. Anatomical convergence of NIf axons on HVC neurons could play an important role in the expression of temporally sparse and enhanced BOS selectivity, perhaps through synaptic integration or coincidence detection at the postsynaptic membrane.
Auditory transformations from NIf to HVC
Previous studies comparing the spiking patterns of HVC with its putative auditory afferents have suggested that BOS selectivity is enhanced within HVC (Janata and Margoliash, 1999). Lewicki and Arthur (1996) suggested that BOS selectivity is an emergent property of the HVC network, arising either directly or indirectly from nonselective inputs from field L. Janata and Margoliash (1999) found that neurons in NIf were selective for BOS but that selectivity increased from NIf to HVC. In contrast, using d′ values, we observed that BOS selectivity for a small population of NIf neurons closely matches the selectivity of the population of subthreshold inputs to individual HVC neurons (Mooney, 2000). This correspondence indicates that HVC neurons act as followers of a highly selective input from NIf. Furthermore, a somewhat surprising result is that the selectivity of individual NIf neurons was nearly identical to the suprathreshold selectivity of individual HVC PNs, as measured with both d′ values and a selectivity index. Unlike the d′ analysis, the selectivity index does not take into account response variability, and thus the similar selectivity in NIf and HVC can be attributed to similar suprathreshold response biases at the two sites.
Although d′ and selectivity index measurements show that the output of NIf and HVC are equally selective for BOS over other auditory stimuli, calculations of action potential response strength in these two areas show that HVC is a site where enhanced selectivity to self-generated vocalizations emerges: unlike NIf PNs, HVC PNs do not fire action potentials to REV or CON. This more exclusive response also is characterized by temporally sparse firing in both HVC PN types, a feature that emerges within HVC. A similar increase in sparseness and selectivity has been shown between the odor-evoked activity of the antennal lobe and mushroom body neurons in the locust (Perez-Orive et al., 2002; Theunissen, 2003). Our results indicate that significant changes occur in the auditory representations between NIf and HVC.
Studies in other sensory systems have shown that intrinsic membrane properties and local circuitry contribute significantly to the generation of selective responses (Vidyasagar et al., 1996; Bringuier et al., 1999; Zhu and Connors, 1999; Ferster and Miller, 2000; Vinje and Gallant, 2000). Similar mechanisms may underlie the highly selective, temporally sparse BOS-evoked firing patterns of HVC PNs. BOS-specific firing in HVC PNs may result in part from simple thresholding mechanisms (i.e., an “iceberg” effect) or other more complex processes involving intrinsic membrane properties and inhibitory inputs from the HVC network. Thresholding of synaptic inputs in both the owl auditory system and visual cortex have been shown to play an important role in the generation of sensory selectivity (Carandini and Ferster, 2000; Pena and Konishi, 2001, 2002). Consistent with this mechanism operating in HVC, the resting membrane potential of HVCRA neurons is relatively hyperpolarized (approximately -80 mV), and tonic depolarization of HVCRA neurons can enable action-potential responses to REV and non-BOS stimuli (Mooney, 2000; our unpublished observations). Inhibition also has been implicated in the generation of stimulus specificity in other systems (Sillito, 1975; Fujita and Konishi, 1991; Ferster and Miller, 2000; Perez-Orive et al., 2002). Indeed, postsynaptic inhibition appears to play an important role in establishing a more exclusive action-potential bias in HVCX neurons because disrupting G-protein-mediated inhibition in these cells increases their spiking response strength to nonpreferred stimuli, i.e., BOS-RO (Rosen and Mooney, 2003). The inhibition in HVCX neurons most likely arises from HVCInt neurons (Mooney, 2000; Rosen and Mooney, 2003). These interneurons could be excited directly by NIf or indirectly via HVCRA neurons. A direct NIf effect is suggested by the close correspondence between non-BOS responses in NIf and interneurons and the similarly short onset latencies between NIf suprathreshold activity and subthreshold responses in all HVC cell types. In either case, BOS-exclusive responses in the two output pathways of HVC appear to be generated by transforming a common excitatory input to the two HVC PNs via two different local mechanisms: one is more dependent on intrinsic membrane properties and the other is more dependent on synaptic inhibition.
Functional relevance
The auditory-evoked responses in NIf and HVCRA neurons may shed light on the synaptic processes underlying song production. Indeed, recordings from individual premotor (HVCRA) neurons during singing show that these neurons fire at precise times during song (Hahnloser et al., 2003), a firing pattern similar to the response that these neurons have to playback of the BOS (Mooney, 2000). Although the function of such sparse firing in the songbird remains unknown, sparse firing patterns in other systems are thought to facilitate learning and memory (Golomb et al., 1990; Olshausen and Field, 1996; Hyvarinen and Hoyer, 2001). In addition, NIf is involved in song production (McCasland, 1987), and the activity of NIfHVC neurons during BOS playback resembles their activity in singing birds (Hahnloser and Fee, 2003). That is, like their response to auditory playback of BOS, individual NIfHVC neurons respond throughout a motif, whereas HVCRA neurons fire a single burst of action potentials during a single song motif. These parallels give credence to the notion that a common mechanism gives rise to similar auditory and motor song representations in HVC.
Footnotes
This work was supported by National Institute on Deafness and Other Communication Disorders Grant 02524 (R.M.). We thank David Kloetzer for excellent technical assistance, Amit Basole and Drs. E. Bauer, J. Prather, and Y.-Y. Sugiyama for their constructive comments on previous versions of this manuscript, and two anonymous reviewers for their constructive comments.
Correspondence should be addressed to Melissa J. Coleman, Box 3209, Department of Neurobiology, Duke University Medical Center, Durham, NC 27710. E-mail: coleman@neuro.duke.edu.
Copyright © 2004 Society for Neuroscience 0270-6474/04/249251-15$15.00/0
References
- Boco T, Margoliash D (2001) NIf is a major source of auditory and spontaneous drive to HVc. Soc Neurosci Abstr 27: 318.2. [Google Scholar]
- Bottjer SW, Halsema KA, Brown SA, Miesner EA (1989) Axonal connections of a forebrain nucleus involved with vocal learning in zebra finches. J Comp Neurol 279: 312-326. [DOI] [PubMed] [Google Scholar]
- Brecht M, Sakmann B (2002) Dynamic representation of whisker deflection by synaptic potentials in spiny stellate and pyramidal cells in the barrels and septa of layer 4 rat somatosensory cortex. J Physiol (Lond) 543: 49-70. [DOI] [PMC free article] [PubMed] [Google Scholar]
- Bringuier V, Chavane F, Glaeser L, Fregnac Y (1999) Horizontal propagation of visual activity in the synaptic integration field of area 17 neurons. Science 283: 695-699. [DOI] [PubMed] [Google Scholar]
- Carandini M, Ferster D (2000) Membrane potential and firing rate in cat primary visual cortex. J Neurosci 20: 470-484. [DOI] [PMC free article] [PubMed] [Google Scholar]
- Cardin JA, Schmidt MF (2004) Auditory responses in multiple sensorimotor song system nuclei are co-modulated by behavioral state. J Neurophysiol 91: 2148-2163. [DOI] [PubMed] [Google Scholar]
- Carr CE, Konishi M (1990) A circuit for detection of interaural time differences in the brain stem of the barn owl. J Neurosci 10: 3227-3246. [DOI] [PMC free article] [PubMed] [Google Scholar]
- Coleman M, Mooney R (2002) Source of auditory input to the songbird nucleus HVc revealed by pairwise recordings in NIf and HVc. Soc Neurosci Abstr 28: 558.4. [Google Scholar]
- Doupe AJ, Konishi M (1991) Song-selective auditory circuits in the vocal control system of the zebra finch. Proc Natl Acad Sci USA 88: 11339-11343. [DOI] [PMC free article] [PubMed] [Google Scholar]
- Dutar P, Vu H, Perkel D (1998) Multiple cell types distinguished by physiological, pharmacological, and anatomic properties in nucleus HVc of the adult zebra finch. J Neurophysiol 80: 1828-1838. [DOI] [PubMed] [Google Scholar]
- Ferster D, Miller K (2000) Neural mechanisms of orientation selectivity in the visual cortex. Annu Rev Neurosci 23: 441-471. [DOI] [PubMed] [Google Scholar]
- Ferster D, Chung S, Wheat H (1996) Orientation selectivity of thalamic input to simple cells of cat visual cortex. Nature 380: 249-252. [DOI] [PubMed] [Google Scholar]
- Fitzpatrick DC, Kanwal JS, Butman JA, Suga N (1993) Combination-sensitive neurons in the primary auditory cortex of the mustached bat. J Neurosci 13: 931-940. [DOI] [PMC free article] [PubMed] [Google Scholar]
- Fortune ES, Margoliash D (1995) Parallel pathways and convergence onto HVC and adjacent neostriatum of adult zebra finches (Taeniopygia guttata). J Comp Neurol 360: 413-441. [DOI] [PubMed] [Google Scholar]
- Fujita I, Konishi M (1991) The role of GABAergic inhibition in processing of interaural time difference in the owl's auditory system. J Neurosci 11: 722-739. [DOI] [PMC free article] [PubMed] [Google Scholar]
- Golomb D, Rubin N, Sompolinsky H (1990) Willshaw model: associative memory with sparse coding and low firing rates. Phys Rev [A] 41: 1843-1854. [DOI] [PubMed] [Google Scholar]
- Green D, Swets J (1966) Signal detection theory and psychophysics. New York: Wiley.
- Hahnloser R, Fee M (2003) Single neuron recordings in nucleus interface of singing zebra finches. Soc Neurosci Abstr 29: 294.4. [Google Scholar]
- Hahnloser R, Kozhevnikov A, Fee M (2003) An ultra-sparse code underlies the generation of neural sequences in a songbird. Nature 419: 65-70. [DOI] [PubMed] [Google Scholar]
- Heiligenberg W (1989) Coding and processing of electrosensory information in gymnotiform fish. J Exp Biol 146: 255-275. [DOI] [PubMed] [Google Scholar]
- Higley MJ, Contreras D (2003) Nonlinear integration of sensory responses in the rat barrel cortex: an intracellular study in vivo J Neurosci 23: 10190-10200. [DOI] [PMC free article] [PubMed] [Google Scholar]
- Hyvarinen A, Hoyer PO (2001) A two-layer sparse coding model learns simple and complex cell receptive fields and topography from natural images. Vision Res 41: 2413-2423. [DOI] [PubMed] [Google Scholar]
- Jagadeesh B, Wheat HS, Ferster D (1993) Linearity of summation of synaptic potentials underlying direction selectivity in simple cells of the cat visual cortex. Science 262: 1901-1904. [DOI] [PubMed] [Google Scholar]
- Janata P, Margoliash D (1999) Gradual emergence of song selectivity in sensorimotor structures of the male zebra finch song system. J Neurosci 19: 5108-5118. [DOI] [PMC free article] [PubMed] [Google Scholar]
- Kawasaki M, Guo YX (1998) Parallel projection of amplitude and phase information from the hindbrain to the midbrain of the African electric fish Gymnarchus niloticus J Neurosci 18: 7599-7611. [DOI] [PMC free article] [PubMed] [Google Scholar]
- Kawasaki M, Margoliash D, Suga N (1988) Delay-tuned combination-sensitive neurons in the auditory cortex of the vocalizing mustached bat. J Neurophysiol 59: 623-635. [DOI] [PubMed] [Google Scholar]
- Kelley D, Nottebohm F (1979) Projections of a telencephalic auditory nucleus-field L in the canary. J Comp Neurol 183: 455-469. [DOI] [PubMed] [Google Scholar]
- Knudsen E, Konishi M (1978) Space and frequency are represented separately in auditory midbrain of the owl. J Neurophysiol 41: 870-884. [DOI] [PubMed] [Google Scholar]
- Kubota M, Taniguchi I (1998) Electrophysiological characteristics of classes of neuron in the HVc of the zebra finch. J Neurophysiol 80: 914-923. [DOI] [PubMed] [Google Scholar]
- Lewicki M, Arthur B (1996) Hierarchical organization of auditory temporal context sensitivity. J Neurosci 16: 6987-6998. [DOI] [PMC free article] [PubMed] [Google Scholar]
- Margoliash D (1983) Acoustic parameters underlying the responses of song-specific neurons in the white-crowned sparrow. J Neurosci 3: 1039-1057. [DOI] [PMC free article] [PubMed] [Google Scholar]
- Margoliash D (1986) Preference for autogenous song by auditory neurons in a song system nucleus of the white-crowned sparrow. J Neurosci 6: 1643-1661. [DOI] [PMC free article] [PubMed] [Google Scholar]
- Margoliash D, Fortune ES, Sutter ML, Yu AC, Wren-Hardin BD, Dave A (1994) Distributed representation in the song system of oscines: evolutionary implications and functional consequences. Brain Behav Evol 44: 247-264. [DOI] [PubMed] [Google Scholar]
- Maunsell JH, Newsome WT (1987) Visual processing in monkey extrastriate cortex. Annu Rev Neurosci 10: 363-401. [DOI] [PubMed] [Google Scholar]
- McCasland JS (1987) Neuronal control of bird song production. J Neurosci 7: 23-39. [DOI] [PMC free article] [PubMed] [Google Scholar]
- Monier C, Chavane F, Baudot P, Graham L, Fregnac Y (2003) Orientation and direction selectivity of synaptic inputs in visual cortical neurons: a diversity of combinations produces spike tuning. Neuron 37: 663-680. [DOI] [PubMed] [Google Scholar]
- Mooney R (2000) Different subthreshold mechanisms underlie song selectivity in identified HVc neurons of the zebra finch. J Neurosci 20: 5420-5436. [DOI] [PMC free article] [PubMed] [Google Scholar]
- Mooney R, Hoese W, Nowicki S (2001) Auditory representation of the vocal repertoire in a songbird with multiple song types. Proc Natl Acad Sci USA 98: 12778-12783. [DOI] [PMC free article] [PubMed] [Google Scholar]
- Olshausen BA, Field DJ (1996) Emergence of simple-cell receptive field properties by learning a sparse code for natural images. Nature 381: 607-609. [DOI] [PubMed] [Google Scholar]
- Pena JL, Konishi M (2001) Auditory spatial receptive fields created by multiplication. Science 292: 249-252. [DOI] [PubMed] [Google Scholar]
- Pena JL, Konishi M (2002) From postsynaptic potentials to spikes in the genesis of auditory spatial receptive fields. J Neurosci 22: 5652-5658. [DOI] [PMC free article] [PubMed] [Google Scholar]
- Perez-Orive J, Mazor O, Turner GC, Cassenaer S, Wilson RI, Laurent G (2002) Oscillations and sparsening of odor representations in the mushroom body. Science 297: 359-365. [DOI] [PubMed] [Google Scholar]
- Perkel D, Gerstein G, Moore G (1967) Neuronal spike trains and stochastic point processes. II. Simultaneous spike trains. Biophys J 7: 419-440. [DOI] [PMC free article] [PubMed] [Google Scholar]
- Rolls E (1992) Neurophysiological mechanisms underlying face processing within and beyond the temporal cortical visual areas. Philos Trans R Soc Lond B Biol Sci 335: 11-20. [DOI] [PubMed] [Google Scholar]
- Rosen M, Mooney R (2000) Intrinsic and extrinsic contributions to auditory selectivity in a song nucleus critical for vocal plasticity. J Neurosci 20: 5437-5448. [DOI] [PMC free article] [PubMed] [Google Scholar]
- Rosen M, Mooney R (2003) Inhibitory and excitatory mechanisms underlying auditory responses to learned vocalizations in the songbird nucleus HVC. Neuron 39: 1-20. [DOI] [PubMed] [Google Scholar]
- Sillito AM (1975) The contribution of inhibitory mechanisms to the receptive field properties of neurones in the striate cortex of the cat. J Physiol (Lond) 250: 305-329. [DOI] [PMC free article] [PubMed] [Google Scholar]
- Solis MM, Doupe AJ (1997) Anterior forebrain neurons develop selectivity by an intermediate stage of birdsong learning. J Neurosci 17: 6447-6462. [DOI] [PMC free article] [PubMed] [Google Scholar]
- Suga N, O'Neill W, Manabe T (1978) Cortical neurons sensitive to combinations of information-bearing elements of biosonar signals in the mustached bat. Science 200: 778-781. [DOI] [PubMed] [Google Scholar]
- Sugase Y, Yamane S, Ueno S, Kawano K (1999) Global and fine information coded by single neurons in the temporal visual cortex. Nature 400: 869-873. [DOI] [PubMed] [Google Scholar]
- Theunissen FE (2003) From synchrony to sparseness. Trends Neurosci 26: 61-64. [DOI] [PubMed] [Google Scholar]
- Ts'o DY, Gilbert CD, Wiesel TN (1986) Relationships between horizontal interactions and functional architecture in cat striate cortex as revealed by cross-correlation analysis. J Neurosci 6: 1160-1170. [DOI] [PMC free article] [PubMed] [Google Scholar]
- Vates G, Vicario D, Nottebohm F (1997) Reafferent thalamo-“cortical” loops in the song system of oscine songbirds. J Comp Neurol 380: 275-290. [PubMed] [Google Scholar]
- Vates GE, Broome BM, Mello CV, Nottebohm F (1996) Auditory pathways of caudal telencephalon and their relation to the song system of adult male zebra finches. J Comp Neurol 366: 613-642. [DOI] [PubMed] [Google Scholar]
- Vidyasagar T, Pei X, Volgushev M (1996) Multiple mechanisms underlying the orientation selectivity of visual cortical neurones. Trends Neurosci 19: 272-277. [DOI] [PubMed] [Google Scholar]
- Vinje WE, Gallant JL (2000) Sparse coding and decorrelation in primary visual cortex during natural vision. Science 287: 1273-1276. [DOI] [PubMed] [Google Scholar]
- Wagner H, Takahashi T, Konishi M (1987) Representation of interaural time difference in the central nucleus of the barn owl's inferior colliculus. J Neurosci 7: 3105-3116. [DOI] [PMC free article] [PubMed] [Google Scholar]
- Welker C (1976) Receptive fields of barrels in the somatosensory neocortex of the rat. J Comp Neurol 166: 173-189. [DOI] [PubMed] [Google Scholar]
- Wild J (1994) Visual and somatosensory inputs to the avian song system via nucleus uvaeformis (Uva) and a comparison with the projections of a similar thalamic nucleus in a nonsongbird, Columba livia. J Comp Neurol 349: 512-535. [DOI] [PubMed] [Google Scholar]
- Zhu JJ, Connors BW (1999) Intrinsic firing patterns and whisker-evoked synaptic responses of neurons in the rat barrel cortex. J Neurophysiol 81: 1171-1183. [DOI] [PubMed] [Google Scholar]