Abstract
The visual system encodes and deciphers information using parallel, anatomically segregated, processing streams. To reveal patterns of gene expression in the visual thalamus correlated with physiological processing streams, we designed a custom ferret cDNA microarray. By isolating specific subregions and layers of the thalamus, we identified a set of transcription factors, including Zic2, Islet1, and Six3, the unique distribution profiles of which differentiated the lateral geniculate nucleus (LGN) from the associated perigeniculate nucleus. Within the LGN, odd homeobox1 differentiated the A layers, which contain X cells and Y cells, from the C layers. One neuron-specific protein, Purkinje cell protein 4 (PCP4), was strongly expressed in Y cells in the ferret LGN and in the magnocellular layers of the primate LGN. In the ferret LGN, PCP4 expression began as early as postnatal day 7 (P7), suggesting that Y cells are already specified by P7. These results reveal a rich molecular repertoire that correlates with functional divisions of the LGN.
Keywords: microarray, transcription factors, lateral geniculate nucleus, development, Y cell, PCP4, visual cortex
Introduction
The visual system separates different types of information into parallel, anatomically segregated, processing streams (Sherman and Spear, 1982; Livingstone and Hubel, 1987; DeYoe and Van Essen, 1988; Felleman and Van Essen, 1991; Maunsell, 1992; Hendry and Reid, 2000; Sherman and Guillery, 2004). In carnivores, the three physiological retino-geniculo-cortical streams are known as X, Y, and W streams; the X and Y streams are comparable with the parvocellular and magnocellular pathways in primates (Sherman and Guillery, 2004). The X (parvocellular) stream contributes to form discrimination and color recognition, whereas the Y (magnocellular) stream is primarily concerned with information about object motion (Livingstone and Hubel, 1987; DeYoe and Van Essen, 1988).
These distinct physiological streams originate in different populations of retinal ganglion cells (RGCs) and are segregated into distinct regions in the lateral geniculate nucleus (LGN). In carnivores, X and Y streams project to distinct, but intermingled, populations of relay neurons in A and A1 layers (Sherman and Spear, 1982). The C layers receive input primarily from the W stream and partially from the Y stream. The segregation of the physiological streams in the LGN is increasingly pronounced in animals with highly developed visual systems (e.g., primates) compared with rodents (Butler and Hodos, 1996).
Despite their significance for visual processing, few molecular correlates of these physiological streams are known. Two monoclonal antibodies, Cat-301 and SMI-32, recognize Y cells in the adult LGN. Cat-301, which recognizes nonglycosylated form of the extracellular matrix protein aggrecan (Matthews et al., 2002), stains perineuronal nets around Y cells in carnivores and primates (Hendry et al., 1984; Hockfield and Sur, 1990). Immunoreactivity appears only late in development (Sur et al., 1988). SMI-32 recognizes a nonphosphorylated epitope on neurofilament-H and stains cells with Y cell-like morphology in the adult cat LGN (Bickford et al., 1998). However, because the distribution pattern of SMI-32-positive cells in the LGN changes significantly during development, SMI-32 may stain different classes of cells earlier in development (Carden et al., 2000).
Specification of magnocellular-parvocellular streams in the LGN probably involves activity-independent molecular mechanisms. Prenatal monocular enucleation does not prevent the formation of magnocellular and parvocellular zones (Rakic, 1981), and layer-specific cytoarchitecture emerges despite early binocular enucleation (Brunso-Bechtold et al., 1983; Guillery et al., 1985). Moreover, optic axons project selectively and directly to either the magnocellular or parvocellular zone of the developing LGN (Meissirel et al., 1997). To identify the molecular correlates of these functionally distinct streams, we used cDNA microarrays to analyze patterns of gene expression in the visual thalamus of a highly visual mammal, the ferret, whose altricial development allows ready access to tissues at the appropriate stage of development. Here, we report molecules for which unique distribution and developmental profiles define the LGN itself and its constituent layers and identify a physiological stream in the visual thalamus.
Materials and Methods
Animals. Normally pigmented, sable ferrets, Mustela putorius furo, were purchased from Marshall Farms (North Rose, NY). All procedures were performed in accordance with a protocol approved by the Duke University Institutional Animal Care and Use Committee. Sections of primate thalamus (Macaca fascicularis) were kindly provided by Andrew D. Huberman and Leo M. Chalupa (University of California, Davis, Davis, CA).
Ferret cDNA microarray. Using a pT7T3D-Pac vector, a ferret cDNA library was prepared from fresh tissue derived from a pool of postnatal day 16 (P16) ferret LGN tissue. The average insert size was ∼1.5 kb. The cDNA inserts from 13,800 clones were amplified by PCR using T3 and T7 primers located on the vector and then purified and resuspended in 3× SSC at a concentration of 200 ng/μl. The DNA solution was spotted on poly-l-lysine-coated slides, and spots were examined with POPO3, which binds to and visualizes DNA. Just before hybridization, the slides were baked at 80°C and UV cross-linked.
Preparation of microarray probes. Total RNA (10 μg) extracted from each tissue was labeled by incorporating Cy3 or Cy5 during reverse transcription (RT). Deoxynucleotides labeled with Cy3 or Cy5 dye were obtained from Amersham Biosciences (Piscataway, NJ). The labeling was performed at 42°C for 2 hr in a total volume of 25 μl containing 0.5 μg of oligo dT primer, 5 μl of 5× first-strand buffer, 10 mm DTT, 400 U of SuperScript II (Invitrogen, Carlsbad, CA), 50 μm Cy3 (or Cy5)deoxyUTP, 50 μm Cy3 (or Cy5)-deoxyCTP (dCTP), 0.4 mm each dATP and dGTP, and 0.1 mm each dCTP and dTTP. After denaturation at 95°C for 5 min, RNA was hydrolyzed with 0.2 mm NaOH at 37°C for 10 min and then neutralized. The Cy3- and Cy5-labeled cDNAs were mixed, purified using QIAquick PCR purification kit (Qiagen, Valencia, CA), dried, and resuspended in 60 μl of hybridization buffer (50% formamide, 5× SSC, 0.1% SDS and poly dA). After denaturation at 95°C, the labeled cDNA was applied to ferret microarray slides and incubated overnight at 42°C. The slides were washed in 0.2× SSC/0.1%SDS for 1 min twice, 0.2× SSC for 2 min, and then 0.05× SSC for 1 min. The slides were spun at 800 rpm for 2 min and scanned on a GenePix4000B (Axon Instruments, Union City, CA).
Data analysis. To improve data accuracy, we compared each combination twice with Cy3-Cy5 dye swapping. If mean signal intensities were less than the mean ± two SDs of background signal intensities in both Cy3 and Cy5, the corresponding spots were eliminated from analyses. After mean background signal intensities were subtracted from mean signal intensities, the data were normalized to an overall Cy3 versus Cy5 signal intensity ratio of 1. When we compared the same tissue samples to each other, no clones exhibited more than a twofold difference in the signal intensities. Therefore, clones that consistently showed more than a twofold difference after one dye swapping experiment were judged to have significant differences in expression levels. DNA sequences of the positive clones were read and analyzed with BLAST (basic local alignment search tool) searches. In total, DNA sequences of ∼200 clones were read, and 59% of the clones were independent.
Selective isolation of LGN layers. Alexa 488- or Alexa 555-conjugated cholera toxin B subunit (CTB) (Molecular Probes, Eugene, OR) was dissolved in 0.2% DMSO/saline to make a 0.5% stock. Under general anesthesia (isoflurane), the CTB solution (10 μl) was injected into the vitreous humor via a 33 gauge needle. Two days later, the animals were killed by pentobarbital overdose. The thalamus was removed and sectioned parasagittally at 300 μm thickness at 4°C using a vibratome. The sections were transferred to a fluorescence dissection microscope and placed on a chilled glass stage. Each layer was identified with fluorescence, manually dissected with a microdissection knife, collected separately, and stored at -80°C. LGN layers from 36 P16 ferrets were pooled and used for microarray experiments.
Cross-species hybridization screening. In addition to the custom ferret microarray, we also used commercially available DNA chips [Affymetrix (Santa Clara, CA) mouse U74v2, human U133A, and Operon (Alameda, CA) mouse oligo set, version 2.0]. Preliminary experiments showed that cross-species hybridization screening using ferret RNA and mouse/human DNA chips could uncover clones for which expression levels were significantly different between two samples, although the number of the positive clones was only ∼10% of that seen with the ferret microarray (data not shown).
Using intravitreal injection of Alexa 488-CTB to label the LGN, we isolated the LGN and the perigeniculate nucleus (PGN) separately at P16 as described above. Total RNA was isolated and used in DNA chip experiments. To improve the accuracy of the data, each experiment was repeated twice. We focused on clones with more than a twofold difference between the LGN and the PGN. No clones showed more than a twofold difference when we compared LGN to LGN. If antibodies to ferret homologs of positive clones were available, we examined expression patterns in tissue sections using immunohistochemistry. Otherwise, we isolated ferret homologs using RT-PCR and examined expression patterns using in situ hybridization.
In total, 21 genes were found using three kinds of DNA chips. Of these 21 genes, the distribution patterns of five clones were consistent with the DNA chip data based on immunohistochemistry and/or in situ hybridization. These results suggest that cross-species DNA chip experiments can reliably detect a difference in mRNA expression levels, although their sensitivity and specificity are significantly less than same-species hybridization.
Immunohistochemistry. Animals at embryonic day 35 (E35), P0, P7, P16, and adult were deeply anesthetized and transcardially perfused with 4% paraformaldehyde. The thalamus was dissected out, cryoprotected by overnight immersion in 30% sucrose, and subsequently embedded in OCT compound. Floating 40 μm sections were permeabilized with 0.1% Triton X-100 in PBS and incubated overnight with primary antibodies. After incubation with FITC- or Cy3-conjugated secondary antibodies, the sections were washed and mounted on slides. For Islet1 immunostaining, fresh-frozen tissue was used instead of perfused tissue. Sections (14 μm thick) were attached to slides and fixed with 4% paraformaldehyde before immunohistochemical procedures. Primary antibodies included anti-Islet1 antibody (Developmental Studies Hybridoma Bank, University of Iowa, Iowa City, IA), anti-somatostatin antibody, and Cat-301 antibody (Chemicon, Temecula, CA). Experiments were repeated at least twice and gave consistent results.
In situ hybridization. RNA probes were synthesized using ferret genes that were used for constructing the microarray. Sections prepared from either fresh-frozen or perfused tissue were treated with 4% paraformaldehyde for 10 min, several concentrations of proteinase K for 10 min, and 0.25% acetic anhydride for 10 min. After prehybridization, the sections were incubated overnight at 58°C with digoxigenin- or fluorescein-labeled RNA probes diluted in hybridization buffer (50% formamide, 5× SSC, 5× Denhart's solution, 0.3 mg/ml yeast RNA, 0.1 mg/ml herring sperm DNA, and 1 mm DTT). The slides were washed at 72°C with 5× SSC twice and 0.2× SSC twice. The slides were incubated with alkaline phosphatase-conjugated antibody (Roche, Indianapolis, IN) and visualized using nitroblue-tetrazolium-chloride/5-bromo-4-chloro-3-indolyl-phosphate as substrates. In fluorescence in situ hybridization experiments, horseradish peroxidase-conjugated antibody (Roche) and tyramide signal amplification kits (Molecular Probes) were used for visualization. In the case of double staining using immunohistochemistry and in situ hybridization, immunohistochemistry was performed after in situ hybridization. Experiments were repeated at least twice and gave consistent results.
Cell measurements. To examine the size of cells labeled by putative Y cell markers, we made uncorrected measurements of the size of labeled and unlabeled neurons. After either in situ hybridization or Nissl staining of adult ferret LGN, soma area sizes of neurons with well-defined nuclei in a series of 14 μm thick fresh-frozen sections through the mediolateral extent of the adult LGN were measured using IPLab (Scanalytics, Fairfax, VA). Two LGNs from different ferrets were used for this analysis.
Results
To uncover molecules for which expression correlated with visual processing streams, we fabricated a custom ferret cDNA microarray using tissue derived from the neonatal LGN. We uncovered transcription factors for which unique distribution patterns differentiated the LGN from the PGN. We also identified two other sets of molecules, one identifying a specific physiological class of LGN neurons and the other identifying a specific group of local inhibitory neurons. Our analyses focused on the visual thalamus; however, many of the molecules described here were also expressed in other thalamic structures and in other brain regions.
Fabrication and validation of a custom-made ferret cDNA microarray
The visual system in the ferret is highly dynamic during the early postnatal period, suggesting that neonatal LGN cells express both regulatory and structural molecules. To assay the expression patterns of a large variety of molecules, we used neonatal (P16) ferret LGN tissue as the source material for a cDNA library. We then amplified cDNA inserts of 13,800 clones using PCR and printed the purified PCR products on microarray slides (see Materials and Methods).
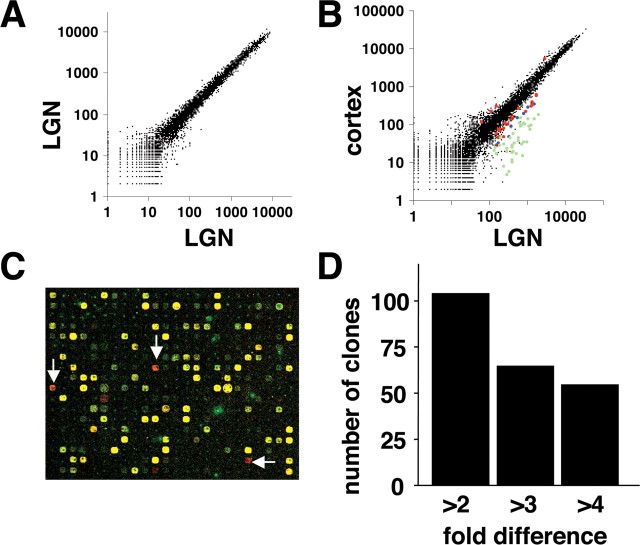
To examine the reproducibility of this ferret cDNA microarray, we compared mRNA expression profiles using the same ferret LGN RNA sample on multiple arrays (Fig. 1A). Based on our criteria, ∼3900 clones were labeled above background. In all experiments, each comparison was done twice with Cy3-Cy5 dye swapping. After one dye-swapping experiment, no clones consistently showed more than a twofold difference in signal intensity; 16 clones (0.12% of the printed clones) showed >1.5-fold difference. Thus, clones with more than a twofold difference are highly likely to have genuinely different expression levels in two different samples. Next, we compared mRNA expression profiles between the LGN and visual cortex using tissue from P16 ferrets (Fig. 1B,C), which we expected to show some differences. After one dye swap, 103 clones (0.74% of the printed clones), 64 clones (0.46%), and 54 clones (0.39%) showed more than twofold, threefold, and fourfold differences, respectively (Fig. 1D). These results indicate that our custom ferret cDNA microarray could reliably detect enriched transcripts. The clone identities and closest homologies of genes exhibiting more than twofold differences are provided in supplementary Table 1 (supplemental material, available at www.jneurosci.org).
Figure 1.
Fabrication and validation of a custom ferret cDNA microarray. A, Autocorrelation plot. Two samples derived from the same mRNA pool were separately labeled with Cy3 or Cy5 and then analyzed using the ferret microarray. After background signal intensities were subtracted, the mean signal intensities from all cDNA spots were plotted on log scales. B, Comparison of gene expression in the LGN and visual cortex at P16. Clone reproducibly exhibiting more than twofold differences are labeled with colors in the scattergram. Red, blue, and green indicate more than twofold, threefold, and fourfold differences, respectively. C, A false-color image of the ferret microarray. Red spots (arrows) indicate clones that are abundantly expressed in the LGN compared with visual cortex. D, The number of the clones that showed reproducible differences in expression between the LGN and visual cortex.
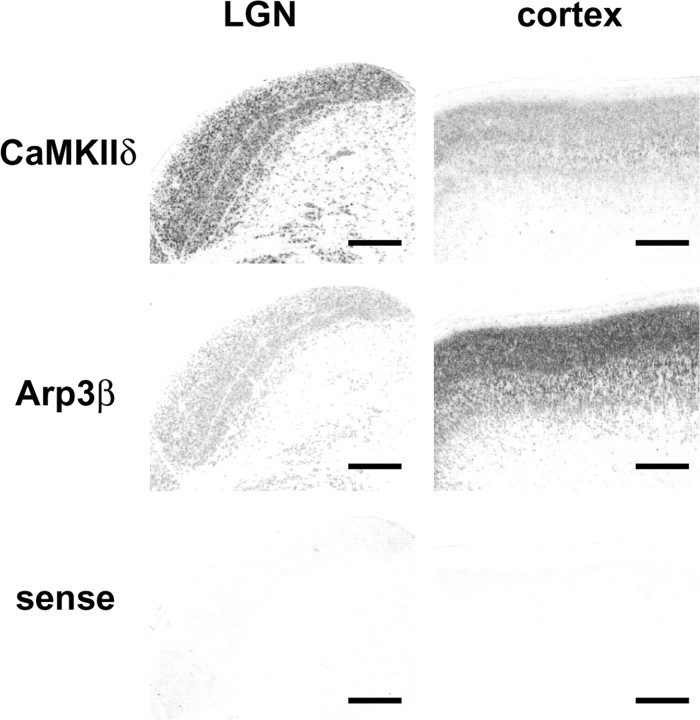
To validate the microarray results, we examined the expression of clones showing more than a twofold difference by in situ hybridization. The microarray data showed that calcium/calmodulin-dependent kinase II-δ (CaMKIIδ) was expressed twofold to threefold higher in the LGN than in visual cortex, whereas actin-related protein 3β (Arp3β) was fourfold to fivefold higher in visual cortex than in the LGN. In situ hybridization confirmed that CaMKIIδ is abundantly expressed in the LGN and more weakly expressed in visual cortex, whereas Arp3β expression was considerably higher in visual cortex than in the LGN (Fig. 2). Overall, 91% of the 43 clones examined by subsequent in situ hybridization showed results consistent with the microarray data.
Figure 2.
Validation of microarray data by in situ hybridization. Consistent with microarray data, in situ hybridization using P16 cortex and LGN shows that CaMKIIδ is abundantly expressed in the LGN and more weakly in visual cortex, whereas Arp3β expression was considerably greater in visual cortex compared with the LGN. Scale bars, 500 μm.
Molecules defining the LGN in the visual thalamus
Using sections of the ferret LGN, we first examined detailed expression patterns of the molecules more highly expressed in the LGN than in cortex. We also examined the expression patterns of cadherin family cell adhesion molecules and Zic family transcription factors. To correlate distribution patterns of genes with the layered structure of the LGN, we combined in situ hybridization with intra-ocular injection of fluorescent tracers to label distinct layers. The first class of molecules that we uncovered distinguished the LGN from the adjacent PGN. The PGN richly innervates the LGN with inhibitory connections and receives abundant cortical inputs but does not receive direct retinal inputs. Among the molecules differentially expressed at P16 were transcription factors Zic2, transcription factor 7-like 2 (TCF7L2/TCF-4), and odd homeobox1/homeobox only protein (Fig. 3A-D). Zic2 is a zinc finger transcription factor, which regulates cerebellar development and axon repulsion of retinal ganglion cells at the optic chiasm midline (Aruga et al., 2002; Herrera et al., 2003). In addition, cadherin11 and vesicular glutamate transporter 2 (vGluT2/DNPI) were also expressed in the LGN but were absent from the PGN (Fig. 3E,F). Cadherin11 is a member of cell adhesion molecules involved in distinguishing functionally related circuits in the brain and spinal cord (Redies and Takeichi, 1996; Price et al., 2002). These results suggest that the LGN and the PGN, which are interrelated but functionally different structures, have distinct molecular identities. Within the LGN, expression of odd homeobox1 was higher in A layers compared with C layers, whereas that of cadherin11 was higher in C layers (Fig. 3D,E). In carnivores, A and C layers contain relay neurons with distinct physiological features: X and Y cells are mainly located in the A layers, whereas W cells are present in the C layers. Thus, these molecules might cooperate to regulate cell fate determination and layer segregation within the LGN.
Figure 3.
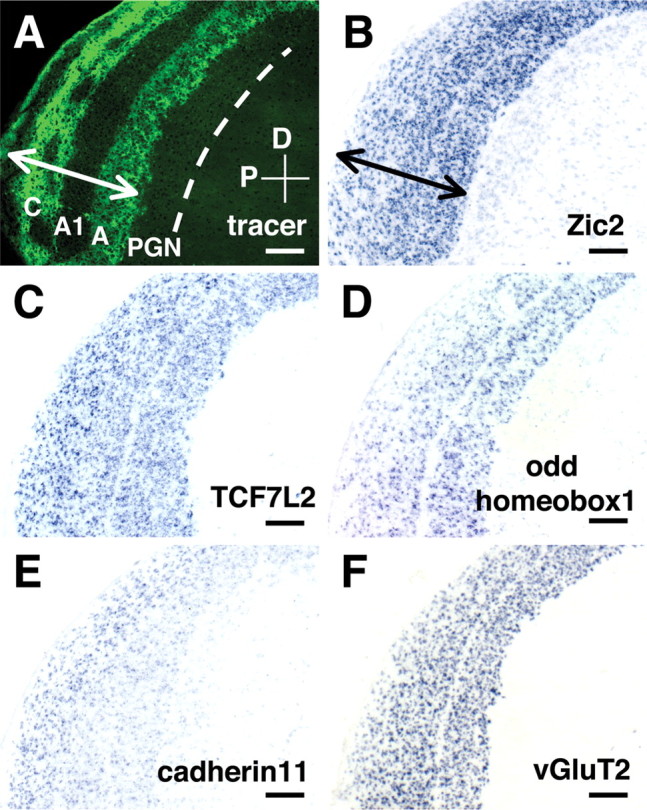
Molecules defining the LGN and its constituent layers. A, Distribution pattern of Alexa 488-conjugated CTB in the LGN. Alexa 488-CTB was injected into the contralateral eye at P14, and sagittal sections of the LGN were cut at P16. The A and C layers are labeled with Alexa 488-CTB, whereas layer A1, which receives input from the ipsilateral eye, is not. The arrow indicates the width of the LGN. A dashed line indicates the inner border of the PGN. D, Dorsal; P, posterior. B, In situ hybridization pattern of ferret Zic2 in the LGN using same section as in A. Zic2 was strongly expressed in the LGN (double-headed arrow) but not in the adjacent PGN. TCF7L2 (C), odd homeobox1 (D), cadherin11 (E), and vGluT2 (F) were also selectively expressed in the LGN but not in the PGN. The expression of odd homeobox1 was stronger in A layers, whereas that of cadherin11 was more evident in C layers. All sections are sagittal, and scale bars indicate 200 μm. All sections were derived from P16 ferret LGN except D, which is from a P25 animal.
Expression of transcription factors during development
Developmental changes in the organization of retinal ganglion axon terminals in the LGN have been widely investigated. In contrast, the early development of postsynaptic neurons in the LGN itself is much less well understood, in part because appropriate developmental markers for the developing LGN are unavailable. We sought to determine whether any of the LGN markers could be useful as such early markers. We focused in particular on the interval between E35 and P16, because important developmental events, such as the segregation of retinal axons from the ipsilateral and contralateral retinas, occur during this period. Transcription factors Zic2 and TCF7L2 were expressed in the LGN from P0 to adulthood (Fig. 4) (data not shown). Similarly, odd homeobox1, cadherin11, and vGluT2 were also expressed in the adult LGN (data not shown). At E35, the expression patterns of Zic2 and TCF7L2 are consistent with their expression being limited to the LGN (Fig. 4) (data not shown), although we cannot exclude the possibility that some PGN cells express these molecules, because the border between the LGN and the PGN is less clear at E35. These results indicate that Zic2 and TCF7L2 consistently label the LGN region during development beginning no later than E35. Thus, these molecules might be involved in early regional specification, differentiation, and/or maintenance of the LGN.
Figure 4.
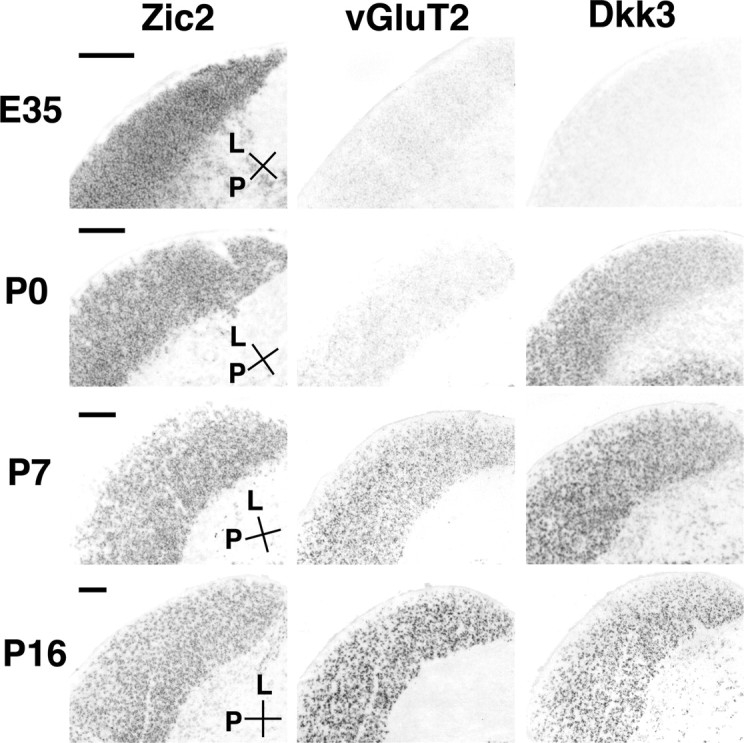
Early developmental expression of Zic2, a transcription factor. Using horizontal sections of E35, P0, P7, and P16 LGN, expression patterns of ferret Zic2, vGluT2, and Dkk3 mRNA were examined. Expression of Zic2 was evident as early as E35 and remained throughout development. In contrast, expressions of vGluT2 and Dkk3 were absent at E35 and became detectable at P7 and P0, respectively. Expression of Dkk3 was observed in both the LGN and PGN. L, Lateral; P, posterior. Scale bars, 200 μm.
In contrast to Zic2, vGluT2 and Dickkopf homolog 3 (Dkk3) were initially absent at E35 and appeared later (Fig. 4). Because vGluT is important for glutamatergic neurotransmission, this suggests that neurotransmitter specification in the LGN is well underway by P7. Expression of the secreted molecule Dkk3 was first observed at P0 in the LGN (Fig. 4). Dkk3 belongs to a class of signaling molecules that inhibit wnt signaling and are involved in neuronal patterning during development. At P16, Dkk3 was expressed in both the LGN and PGN.
An early marker of the Y cell pathway
In carnivores, X cells and Y cells are primarily intermingled in the LGN. To identify molecules that specifically label X cells or Y cells, we sought molecules abundantly expressed in the A layers, because X cells and Y cells reside almost exclusively in the these layers (Sherman and Guillery, 2001). After labeling retinal ganglion cell axons with fluorescent anterograde tracers, we micro-dissected the LGN under a fluorescence microscope to isolate tissue samples from the A layers, C layers, and the PGN. We then compared the mRNA profiles of these samples using our microarray (supplemental material, available at www.jneurosci.org). We found that a neuron-specific protein, Purkinje cell protein 4/PEP19 (PCP4), was strongly expressed in the LGN but not in the PGN (Fig. 5A). Because PCP4 was mainly expressed in A layers and was confined to a small subset of LGN cells (Fig. 6, compare PCP4 and Zic2), we reasoned that PCP4 might be differentially expressed in X and Y cells.
Figure 5.
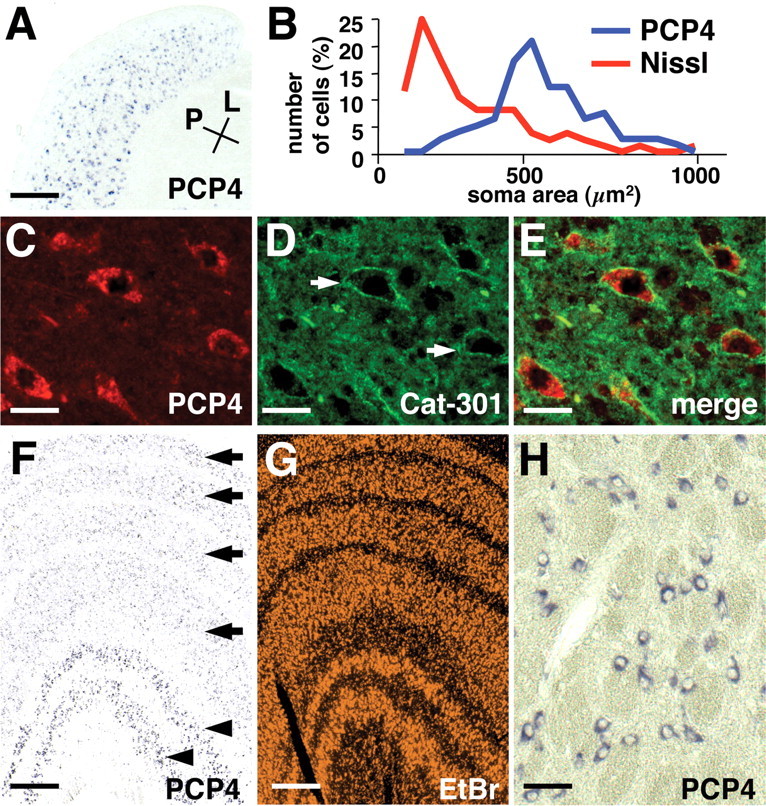
Expression of PCP4 in Y cells in the LGN. A, Expression of PCP4 mRNA in a horizontal section of the adult ferret LGN. PCP4-positive cells are abundant in A layers and less frequent in C layers. Conventions are as in Figure 3. Scale bar, 400 μm. B, The soma area of PCP4-positive cells (blue) and cells stained for Nissl substance (red) in the adult ferret LGN. C-E, Colocalization of PCP4 mRNA and Cat-301 immunoreactivity in the adult ferret LGN. LGN sections were double stained with in situ hybridization using a PCP4 probe (C) and immunohistochemistry using Cat-301 antibody (D). As reported previously, Cat-301 antibody recognizes perineuronal nets (arrows) of Y cells (D). PCP4-positive cells were surrounded by Cat-301-immunoreactive perineuronal nets (E). Scale bars: C-E, 30 μm. F, Expression of PCP4 mRNA in adult (2-3 years of age) macaque LGN revealed by in situ hybridization. PCP4 was strongly expressed in the magnocellular layers (arrowheads) but only weakly in the parvocellular layers (arrows). G, Ethidium bromide staining of the macaque LGN showing six layered structures. Scale bars: F, G, 400 μm. H, High-magnification view of PCP4-positive cells in the magnocellular layers in the macaque LGN. Scale bar, 50 μm.
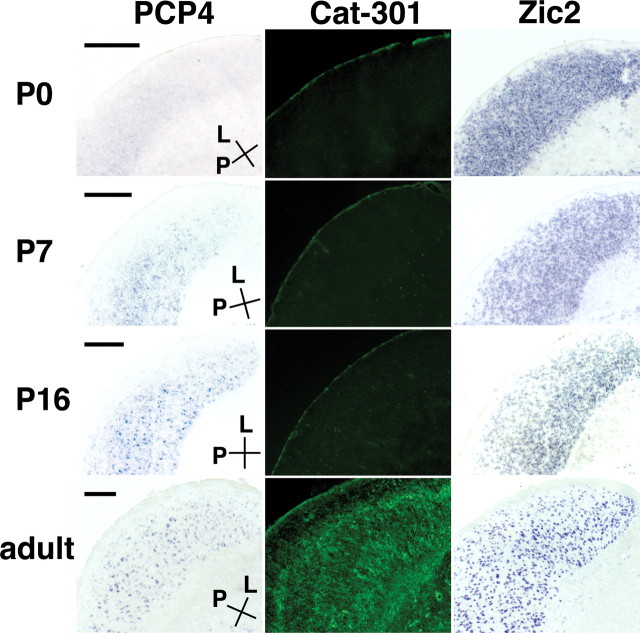
Figure 6.
Early developmental expression of PCP4. Horizontal LGN sections derived from P0, P7, P16, and adult animals were used to determine expression of PCP4 mRNA and Cat-301 immunoreactivity. Consistent with previous reports, Cat-301-positive cells were observed only in the adult LGN. In contrast, PCP4 expression appeared by P7, became more obvious at P16, and was sustained in adulthood. PCP4 expression followed that of transcription factor Zic2, suggesting that Y cell specification follows regional specification of the LGN during development. Conventions are as in Figure 3. Scale bars, 300 μm.
Because Y cells have the largest somata in the LGN, we measured the soma area of cells clearly positive for PCP4 in the adult ferret LGN and compared that to the soma area of cells stained for Nissl substance (Fig. 5B). The mean area of PCP4-positive cells was significantly larger than the average size of LGN cells (561 ± 147, n = 84, vs 346 ± 160 μm2, n = 91; t test, p < 0.001). We next took advantage of the observation that monoclonal antibody Cat-301 labels perineuronal nets of Y cells in the adult LGN (Hockfield and Sur, 1990). Double-labeling experiments using Cat-301 antibody and in situ hybridization for PCP4 revealed that almost all (91 ± 2.2%; n = 68) of PCP4-positive cells were also Cat-301 positive, and almost all (92 ± 5.9%; n = 74) Cat-301-positive cells expressed PCP4 (Fig. 5C-E). These results are consistent with the idea that PCP4 is primarily expressed in Y cells in the ferret LGN.
To further establish the relationship between PCP4 expression and the Y cell pathway, we isolated the monkey ortholog of PCP4 and examined the distribution pattern in the macaque LGN, in which Y cells are segregated into the magnocellular layers. Consistent with this, strongly labeled PCP4-positive cells were located exclusively in the magnocellular layers, whereas the parvocellular layers were only weakly stained (Fig. 5F-H). Thus, the evidence from ferrets and primates demonstrates the expression of PCP4 in Y cells.
It is unknown when X and Y cell types are specified during development. Cat-301 immunoreactive cells are found only late in development in the cat (Sur et al., 1988) and the ferret (Fig. 6). Electrophysiological experiments showed that some cells in the cat LGN can be classified as Y cells as early as 8 weeks after birth (Mangel et al., 1983), which corresponds to 12 weeks after birth in the ferret. We used PCP4 expression as a marker for the emergence of the Y cell phenotype and found that PCP4 expression began as early as P7 (Fig. 6), which corresponds to E49 in the cat. Together with our data that glutamatergic specification occurs as early as P7 (Fig. 4), these results indicate that the early postnatal period may be a particularly important window during which postsynaptic cell type specification emerges.
A distinct set of molecules specifying the PGN
The visual thalamus contains two groups of local inhibitory neurons, PGN neurons and LGN interneurons. The visual thalamus has two fundamental relay response modes, burst and tonic, and local inhibitory neurons are involved in switching between these two modes (Guido et al., 1992; Kim et al., 1997; Sherman and Guillery, 2004). However, the molecular distinctions between these two inhibitory neuron classes are not known. We therefore searched for molecules selectively expressed in PGN inhibitory neurons. Because our ferret microarray was derived from mRNA expressed in LGN tissue and did not include the PGN, we used cross-species hybridization screening on commercially available mouse or human DNA chips (see Materials and Methods) and compared mRNA expression profiles between the LGN and the PGN (supplemental material, available at www.jneurosci.org). In addition, we also examined expression patterns of cadherins in the PGN.
The homeobox transcription factors Islet1 and Six3 were strongly expressed in the PGN (Fig. 7, A-D). Homeobox transcription factors play important roles in neural development such as spinal motor neuron specification (Tanabe and Jessell, 1996). Interestingly, although the LGN contains a significant number of GABAergic interneurons and both inhibitory neurons in the LGN and the PGN make local inhibitory connections to LGN relay neurons, there was almost no expression of Islet1 in the LGN, suggesting that these two inhibitory neurons have distinct molecular profiles. A few Islet1-positive cells were also found in the LGN (Fig. 7D). Our preliminary data indicated that these Islet1-positive cells in the LGN tend to be located in the interlaminar zone. A small population of LGN interneurons has been shown to physiologically resemble PGN neurons rather than other LGN interneurons (Sanchez-Vives et al., 1996), and Islet1-positive cells in the LGN might correspond to this subpopulation of LGN interneurons. Islet1 expression was found as early as P0 and was maintained until adulthood (Fig. 8) (data not shown), suggesting that Islet1 is involved in both PGN differentiation and maintenance. In addition, Islet1 and Six3 were expressed not only in the PGN but also in the thalamic reticular nucleus (Fig. 7G,H), raising the possibility that Islet1 and Six3 are expressed in cells derived from the ventral thalamus.
Figure 7.
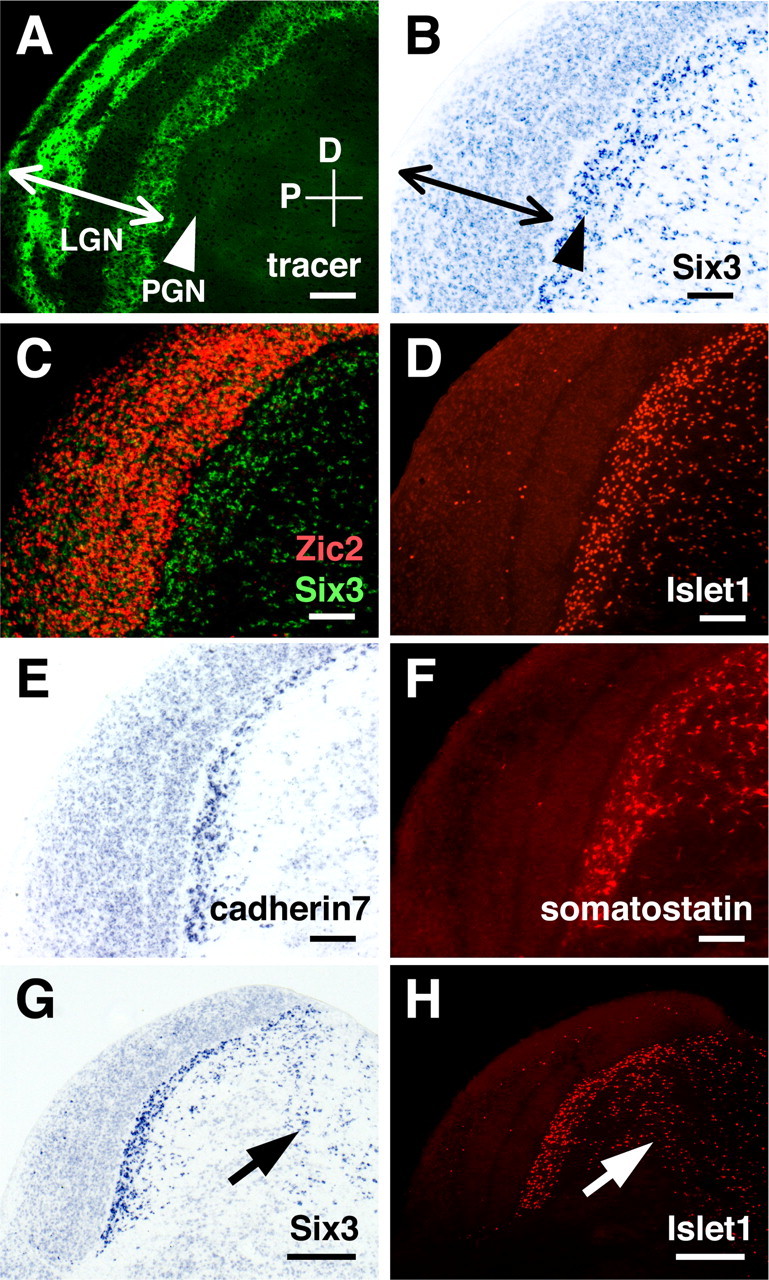
Molecules specifying the PGN. All sections are sagittal and derived from P16 ferret visual thalamus. A, Distribution pattern of Alexa 488-CTB in sagittal LGN sections. The arrowhead and arrow indicate the positions of the PGN and the LGN, respectively. Alexa 488-CTB was injected into the contralateral eye at P14, and sagittal sections of the LGN were made at P16. Conventions are as in Figure 2. B, In situ hybridization pattern of ferret Six3 in the LGN using the same section as A. Six3 was strongly expressed in the PGN but only weakly in the LGN. C, An overlay false-color image of in situ hybridization using Zic2 (red) and Six3 (green) probes. Expression patterns of Zic2 and Six3 were examined using adjacent sections and then merged. Islet1 (D), cadherin7 (E), and somatostatin (F) were also expressed heavily and almost exclusively in the PGN. Sections were stained either with anti-Islet1 antibody, ferret cadherin7 probe, or anti-somatostatin antibody. Note that a few positive cells were located within the LGN (D, F). Although the number of cadherin7-positive cells seems less than that of Islet1-positive cells (D, E), this is because of the positional difference of the sections within the visual thalamus. Scale bars: A-F, 200 μm. Low-magnification views of Six3 (G) and Islet1 (H) expression patterns. The arrows indicate positive cells in the thalamic reticular nucleus. Scale bars: G, H, 400 μm.
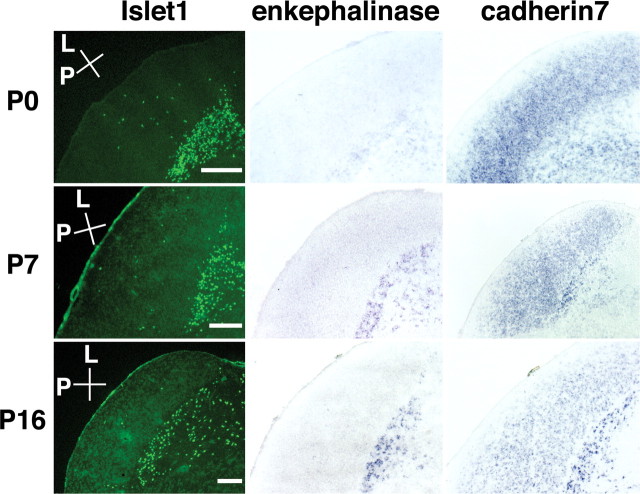
Figure 8.
Developmental regulation of the expression patterns in the PGN. Horizontal sections of P0, P7, and P16 LGN were stained with either anti-Islet1 antibody, ferret enkephalinase probe, or cadherin7 probe. The expression of Islet1 was evident as early as P0 and stable until adulthood (data not shown). Enkephalinase was first detectable at P7, and its expression was sustained until adulthood (data not shown). In contrast, following an initially diffuse pattern of expression, the expression of cadherin7 in the LGN gradually decreased, whereas that in the PGN increased. Conventions are as in Figure 3. Scale bars, 200 μm.
Cadherin7, enkephalinase, and somatostatin were also abundantly expressed in the PGN (Figs. 7E,F, 8). The expression of somatostatin in the PGN is consistent with a previous report that somatostatin is expressed in the thalamic reticular nucleus in the adult cat (Oertel et al., 1983). In contrast to the stable expression pattern of Islet1 during development, the expression pattern of cadherin7 became increasingly restricted (Fig. 8). At P0, cadherin7 was expressed in both the LGN and the PGN. After P7, cadherin7 expression in the LGN gradually decreased, whereas expression in the PGN increased (Fig. 8). Because expression levels of cadherins determine their binding selectivity, this change in cadherin7 expression, in cooperation with cadherin11 expression in the LGN, might be involved in the functional segregation of the LGN and the PGN. Neither enkephalinase nor somatostatin was evident at P0, but both appeared by P7 (Fig. 8) (data not shown). Because enkephalinase regulates peptide hormone cleavage, this increase in expression level might reflect maturation of PGN neurons.
Discussion
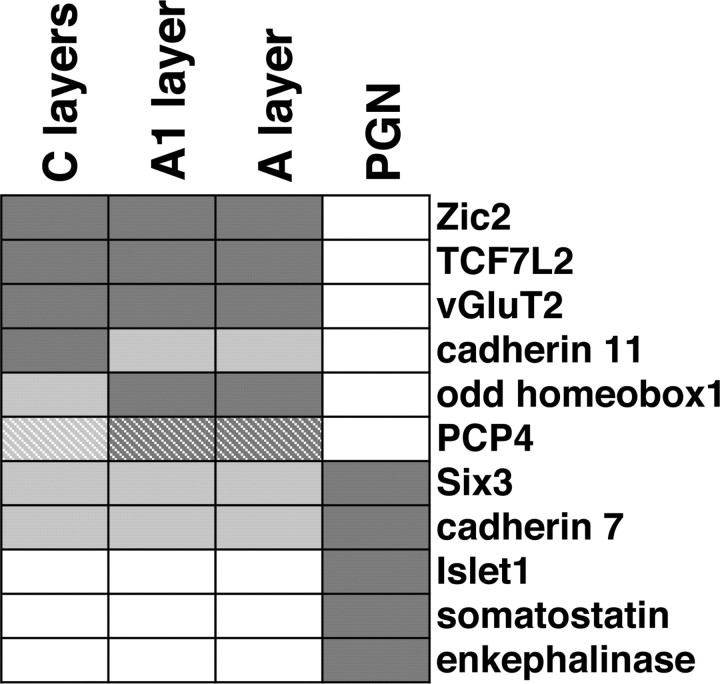
Using a combination of custom and commercial microarrays and in situ hybridization, we produced a picture of the spatial and temporal molecular organization of the ferret visual thalamus (Fig. 9). These molecules, acting in a combinatorial manner, could control specification, differentiation, and functions at the levels of the nucleus, its constituent layers, and physiological streams.
Figure 9.
Differential expression patterns define functional structures in the visual thalamus. A summary of expression patterns that define the LGN, PGN, and functional subclasses of the LGN is shown. Dark shading indicates strong expression, whereas white represents no expression. The hatched fill indicates that subpopulations of the cells are positive.
PCP4 is an early marker for Y cells
PCP4 binds to calmodulin via an IQ motif and can regulate CaMKII activity (Johanson et al., 2000); it has also been implicated in the pathogenesis of Down syndrome (Chen et al., 1996). However, the roles of PCP4 in the nervous system are unknown. In both carnivores and primates, PCP4 was mainly expressed in the Y (magnocellular) stream in the LGN. The early onset of the PCP4 expression during development suggests that the physiological streams in the LGN are already differentiated shortly after birth in the ferret. LGN relay neurons send their axons to layer 4 in the primary visual cortex after birth and make synapses with layer 4 neurons at P12-P20 in the ferret (Herrmann et al., 1994). Because X cells and Y cells project to distinct sublayers in layer 4 (Sherman and Guillery, 2001), X/Y specification should be completed before neurons begin forming synapses in layer 4. The early onset of the PCP4 expression is consistent with this idea. In addition, although specification of magnocellular-parvocellular streams in the LGN probably involves activity-independent molecular mechanisms (see Introduction), we cannot exclude the possibility that the specification of Y cells is modulated by their input, because the onset of the earliest Y cell marker PCP4 expression does not precede layer-specific sorting of retinal ganglion cell axons in the LGN.
Two monoclonal antibodies, Cat-301 and SMI-32, recognize Y cells in the adult LGN (Hendry et al., 1984; Bickford et al., 1998). However, because their binding specificity and immunostaining patterns are significantly affected by post-translational modification (i.e., glycosylation for Cat-301 and phosphorylation for SMI-32) (Sternberger and Sternberger, 1983; Matthews et al., 2002), these antigens are not suitable for transgenic approaches to selectively label Y cells in the LGN. In contrast, we have shown that PCP4 mRNA is mainly expressed in Y cells in the LGN, suggesting that PCP4 gene could prove useful for the labeling of Y cells and for promoter analysis for Y cell-specific gene expression patterns. It may also prove useful for developing reagents to selectively inactivate this visual channel.
Inhibitory neurons in the visual thalamus
The ferret visual thalamus contains two major groups of local inhibitory neurons, PGN neurons and LGN interneurons. We have shown that molecular profiles of these two inhibitory neurons are distinct. Although both PGN neurons and LGN interneurons provide local, GABAergic inhibitory input to LGN relay neurons, there are at least two differences in their synaptic connections (Sherman and Guillery, 2004): only LGN interneurons have dendritic appendages that are presynaptic to LGN relay neurons, and PGN neurons do not receive synaptic contacts from RGC axons. Thus, Islet1 and Six3 transcription factors and cadherin7 cell adhesion molecule might be involved in this specification of neuronal connectivity.
Compared with their synaptic connections, the functional differences between these two neuronal classes are less clear. Pharmacological manipulation of GABAergic transmission affects inhibitory connections from both PGN neurons and LGN interneurons. Therefore, combining transgenic techniques using PGN-specific promoter regions with pharmacological manipulation might be useful for additional analysis of the functional significance and differences between PGN neurons and LGN interneurons.
Molecular analysis of the ferret visual thalamus
We proposed that the emergence of ocular dominance columns in the visual cortex might rely on eye-specific molecular cues present in the cortex, the LGN, or both (Crowley and Katz, 2000). One possible correlate of this sort of molecular specification could be the expression of distinct genes in the A and A1 layers. In this screening, we did not detect genes with this pattern of expression. There are several possible reasons for this. First, the molecular differences between A and A1 could exist in the form of gradients, evidence for which would be difficult to determine using microarrays. Second, eye-specific determination might occur substantially earlier than P16, the age we chose for this screening; putative eye-specific molecules might be expressed only transiently. Third, although we screened >8000 independent clones, which probably correspond to ∼20% of total genes in ferrets, putative eye-specific molecules might not be included in our cDNA pool. Finally, such molecules might not exist, although recent evidence for the molecular specification of motor neuron pools (Tanabe and Jessell, 1996) and of LGN layers themselves (A. D. Huberman and B. Chapman, personal communication) argues against this.
Previously, CaMKIIα and calbindin-28k were reported to be expressed in a koniocellular stream in the monkey LGN (Hendry and Calkins, 1998). Although monkeys have highly developed visual system including a six-layered LGN, there are substantial obstacles to their use in molecular biology experiments. In mice, an LIM (Lin-11, Isl-1, and Mec-3)-homeodomain transcription factor Lhx9 is expressed in the LGN, although its detailed expression pattern within the LGN is unclear (Nakagawa and O'Leary, 2001). Because the mouse LGN is small and lacks layers, it is difficult to correlate molecular expression patterns with functional streams. In contrast, the ferret has a highly developed visual system, which has been extensively analyzed electrophysiologically and morphologically. Furthermore, the ferret's altricial development and larger brain allow ready access to sufficient tissue for molecular screening experiments and in situ hybridization. Although bioinformatics data on the ferret are limited, our results indicate that molecular analysis using the ferret is a useful approach to investigate molecular organization of developing brain structures. Recently, a transgenic technique using lentivirus vectors was reported, which should allow creation of transgenic ferrets (Lois et al., 2002). This, combined with an understanding of the molecular organization of the thalamus, may open the door for exploring of the molecular mechanisms underlying development and physiological functions of the visual thalamus.
Footnotes
L.C.K. is an Investigator at the Howard Hughes Medical Institute. We thank Andrew D. Huberman and Leo M. Chalupa (University of California, Davis, Davis, CA) for providing monkey tissue. We are grateful to David Fitzpatrick for critical reading of this manuscript, Hiroaki Matsunami for technical suggestions, Marguerita Klein and Maulik Patel for their technical assistance, and Katz laboratory members for their support.
Correspondence should be addressed to Hiroshi Kawasaki, Department of Molecular and System Neurobiology, Graduate School of Medicine, the University of Tokyo, Tokyo 113-0033, Japan. E-mail: kawasaki@m.u-tokyo.ac.jp.
J. C. Crowley's present address: Department of Biological Sciences, Center for the Neural Basis of Cognition, Carnegie Mellon University, Pittsburgh, PA 15213.
Copyright © 2004 Society for Neuroscience 0270-6474/04/249962-09$15.00/0
References
- Aruga J, Inoue T, Hoshino J, Mikoshiba K (2002) Zic2 controls cerebellar development in cooperation with Zic1. J Neurosci 22: 218-225. [DOI] [PMC free article] [PubMed] [Google Scholar]
- Bickford ME, Guido W, Godwin DW (1998) Neurofilament proteins in Y-cells of the cat lateral geniculate nucleus: normal expression and alteration with visual deprivation. J Neurosci 18: 6549-6557. [DOI] [PMC free article] [PubMed] [Google Scholar]
- Brunso-Bechtold JK, Florence SL, Casagrande VA (1983) The role of retinogeniculate afferents in the development of connections between visual cortex and the dorsal lateral geniculate nucleus. Brain Res 312: 33-39. [DOI] [PubMed] [Google Scholar]
- Butler AB, Hodos W (1996) Visual forebrain in amniotes. In: Comparative vertebrate neuroanatomy, pp 380-395. New York: Wiley.
- Carden WB, Guido W, Ziburkus J, Datskovskaia A, Godwin DW, Bickford ME (2000) A novel means of Y cell identification in the developing lateral geniculate nucleus of the cat. Neurosci Lett 295: 5-8. [DOI] [PubMed] [Google Scholar]
- Chen H, Bouras C, Antonarakis SE (1996) Cloning of the cDNA for a human homolog of the rat PEP-19 gene and mapping to chromosome 21q22.2-q22.3. Hum Genet 98: 672-677. [DOI] [PubMed] [Google Scholar]
- Crowley JC, Katz LC (2000) Early development of ocular dominance columns. Science 290: 1321-1324. [DOI] [PubMed] [Google Scholar]
- DeYoe EA, Van Essen DC (1988) Concurrent processing streams in monkey visual cortex. Trends Neurosci 11: 219-226. [DOI] [PubMed] [Google Scholar]
- Felleman DJ, Van Essen DC (1991) Distributed hierarchical processing in the primate cerebral cortex. Cereb Cortex 1: 1-47. [DOI] [PubMed] [Google Scholar]
- Guido W, Lu SM, Sherman SM (1992) Relative contributions of burst and tonic responses to the receptive field properties of lateral geniculate neurons in the cat. J Neurophysiol 68: 2199-2211. [DOI] [PubMed] [Google Scholar]
- Guillery RW, LaMantia AS, Robson JA, Huang K (1985) The influence of retinal afferents upon the development of layers in the dorsal lateral geniculate nucleus of mustelids. J Neurosci 5: 1370-1379. [DOI] [PMC free article] [PubMed] [Google Scholar]
- Hendry SH, Calkins DJ (1998) Neuronal chemistry and functional organization in the primate visual system. Trends Neurosci 21: 344-349. [DOI] [PubMed] [Google Scholar]
- Hendry SH, Reid RC (2000) The koniocellular pathway in primate vision. Annu Rev Neurosci 23: 127-153. [DOI] [PubMed] [Google Scholar]
- Hendry SH, Hockfield S, Jones EG, McKay R (1984) Monoclonal antibody that identifies subsets of neurones in the central visual system of monkey and cat. Nature 307: 267-269. [DOI] [PubMed] [Google Scholar]
- Herrera E, Brown L, Aruga J, Rachel RA, Dolen G, Mikoshiba K, Brown S, Mason CA (2003) Zic2 patterns binocular vision by specifying the uncrossed retinal projection. Cell 114: 545-557. [DOI] [PubMed] [Google Scholar]
- Herrmann K, Antonini A, Shatz CJ (1994) Ultrastructural evidence for synaptic interactions between thalamocortical axons and subplate neurons. Eur J Neurosci 6: 1729-1742. [DOI] [PubMed] [Google Scholar]
- Hockfield S, Sur M (1990) Monoclonal antibody Cat-301 identifies Y-cells in the dorsal lateral geniculate nucleus of the cat. J Comp Neurol 300: 320-330. [DOI] [PubMed] [Google Scholar]
- Johanson RA, Sarau HM, Foley JJ, Slemmon JR (2000) Calmodulin-binding peptide PEP-19 modulates activation of calmodulin kinase II in situ J Neurosci 20: 2860-2866. [DOI] [PMC free article] [PubMed] [Google Scholar]
- Kim U, Sanchez-Vives MV, McCormick DA (1997) Functional dynamics of GABAergic inhibition in the thalamus. Science 278: 130-134. [DOI] [PubMed] [Google Scholar]
- Livingstone MS, Hubel DH (1987) Psychophysical evidence for separate channels for the perception of form, color, movement, and depth. J Neurosci 7: 3416-3468. [DOI] [PMC free article] [PubMed] [Google Scholar]
- Lois C, Hong EJ, Pease S, Brown EJ, Baltimore D (2002) Germline transmission and tissue-specific expression of transgenes delivered by lentiviral vectors. Science 295: 868-872. [DOI] [PubMed] [Google Scholar]
- Mangel SC, Wilson JR, Sherman SM (1983) Development of neuronal response properties in the cat dorsal lateral geniculate nucleus during monocular deprivation. J Neurophysiol 50: 240-264. [DOI] [PubMed] [Google Scholar]
- Matthews RT, Kelly GM, Zerillo CA, Gray G, Tiemeyer M, Hockfield S (2002) Aggrecan glycoforms contribute to the molecular heterogeneity of perineuronal nets. J Neurosci 22: 7536-7547. [DOI] [PMC free article] [PubMed] [Google Scholar]
- Maunsell JH (1992) Functional visual streams. Curr Opin Neurobiol 2: 506-510. [DOI] [PubMed] [Google Scholar]
- Meissirel C, Wikler KC, Chalupa LM, Rakic P (1997) Early divergence of magnocellular and parvocellular functional subsystems in the embryonic primate visual system. Proc Natl Acad Sci USA 94: 5900-5905. [DOI] [PMC free article] [PubMed] [Google Scholar]
- Nakagawa Y, O'Leary DD (2001) Combinatorial expression patterns of LIM-homeodomain and other regulatory genes parcellate developing thalamus. J Neurosci 21: 2711-2725. [DOI] [PMC free article] [PubMed] [Google Scholar]
- Oertel WH, Graybiel AM, Mugnaini E, Elde RP, Schmechel DE, Kopin IJ (1983) Coexistence of glutamic acid decarboxylase- and somatostatin-like immunoreactivity in neurons of the feline nucleus reticularis thalami. J Neurosci 3: 1322-1332. [DOI] [PMC free article] [PubMed] [Google Scholar]
- Price SR, De Marco Garcia NV, Ranscht B, Jessell TM (2002) Regulation of motor neuron pool sorting by differential expression of type II cadherins. Cell 109: 205-216. [DOI] [PubMed] [Google Scholar]
- Rakic P (1981) Development of visual centers in the primate brain depends on binocular competition before birth. Science 214: 928-931. [DOI] [PubMed] [Google Scholar]
- Redies C, Takeichi M (1996) Cadherins in the developing central nervous system: an adhesive code for segmental and functional subdivisions. Dev Biol 180: 413-423. [DOI] [PubMed] [Google Scholar]
- Sanchez-Vives MV, Bal T, Kim U, von Krosigk M, McCormick DA (1996) Are the interlaminar zones of the ferret dorsal lateral geniculate nucleus actually part of the perigeniculate nucleus? J Neurosci 16: 5923-5941. [DOI] [PMC free article] [PubMed] [Google Scholar]
- Sherman SM, Guillery RW (2001) The nerve cells of the thalamus. In: Exploring the thalamus, pp 19-58. San Diego: Academic Press.
- Sherman SM, Guillery RW (2004) Thalamus. In: The synaptic organization of the brain, Ed 5 (Shepherd GM, ed), pp 311-359. New York: Oxford UP.
- Sherman SM, Spear PD (1982) Organization of visual pathways in normal and visually deprived cats. Physiol Rev 62: 738-855. [DOI] [PubMed] [Google Scholar]
- Sternberger LA, Sternberger NH (1983) Monoclonal antibodies distinguish phosphorylated and nonphosphorylated forms of neurofilaments in situ Proc Natl Acad Sci USA 80: 6126-6130. [DOI] [PMC free article] [PubMed] [Google Scholar]
- Sur M, Frost DO, Hockfield S (1988) Expression of a surface-associated antigen on Y-cells in the cat lateral geniculate nucleus is regulated by visual experience. J Neurosci 8: 874-882. [DOI] [PMC free article] [PubMed] [Google Scholar]
- Tanabe Y, Jessell TM (1996) Diversity and pattern in the developing spinal cord. Science 274: 1115-1123. [DOI] [PubMed] [Google Scholar]


