

Abstract
To visualize clathrin redistribution during endocytosis in hippocampal boutons, we used a fusion protein of clathrin light chain with enhanced green fluorescent protein. Both high potassium and electric field stimulation lead after a stimulus-dependent delay to a transient increase of fluorescence in synapses, but a slight and transient decrease in adjacent axonal segments. We conclude that the rise and fall of the signal in boutons, with decay kinetics remarkably similar to previous estimates of the endocytic time course, reflects coat assembly and disassembly. Thus, we could selectively measure clathrin-mediated endocytosis and separate its kinetics from other modes of membrane retrieval in CNS synapses. A long-lasting delay preceding the fluorescent transients shows that endocytosis during the first few seconds of continuing stimulation cannot be mediated by newly formed clathrin-coated pits. Therefore, a fast mode of endocytosis is either clathrin-independent or involves preassembled (easily retrievable) clathrin lattices at sites of endocytosis.
Keywords: clathrin, endocytosis, hippocampal synapses, EGFP, vesicle recycling, imaging, synaptic transmission
Introduction
Various modes of synaptic vesicle recycling have been proposed. A fast “kiss-and-run” mechanism, in which the vesicle connects only briefly to the plasma membrane without full collapse (Ceccarelli et al., 1973; Koenig et al., 1998; Aravanis et al., 2003; Gandhi and Stevens, 2003), a slow pathway via large infoldings and endosomes (Takei et al., 1996), and recovery of vesicle membrane by clathrin-coated pits (Heuser and Reese, 1973; Pearse, 1976; Shupliakov et al., 1997). The molecular events involved in these kinetically distinct modes, however, remain unclear.
After neurotransmitter release, clathrin-mediated endocytosis is thought to be the major pathway for synaptic vesicle recycling (Heuser and Reese, 1973; Brodin et al., 2000; Brodsky et al., 2001). It can be separated into several spatially distinct steps. The recruitment of clathrin from the cytosol, binding to the plasma membrane, subsequent invagination and fission of clathrin-coated vesicles from the membrane, and finally disassembly of the coat in the cytosol (Cremona and De Camilli, 1997; Gundelfinger et al., 2003).
The first reconstruction of the time course of clathrin-mediated endocytosis was obtained from electron micrographs (Miller and Heuser, 1984). Using a genetically encoded fluorescent probe consisting of enhanced green fluorescent protein (EGFP) and either clathrin light chain (Gaidarov et al., 1999) or clathrin heavy chain (Damer and O'Halloran, 2000), it was possible to visualize the clathrin dynamics of constitutive endocytosis. Evanescent field fluorescence microscopy allowed studying the formation, fission, as well as the movement of single clathrin-coated vesicles away from the membrane (Merrifield et al., 2002). By expressing clathrin-EGFP in hippocampal neurons, Blanpied et al. (2002) recently could image single coated pits in dendrites and spines at low expression levels.
Most of our knowledge of the kinetics of stimulated endocytosis in synaptic boutons comes from experiments using the fluorescent vesicle marker FM1-43 (Ryan et al., 1993, 1996; Wu and Betz, 1996; Klingauf et al., 1998; Aravanis et al., 2003) and synapto-pHluorin, a fusion construct of the vesicle protein synaptobrevin/VAMP-2 with a highly pH-sensitive GFP variant (Miesenbock et al., 1998; Sankaranarayanan and Ryan, 2000; Gandhi and Stevens, 2003). However, neither technique allows distinguishing between different molecular mechanisms of membrane retrieval.
Here we report on real-time measurements of synaptic clathrin-mediated endocytosis. Stimulation of hippocampal neurons overexpressing a fusion construct of clathrin light chain a (LCa1) with EGFP leads to a transient accumulation of EGFP-LCa1 in synaptic boutons accompanied by a slight transient decrease in adjacent axonal segments. We show that this redistribution is fast enough for faithfully tracking the time course of clathrin-mediated endocytosis. We find that endocytosis during the first few seconds of continuing stimulation cannot be mediated by newly formed clathrin-coated pits, as evidenced by a long delay of >10 sec preceding the fluorescent transients. Thus, our results are consistent with a kiss-and-run mechanism for fast endocytosis (Sun et al., 2002; Aravanis et al., 2003; Gandhi and Stevens, 2003). Alternatively, the synapse might capitalize on preassembled “easily retrievable” clathrin lattices on the membrane to sustain an early rapid phase of endocytosis.
Materials and Methods
Cloning of EGFP-tagged clathrin light chain construct. Rat clathrin light chain (LCa1) was amplified by PCR from hippocampal cDNA. The forward primer contained additional nucleotides at the 5′ end coding for five alanine residues representing the linker between EGFP and LCa1. After restriction with endonucleases XhoI and KpnI, the PCR product was ligated into the pEGFP-C3 expression plasmid (Clontech, Palo Alto, CA) restricted with the same endonucleases.
EGFP-LCa1 was removed from the vector with NheI and KpnI, the ends were filled in with T4 DNA polymerase, and the fragment was ligated into SmaI-digested Semliki-Forest virus expression plasmid pSFV1 (Invitrogen, Bethesda, MD). Production of EGFP-LCa1 encoding SFV particles was performed as described (Ashery et al., 1999).
Immunocytochemistry in human embryonic kidney 293 cells. Human embryonic kidney (HEK) 293 cells grown on coverslips to ∼80% confluence were transiently transfected with 1 μg of EGFP-LCa1 with Lipofectamine according to the manufacturer's recommendations (Invitrogen). At 18-24 hr later, the cells were fixed in 4% formaldehyde for 30 min at room temperature. After washing in 1× PBS containing 100 mm glycine, cells were blocked and permeabilized in 1× PBS containing 2% goat serum and 0.4% saponin for 1.5 hr. For overnight incubation (4°C) with primary antibodies, monoclonal anti-clathrin heavy chain (CHe-X-22) and anti-adaptor protein 2 (AP-2α-AP-6) antibodies (both were gifts from Dr. Volker Haucke, Department of Biochemistry, University of Goettingen, Goettingen, Germany) were diluted in blocking solution. Cells were then incubated with an Alexa 594-labeled anti-mouse IgG secondary antibody for 2 hr at 4°C. Images were taken using a confocal laser-scanning microscope (SP2; Leica, Heidelberg, Germany).
Hippocampal cell culture and transfection. Hippocampal neurons from regions CA1-CA3 of 1- to 3-d-old Wistar rats were cultured according to previous protocols (Klingauf et al., 1998). After 2-3 weeks in culture EGFP-LCa1 was overexpressed using the Semliki-Forest virus system (Ashery et al., 1999).
Experimental conditions. Experiments were performed 12-18 hr after infection. Coverslips were mounted in a perfusion chamber on a movable stage of an inverted microscope (Axiovert 135 TV; Zeiss, Oberkochen, Germany). Cells were perfused at room temperature in a modified Tyrode's solution consisting of (in mm): 150 NaCl, 5 KCl, 2 CaCl2, 1 MgCl2, 10 HEPES, pH 7.4, and 30 glucose. For high potassium (90 mm KCl) stimulation, the saline solution contained 0.5 μm tetrodotoxin (TTX), whereas for electric field stimulation 10 μm 6-cyano-7-nitroquinoxaline-2,3-dione (CNQX) and 50 μm d,l-2-amino-5-phosphonovaleric acid (APV) were added to prevent recurrent activity.
FM dye loading. Synaptic boutons were labeled by electric field stimulation (1 msec current pulses of 40 mA and alternating polarity delivered by platinum electrodes spaced at ∼15 mm) in saline containing 10 μm FM 5-95, followed by an additional 60 sec of dye exposure to ensure complete labeling of all recycling vesicles. Individual boutons were imaged after 10 min perfusion with dye-free Tyrode's solution. Destaining of hippocampal terminals was achieved with the same stimulation as for FM staining.
Fluorescence microscopy and analysis. For epifluorescence microscopy, regions with LCa1-EGFP-positive axons were chosen. Axons could be distinguished from dendrites by their distinct morphological characteristics (thin <1 μm, meandering, non-tapering, and non-spiny processes). Synaptic boutons often showed a slight concentration of EGFP-LCa1. Endocytosis was triggered either by superfusion with high potassium (90 mm KCl) or by electric field stimulation. Fast solution exchanges were achieved by a piezo-controlled stepper device (SF77B; Warner Instruments, Hamden, CT) using a three barrel square glass tubing.
Images were taken using a cooled slow-scan CCD camera (PCO SensiCam, Kelheim, Germany) on an Axiovert 135 TV inverted microscope with a 63× 1.2 numerical aperture water-immersion objective (both Zeiss, Oberkochen, Germany) and a modified filter set (DCLP 495, BP 525/50 for EGFP and DCLP 565, LP 620 for FM 5-95). For double staining experiments, images were spectrally split using a 565 nm dichroic filter and projected onto the left and right halves of the CCD chip using custom-built optics (drawings and calculations were kindly provided by Dr. Stefan Hell and coworkers, MPI for Biophysical Chemistry, Goettingen, Germany). Both dyes were excited at 475 nm by repetitive Xe-arc lamp illumination (Polychrom II; T.I.L.L. Photonics, Germany). Imaging data were digitized, and individual regions were selected by hand either by using regions of interest (average of ∼12 pixels, each 212 nm) to delimit puncta or a line of interest along the axon (TILLvisION software; T.I.L.L. Photonics, Germany). Waterfall plots were generated from the average intensity over time with a width of three pixels perpendicular to each point of the line of interest. Further analysis was performed with self-written macros in IgorPro (Wavemetrics, Lake Oswego, OR). N is the number of experiments, and n the number of single boutons. Errors shown are SEM values.
Model simulation. Numerical simulation of reaction and diffusion were performed according to the kinetic scheme depicted in Figure 5B. The differential equation for one-dimensional diffusion was integrated in space over a 200 nm grid and in time with a step size of 5 msec using self-written macros (IgorPro; Wavemetrics). Mirror symmetry for diffusion was assumed at the center of the bouton (0 μm) as well as at 5 μm distance (half maximum distance between neighboring boutons). Thus, integration in space was only performed between 0 and 5 μm with reflecting boundaries (zero flux across boundaries). The reaction terms were added only to the first three segments corresponding to a bouton radius of 600 nm.
Figure 5.
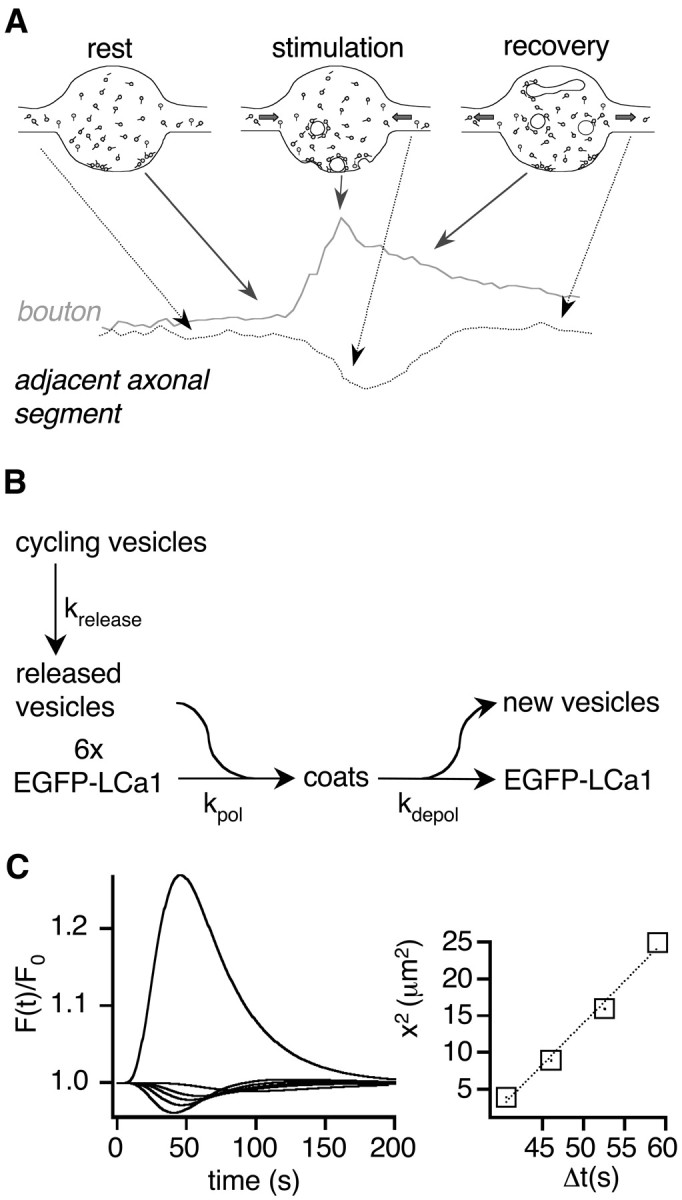
Reaction-diffusion model for transient EGFP-LCa1 signals during stimulation. A, A simple reaction-diffusion model explains the transient increase and decrease of EGFP-LCa1 signals in the bouton (gray) and adjacent axonal segments (black). Accumulation of EGFP-LCa1 in boutons caused by coat formation during stimulation leads to a decrease of free EGFP-LCa1. Therefore, EGFP-LCa1 diffuses from adjacent axonal segments into boutons leading to a decrease of the fluorescence in the axon. Thus, the bouton signal is directly proportional to the number of clathrin-coated pits at any given time point, provided that EGFP-LCa1 diffusion is significantly faster than coat assembly. B, Scheme of simplified reaction-diffusion model (also see Results). Vesicles are released from the cycling pool (= 100%) during stimulation with rate krelease; new coats are formed around these vesicles at a rate kpol (six sequential binding steps were sufficient to explain the measured delay of ∼10 sec) and after fission shed off clathrin at a rate kdepol. Polymerization creates a concentration sink of free LCa1-EGFP molecules leading to diffusional influx, whereas depolymerization creates a source for diffusion. C, A typical model simulation of fluorescence transients in a bouton and at distances 1, 2, 3, and 4 μm from the bouton is shown. Parameters were: krelease = 0.05 sec-1, kpol = 0.33 μm/sec-1, kdepol = 0.033 sec-1, DEGFP-LCa1 = 0.25 μm2/sec. Reaction constants were chosen to reflect an affinity according to the literature (Ungewickell, 1983), kdepol was estimated from FRAP experiments on single coated pits in HEK cells transfected with LCa1-EGFP (unpublished data). The release rate reflects the destaining characteristics for this stimulus paradigm (Fig. 1). D, The squared distances, i.e., square displacements, of the axonal transients in C are plotted versus the times of fluorescence minima. This yields a line with a slope of ∼5 times the diffusion constant. This factor of 5 is used as the proportionality factor for estimating the local axoplasmic diffusion constant for EGFP-LCa1 in Figure 6D.
Results
EGFP-LCa1 is incorporated into coated pits and does not impair synaptic exo-endocytic vesicle cycling
To measure clathrin-mediated endocytosis as directly as possible, we tagged LCa1, cloned out of a rat hippocampal cDNA library, at the C terminus with enhanced GFP using five alanine residues as a linker (EGFP-LCa1). We tested the functional intactness of our construct by expressing EGFP-LCa1 in HEK cells (see Materials and Methods). Similar to Gaidarov et al. (1999), we detected numerous subresolution particles at the membrane (Fig. 1A,B, left panel). No such particles were visible when we expressed EGFP alone (data not shown). Immunocytochemistry with antibodies against clathrin heavy chain (Fig. 1A, middle panel) and adaptor-binding protein 2 (Fig. 1B, middle panel) showed a clear colocalization with EGFP-LCa1 (Fig. 1A,B, right panel). We conclude that EGFP-LCa1 inserts into structurally and functionally active coated pits, as has been shown previously (Gaidarov et al., 1999; Blanpied et al., 2002; Merrifield et al., 2002).
Figure 1.
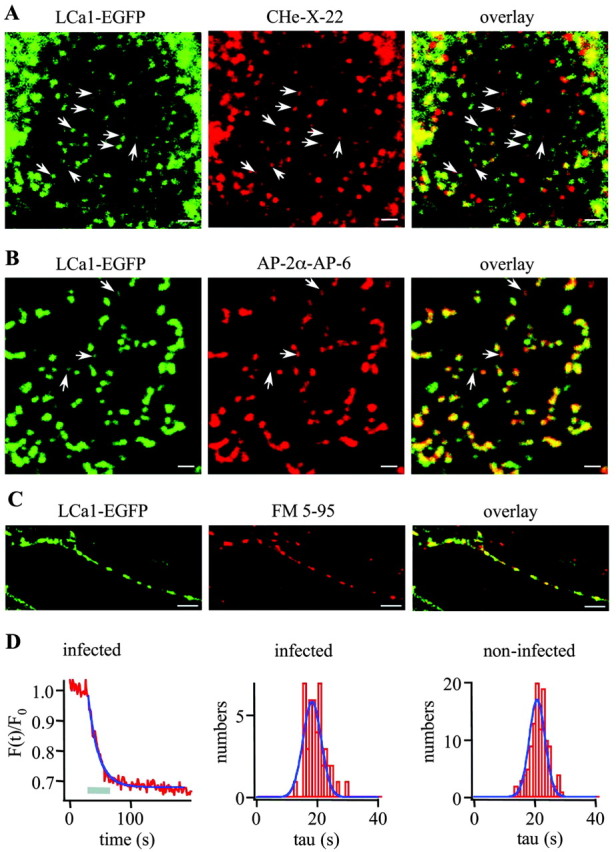
EGFP-LCa1 is incorporated into coated pits and does not impair synaptic exo-endocytic vesicle cycling. A, B, HEK cells overexpressing EGFP-LCa1 (left) were fixed and immunolabeled either with an antibody against clathrin heavy chain (CHe-X-22; A, middle) or adaptor-binding protein 2 (AP-2α-AP-6; B, middle). Confocal images were taken in a region close to the cell surface. In both cases, colocalization was observed (A, B, right). Note, in some examples (arrows, especially in the top panels) colocalization is less obvious in the overlay because of highly differing signal intensities. Scale bars, 1 μm. C, Hippocampal axon expressing EGFP-LCa1 (green) was loaded with FM 5-95 (red) during a train of 750 APs. A clear colocalization between FM 5-95 spots and locations of slightly concentrated EGFP-LCa1 was obtained, indicating that EGFP-LCa1-expressing terminals are functionally intact. Scale bars, 5 μm. During electric field stimulation (750 APs at 20 Hz) FM 5-95 was released in an exemplar EGFP-LCa1-positive bouton (D, left) with a time constant of 16.9 sec and on average with a time constant of 18.3 ± 0.64 sec (D, middle, n = 44). Similar results were obtained in two other experiments [1: τmean = 17.04 ± 0.59 sec (n = 67); 2: τmean = 23.07 ± 0.96 sec (n = 35)]. The average time constant in noninfected cells was 20.7 ± 0.34 sec (D, right, n = 115). Similar results were obtained in two other experiments [1: τmean = 18.7 ± 0.55 sec (n = 50); 2: τmean = 16.5 ± 0.605 sec (n = 61)].
To visualize stimulated endocytosis in hippocampal neurons, we overexpressed EGFP-LCa1 using the Semliki-Forest virus system (see Materials and Methods). With a diameter of ∼1 μm, synaptic boutons are too small for tracking individual clathrin-coated pits during stimulation at the light-microscopic level. To test whether the expression at this level interferes with exo-endocytic cycling of vesicles, we compared the release rates of FM 5-95 from infected and control boutons. EGFP-LCa1-positive axons were identified as thin (≤1 μm), non-tapering processes lacking spines. Often some slight punctate staining was visible (Fig. 1C, left panel), which nicely colocalized with FM 5-95 (Fig. 1C, middle and right panel). FM 5-95 destaining kinetics were monoexponential (Fig. 1D, left panel) with time constants of 18.3 ± 0.64 sec in infected neurons (Fig. 1D, middle panel) and 20.7 ± 0.34 sec in noninfected neurons (Fig. 1D, right panel). Similar results were obtained in four other experiments.
Thus, overexpression of EGFP-LCa1 in cultured hippocampal neurons using Semliki-Forest virus system seems not to have any adversary effect on exo-endocytic cycling.
EGFP-LCa1 dynamics during high-K+ stimulation
Previously it has been shown that molecules involved in presynaptic activity undergo specific reversible redistribution during stimulation (Sankaranarayanan and Ryan, 2000; Chi et al., 2001; Colicos et al., 2001; Li and Murthy, 2001; Sankaranarayanan et al., 2003).
We therefore tested whether the highly mobile EGFP-LCa1 (Gaidarov et al., 1999; Wu et al., 2001; Blanpied et al., 2002; Merrifield et al., 2002; Rappoport and Simon, 2003) shows a similar behavior and thus could be used as a caliper to study stimulated clathrin-mediated endocytosis in small CNS synapses. We challenged EGFP-LCa1-positive axons with high potassium (90 mm) two times. Under resting conditions (Fig. 2A) (t = 0 sec) and at stimulus onset (Fig. 2A)(t = 10 sec) EGFP-LCa1 fluorescence was only slightly higher in synaptic boutons than in interconnecting axonal segments. During a 14 sec high-potassium challenge, numerous single presynaptic boutons showed transient fluorescence increases (Fig. 2A) (t = 24 sec), which decayed slowly after cessation of the stimulus (Fig. 2A) (t = 58 sec) and increased again during the second round of stimulation (Fig. 2B,C).
Figure 2.

EGFP-LCa1 dynamics during high-K+ stimulation. A, Time-lapse series of EGFP-LCa1-positive axons from hippocampal neurons challenged with two pulses of high potassium (90 mm) at t = 10 and 60 sec. Under resting conditions (t = 0 sec) and at stimulus onset (t = 10 sec) synaptic boutons of EGFP-LCa1-positive axons are only slightly brighter than interconnecting axonal segments. During a 14 sec high-potassium challenge, numerous single presynaptic boutons showed transient fluorescence increases (t = 24 sec), which decayed again after cessation of the stimulus (t = 58 sec). Scale bars, 5 μm. B, Exemplar fluorescence transients of four boutons marked by color-coded circles in A. C, Average time course of all boutons. During stimulation with high-K+ the fluorescence intensity within boutons (n = 17) rises with a delay of a few seconds, reaches its peak shortly thereafter, and then decays within a few ten seconds. Similar signals were obtained in two other experiments. (n = 10 and n = 12 boutons; data not shown)
Exemplar fluorescence transients from four individual boutons, marked by color-coded circles in Figure 2A (t = 24 sec), are displayed in Figure 2B. The average fluorescence response of all boutons in this experiment (Fig. 2C) shows that the fluorescence intensity rises with a delay of a few seconds after stimulus onset, reaches its peak shortly thereafter, and then decays within a few tens of seconds. Similar signals were obtained in two other experiments (n = 10 and n = 12 boutons).
Spatiotemporal redistribution of presynaptic clathrin during electric field stimulation
To stimulate more physiologically we applied electric field stimulation (Fig. 3A). The dynamics of EGFP-LCa1 for 750 action potentials (APs) at 20 Hz were very similar to those for high-potassium stimulation. In Figure 3A boutons (white arrows) become clearly visible during stimulation (t = 44 sec). A waterfall plot of the fluorescence along the path of the axon over time (Fig. 3B) shows the time course of EGFP-LCa1 dynamics. Individual fluorescence profiles of the axon before (green), during (red), and after (blue) stimulation are depicted in Figure 3C. For a more quantitative analysis we plotted the fluorescence intensities of the two marked synaptic boutons (B1 and B2) and the adjacent axonal segments over time (Fig. 3D). During two trains of 750 APs (Fig. 3B,D, gray bars) the fluorescence intensities in the boutons display a transient increase (Fig. 3D, red) (ΔF/F0 = 14.7-25.5%). The adjacent axonal segments (Fig. 3B, green circles; 3C, dashed vertical lines), however, show a temporary decrease in fluorescence intensity, albeit of smaller amplitude (Fig. 3D, green). Both effects were reversible and visible for repeated stimulation.
Figure 3.
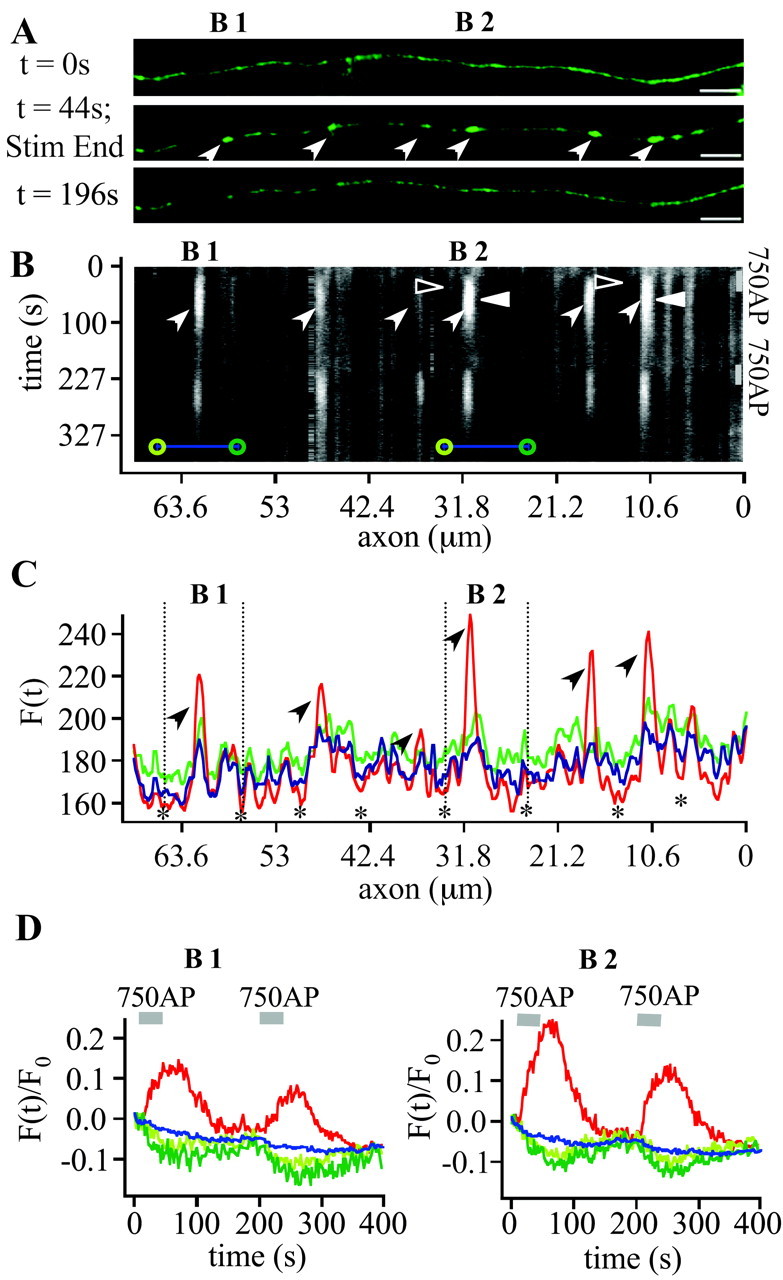
Redistribution of presynaptic clathrin during electric field stimulation. A, Fluorescence images of an EGFP-LCa1-positive axon from a hippocampal neuron under resting conditions (top), after a train of 750 APs at 20 Hz (middle) and ∼ 3 min after electric field stimulation (bottom). Boutons (white arrows) with intervening axonal regions are visible (two boutons further analyzed below are labeled B1 and B2). Scale bars, 5 μm. The images of the second round of stimulation in this axon are not shown. B, To analyze the redistribution of EGFP-LCa1 a line of interest was placed along the axon with a thickness of 3 pixels (636 nm). The fluorescence intensity along that line was plotted over time. Arrows indicate boutons marked in A, whereas arrowheads indicate fluorescence changes during stimulation. C, Exemplar fluorescence profiles from B before (green), during (red), and after stimulation (blue). Note fluorescence decreases (asterisks) in neighboring axonal regions around a bouton. D, Kinetics of fluorescence changes in two individual synaptic boutons (B1 and B2, both marked in A-C) and neighboring axonal segments normalized to the initial fluorescence intensity of the first four frames. Gray bars give time of electric field stimulation. During two trains of 750 APs, fluorescence in boutons transiently increases (red, B1: 1. stimulus: ΔF/F0 = 14.7%; 2. stimulus: ΔF/F0 = 10.8%; B2: 1. stimulus: ΔF/F0 = 25.5%; 2. stimulus ΔF/F0 = 17.7%), whereas neighboring axonal segments (green circles in B) show a temporary decrease (green). These effects are reversible and attributable to redistribution of EGFP-LCa1 between presynaptic and axonal compartments, because the fluorescence integrated over the whole axonal segments plus boutons (blue bars in B) changes very little over time (blue, B1: 1. stimulus: ΔF/F0 = -1.37%; 2. stimulus: ΔF/F0 = -2.56%; B2: 1. stimulus: ΔF/F0 = -1.69%; 2. stimulus: ΔF/F0 = -0.65%; values are corrected for slight bleaching and focus drift).
When integrating the fluorescence of boutons plus the axon (Fig. 3B, blue bars) and plotting it over time (Fig. 3D, blue), only a slight transient decrease is visible (ΔF/F0 =-0.65-2.56%). This demonstrates that most of the changes are caused by redistribution, i.e., movement of EGFP-LCa1 in and out of the boutons. The residual slight decrease most likely reflects a modest acidification probably caused by deprotonation of endogenous calcium buffers during stimulation. Small pH changes could be measured using SNARF 1 under the same stimulus paradigms (data not shown).
For robust detection of the rather modest redistribution of EGFP-LCa1 during stimulation in individual boutons and axonal segments, the expression level had to be high enough for sufficient signal-to-noise, but low enough, such that local depletion of cytosolic clathrin could occur. Empirically, we found only a small window of 12-18 hr after infection to be suitable for detection of these signals. Judging from fluorescence correlation spectroscopy measurements the concentration of EGFP-LCa1 is no more than a few micromoles in this time interval (unpublished data). This means there are ∼1000 copies of LCa1-EGFP in an unstimulated bouton. Approximately 100-180 LCa1 molecules are needed to build up a clathrin coat (Marsh and McMahon, 1999), which suggests that there are a few thousand unlabeled LCa molecules present.
Overall kinetics of EGFP-LCa1 fluorescence changes during a train of 750 action potentials
Our results for all measured boutons (n = 40) are summarized in Figure 4. On average, the fluorescence change ΔF/F0 in boutons was 19.7% ± 2.42%, whereas the change of the integrated fluorescence (bouton plus axonal segments) was ΔF/F0 = -3.2 ± 0.58% (Fig. 4A,B). The kinetic characteristics are shown in Figure 4C. Interestingly, the fluorescence transient lags the stimulus onset by 13.8 ± 0.99 sec before rising swiftly (20-80% rise time of 17.6 ± 1.2 sec). In most traces the signal remains at a plateau for some time (100-90% decay time, 20.8 ± 2.7 sec) before decaying to baseline. The average full width at half maximum was 65.7 ± 4.3 sec. Because the fluorescence decay could not always be fitted by a single exponential, we used 50% decay values for characterization. When measured from the stimulus end we found a value of 47.8 ± 3.2 sec compared with 38.5 ± 1.9 sec when determined from the peak value. This value is very similar to the exponential decay time constant of ∼60 sec for 600 action potentials at 20 Hz measured with synapto-pHluorin in hippocampal boutons (Sankaranarayanan and Ryan, 2000).
Figure 4.

Overall kinetics of EGFP-LCa1 fluorescence changes during stimulation. A, Average time course of EGFP-LCa1 fluorescence responses in boutons (black) challenged by 750 APs at 20 Hz normalized to the initial fluorescence intensity (n = 40; N = 3). For comparison, the total fluorescence integrated over the whole region (axon plus bouton) is plotted in gray. B, Maximum fluorescence change in boutons (ΔF/F0 = 19.7 ± 2.42%; n = 40) and of fluorescence over whole axon ΔF/F0 = -3.2 ± 0.58% (not corrected for bleaching). C, Summary of different parameters characterizing the time courses of EGFP-LCa1 fluorescence transients for 750 APs at 20 Hz. The average delay, defined as the time between stimulus onset and rise of fluorescence five times the SD above the average signal before stimulation, was 13.7 ± 0.99 sec (n = 38). The 20-80% rise time was 17.6 ± 1.2 sec (n = 40). To characterize a plateau phase after stimulus cessation, the 100-90% decay time (τplateau) was determined, yielding values of 20.8 ± 2.7 sec (n = 40). The full width at half maximum (half width) was 65.7 ± 4.3 sec (n = 37). The falling phase is best described by the 50% decay time either measured from stimulus end (decaystim end = 47.8 ± 3.2 sec; n = 40) or from the maximum intensity (decaypeak = 38.5 ± 1.9 sec; n = 40).
A reaction-diffusion model for transient EGFP-LCa1 redistribution during stimulation
During stimulation coat formation uses up a fraction (∼20%) of EGFP-LCa1 molecules in the boutons, thereby creating a sink for diffusion of molecules out of adjacent axonal segments. Because the measured fluorescence intensity is the sum of membrane-bound and free EGFP-LCa1 an increase in fluorescence will be observed in the boutons (Fig. 5A, gray) and a decrease in axonal segments (Fig. 5A, black). This decrease is expected to be smaller in amplitude, because the volume of the axonal segments between boutons is large compared with that of a bouton. After stimulation, uncoating of endocytosed vesicles will lead to a reversal of the diffusional flux. Thus, the relative change in EGFP-LCa1 fluorescence in the boutons should be directly proportional to the number of clathrin-coated pits and the rise and fall of the signal a measure of coat assembly and disassembly. This simplified scheme, however, assumes that EGFP-LCa1 diffusion is significantly faster than coat assembly.
We used a numerical simulation of reaction and diffusion according to the model schematically depicted in Figure 5B to examine the effect of diffusion on reaction. Vesicles are exocytosed from the cycling pool with a rate constant of 20 sec (Fig. 1D), constituting a pool of released vesicles. This pool is turned over into a pool of coated pits at a rate kpol reflecting polymerization. At least six sequential binding steps for coat formation had to be assumed to copy the empirically found delay. This reaction creates a concentration sink of free clathrin molecules and thus a diffusional flux into the boutons. Freshly endocytosed vesicles shed off their coat at a slower rate kdepol, eventually leading to a reversal of the diffusional flux. In the left panel of Figure 5C a typical model simulation of normalized fluorescence transients in the bouton as well as in axonal segments at different distances to the bouton are shown (see figure legend for parameter values). When plotting the squared distances of axonal segments from the bouton versus the time points of fluorescence minima (Fig. 5C, right), an approximately straight line with a slope of approximately five times the diffusion constant is obtained. With this result, we now should be able to measure the local diffusion constant of LCa1-EGFP during stimulation.
EGFP-LCa1 diffusion is not rate-limiting
To estimate the speed of EGFP-LCa1 diffusion we selected an axon, where active boutons were spaced at a rather large distance (Fig. 6A,B, B1 and B2). As expected for diffusion, the transient fluorescence decreases in the axonal segments are progressively delayed for larger distances to the bouton (Fig. 6C). The axonal transients were analyzed at 1.3, 1.9, 2.5, and 3.2 μm, respectively (Fig. 6B,C, blue lines and asterisks of increasing saturation) on either side of the boutons (Fig. 6C, red lines). Of these transients, we next plotted the squared distances versus the respective times of fluorescence minima (Fig. 6D). As shown in the simulation above (Fig. 5B,C), a nearly linear relationship between those two quantities is expected for free diffusion, with the slope being five times the diffusion coefficient. The points can be reasonably well fitted by lines with slopes of 0.63 ± 0.28 μm2/sec to 2.2 ± 0.48 μm2/sec. Thus, the diffusion constants of EGFP-LCa1 in axoplasm are in the range of 0.13-0.44 μm2/sec.
Figure 6.
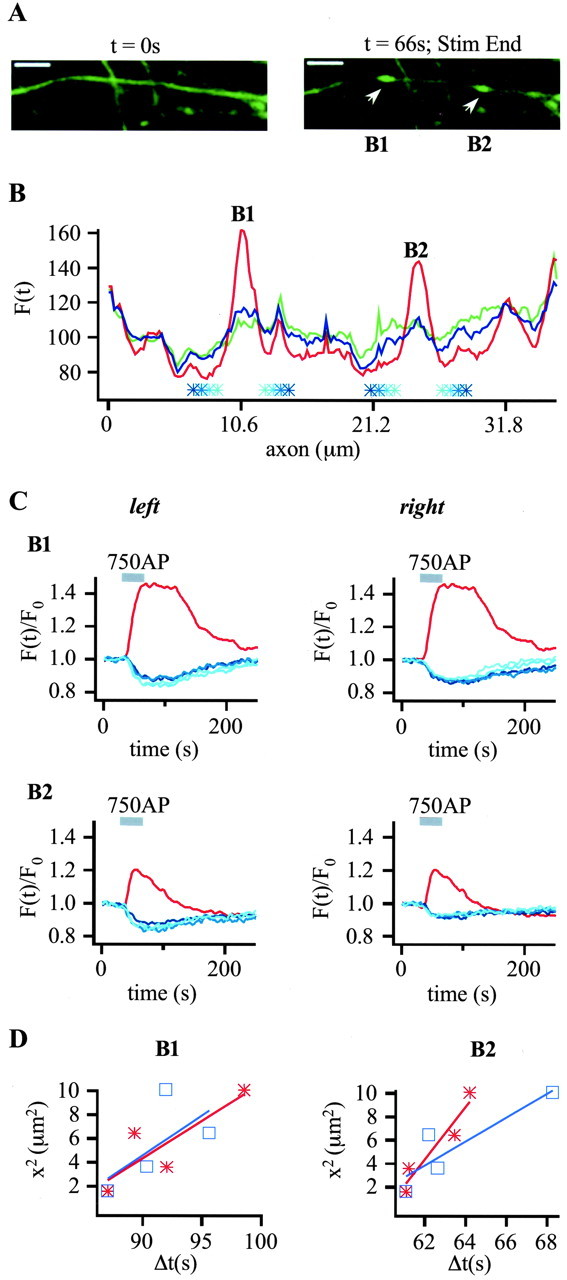
Activity-dependent recruitment of EGFP-LCa1 to synaptic terminals is governed by fast diffusion. A, Time lapse images from a hippocampal axon with two boutons (B1 and B2) spaced at large distance before (left) and at the end (right) of electric field stimulation (750 APs, 20 Hz). Scale bars, 5.0 μm. B, For analysis the fluorescence intensity along a line of interest is plotted versus the axonal length before (green), during (red), and after stimulation (blue), as described in Figure 3C. Top panels represent B1, and bottom panels represent B2. Fluorescence transients of these two boutons (red) and at intervals of 1.3, 1.9, 2.5, and 3.2 μm left and right from the center of the boutons (blue lines of increasing saturation, also marked in B) are plotted over time. Traces are normalized to initial fluorescence (first 19 frames) and box-smoothed two times over three pixels. Note that the transient decreases are right-shifted with respect to distance from the bouton, as expected for redistribution. D, Squared distances right (blue) and left (red) from the bouton centers are plotted versus the times of fluorescence minima in the axonal regions. The linear relationship indicates that the redistribution is governed by diffusion. Linear fits gave slopes of 0.67 ± 0.56 and 0.63 ± 0.28 μm2/sec (B1) and 1.0 ± 0.37 and 2.2 ± 0.48 μm2/sec (B2), respectively, yielding diffusion constants of 0.13-0.44 μm2/sec.
These values are nearly identical to the ones we have determined by fluorescence correlation spectroscopy for LCa1-EGFP in somata and proximal dendritic segments (0.13-0.3 μm2/sec; unpublished data). Thus, on spatial scales of 1-2 μm, diffusional exchange takes place within a few seconds. Because of the much larger volume of the axonal compartments relative to the boutons, LCa1 diffusion is not rate-limiting for the transient changes in boutons.
EGFP-LCa1 dynamics during paired-pulse experiments
The most striking feature of the EGFP-LCa1 transients is the long lag phase after stimulus onset. By measuring EGFP-LCa1 redistribution, we can only observe the build-up of newly formed clathrin-coated pits. Other modes of endocytosis that are either clathrin-independent or capitalize on already preassembled clathrin lattices will go undetected. Because the relative contribution of different modes might be use-dependent, we tested whether the kinetics of the transients and especially the long delay change when applying a second round of stimulation immediately after cessation of the first transient.
LCa1-EGFP-positive axons were challenged by two trains of 750 APs at 20 Hz spaced at 190 sec (Fig. 7A). As in the analysis above we determined the characteristic parameters (Fig. 7B-G) for both stimuli. To our surprise, the delay (Fig. 7B) of the second stimulus increased slightly, but significantly (15.4 ± 1.04 sec) when compared with the first stimulus (12.3 ± 1.2 sec; p = 0.0252). This prolongation of the delay, however, was reversible. When challenged with another paired pulse at least 7 min after the cessation of the first double pulse, the delay of the third pulse was comparable to the first one, whereas the fourth one again was slightly prolonged (data not shown). The 20-80% rise time (Fig. 7C) of the second pulse, however, was comparable or even slightly faster (18.7 ± 1.40 vs 15.9 ± 1.2 sec; p = 0.0548). All other parameters were remarkably similar for both pulses and not significantly different (Fig. 7D,E,G). Only when measured from stimulus end (Fig. 7F) were the 50% decay times significantly slower for the second pulse (50.4 ± 3.4 and 57.3 ± 3.8 sec; p = 0.0138), reflecting the time shift of the signals caused by the prolonged lag phase. Also the amplitudes of fluorescence changes did not alter for the second stimulus (data not shown).
Figure 7.
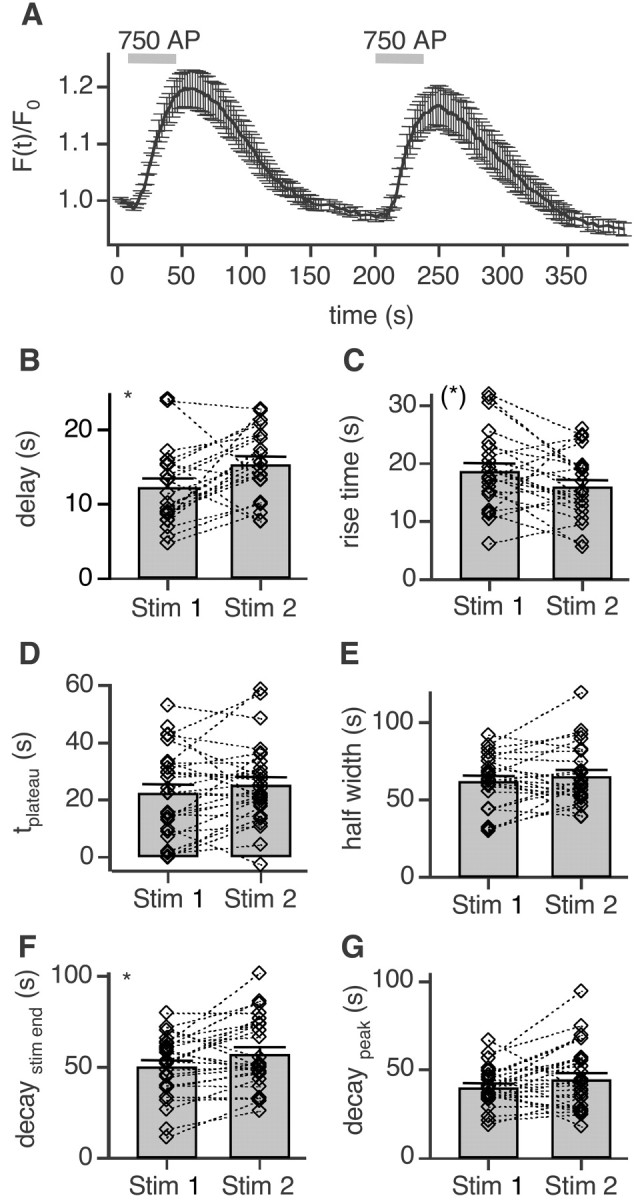
Repeated stimulation delays EGFP-LCa1 transients. A, Average time course of EGFP-LCa1 fluorescence responses evoked with two pulses, 750 APs each at 20 Hz, spaced at 192 sec (n = 28; N = 2). B, The delay of the first stimulus (12.3 ± 1.2 sec) was significantly faster (*p = 0.0252 paired t test) than that of the second stimulus (15.4 ± 1.04 sec; n = 21). C, In contrast the rise time of the first pulse 18.7 ± 1.4 sec is slower (*p = 0.0548) than that of the second 15.9 ± 1.2 sec (n = 23). D, The plateau phases of both pulses are not significantly different (22.6 ± 2.8 and 25.5 ± 2.6 sec, respectively; n = 28; p = 0.1912). E, Similarly the full width at half maximum does not change (62.2 ± 3.6 and 65.3 ± 3.9 sec, respectively; n = 24; p = 0.3437). F, The 50% decay after stimulus end, however, slows down significantly for the second pulse (50.4 ± 3.4 and 57.3 ± 3.8 sec, respectively; n = 26; *p = 0.0138). G, When measured from the maximum amplitude, no difference can be found for the decay (40.3 ± 2.2 sec and 44.9 ± 3.5 sec, respectively; n = 26; p = 0.1413).
The finding that only the delay is modulated in a reversible manner also argues against slow recruitment of new clathrin molecules from further away as the cause of the delay: prolongation of the delay should go along with a slowing of the rise time. Rather, the opposite was observed. Thus, we conclude, that the long delay of ∼10 sec most likely reflects the time it takes to form new clathrin-coated pits and is apparently use-dependent.
Discussion
Transient fluorescence increases in boutons are caused by clathrin-coated pit formation
To our knowledge this is the first study that shows that the genetically encoded fluorescent probe EGFP-LCa1 is suited to visualize clathrin redistribution in small synaptic boutons in real time. Several lines of evidence argue that the transient fluorescence increase of EGFP-LCa1 observed in synaptic boutons during stimulation reflects formation and disassembly of coated pits and is a direct measure of clathrin-mediated endocytosis in hippocampal synapses. First, EGFP-LCa1 inserts into structurally and functionally active coated pits in HEK cells (Fig. 1A,B). Second, reversible transient increases of fluorescence intensity are only observed during stimulation and are restricted to synaptic boutons. Adjacent axonal segments displayed small temporary decreases instead, such that the integrated fluorescence intensity along the axon remained nearly unchanged (Figs. 3D, 4A,B). Third, by estimating the local diffusion constant (between 0.13 and 0.44 μm2/sec) (Fig. 6D), we could show that this diffusional redistribution is sufficiently fast to be not rate-limiting, because most of the exchange occurs over a small distance (∼1 μm), and the axon volume is large compared with the volume of the boutons. Fourth, if the signal was caused by a transient volume change, the same results should be obtained with overexpression of EGFP alone. No such signals could be detected under the same stimulation conditions (data not shown). Also, the volume change expected from the release of even 100 vesicles is <1%, assuming a vesicle diameter of 45 nm and a bouton diameter of 1 μm.
Fifth, simulations based on a minimal model of LCa1 reaction and diffusion very faithfully predict the fluorescence changes observed in boutons and axons (Fig. 5B,C). We conclude that we were able to measure clathrin-mediated endocytosis in CNS synapses in real time.
Decay kinetics are remarkably similar to previous estimates of endocytic time course
The bouton fluorescence rose after the stimulus onset with a lag phase of 13.8 ± 0.99 sec, reached its peak shortly after stimulus cessation and decayed half with a time constant of 47.8 ± 3.2 sec (Fig. 4).
Miller and Heuser (1984) were the first to reconstruct the time course of endocytosis at frog neuromuscular junction from electron micrographs of freeze-fracture replica of synapses quick-frozen at different times relative to a stimulus. The half decay constant of ∼45 sec they found is remarkably similar to the one we report here.
Fluorescent membrane tracers like FM 1-43 more recently allowed for the first time to visualize endocytosis in live cells. Reconstruction of the endocytic time course yielded comparable half times of a few ten seconds (Ryan et al., 1993, 1996; Wu and Betz, 1996).
The direct observation of synaptic vesicle endocytosis was lately made possible with the optical probe synapto-pHluorin, a fusion construct of the vesicle protein synaptobrevin/VAMP2 with pH-sensitive GFP, that is quenched inside synaptic vesicles (Miesenbock et al., 1998; Sankaranarayanan and Ryan, 2000; Gandhi and Stevens, 2003). Sankaranarayanan and Ryan (2000) found a time constant of ∼60 sec for 600 APs at 20 Hz, which translates into a half time of ∼45 sec, remarkably similar to our decay time. This suggests that most of the endocytosis measured with synapto-pHluorin for repetitive stimulation is mediated by clathrin. In turn it follows, that the uncoating reaction must proceed quickly after fission, with a speed similar to reacidification. This is in line with electron microscopic work, in which coated vesicles could be hardly found in the cytosol of synaptic terminals (Miller and Heuser, 1984; Brodin et al., 2000).
The signal-to-noise ratio of the LCa1-EGFP transients so far precluded to collect enough events for a faithful reconstruction of the endocytosis time course for weaker stimuli and to compare it to synapto-pHluorin transients, which decay significantly faster for shorter stimuli (Sankaranarayanan and Ryan, 2000). This certainly limits the applicability of LCa1-EGFP redistribution for studying clathrin-mediated endocytosis.
The delay reflects buildup of new clathrin-coated pits
The remarkable difference between previous and our measurements is a significant delay between stimulus onset and increase of the fluorescence intensity, which cannot be explained by slow EGFP-LCa1 redistribution. The analysis in Figure 6 as well as fluorescence correlation spectroscopy measurements in somata and proximal dendrites of neurons (unpublished data) revealed a diffusion coefficient of 0.25 μm2/sec. In model simulations we found that most of the EGFP-LCa1 gradient created by recruitment to newly formed pits falls off over a distance of ≤1 μm (Fig. 5). This means EGFP-LCa1 is partially depleted only locally within the bouton, and the axon serves as an infinite source. Thus, the gradient within the axon is very shallow and of small amplitude (Figs. 5, 6). In summary, we found that diffusion contributes only 1-2 sec to the delay of >10 sec. Hence, a different explanation must be invoked.
Endogenous unlabeled clathrin might be preferentially inserted into newly formed pits. We think this is highly unlikely because single EGFP-LCa1-positive pits in HEK cells can be especially well distinguished from the cytoplasmic background fluorescence at low expression levels (Gaidarov et al., 1999) (Fig. 1A,B). Also, we measured the time constant of EGFP-LCa1 unbinding in single pits in HEK cells by recovery after photobleaching using total internal reflection illumination (TIR-FRAP) to be ∼30 sec (unpublished data), which implies high affinity binding (Gaidarov et al., 1999; Wu et al., 2001; Blanpied et al., 2002; Merrifield et al., 2002; Rappoport and Simon, 2003).
Taken together, the delay should reflect the series of highly cooperative reaction steps that lead to coat assembly (Brodin et al., 2000; Slepnev and De Camilli, 2000). This is also consistent with studies of single clathrin coat assembly in dendrites of hippocampal neurons, which was found to be very slow (Blanpied et al., 2002).
How are vesicles endocytosed during the first 10 sec of stimulation?
A rapid component of endocytosis has been described by many investigators (Sun et al., 2002; Aravanis et al., 2003; Gandhi and Stevens, 2003), but is absent in our measurements. An initial fast decay in fluorescence immediately after stimulation is also seen with synapto-pHluorin (Sankaranarayanan and Ryan, 2000), whereas with EGFP-LCa1 a plateau phase or even a slight rise in fluorescence is observed. One likely interpretation is that the early phase of endocytosis does not depend on clathrin, but is of the kiss and run type and thus not seen with our probe. The recent findings of Aravanis et al. (2003) and Gandhi et al. (2003) in hippocampal synapses add fresh compelling evidence to this hypothesis.
An alternative explanation, however, could be a pool of preassembled ready-to-go coats at the periphery of the active zone, which might support a first wave of endocytosis. The presence of numerous quite stationary clathrin structures in non-excitable cells overexpressing LCa1 (Gaidarov et al., 1999; Kirchhausen, 2000) and the notion that activated G-protein-coupled receptor-β-arrestin complexes are endocytosed by pre-existing clathrin-coated pits (Santini et al., 2002; Scott et al., 2002) support this view. Interestingly, such a first wave of endocytosis via coated vesicles lasting only 10 sec has been observed by Miller and Heuser (1984) in their electron microscopic reconstruction of the time course of endocytosis at the frog neuromuscular junction. Because our assay reflects recruitment of free LCa1 to the sites of pit formation, such clathrin-dependent endocytosis from preassembled lattices will go undetected. The slightly longer delay for a second round of stimulation could then be explained by an activity-dependent increase of the preassembled pool. This increase, however, is transient and vanishes within 5 min after cessation of the EGFP-LCa1 signal.
Thus, the different phases of endocytosis defined kinetically might reflect the very same molecular mechanism and merely correspond to different degrees of depletion of supply material. For exocytosis, the introduction of the term “pool” was very successful for delineating the different kinetic phases of release and some of the molecular underpinnings (Neher, 1998). Similarly, preassembled lattices might constitute an “easily retrievable pool”, the dynamics and size of which remain to be investigated.
Footnotes
This work was supported by grants from the Deutsche Forschungsgemeinschaft (SFB 523 to J.K.) and the Boehringer Ingelheim Fonds (M.W.). We thank Dr. Erwin Neher for encouragement and fruitful discussions throughout this work and helpful comments on this manuscript; Michael Pilot, Dirk Reuter, and Frank Würriehausen for expert technical assistance; and Claudia Arlt for initial help with molecular biology.
Correspondence should be addressed to Dr. Jurgen Klingauf, Department Membrane Biophysics, Max-Planck Institute for Biophysical Chemistry, Am Fassberg 11, 37077 Goettingen, Germany. E-mail: J.Klingauf@mpi-bpc.mpg.de.
Copyright © 2004 Society for Neuroscience 0270-6474/04/242004-09$15.00/0
References
- Aravanis AM, Pyle JL, Tsien RW (2003) Single synaptic vesicles fusing transiently and successively without loss of identity. Nature 423: 643-647. [DOI] [PubMed] [Google Scholar]
- Ashery U, Betz A, Xu T, Brose N, Rettig J (1999) An efficient method for infection of adrenal chromaffin cells using the Semliki-Forest virus gene expression system. Eur J Cell Biol 78: 525-532. [DOI] [PubMed] [Google Scholar]
- Blanpied TA, Scott DB, Ehlers MD (2002) Dynamics and regulation of clathrin coats at specialized endocytic zones of dendrites and spines. Neuron 36: 435-449. [DOI] [PubMed] [Google Scholar]
- Brodin L, Low P, Shupliakov O (2000) Sequential steps in clathrin-mediated synaptic vesicle endocytosis. Curr Opin Neurobiol 10: 312-320. [DOI] [PubMed] [Google Scholar]
- Brodsky FM, Chen CY, Knuehl C, Towler MC, Wakeham DE (2001) Biological basket weaving: formation and function of clathrin-coated vesicles. Annu Rev Cell Dev Biol 17: 517-568. [DOI] [PubMed] [Google Scholar]
- Ceccarelli B, Hurlbut WP, Mauro A (1973) Turnover of transmitter and synaptic vesicles at the frog neuromuscular junction. J Cell Biol 57: 499-524. [DOI] [PMC free article] [PubMed] [Google Scholar]
- Chi P, Greengard P, Ryan TA (2001) Synapsin dispersion and reclustering during synaptic activity. Nat Neurosci 4: 1187-1193. [DOI] [PubMed] [Google Scholar]
- Colicos MA, Collins BE, Sailor MJ, Goda Y (2001) Remodeling of synaptic actin induced by photoconductive stimulation. Cell 107: 605-616. [DOI] [PubMed] [Google Scholar]
- Cremona O, De Camilli P (1997) Synaptic vesicle endocytosis. Curr Opin Neurobiol 7: 323-330. [DOI] [PubMed] [Google Scholar]
- Damer CK, O'Halloran TJ (2000) Spatially regulated recruitment of clathrin to the plasma membrane during capping and cell translocation. Mol Biol Cell 11: 2151-2159. [DOI] [PMC free article] [PubMed] [Google Scholar]
- Gaidarov I, Santini F, Warren RA, Keen JH (1999) Spatial control of coated-pit dynamics in living cells. Nat Cell Biol 1: 1-7. [DOI] [PubMed] [Google Scholar]
- Gandhi SP, Stevens CF (2003) Three modes of synaptic vesicular recycling revealed by single-vesicle imaging. Nature 423: 607-613. [DOI] [PubMed] [Google Scholar]
- Gundelfinger ED, Kessels MM, Qualmann B (2003) Temporal and spatial coordination of exocytosis and endocytosis. Nat Rev Mol Cell Biol 4: 127-139. [DOI] [PubMed] [Google Scholar]
- Heuser JE, Reese TS (1973) Evidence for recycling of synaptic vesicle membrane during transmitter release at the frog neuromuscular junction. J Cell Biol 57: 315-344. [DOI] [PMC free article] [PubMed] [Google Scholar]
- Kirchhausen T (2000) Clathrin. Annu Rev Biochem 69: 699-727. [DOI] [PubMed] [Google Scholar]
- Klingauf J, Kavalali ET, Tsien RW (1998) Kinetics and regulation of fast endocytosis at hippocampal synapses. Nature 394: 581-585. [DOI] [PubMed] [Google Scholar]
- Koenig JH, Yamaoka K, Ikeda K (1998) Omega images at the active zone may be endocytotic rather than exocytotic: implications for the vesicle hypothesis of transmitter release. Proc Natl Acad Sci USA 95: 12677-12682. [DOI] [PMC free article] [PubMed] [Google Scholar]
- Li Z, Murthy VN (2001) Visualizing postendocytic traffic of synaptic vesicles at hippocampal synapses. Neuron 31: 593-605. [DOI] [PubMed] [Google Scholar]
- Marsh M, McMahon HT (1999) The structural era of endocytosis. Science 285: 215-220. [DOI] [PubMed] [Google Scholar]
- Merrifield CJ, Feldman ME, Wan L, Almers W (2002) Imaging actin and dynamin recruitment during invagination of single clathrin-coated pits. Nat Cell Biol 4: 691-698. [DOI] [PubMed] [Google Scholar]
- Miesenbock G, De Angelis DA, Rothman JE (1998) Visualizing secretion and synaptic transmission with pH-sensitive green fluorescent proteins. Nature 394: 192-195. [DOI] [PubMed] [Google Scholar]
- Miller TM, Heuser JE (1984) Endocytosis of synaptic vesicle membrane at the frog neuromuscular junction. J Cell Biol 98: 685-698. [DOI] [PMC free article] [PubMed] [Google Scholar]
- Neher E (1998) Vesicle pools and Ca2+ microdomains: new tools for understanding their roles in neurotransmitter release. Neuron 20: 389-399. [DOI] [PubMed] [Google Scholar]
- Pearse BM (1976) Clathrin: a unique protein associated with intracellular transfer of membrane by coated vesicles. Proc Natl Acad Sci USA 73: 1255-1259. [DOI] [PMC free article] [PubMed] [Google Scholar]
- Rappoport JZ, Simon SM (2003) Real-time analysis of clathrin-mediated endocytosis during cell migration. J Cell Sci 116: 847-855. [DOI] [PubMed] [Google Scholar]
- Ryan TA, Reuter H, Wendland B, Schweizer FE, Tsien RW, Smith SJ (1993) The kinetics of synaptic vesicle recycling measured at single presynaptic boutons. Neuron 11: 713-724. [DOI] [PubMed] [Google Scholar]
- Ryan TA, Smith SJ, Reuter H (1996) The timing of synaptic vesicle endocytosis. Proc Natl Acad Sci USA 93: 5567-5571. [DOI] [PMC free article] [PubMed] [Google Scholar]
- Sankaranarayanan S, Ryan TA (2000) Real-time measurements of vesicle-SNARE recycling in synapses of the central nervous system. Nat Cell Biol 2: 197-204. [DOI] [PubMed] [Google Scholar]
- Sankaranarayanan S, Atluri PP, Ryan TA (2003) Actin has a molecular scaffolding, not propulsive, role in presynaptic function. Nat Neurosci 6: 127-135. [DOI] [PubMed] [Google Scholar]
- Santini F, Gaidarov I, Keen JH (2002) G protein-coupled receptor/arrestin3 modulation of the endocytic machinery. J Cell Biol 156: 665-676. [DOI] [PMC free article] [PubMed] [Google Scholar]
- Scott MG, Benmerah A, Muntaner O, Marullo S (2002) Recruitment of activated G protein-coupled receptors to pre-existing clathrin-coated pits in living cells. J Biol Chem 277: 3552-3559. [DOI] [PubMed] [Google Scholar]
- Shupliakov O, Low P, Grabs D, Gad H, Chen H, David C, Takei K, De Camilli P, Brodin L (1997) Synaptic vesicle endocytosis impaired by disruption of dynamin-SH3 domain interactions. Science 276: 259-263. [DOI] [PubMed] [Google Scholar]
- Slepnev VI, De Camilli P (2000) Accessory factors in clathrin-dependent synaptic vesicle endocytosis. Nat Rev Neurosci 1: 161-172. [DOI] [PubMed] [Google Scholar]
- Sun JY, Wu XS, Wu LG (2002) Single and multiple vesicle fusion induce different rates of endocytosis at a central synapse. Nature 417: 555-559. [DOI] [PubMed] [Google Scholar]
- Takei K, Mundigl O, Daniell L, De Camilli P (1996) The synaptic vesicle cycle: a single vesicle budding step involving clathrin and dynamin. J Cell Biol 133: 1237-1250. [DOI] [PMC free article] [PubMed] [Google Scholar]
- Ungewickell E (1983) Biochemical and immunological studies on clathrin light chains and their binding sites on clathrin triskelions. EMBO J 2: 1401-1408. [DOI] [PMC free article] [PubMed] [Google Scholar]
- Wu LG, Betz WJ (1996) Nerve activity but not intracellular calcium determines the time course of endocytosis at the frog neuromuscular junction. Neuron 17: 769-779. [DOI] [PubMed] [Google Scholar]
- Wu X, Zhao X, Baylor L, Kaushal S, Eisenberg E, Greene LE (2001) Clathrin exchange during clathrin-mediated endocytosis. J Cell Biol 155: 291-300. [DOI] [PMC free article] [PubMed] [Google Scholar]