

Abstract
The vast majority of human mutations have minor allele frequencies (MAF) under 1%, with the plurality observed only once (i.e., “singletons”). While Mendelian diseases are predominantly caused by rare alleles, their cumulative contribution to complex phenotypes remains largely unknown. We develop and rigorously validate an approach to jointly estimate the contribution of all alleles, including singletons, to phenotypic variation. We apply our approach to transcriptional regulation, an intermediate between genetic variation and complex disease. Using whole genome DNA and lymphoblastoid cell line RNA sequencing data from 360 European individuals, we conservatively estimate that singletons contribute ~25% of cis-heritability across genes (dwarfing the contributions of other frequencies). The majority (~76%) of singleton heritability derives from ultra-rare variants absent from thousands of additional samples. We develop a novel inference procedure to demonstrate that our results are consistent with pervasive purifying selection shaping the regulatory architecture of most human genes.
Editorial summary:
An approach to estimate the contribution of all alleles to phenotypic variation is applied to transcription regulation using whole-genome sequencing and transcriptome data. Ultra-rare variants contribute ~46% of cis-heritability across genes.
INTRODUCTION
The recent explosive growth of human populations has produced an abundance of genetic variants with minor allele frequencies (MAF) less than 1%1. While many rare variants underlying Mendelian diseases have been found2, their role in complex disease remains unknown3–8. Evolutionary models predict that the contribution of rare variants to complex disease is highly dependent on selection strength9,10, and that population growth can magnify their impact10–12. Recent methodological breakthroughs13,14 have enabled researchers to jointly estimate the independent contributions of low and high frequency alleles to complex traits, often demonstrating a large rare variant contribution likely driven by natural selection5,15–18. However, these studies excluded the rarest variants15 or included only well-imputed variants5 – this is a problematic limitation given that some plausible evolutionary models predict that the largest contributions to phenotypic variance could be from the rarest variants9–11,19. Directly querying the role of all variants with large-scale sequencing and sensitive statistical tests has the potential to reveal important sources of missing heritability, inform strategies to increase the success rate of association studies, and clarify how natural selection has shaped human phenotypes.
In this work, we develop, validate, and apply an approach for inferring the relative phenotypic contributions of all variants, from singletons to high frequency. We focus on the narrow-sense heritability (h2) of gene expression because a growing body of literature suggests that genetic variants primarily affect disease by modifying gene regulatory programs20–23, and recent examinations have identified significant rare variant effects on transcription8. To characterize the genetic architecture of gene expression, we analyze 360 unrelated individuals of European ancestry with paired whole genome DNA24 and RNA25 sequencing of lymphoblastoid cell lines (LCLs). We evaluate the robustness of our approach to genotyping errors, read mapping errors, population structure, rare variant stratification, and a wide range of possible genetic architectures.
RESULTS
Building and testing our model
We developed a new method to estimate the effect of rare alleles on trait variance, and validated our approach with an extensive set of simulations. Before analyzing real expression data, we performed a rigorous series of simulations to identify an approach for estimating heritability that is robust to possible confounding factors. In our simulations, we use real genotype data [all variants within 1 megabase (Mb) of the transcription start or end sites of genes] and generate gene expression phenotypes across individuals while varying the number of causal variants contributing to the phenotype (from 1 to 1,000), the distribution of effect sizes (including uniform, frequency-dependent, and an evolutionary-based model), and the distribution of causal allele frequencies (ranging from predominantly rare to predominantly common; see Supplementary Note). In total, we simulated 440 different genotype-phenotype models that span the range of genetic architectures that likely underlie complex phenotypes such as gene expression, and analyzed each simulated dataset using multiple distinct methods. These include fitting a linear mixed model (LMM) via restricted maximum likelihood (REML26,27) and Haseman-Elston (H-E) regression, an alternative approach based on regressing phenotypic covariance on genotypic covariance26 that is more robust in small samples (see Supplementary Note).
Similar to previous work28, we found that for many simulation settings, jointly analyzing all variants together can result in a substantial over- or underestimate of heritability (Fig. 1a, which shows results when true h2 = 0.2). One common solution is to partition sites by frequency5,15,29. We find that simply isolating rare (MAF < = 1%) from common variants using two partitions and performing joint inference15 can improve the accuracy for most models. However, when there are many causal rare variants, the estimator remains upwardly biased. Partitioning alleles into five or more categories by MAF5 alleviates this problem. Notably, not only does the overall bias decrease as the number of MAF categories increases, but the bias for each MAF bin also decreases substantially across all models (see Fig. 1b–f, Supplementary Note). These simulations suggest that with our sample size, partitioning SNPs into 20 MAF bins results in the smallest bias in our estimate of total heritability (h2total) as well as the smallest bias for each bin across all simulated parameters (though see Supplementary Note for further discussion of models that can induce bias). We note that further partitioning can improve results even further (see Supplementary Note), but variance will likely increase unless prior knowledge about causal variation exists.
Fig. 1. Simulation results.
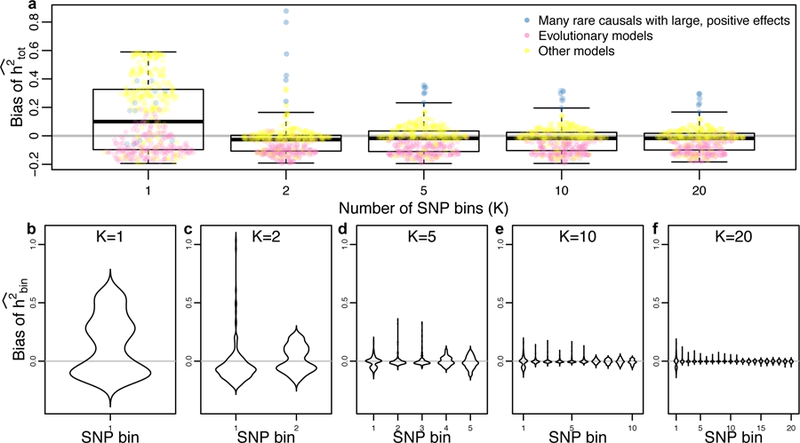
Across a broad range of parameters, the accuracy of heritability inference improves as the number of SNP bins (partitioned by MAF) increases. (a) Mean bias of total heritability (inferred-true) for different numbers of SNP bins (K), where each point represents the mean of 500 simulations for different parameters, and a box plot summarizing the bias distribution across all parameters (indicating median, upper/lower quartile, and twice the interquartile range). (b–f) The distribution of average bias across simulated parameters for each SNP bin, showing that both mean and variance of the bias decrease as K increases (n = 500 simulations in each plot).
When partitioning variants into multiple MAF bins, singletons are inevitably isolated into their own category. Intuitively, if some fraction of singletons are causal, then individuals with higher singleton load will be more likely to be phenotypic outliers (indeed, individuals with outlier expression patterns have been observed to have an enrichment of nearby rare variants8). It is therefore reasonable to ask what contribution singletons make to patterning phenotypic variation across a population. We investigated the theoretical properties of heritability estimation from singleton variants, and show analytically that when genotypic covariance is estimated using singletons alone, H-E regression is equivalent to regressing squared standardized phenotypes against singleton counts (see Supplementary Note).
A direct implication of our derivation is that H-E regression is unbiased unless singletons have large non-zero mean effect sizes (violating an explicit assumption of standard LMMs), which are the only simulation scenarios where heritability estimates remain upwardly biased (Fig. 1a, blue points). We develop an alternative approach that produces unbiased estimates of both heritability and mean effect size in all examined cases. Intuitively, the method (SingHer) conditions on total singleton count (per cis window) in order to (a) appropriately estimate total cis-heritability and (b) partition singleton heritability into directional and random components (see Supplementary Note). However, because H-E regression is well understood and flexible, we recommend its use when mean effect sizes are near zero. For the data we analyze below, SingHer estimates that mean effect sizes are near zero, and we therefore proceed with H-E regression.
Singletons drive genetic architecture of gene expression
In order to characterize the genetic architecture of human gene regulation, we partitioned the heritability of gene expression into 20 MAF bins. We used n = 360 unrelated individuals of European descent with both RNA sequencing data from GEUVADIS25 and whole genome sequencing data from 1000 Genomes Project (1000G)24. After extensive quality control to remove genes not expressed in LCLs, our data set includes 10,203 autosomal genes (see Supplementary Note). For each gene, we extracted all variants within 1Mb of the transcription start or end sites (corresponding to an average of 13,839 variants per gene, 35.2% are singletons); we do not consider trans-effects because of the small sample size (though we do analyze the effects of varying the window size in the Supplementary Note).
To control for possible non-normality, population structure, and batch effects, we quantile-normalize expression values and include the first 10 principal components (PCs) from both the genetic and phenotypic data in all analyses, and present the average h2 estimate across genes in each MAF bin in Fig. 2a (blue curve). We find that h2 is highest for the first MAF bin (singletons). However, using a novel trans-permutation procedure, we detected evidence for residual population stratification in low frequency (but not high frequency) SNPs that could not be accounted for using PCs (pink curve and see Supplementary Note, and note that differential population structure among common and rare variants is a documented, though understudied, phenomenon in human genetics30). We correct for this population stratification bias by subtracting the permutation-based estimate from the raw PC-corrected h2 estimate, shown in purple and henceforth indicated as h2’. We find that the plurality of h2’ comes from singletons, but common variants also contribute a substantial amount towards h2’. Low and intermediate frequency SNPs make a minimal contribution to h2’. Note that this is a conservative correction because our trans-permutations capture both the effect of stratification and true trans-heritability.
Figure 2. Partitioning heritability.
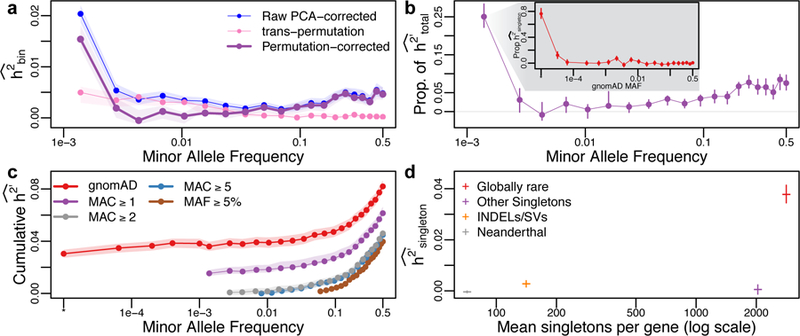
Rare variants (RVs) dominate the genetic architecture of human gene expression. (a) Average heritability estimates across genes, partitioned across minor allele frequency (MAF) bins (h2’, purple) after correcting for population structure using PCA (blue) and eliminating residual rare variant structure identified using a trans-permutation (pink). (b) The proportion of heritability attributed to each MAF bin. Singletons represent ~25% of the total inferred heritability, the vast majority of which is due to variants that are extremely rare in the population (inset, partitioning singletons in our data by the MAF observed in gnomAD, n > 15k; singletons not reported in gnomAD are indicated by *). (c) Cumulative h2’ inferred as a function of MAF for different frequency filter thresholds (purple, green, blue, brown), and when singletons are partitioned by population MAF (based on gnomAD, red). Including all SNPs and partitioning singletons by population MAF (instead of observed MAF) results in a substantially increased level of h2’. (d) Globally rare singletons represent 56% of all singletons, but contribute 93% of h2’singleton. Rare INDELs and structural variants (SVs) also have enriched contributions to heritability (2.8% of singletons but 7.8% of h2’singleton). However, singletons inferred to derive from Neanderthal introgression or have gnomAD MAF ≥ 10−4 make negligible contributions to h2’singleton. In all cases, confidence intervals/envelopes are based on the 95% quantile range of 1000 bootstrap simulations. PCA, principal component analysis; MAC, minor allele count.
Fig. 2b shows the proportion of h2’ explained by each MAF bin, showing that singletons represent ~25% of the total h2’, dominating the estimates from other MAF bins. Based on population genetic theory9,10,12,31, we hypothesized that purifying selection has constrained causal regulatory alleles to low frequency. To test this hypothesis, we sorted our singletons by their population MAF, as inferred from a large, external database. We reasoned that some of the singletons in our dataset will be evolutionarily neutral and have an intermediate population frequency, but the singletons that are most deleterious will almost always be constrained to low population frequency. We therefore partitioned singletons observed in our data by their MAF observed in the gnomAD dataset (representing high coverage whole genome sequencing on >15,000 individuals), and performed H-E inference of h2’ across 20 singleton bins based on their MAF observed in gnomAD (we also partitioned by functional predictions and evolutionary conservation, see Supplementary Note). The inset in Fig. 2b shows that the vast majority (>90%) of singleton h2’ derives from variants that have gnomAD MAF < 0.01%. This is strong evidence that natural selection constrains alleles with the largest effects on gene regulation to very low frequency. Note that we found that 31% of our singletons were not reported in gnomAD, but this subset of variants (indicated with MAF = “*” in Fig. 2b) nonetheless explains ~80% of h2’singleton. We confirm that the majority of this signal derives from true-positive singletons by analyzing a subset of 58 individuals with high coverage whole genome sequencing, and estimate that 88% of h2’singleton derives from variants that validate (Supplementary Note). Previous work has shown that additionally partitioning common variants by linkage disequilibrium (LD) resulted in minimal change after partitioning by MAF5.
Studies of heritability typically filter out rare variants5,15,32. We show that removing any SNPs based on MAF has a direct impact on the estimate of heritability. Fig. 2c shows the cumulative h2 inferred as a function of MAF for different minor allele count (MAC) thresholds (averaged over all genes). We find that adding progressively rarer variants to the analysis results in a monotonic increase in the inferred heritability. Including all variants down to singletons (purple curve) increases by approximately 50% compared to the case when only common variants (MAF ≥ 5%) are analyzed (brown curve, ), indicating that common variants are not able to tag heritability from lower frequency variants (i.e. “synthetic association” tagging33 is minimal, though rare variants can tag some common variant heritability, see Supplementary Note). However, not all singletons contribute equally to heritability, and pooling them together can deflate h2’ estimates (a “singleton LD” effect previously only reported for common variants5,28, see Supplementary Note). Partitioning singletons into 6 bins based on their observed MAF in gnomAD (red curve) increases our estimate to 0.082, and shows that nearly half of the total heritability (46.6%) is explained by the 27.6% of variants that are globally rare (with MAFgnomAD < 0.1%).
Recent studies of gene expression variation in humans have suggested that one-quarter of Neanderthal-introgressed haplotypes have cis-regulatory effects34, and that expression outliers are enriched for having nearby rare structural variants (SVs) compared to non-outliers8. However, the overall contribution of these classes of variants to expression variation had not been characterized. We performed H-E regression on four disjoint categories of singletons (Neanderthal-introgressed, indels/SVs, globally rare singletons, and other singletons), and found that globally rare singletons (i.e., singletons in our data that are also singletons across all 2,504 samples in 1000 Genomes Project24) contribute the vast majority (97%) of singleton heritability (Fig. 2d). Rare indels/SVs also have an enriched contribution to gene expression variation (representing 2.8% of singletons, but 6.8% of h2singleton), but Neanderthal-introgressed singletons and other singletons make a negligible contribution to h2’singleton.
Genotype quality does not drive inference of heritability
One possible confounding factor is the effect of genotyping error on heritability estimation35. If heritability is biased by genotyping error, and genotyping error also varies as a function of MAF, there could be differential bias across frequency bins when analyzing real data. We simulated a range of genotyping error models, and found that all investigated forms of genotyping error increase variance of heritability estimation, but did not induce a detectable upward bias (Supplementary Note).
We also performed several analyses to examine possible confounding effects in these data (Supplementary Note). First, we ranked singletons by their reported genotype likelihood as reported for the individual carrying the singleton allele in 1000G24, and partitioned them into four equal groups (quartiles). We then ran H-E regression with these four groups of singletons (along with 10 PCs). Notably, we find that only those singletons with high SNP quality contribute positively to our inference of heritability (see Supplementary Note). Second, since both the DNA and RNA sequencing are based on lymphoblastoid cell lines, it is conceivable that difficult-to-sequence regions of the genome could result in correlated errors that confound our inference. To test this, we restricted our analysis to regions of the genome passing the 1000G Strict Mask24, and found that our inference of heritability was unchanged. We further ranked genes based on the number of exon bases passing the strict mask, and found no difference in the genetic architecture of genes having high versus low overlap with the Strict Mask (see Supplementary Note). Finally, a subset of n = 58 samples were sequenced at high coverage by Complete Genomics Inc (CGI) as part of the 1000G24. We identified the singletons carried by these individuals, and partitioned them into four groups by cross classifying them as being present or absent in the CGI or gnomAD datasets. Running H-E regression on this subset of individuals shows that h2’singleton is predominantly driven by singletons that replicate in the CGI data but are not reported in gnomAD (consistent with Figure 2), and that singletons that are absent from CGI (and are therefore more likely to be false-positives) contribute negligibly to h2’singleton (Supplementary Note).
Selection drives genetic architecture of gene expression
We found that rare variants are a major source of heritability of gene expression, which we hypothesized was due to purifying selection constraining the frequencies of large-effect alleles. To test this hypothesis, we performed extensive simulations of human evolutionary history36,37, and developed a novel method to infer the parameters of an evolutionary model for complex traits (see Supplementary Note). Our three-parameter phenotype model extends a previously described model of the pleiotropy of causal variation11 (captured by , where increasing values indicate higher correlations among expression effect sizes and the fitness effects acting on causal variants), and the scaling relationship between expression effect sizes and selection coefficients9 (, where increasing values indicate that the distribution of effect sizes has a longer tail toward strong effects), to include the overall strength of selection (, a mixture parameter between strong and weak selection distributions, where = 1 corresponds to strong selection). We inferred approximate posterior distributions for each of these parameters by rejection sampling38, which compares a set of informative summary statistics from genetic data simulated under a model of European demography39 and selection40,41 to the observed data (see Supplementary Note). Note that our inference procedure allows each parameter to vary across genes, but we only seek to infer the distribution of the average values of , , and across genes because we do not have statistical power to infer and for each gene. We rigorously evaluated the performance of this inference procedure with simulations, and found that we can infer and with fairly high accuracy, but (while broadly unbiased) is less informative (Supplementary Note).
Applying this model to our data, we find that purifying selection has had a major impact on the genetic architecture of human gene expression, and that a range of previously explored evolutionary models can plausibly explain the empirical data. In Fig. 3a, we plot the posterior distributions of the mean values of , , and , which suggest that on average: fitness effects acting on causal variants tend to follow the distribution inferred from conserved non-coding loci , but selection is pervasive in the sense that gene expression effect sizes are highly correlated with the fitness effects acting on causal variants. Fig. 3b shows that our data are consistent with a ridge of evolutionary scenarios that connect models in which causal alleles are highly modular (e.g. effect sizes are correlated with dampened fitness effects, as in the model of Eyre-Walker9, which assumes with intermediate ) and models with highly pleiotropic causal alleles and more extreme effect sizes (e.g., the Simons et al.11 model, which assumes , but a more moderate ). This observation could only be identified using our integrated model, and suggests highly heterogeneous processes acting on individual genes. Our parameter inference suggests that while mean and can vary substantially among the best-fitting models, individual genes tend to have extreme values (i.e., either 0 or 1) for all three parameters (Fig. 3a). Fig. 3c shows the cumulative proportion of h2 as a function of MAF from 1,000 bootstrap draws from our posterior distribution, along with the cumulative proportion of h2’ inferred from our data. As compared to a neutral evolutionary model (pink), the posterior draws (grey, representing points along the ridge of evolutionary phenotype models show in Fig. 2b) are all highly concordant with our data.
Figure 3. Pervasive purifying selection drives the genetic architecture of gene expression.
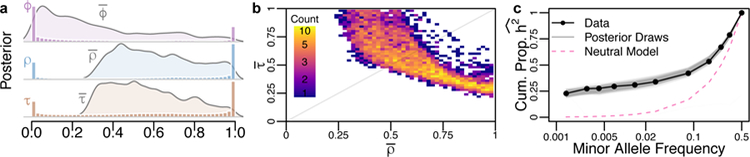
Our model infers the strength of purifying selection acting on causal variants (ϕ), the correlation between the fitness and the effect size of causal variants (ρ), and a scaling factor that transforms fitness into effect sizes (τ). (a) The posterior distribution of the mean of each parameter across genes (curves), as well as a histogram of the posterior parameter estimates for each gene. (b) The joint posterior distribution of the average ρ and τ across genes shows an evolutionary tradeoff between the correlation and scaling of fitness and effect sizes. (c) The cumulative proportion of heritability inferred from the gene expression data (dots) compared to the expected patterns from 1000 draws from the posterior distribution (grey) and neutral expectation (pink).
DISCUSSION
There is great interest in characterizing the genetic basis for complex traits to improve our understanding of human health and disease, and substantial resources are being spent to collect ever-larger cohorts to investigate the role of rare variants. Such studies will clarify what we have learned from our relatively small study of just 360 individuals. We developed, tested, and applied a novel technique for interrogating the role of rare variants in gene regulation using a relatively small cohort of n = 360 individuals who had whole genome DNA and RNA sequencing performed on their derived lymphoblastoid cell lines. We estimate that the total narrow sense heritability of LCL gene expression is ~8.2%, and that the largest contributors to gene expression heritability are the rarest of variants in our data: singletons, where just one copy of the allele has been observed in our sample of 720 chromosomes (MAF = 0.0014). Globally rare variants (MAFgnomAD < 0.01%) explain ~90% of h2singleton, implying that many of these causal variants would remain singletons even if tens of thousands more samples were sequenced (and many more singletons would be discovered). However, given that the plurality of variants are ultra-rare, do we infer more heritability than would be expected given the fraction of variants observed at these frequencies? In the Supplementary Note, we show that heritability enrichment is “U” shaped as a function of MAF (on a log-scale), suggesting that both rare and common alleles contribute >2-fold excess of heritability, while intermediate/low frequency variants (MAF 0.1%−5%) compose a dearth of heritability. This does not give us direct insight into the underlying distribution of regulatory effect sizes per causal variant, but would be reasonable to speculate that the distribution of effect sizes for rare causal variants may be considerably larger (in absolute value) than common variants.
This excess of heritability due to ultra-rare variants is best explained by pervasive purifying selection, where most cis-acting regulatory variants are deleterious. We inferred parameters of an evolutionary model that are consistent with these data, and found that for ~2/3 of genes, effect sizes of cis-regulatory variants are highly correlated with how deleterious the fitness effects are on causal variants. Further, for the majority of genes, the fitness effects are more consistent with broadly defined conserved non-coding regions of the genome40 than the strongly selected nonsynonymous41 or ultra-conserved regions of the genome42. However, while these parameters allow us to generate simulated data consistent with our observations, they remain post hoc parametric models that do not necessarily represent a generative model of how the genetic architecture of cis-regulatory variation evolved, and do not incorporate potentially important contributions from other modes of natural selection (such as positive selection or balancing selection, which may be rare but can have substantial impact on gene expression when they act43).
Our estimate of total cis-heritability is slightly larger than the previous estimates of h2cis = 0.057 and h2cis = 0.055 in blood and adipose respectively44, but lower than recent twin-based estimates of overall narrow-sense heritability h2 = 0.26, 0.21, and 0.16 in adipose, LCLs, and skin respectively45 as well overall broad-sense heritability H2 = 0.38 and 0.32 for LCLs and whole blood46. It is therefore plausible that rare variants account for some “missing heritability” in human gene expression, but differences in population, tissue, and/or technology could also explain some of these patterns, and there could also be differences between the genetic architecture of cis-regulation and trans-regulation.
A concurrent examination of rare variant heritability via an allele specific expression approach47 reports a lower, but still substantial, contribution to heritability from rare variation. However, there are fundamental differences between our analyses that likely contribute to the difference in estimates. First, their work examines a much narrower window around genes. This will lead to differences if selection has acted differently in promoters compared to more distal regulatory regions48 (Supplementary Note). Second, their work uses a smaller sample size and so their definition of rare is less stringent than ours. Finally, they do not reclassify rare variants according to external reference panels, which greatly increased our estimates of rare variant heritability.
While it might at first seem logical to genotype some (or all) of these singletons in a larger panel of individuals to statistically identify the causal ones, our analysis uncovered a major challenge with this approach: our results can only be explained if the causal alleles driving heritability are evolutionarily deleterious, with effect sizes often scaling with the strength of selection acting on them. This means that the alleles that have the greatest impact on gene expression are likely to be extremely rare in the broader population, and are unlikely to exist in more than a few unrelated individuals in any given population. Indeed, our analysis shows that 90% of the singleton heritability derives from alleles that are either not reported or have MAF < 0.01% in the n > 15,000 samples in gnomAD. We therefore conclude that identifying causal alleles for transcriptional variation will likely require the incorporation of new biological information, possibly including large-scale experimental testing of singleton variants to improve functional predictions.
As the number of samples with detailed phenotype data and WGS data increases, it will be possible to apply the approach we have developed here to characterize the genetic architecture of additional complex traits. Indeed, in a recent WGS study of height and BMI, we found that rare variants comprise essentially the entirety of “missing heritability” for these traits49. By integrating such methods with functional genomic data, we may also learn more about the biology of causal variants, which could enable improved identification of clinically actionable variants in some cases. However, it is not clear that risk prediction from genomic data for most diseases will be feasible for otherwise healthy individuals with limited family history information. Population genetic theory tells us that rare variants will only be a significant source of heritability when causal alleles are evolutionarily deleterious. But the biology of human health and disease is complex. While not all human diseases will themselves impart a strong fitness effect, extensive pleiotropy resulting from tightly interconnected networks of interacting proteins experiencing cell-specific regulatory mechanisms could. Indeed, under the omnigenic model of disease, variants that affect any one of these components could contribute to an individual’s risk for any disease involving any downstream pathway23.
We developed an approach to examine the heritability of singleton variants, and the results have important implications for future genetic studies. We rigorously evaluated the performance of our inference procedure using extensive simulations and multiple types of permutations (see Supplementary Note). While we employed several approaches to test for the presence of confounders from population structure, genotyping/mapping error, and cell line artifacts, there may be other unknown confounders that have biased the results of this study. We conservatively used quantile normalization on the expression phenotypes to enforce normality, and this often reduces the overall heritability estimates (see Supplementary Note) by diminishing the impact of outliers8,50. There are several other contributors to broad sense heritability that we have not attempted to model and may also account for some of the heritability estimated in family-based studies, such as gene-gene interactions, gene-environment interactions, and other non-additive components.
ONLINE METHODS
The full methodological details can be found in the Supplementary Note accompanying this manuscript (along with simulation results, testing robustness of model assumptions, and evolutionary modeling). Here we provide details of the primary methods used for data analysis.
Frequency binned Haseman-Elston (H-E) regression
Given genotypes at M SNPs over N individuals we consider additive phenotypic models such that the phenotype of individual i is: , where is the genotype of individual i at SNP j, is the effect size of SNP j, and is the residual, i.i.d. normally distributed noise of individual i. We partition the SNPs into K disjoint sets determined by the minor allele frequency (MAF) of each SNP (or some other characteristic indicated in the text) and wish to estimate the contribution of SNPs in the kth set to the heritability of y: ; where is the genetic variance contributed by all of the SNPs in the kth partition, is the total genetic variance, and is the total phenotypic variance, assumed equal to 1 going forward.
To infer the heritability of gene expression levels across individuals, we primarily rely on Haseman-Elston (H-E) regression26. The premise of H-E regression is that heritability can be estimated by the correlation between the phenotypic covariance across individuals and the genotypic covariance across individuals. In practice, for a single gene, we estimate the phenotypic covariance (P) as the upper triangle of the outer product of quantile-normalized log2(FPKM) across our sample. For each of the K partitions, we estimate genotypic covariance with the upper triangle of a kinship matrix generated from all SNPs in the partition. Given a standardized genotype matrix of SNPs in the kth partition (Gk, with N rows and Mk columns, where each column has mean 0 and unit variance), the kth kinship matrix is . H-E regression is then performed using the lm() function in R:
Specifically, the regression is ordinary least squares applied to the (vectorized) strict upper triangles of these matrices (which, for N individuals has elements). In H-E regression, with scaled and centered genotypes and phenotypes, the effect size for the kth term represents the genetic variance explained by the kth SNP partition , with the total genetic variance explained by all SNPs given by . In the absence of other genetic contributions to phenotypic variation, heritability is equal to the total additive genetic variance explained by SNPs, . Therefore, in most instances in this paper we simply refer to the genetic variance explained as heritability.
In general, we included the first 10 principal components (PCs) generated from our genome-wide genotype matrix as well as the first 10 PCs generated from our transcriptome-wide expression matrix (described below). We show in our Supplementary Note that the number of PCs included does not qualitatively impact our results. Formally, we include the jth PC (or an arbitrary numerical covariate) by adding the upper triangle of the PC’s (or covariate’s) outer product with itself to our symbolic regression equation above. Our results suggest that inclusion of PCs and other covariates did not completely account for population structure, especially in the low frequency bins. We therefore relied on a trans sampling approach (see Supplementary Note) to account for residual population structure. Importantly, these results suggest that other investigations into rare variant heritability may not be completely accounting for population structure by simply including PC covariates.
GEUVADIS data set and QC
GEUVADIS: Genetic European Variation in Health and Disease, A European Medical Sequencing Consortium25. RNA-sequencing gene expression data were downloaded from www.geuvadis.org. This dataset contains 375 individuals of European descent from four locations. Each of these individuals are contained in the 1000 Genomes Project, and genome sequence data were downloaded from www.1000genomes.org24.
The GEUVADIS data consists of RNA-seq data for 464 lymphoblastoid cell line (LCL) samples from five populations in the 1000 genomes project. Of these, 375 are of European ancestry (CEU, FIN, GBR, TSI) and 89 are of African ancestry (YRI). In these analyses, we considered only the European ancestry samples. Some individuals were previously identified as having cryptic relatedness by the 1000 Genomes Project24 using Identity by State (IBS) analyses and were therefore pruned. Our resulting dataset contains 360 unrelated individuals of European descent from four populations. Raw RNA-sequencing reads obtained from the European Nucleotide Archive were aligned to the transcriptome using UCSC annotations matching hg19 coordinates. RSEM [RNA-Seq by Expectation-Maximization, RSEM51] was used to estimate the abundances of each annotated isoform and total gene abundance is calculated as the sum of all isoform abundances normalized to one million total counts or transcripts per million (TPM). For each population, TPMs were log2 transformed and median normalized to account for differences in sequencing depth in each sample. The genotype data was obtained from 1000 Genomes Project Phase 3 V5 data set24. To remove potential confounders such as population structure and batch effects, we performed principal component analysis (PCA).
PCA analyses
PCA was performed on both genome-wide genotype data as well as transcriptome-wide expression data. We obtained expression PCs from www.geuvadis.org, and ran PCA on the WGS data as follows. Input files:
1000 Genomes Phase 3 V5 variant call files
VCFtools [v0.1.14]52 to filter out related individuals, exclude singletons sites, remove indels, filter out all non-biallelic sites.
PLINK [v1.90b3x]53 was used to identify sites approximately in linkage equilibrium r^2 < 0.2 examining 50 kb windows in 5 site increments, extract these sites, and recode in an additive model (0, 1, 2).
R (https://www.r-project.org/) was used to concatenate chromosomes, and run principal component analysis on the centered and scaled genotype matrix.
We also ran PCA on the genotype data with a higher MAF filter (MAF≥5%) and got highly correlated results. However, because our analysis is based on rare variants, we wanted to include signals of population structure that manifest primarily in rare variants, hence including all variants seen at least twice.
We then checked for residual population structure using permutations. We first applied the standard permutation style, whereby phenotypes are shuffled among individuals prior to running H-E. We found that this removed all signals in the data and gives . We then developed another permutation, which we refer to as a trans-permutation. In this case, we maintain the order of gene expression and genotypes among individuals, but we perform H-E regression on the SNPs in a window around one gene with the expression values of a random autosomal gene (i.e., a gene in trans). We show the results of this permutation in Figure 1a and in several Supplementary figures. We find that there exists some degree of residual population structure for rare variants, but not common variants (despite the fact that we included rare variants in our PCA analysis). The main caveat with this approach is that we are unable to distinguish population structure from pervasive true trans-effects, but we argue removing the residual from the trans-permutation is conservative.
Constructing bootstrap confidence intervals.
In main text Figure 2 and in the Supplementary Note, we compare heritability estimates in many ways. Our primary approach to estimating uncertainty was based on rigorous bootstrapping. Except where noted, all error bars (sometimes plotted as envelopes encompassing the mean) were calculated from the 95% interquantile range of 1,000 bootstrap samples. This is an appropriate method for estimating uncertainty in i.i.d. data, and has previously been shown to work well in far broader settings50. Further, bootstrapping is a statistically appropriate way to estimate uncertainty when analyzing functions of correlated parameter estimates (for example, when estimating total h2, which is the sum across h2 estimates per bin). These bootstrap intervals represent uncertainty in the across-gene average heritability estimates per category (indeed, the single gene uncertainties are much larger), and retains any across-gene correlations that are present in the real data. Hence, our SE estimates naturally account for correlated expression.
Evolutionary modeling and parameter inference
We suppose that gene expression is evolutionarily optimized, such that mutations that affect gene expression levels are deleterious. While many different evolutionary models can encode this qualitative behavior, we choose a previously studied theoretical model that allows for variation in pleiotropy and selection strength across genes (Uricchio et al.10).
We used rejection sampling to infer evolutionary parameters. Rejection sampling compares a set of informative summary statistics computed on the output of model-based simulations to observed genomic and phenotypic data. The simulations that generate summary statistics that are most similar to the observed data are retained, and the parameter values from the retained simulations are used to generate a posterior distribution over the true parameter values. Here, we take the proportion of variance explained by alleles up to minor allele count x as summary statistics, for x in {1,2,5,10,20,60,120,180,240,360}. We focus on inferring the mean strength of selection (2Ns), the correlation between selection strength and effect size (ρ), and the mean shape of the effect size distribution (τ). We infer the posterior distribution of the mean of each of these parameters across genes as opposed to the parameter values for individual genes because single gene estimates proved too noisy to be reliably computed.
Supplementary Material
ACKNOWLEDGMENTS
We thank Hyun Min Kang, Adam Auton, Sasha Gusev, and two anonymous reviewers for discussions about possible confounders that improved our analysis; members of the Pritchard lab for comments on rejection sampling; Jeffrey Barrett and Konrad Karczewski for peer review of our preprint; Raul Torres for assistance with data analysis; Jeffrey Wall for assistance with Neanderthal-introgressed alleles; and Aria Hernandez for discussions on figure colors. Research reported in this publication was supported by National Human Genome Research Institute of the National Institutes of Health under award number R01HG007644 to RDH and K25HL121295. LHU was supported by IRACDA NIGMS grant K12GM088033, KH was supported by a Gilliam Fellowship, and AD was supported by U01HG009080 and R01HG006399.
Footnotes
DATA AVAILABILITY
GEUVADIS: Genetic European Variation in Health and Disease, A European Medical Sequencing Consortium25. RNA-sequencing gene expression data were downloaded from http://www.internationalgenome.org/data-portal/data-collection/geuvadis. This dataset contains 375 individuals of European descent from four locations. Each of these individuals are contained in the 1000 Genomes Project, and genome sequence data were downloaded from www.1000genomes.org.24
CODE AVAILABILITY
Three open source software tools are being made available as part of this study, all available on GitHub:
HEh2.R – R code that performs all H-E analyses and simulations discussed in this paper. Also implements AI algorithm for parameter inference of LMM. Available here: https://github.com/hernrya/HEh2. Contact: Ryan Hernandez <ryan.hernandez@me.com>.
SingHer R package – Singleton Heritability inference with REML, discussed in Supplementary Note, with performance statistics, and available here: https://github.com/andywdahl/SingHer. Contact: Andrew Dahl <andywdahl@gmail.com>, Noah Zaitlen <noahaz@gmail.com>.
Rejection sampling: Scripts demonstrating how we used rejection sampling to infer parameters of the phenotype model are available here https://github.com/uricchio/HE_scripts. Contact: Lawrence Uricchio <uricchil@gmail.com>.
COMPETING INTEREST STATEMENT
The authors declare no competing interests.
REFERENCES:
- 1.Keinan A & Clark AG Recent explosive human population growth has resulted in an excess of rare genetic variants. Science 336, 740–743 (2012). [DOI] [PMC free article] [PubMed] [Google Scholar]
- 2.Bamshad MJ et al. Exome sequencing as a tool for Mendelian disease gene discovery. Nat. Rev. Genet 12, 745–755 (2011). [DOI] [PubMed] [Google Scholar]
- 3.Zhao J et al. A Burden of Rare Variants Associated with Extremes of Gene Expression in Human Peripheral Blood. Am. J. Hum. Genet 98, 299–309 (2016). [DOI] [PMC free article] [PubMed] [Google Scholar]
- 4.Montgomery SB, Lappalainen T, Gutierrez-Arcelus M & Dermitzakis ET Rare and common regulatory variation in population-scale sequenced human genomes. PLoS Genet 7, e1002144 (2011). [DOI] [PMC free article] [PubMed] [Google Scholar]
- 5.Yang J et al. Genetic variance estimation with imputed variants finds negligible missing heritability for human height and body mass index. Nat. Genet 47, 1114–1120 (2015). [DOI] [PMC free article] [PubMed] [Google Scholar]
- 6.Gaugler T et al. Most genetic risk for autism resides with common variation. Nat. Genet 46, 881–885 (2014). [DOI] [PMC free article] [PubMed] [Google Scholar]
- 7.Fuchsberger C et al. The genetic architecture of type 2 diabetes. Nature 536, 41–47 (2016). [DOI] [PMC free article] [PubMed] [Google Scholar]
- 8.Li X et al. The impact of rare variation on gene expression across tissues. Nature 550, 239–243 (2017). [DOI] [PMC free article] [PubMed] [Google Scholar]
- 9.Eyre-Walker A Evolution in health and medicine Sackler colloquium: Genetic architecture of a complex trait and its implications for fitness and genome-wide association studies. Proc. Natl. Acad. Sci. USA 107 Suppl 1, 1752–1756 (2010). [DOI] [PMC free article] [PubMed] [Google Scholar]
- 10.Uricchio LH, Zaitlen NA, Ye CJ, Witte JS & Hernandez RD Selection and explosive growth alter genetic architecture and hamper the detection of causal rare variants. Genome Res 26, 863–873 (2016). [DOI] [PMC free article] [PubMed] [Google Scholar]
- 11.Simons YB, Turchin MC, Pritchard JK & Sella G The deleterious mutation load is insensitive to recent population history. Nat. Genet 46, 220–224 (2014). [DOI] [PMC free article] [PubMed] [Google Scholar]
- 12.Lohmueller KE The impact of population demography and selection on the genetic architecture of complex traits. PLoS Genet 10, e1004379 (2014). [DOI] [PMC free article] [PubMed] [Google Scholar]
- 13.Das S et al. Next-generation genotype imputation service and methods. Nat. Genet 48, 1284–1287 (2016). [DOI] [PMC free article] [PubMed] [Google Scholar]
- 14.McCarthy S et al. A reference panel of 64,976 haplotypes for genotype imputation. Nat. Genet 48, 1279–1283 (2016). [DOI] [PMC free article] [PubMed] [Google Scholar]
- 15.Mancuso N et al. The contribution of rare variation to prostate cancer heritability. Nat. Genet 48, 30–35 (2016). [DOI] [PMC free article] [PubMed] [Google Scholar]
- 16.Schoech A et al. Quantification of frequency-dependent genetic architectures and action of negative selection in 25 UK Biobank traits. BioRxiv (2017). doi: 10.1101/188086 [DOI] [PMC free article] [PubMed] [Google Scholar]
- 17.Gazal S et al. Linkage disequilibrium-dependent architecture of human complex traits shows action of negative selection. Nat. Genet 49, 1421–1427 (2017). [DOI] [PMC free article] [PubMed] [Google Scholar]
- 18.Zeng J et al. Signatures of negative selection in the genetic architecture of human complex traits. Nat. Genet 50, 746–753 (2018). [DOI] [PubMed] [Google Scholar]
- 19.Pritchard JK Are rare variants responsible for susceptibility to complex diseases? Am. J. Hum. Genet 69, 124–137 (2001). [DOI] [PMC free article] [PubMed] [Google Scholar]
- 20.Gusev A et al. Quantifying missing heritability at known GWAS loci. PLoS Genet 9, e1003993 (2013). [DOI] [PMC free article] [PubMed] [Google Scholar]
- 21.Maurano MT et al. Systematic localization of common disease-associated variation in regulatory DNA. Science 337, 1190–1195 (2012). [DOI] [PMC free article] [PubMed] [Google Scholar]
- 22.Bulik-Sullivan BK et al. LD Score regression distinguishes confounding from polygenicity in genome-wide association studies. Nat. Genet 47, 291–295 (2015). [DOI] [PMC free article] [PubMed] [Google Scholar]
- 23.Boyle EA, Li YI & Pritchard JK An expanded view of complex traits: from polygenic to omnigenic. Cell 169, 1177–1186 (2017). [DOI] [PMC free article] [PubMed] [Google Scholar]
- 24.1000 Genomes Project Consortium et al. A global reference for human genetic variation. Nature 526, 68–74 (2015). [DOI] [PMC free article] [PubMed] [Google Scholar]
- 25.Lappalainen T et al. Transcriptome and genome sequencing uncovers functional variation in humans. Nature 501, 506–511 (2013). [DOI] [PMC free article] [PubMed] [Google Scholar]
- 26.Golan D, Lander ES & Rosset S Measuring missing heritability: inferring the contribution of common variants. Proc. Natl. Acad. Sci. USA 111, E5272–81 (2014). [DOI] [PMC free article] [PubMed] [Google Scholar]
- 27.Yang J, Zaitlen NA, Goddard ME, Visscher PM & Price AL Advantages and pitfalls in the application of mixed-model association methods. Nat. Genet 46, 100–106 (2014). [DOI] [PMC free article] [PubMed] [Google Scholar]
- 28.Speed D, Hemani G, Johnson MR & Balding DJ Improved heritability estimation from genome-wide SNPs. Am. J. Hum. Genet 91, 1011–1021 (2012). [DOI] [PMC free article] [PubMed] [Google Scholar]
- 29.Speed D et al. Reevaluation of SNP heritability in complex human traits. Nat. Genet 49, 986–992 (2017). [DOI] [PMC free article] [PubMed] [Google Scholar]
- 30.Mathieson I & McVean G Differential confounding of rare and common variants in spatially structured populations. Nat. Genet 44, 243–246 (2012). [DOI] [PMC free article] [PubMed] [Google Scholar]
- 31.Simons YB, Bullaughey K, Hudson RR & Sella G A model for the genetic architecture of quantitative traits under stabilizing selection (2017).
- 32.Yang J et al. Common SNPs explain a large proportion of the heritability for human height. Nat. Genet 42, 565–569 (2010). [DOI] [PMC free article] [PubMed] [Google Scholar]
- 33.Dickson SP, Wang K, Krantz I, Hakonarson H & Goldstein DB Rare variants create synthetic genome-wide associations. PLoS Biol 8, e1000294 (2010). [DOI] [PMC free article] [PubMed] [Google Scholar]
- 34.McCoy RC, Wakefield J & Akey JM Impacts of Neanderthal-Introgressed Sequences on the Landscape of Human Gene Expression. Cell 168, 916–927.e12 (2017). [DOI] [PMC free article] [PubMed] [Google Scholar]
- 35.Chen L, Liu P, Evans TC & Ettwiller LM DNA damage is a pervasive cause of sequencing errors, directly confounding variant identification. Science 355, 752–756 (2017). [DOI] [PubMed] [Google Scholar]
- 36.Uricchio LH, Torres R, Witte JS & Hernandez RD Population genetic simulations of complex phenotypes with implications for rare variant association tests. Genet. Epidemiol 39, 35–44 (2015). [DOI] [PMC free article] [PubMed] [Google Scholar]
- 37.Hernandez RD A flexible forward simulator for populations subject to selection and demography. Bioinformatics 24, 2786–2787 (2008). [DOI] [PMC free article] [PubMed] [Google Scholar]
- 38.Tavaré S, Balding DJ, Griffiths RC & Donnelly P Inferring coalescence times from DNA sequence data. Genetics 145, 505–518 (1997). [DOI] [PMC free article] [PubMed] [Google Scholar]
- 39.Tennessen JA et al. Evolution and functional impact of rare coding variation from deep sequencing of human exomes. Science 337, 64–69 (2012). [DOI] [PMC free article] [PubMed] [Google Scholar]
- 40.Torgerson DG et al. Evolutionary processes acting on candidate cis-regulatory regions in humans inferred from patterns of polymorphism and divergence. PLoS Genet 5, e1000592 (2009). [DOI] [PMC free article] [PubMed] [Google Scholar]
- 41.Boyko AR et al. Assessing the evolutionary impact of amino acid mutations in the human genome. PLoS Genet 4, e1000083 (2008). [DOI] [PMC free article] [PubMed] [Google Scholar]
- 42.Katzman S et al. Human genome ultraconserved elements are ultraselected. Science 317, 915 (2007). [DOI] [PubMed] [Google Scholar]
- 43.Andrés AM et al. Balancing selection maintains a form of ERAP2 that undergoes nonsense-mediated decay and affects antigen presentation. PLoS Genet 6, e1001157 (2010). [DOI] [PMC free article] [PubMed] [Google Scholar]
- 44.Price AL et al. Single-tissue and cross-tissue heritability of gene expression via identity-by-descent in related or unrelated individuals. PLoS Genet 7, e1001317 (2011). [DOI] [PMC free article] [PubMed] [Google Scholar]
- 45.Grundberg E et al. Mapping cis- and trans-regulatory effects across multiple tissues in twins. Nat. Genet 44, 1084–1089 (2012). [DOI] [PMC free article] [PubMed] [Google Scholar]
- 46.Powell JE et al. Genetic control of gene expression in whole blood and lymphoblastoid cell lines is largely independent. Genome Res 22, 456–466 (2012). [DOI] [PMC free article] [PubMed] [Google Scholar]
- 47.Glassberg EC, Gao Z, Harpak A, Lan X & Pritchard JK Measurement of selective constraint on human gene expression. BioRxiv (2018). doi: 10.1101/345801 [DOI] [PMC free article] [PubMed] [Google Scholar]
- 48.Consortium GTEx et al. Genetic effects on gene expression across human tissues. Nature 550, 204–213 (2017). [DOI] [PMC free article] [PubMed] [Google Scholar]
- 49.Taliun D et al. Sequencing of 53,831 diverse genomes from the NHLBI TOPMed Program. BioRxiv (2019). doi: 10.1101/563866 [DOI] [PMC free article] [PubMed] [Google Scholar]
- 50.Schweiger R et al. Detecting heritable phenotypes without a model using fast permutation testing for heritability and set-tests. Nat. Commun 9, 4919 (2018). [DOI] [PMC free article] [PubMed] [Google Scholar]
- 51.Li B & Dewey CN RSEM: accurate transcript quantification from RNA-Seq data with or without a reference genome. BMC Bioinformatics 12, 323 (2011). [DOI] [PMC free article] [PubMed] [Google Scholar]
- 52.Danecek P et al. The variant call format and VCFtools. Bioinformatics 27, 2156–2158 (2011). [DOI] [PMC free article] [PubMed] [Google Scholar]
- 53.Chang CC et al. Second-generation PLINK: rising to the challenge of larger and richer datasets. Gigascience 4, 7 (2015). [DOI] [PMC free article] [PubMed] [Google Scholar]
Associated Data
This section collects any data citations, data availability statements, or supplementary materials included in this article.