

Abstract
Background
Small-scale studies suggest that hyperkalaemia is a less threatening condition in chronic kidney disease (CKD), arguing adaptation/tolerance to potassium (K+) retention. This study formally evaluates this hypothesis by estimating the distribution of plasma K+ and its association with mortality across CKD stages.
Methods
This observational study included all patients undergoing plasma K+ testing in Stockholm during 2006–11. We randomly selected one K+ measurement per patient and constructed a cross-sectional cohort with mortality follow-up. Covariates included demographics, comorbidities, medications and estimated glomerular filtration rate (eGFR). We estimated K+ distribution and defined K+ ranges associated with 90-, 180- and 365-day mortality.
Results
Included were 831 760 participants, of which 70 403 (8.5%) had CKD G3 (eGFR <60–30 mL/min) and 8594 (1.1%) had CKD G4–G5 (eGFR <30 mL/min). About 66 317 deaths occurred within a year. Adjusted plasma K+ increased across worse CKD stages: from median 3.98 (95% confidence interval 3.49–4.59) for eGFR >90 to 4.43 (3.22–5.65) mmol/L for eGFR ≤15 mL/min/1.73 m2. The association between K+ and mortality was U-shaped, but it flattened at lower eGFR strata and shifted upwards. For instance, the range where the 90-day mortality risk increased by no more than 100% was 3.45–4.94 mmol/L in eGFR >60 mL/min, but was 3.36–5.18 in G3 and 3.26–5.53 mmol/L in G4–G5. In conclusion, CKD stage modifies K+ distribution and the ranges that predict mortality in the community.
Conclusion
Although this study supports the view that hyperkalaemia is better tolerated with worse CKD, it challenges the current use of a single optimal K+ range for all patients.
Keywords: chronic renal failure, CKD, epidemiology, hyperkalaemia, potassium
INTRODUCTION
Hyperkalaemia, i.e. excess of circulating potassium (K+), is a potentially life-threatening electrolyte disorder [1]. Although it is agreed upon that there appears to be a U-shaped relationship between serum K+ and death [2–6], there remains a controversy as to the exact level of K+ at which the clinician should become concerned and consider altering therapy such as the renin–angiotensin–aldosterone system (RAAS) blockade [7–10]. The optimal serum K+ may depend on the underlying conditions. Maintenance of total body K+ homoeostasis is a major function of a healthy kidney. Chronic kidney disease (CKD), with subsequent failure to augment distal tubular K+ secretion, arises as one of the most important clinical predictors of hyperkalaemia occurrence [6, 11]. In addition to K+ retention, accompanying comorbidities and medications make CKD patients particularly prone to a state of chronic hyperkalaemia [5, 6].
Intriguingly, there is evidence suggesting that hyperkalaemia is a less threatening condition in CKD [3, 12–16], arguing adaptive mechanisms that render better tolerance to elevated K+ in circulation [17–22]. Most of these studies are of small scale and they include high-risk patients. In clinical practice, chronic mild hyperkalaemia is often interpreted as the normal state in patients with advanced CKD [6, 18]. This study evaluates this hypothesis by formally estimating K+ distribution in relation to estimated glomerular filtration rate (eGFR) and by exploring K+ ranges that predict mortality across worse CKD severity stages in a large healthcare system. As a secondary objective, and because plasma is the predominant source of K+ assessment in Sweden, we explored whether the observed optimal ranges approximated to current clinical K+ thresholds.
MATERIALS AND METHODS
Data sources and study population
Included individuals were selected from the Stockholm CREAtinine Measurements (SCREAM) project [23], a healthcare utilization cohort from the region of Stockholm, Sweden. SCREAM included all laboratory tests and healthcare utilization data from any individual who had plasma creatinine measured at least once during 2006–11 [23]. All standard laboratory tests performed for these individuals during that period were extracted; the data set was then linked to regional and national administrative databases with complete information on demographic data, healthcare use, diagnoses, validated renal outcomes, vital status and pharmacy-dispensed medications. The Regional Ethical Review Board in Stockholm approved the study.
Eligible patients for this study were all adult individuals (≥18 years old) with at least one plasma K+ measurement recorded in outpatient care between 2006 and 2011 with a concurrent plasma creatinine measurement (up to 1 year prior to index date). Implausible plasma creatinine (<25 or >1500 μmol/L) and plasma K+ (>10 mmol/L) values were discarded, and if multiple measurements were recorded on the same day, then their median value was considered. We censored at migration from the county or 31 December 2011; we also discarded individuals undergoing maintenance dialysis. Finally, we sampled at random one measurement per individual and set the index date as the date in which such measurement occurred. Baseline demographics, comorbid history and drug use (up to 6 months before index date) were defined at that point. The detailed flow chart of selection process for this study is depicted in Supplementary data, Figure S1.
Biochemical assessments and study covariates
Biochemical assessments were performed as part of healthcare encounters and by three different laboratories that provide services to the region [23]. Inter- and intra-laboratory variation was considered minimal, as the three laboratories were frequently being audited for quality and harmonization. Plasma creatinine measurements were standardized to isotope dilution mass spectrometry. Creatinine was used to calculate eGFR using the 2009 CKD-EPI creatinine-based equation [24], and categorized as <30 (mL/min/1.73 m2, eGFR category G4–G5), between 30 and 60 (eGFR G3) or ≥60 (eGFR G1–G2). Scandinavian countries adopted in the early 2000s plasma as the standard source for K+ in healthcare [25]. Plasma K+ tests accounted for 91% of all K+ measurements (the remaining being in serum) [11] and were measured by potentiometric titration.
Other study covariates were age at index date and sex. Clinical history of comorbidities (listed in Supplementary data, Table S1) was defined from relevant International Classification of Diseases, 10th edition codes by established algorithms [26]; the use of selected K+-sparing medications (listed in Supplementary data, Table S2) at index event was defined as a drug purchase during the 6 months before index date using Anatomical Therapeutic Chemical classification system codes.
Mortality outcomes
Mortality was ascertained via linkage with the Swedish living status registry that is updated monthly and has no loss to follow-up. The main study outcome was 90-day mortality; secondary outcomes were 180- and 365-day mortality.
K+ distribution within CKD strata
We modelled plasma K+ distribution using quantile regression that calculates the percentiles of the outcome distribution as a function of other covariates. We modelled 2.5, 50.0 and 97.5 percentiles, including all covariates (demographics, comorbidities and medications detailed above) present in at least 1% of individuals and all pairwise statistical interactions between age, sex and eGFR. eGFR and age were modelled by using restricted cubic splines, with knots at 15, 30, 45, 60, 90 mL/min/1.73 m2 and 45, 65, 75 years, respectively. Plasma K+ reference range (or normal range) was defined as the set of values where 95% of the population falls within (i.e. the interval between the 2.5th and 97.5th percentiles of the distribution). We predicted distribution ranges using the quantile regression models and predicted the percentiles under different combinations of eGFR categories, age categories, sex, comorbidities and drug use, setting the adjustment level for the remaining covariates to their median (or most frequent) value.
K+ ranges associated with mortality within CKD strata
First, we modelled the association between K+ values (as a continuous variable) and mortality using Cox regression models. The concept of ‘optimal’ K+ range is based on concentrations or levels that are associated with optimal health or minimal risk. The limits are defined as those where the health risks exceed a certain threshold. In this study, K+ ranges were defined as the range of values within which the mortality risk, quantified via the predicted hazard ratio (HR) from the above-mentioned models for a given eGFR category, increased by no more than 50% or 100%. We considered ranges where the mortality risk increased by no more than 50% as clinically relevant, and ranges where the mortality risk increased by no more than 100% as our most conservative estimation of clinical ranges. The central point, and reference value of each safe range was the value that yielded the lowest predicted risk for each eGFR category. We modelled K+ using restricted cubic splines with five knots at default percentiles, and we included an interaction term with eGFR category to test for effect modification. We adjusted each model by eGFR value, demographics, comorbidities and drug use. At every step, we graphically assessed and found satisfying the proportional hazards assumption for the validation models by plotting Schoenfeld residuals against ranks of time.
As a sensitivity analysis, we repeated the random sampling of index K+ per individual generating 99 additional study data sets. We performed all analyses again on these 99 data sets and compared them to evaluate if the random sampling process influenced the robustness and consistency of our results.
Statistical analyses
We present continuous variables as median with interquartile interval (IQI); categorical variables are presented as number with proportion. All data cleaning, tidying and statistical analyses were performed using R [27].
RESULTS
Descriptive characteristics
After applying inclusion and exclusion criteria (Supplementary data, Figure S1), we considered 831 760 participants with a median age of 55 years (IQI: 39–69) and 55% women. Median eGFR was 92 mL/min/1.73 m2 (77–106) and median plasma K+ was 4.00 mmol/L (3.80–4.20). As many as 752 403 (90.46%) individuals had an eGFR >60 mL/min/1.73 m2; 70 403 (8.46%) were in eGFR category G3 and 8594 (1.08%) were in eGFR category G4–G5. History of cardiovascular disease was present in 13.29% of participants, 37.39% had hypertension, 9.35% had diabetes and 9.74% had cancer. As many as 19.67% individuals were on RAAS inhibitors (RAASi) and 15.90% were using non-steroidal anti-inflammatory drugs (NSAIDs). The remaining descriptive characteristics are presented in Table 1, and these did not vary noticeably between the main data set and other 99 replicated data sets (Supplementary data, Table S3).
Table 1.
Descriptive characteristics overall and by eGFR category
| G1–G2 | G3 | G4–G5 | Overall | |
|---|---|---|---|---|
| Number of individuals | 752 403 | 70 403 | 8954 | 831 760 |
| Age (years), median (IQI) | 52.20 (37.07–65.39) | 80.73 (72.27–86.80) | 83.28 (73.57–88.79) | 55.01 (38.72–68.64) |
| <45 | 284 717 (37.84) | 1007 (1.43) | 251 (2.80) | 285 975 (34.38) |
| 45–64 | 273 544 (36.36) | 7384 (10.49) | 941 (10.51) | 281 869 (33.89) |
| 65–74 | 112 854 (15.00) | 13 811 (19.62) | 1287 (14.37) | 127 952 (15.38) |
| ≥75 | 81 288 (10.80) | 48 201 (68.46) | 6475 (72.31) | 135 964 (16.35) |
| Women | 412 036 (54.76) | 42 088 (59.78) | 4835 (54.00) | 458 959 (55.18) |
| Serum creatinine (µmol/L), median (IQI) | 70 (60–81) | 106 (91–121) | 200 (166–259) | 72 (62–84) |
| eGFR (mL/min/1.73 m2), median (IQI) | 94.72 (82.40–107.90) | 50.40 (42.95–55.79) | 23.34 (17.55–27.14) | 92.31 (77.45–106.24) |
| Plasma K+ (mmol/L), median (IQI) | 4.00 (3.80–4.20) | 4.20 (3.90–4.40) | 4.40 (4.00–4.80) | 4.00 (3.80–4.20) |
| History of kidney transplant | 344 (0.05) | 498 (0.71) | 230 (2.57) | 1072 (0.13) |
| Hypertension | 244 512 (32.50) | 58 178 (82.64) | 8341 (93.15) | 311 031 (37.39) |
| Cardiovascular disease | 73 159 (9.72) | 31 762 (45.11) | 5624 (62.81) | 110 545 (13.29) |
| Cerebrovascular disease | 33 491 (4.45) | 13 236 (18.80) | 2180 (24.35) | 48 907 (5.88) |
| Heart failure | 24 771 (3.29) | 18 302 (26.00) | 4003 (44.71) | 47 076 (5.66) |
| Myocardial infarction | 22 002 (2.92) | 9837 (13.97) | 2028 (22.65) | 33 867 (4.07) |
| Peripheral vascular disease | 13 662 (1.82) | 6917 (9.82) | 1411 (15.76) | 21 990 (2.64) |
| Diabetes mellitus | 61 013 (8.11) | 14 089 (20.01) | 2706 (30.22) | 77 808 (9.35) |
| Cancer | 64 555 (8.58) | 14 364 (20.40) | 2096 (23.41) | 81 015 (9.74) |
| COPD | 50 687 (6.74) | 9309 (13.22) | 1498 (16.73) | 61 494 (7.39) |
| Rheumatoid disease | 14 981 (1.99) | 4737 (6.73) | 719 (8.03) | 20 437 (2.46) |
| Liver disease | 14 850 (1.97) | 1530 (2.17) | 334 (3.73) | 16 714 (2.01) |
| Dementia | 9920 (1.32) | 5437 (7.72) | 805 (8.99) | 16 162 (1.94) |
| Peptic ulcer disease | 12 042 (1.60) | 3207 (4.56) | 713 (7.96) | 15 962 (1.92) |
| Hemiplegia/paraplegia | 4047 (0.54) | 505 (0.72) | 113 (1.26) | 4665 (0.56) |
| AIDS/HIV | 975 (0.13) | 39 (0.06) | 13 (0.15) | 1027 (0.12) |
| NSAIDs | 121 164 (16.10) | 10 242 (14.55) | 835 (9.33) | 132 241 (15.90) |
| RAASi | 126 684 (16.84) | 31 994 (45.44) | 4912 (54.86) | 163 590 (19.67) |
| ACEi | 76 656 (10.19) | 19 031 (27.03) | 3086 (34.47) | 98 773 (11.88) |
| ARBs | 54 890 (7.30) | 14 525 (20.63) | 2357 (26.32) | 71 772 (8.63) |
| MRAs | 9178 (1.22) | 6833 (9.71) | 1242 (13.87) | 17 253 (2.07) |
Values are represented as n (%) unless otherwise specified.
COPD, chronic obstructive pulmonary disease; AIDS/HIV, acquired immune deficiency syndrome/human immunodeficiency virus; ACEi, angiotensin-converting enzyme inhibitor; ARBs, angiotensin receptor blockers; MRAs, mineralocorticoid receptor antagonist.
K+ distribution within CKD strata
Median plasma K+ values and reference ranges [95% confidence interval (CI)] by eGFR strata are presented in Figure 1A. Median K+ levels were higher with lower kidney function, with a noticeable point of inflexion at the level of 45 mL/min/1.73 m2. For instance, a median plasma K+ of 3.98 mmol/L was observed in participants with eGFR between 91 and 105 mL/min/1.73 m2 compared with median plasma K+ of 4.56 mmol/L in participants with eGFR ≤15 mL/min/1.73 m2 (Table 2). The lower reference limit was rather stable across lower eGFR categories, but the upper reference limit increased with worse eGFR categories, from 4.45 for individuals with eGFR >105 to 5.95 mmol/L for individuals with eGFR ≤15 mL/min/1.73 m2 (Table 2). The distribution of plasma K+ values by eGFR strata is presented in Figure 1B, and it shows a gradual shift towards higher plasma K+ values across eGFR categories. Reference ranges by age, adjusting for renal function and all other covariates, were stable with minimal variation as age increased (Supplementary data, Figure S2 and Supplementary data, Table S4). The shift in K+ ranges in relation to kidney function was similarly observed when segregating results by age and sex (Supplementary data, Table S5 and Supplementary data, Figure S3).
FIGURE 1.

Reference ranges (95% CI) for plasma K+ by eGFR (A) and density distribution of plasma K+ by eGFR category (B). In (A), the red line represents the 50th percentile, and black lines represent 2.5th and 97.5th percentiles, with their corresponding 95% CIs in shadows. (A) The output of a quantile regression model adjusted by eGFR, age, sex, comorbidities (myocardial infarction, heart failure, peripheral vascular disease, cerebrovascular disease, dementia, rheumatoid disease, chronic obstructive pulmonary disease, peptic ulcer disease, liver disease, cancer, diabetes mellitus, hypertension) and ongoing medication (NSAIDs, angiotensin-converting enzyme inhibitor, angiotensin receptor blockers, mineralocorticoid receptor antagonists). eGFR and age were modelled by using restricted cubic splines, and all pairwise statistical interactions between eGFR, age and sex were included.
Table 2.
Median, 2.5th and 97.5th percentiles of K+ distribution per 15 mL/min/1.73 m2 increase in kidney function using quantile regression
| eGFR mL/min/1.73 m2 | Median (2.5–97.5%) |
|---|---|
| Overall | 4.04 (3.33–4.79) |
| >105 | 3.89 (3.29–4.46) |
| 91–105 | 3.98 (3.40–4.59) |
| 76–90 | 4.01 (3.44–4.63) |
| 61–75 | 4.04 (3.43–4.72) |
| 46–60 | 4.07 (3.33–4.91) |
| 31–45 | 4.22 (3.32–5.27) |
| 16–30 | 4.38 (3.33–5.57) |
| ≤15 | 4.43 (3.22–5.65) |
The quantile regression model was adjusted by eGFR, age, sex, comorbidities (myocardial infarction, heart failure, peripheral vascular disease, cerebrovascular disease, dementia, rheumatoid disease, chronic obstructive pulmonary disease, peptic ulcer disease, liver disease, cancer, diabetes mellitus, hypertension) and medication use (NSAIDs, angiotensin-converting enzyme inhibitors, angiotensin receptor blockers, mineralocorticoid receptor antagonists). eGFR and age were modelled by using restricted cubic splines, and all pairwise statistical interactions between eGFR, age and sex were included.
As a sensitivity analysis, we compared these ranges with those obtained by replicating the random K+ selection process 99 times more. Supplementary data, Table S6 shows the reference ranges obtained by selecting the mean and median extremities across all the replicates, the narrowest interval obtained and the widest interval obtained. The difference between the median value and normal ranges presented in the main analysis and those obtained from the replicates were considered as minimal.
Follow-up for mortality
During the first 90 days of follow-up, 11 833 participants died (1.42%). Furthermore, 20 615 (2.48%) and 33 869 (4.07%) participants died within 180 and 365 days, respectively. K+ values outside the previously estimated distribution range were associated with increased risk of mortality; multivariable-adjusted HRs ranged between 1.72 (95% CI 1.62–1.82) and 2.97 (95% CI 2.76–3.19), with greater effect sizes for short-term mortality outcomes (Supplementary data, Table S7). Sensitivity analyses obtained by replicating the selection process showed consistent results in terms of magnitude and direction of the association (Supplementary data, Table S8).
eGFR-specific K+ ranges based on risk of mortality
As expected, the absolute risk of mortality is higher in individuals with lower renal function (Supplementary data, Figure S4). The adjusted relative mortality risk associated with K+ levels by eGFR category is depicted in Figure 2. Overall, the U-shaped association was gradually flattened with lower eGFR strata and for each predetermined follow-up time (P for interaction <0.001). Table 3 depicts K+ concentration associated with the minimum mortality risk across eGFR strata. Although the lowest 90-day mortality risk was observed for a plasma concentration of 4.02 mmol/L in individuals with normal renal function (G1–G2), this value went up to 4.34 mmol/L (8% increase) in individuals with eGFR G4 or more. The same pattern was observed throughout the different observation periods. This was accompanied by a widening in the K+ ranges that predicted different risk scenarios: whereas the lower K+ limit remained rather stable (between 3.4 and 3.7 mmol/L through all strata), the upper K+ limit presented larger differences with lower eGFR. For instance, in eGFR G1–G2, while the range where the 90-day mortality risk increased by no more than 100% was 3.45–4.94 mmol/L, it widened to 3.36–5.18 in G3 and 3.26–5.53 mmol/L in G4–G5. Sensitivity analyses showed similar results in the 99 random data set selections (Supplementary data, Tables S9–S11), and a ‘dose-dependent’ association was also observed while further splitting the eGFR category G3 into G3a (eGFR <60–45 mL/min/1.73 m2) and G3b (eGFR <45–30 mL/min/1.73 m2) (Supplementary data, Figure S5 and Supplementary data, Table S12).
FIGURE 2.
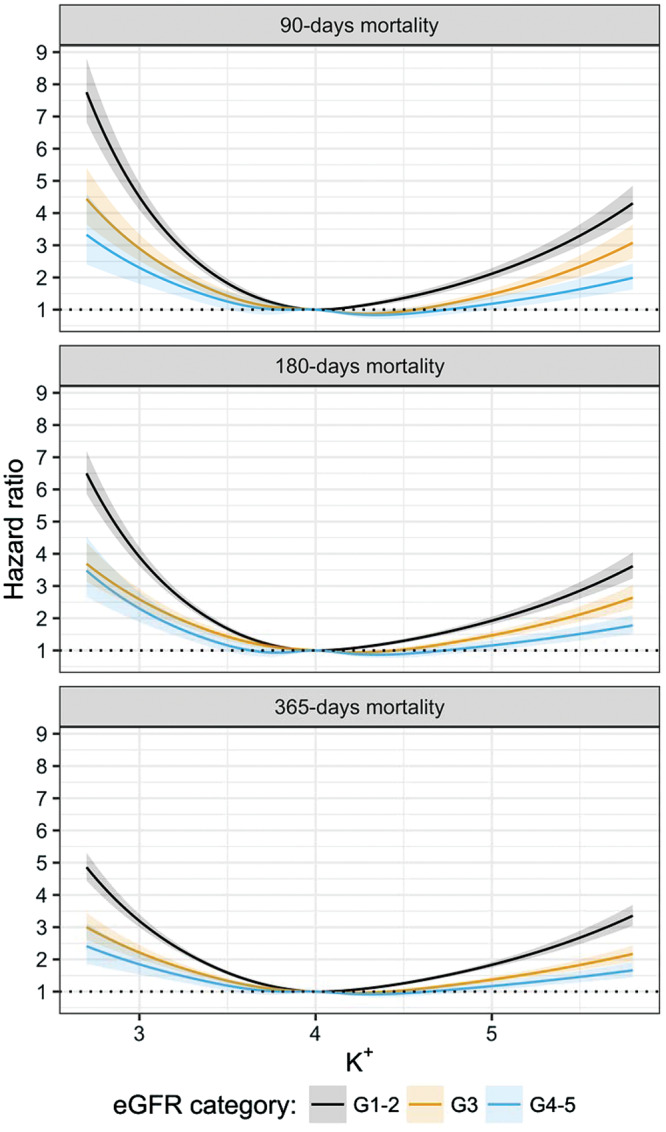
Multivariable association between K+ levels and 90-, 180- and 365-day mortality, by eGFR category. Models are adjusted by eGFR category, eGFR value, age, sex, comorbidities (myocardial infarction, heart failure, peripheral vascular disease, cerebrovascular disease, dementia, rheumatoid disease, chronic obstructive pulmonary disease, peptic ulcer disease, liver disease, cancer, diabetes mellitus, hypertension) and ongoing medication (NSAIDs, angiotensin-converting enzyme inhibitor, angiotensin receptor blockers, mineralocorticoid receptor antagonists). K+ was modelled by using restricted cubic splines with five knots, and a statistical interaction between K+ and eGFR category was included.
Table 3.
eGFR-specific plasma K+ for different scenarios of risk prediction
| eGFR category | Minimum risk | <50% risk increase | <100% risk increase |
|---|---|---|---|
| 90-day mortality | |||
| G1–G2 | 4.02 | 3.61–4.61 | 3.45–4.94 |
| G3 | 4.28 | 3.57–4.87 | 3.36–5.18 |
| G4–G5 | 4.34 | 3.50–5.09 | 3.26–5.53 |
| 180-day mortality | |||
| G1–G2 | 4.01 | 3.57–4.69 | 3.39–5.05 |
| G3 | 4.24 | 3.52–4.94 | 3.27–5.34 |
| G4–G5 | 4.35 | 3.41–5.22 | 3.21–5.75 |
| 365-day mortality | |||
| G1–G2 | 4.03 | 3.54–4.74 | 3.33–5.11 |
| G3 | 4.22 | 3.42–5.09 | 3.14–5.59 |
| G4–G5 | 4.31 | 3.33–5.37 | a |
Not available, upper limit of risk doubling not reached.
Models are adjusted by eGFR category, eGFR value, age, sex, comorbidities (myocardial infarction, heart failure, peripheral vascular disease, cerebrovascular disease, dementia, rheumatoid disease, chronic obstructive pulmonary disease, peptic ulcer disease, liver disease, cancer, diabetes mellitus, hypertension) and medication use (NSAIDs, angiotensin-converting enzyme inhibitor, angiotensin receptor blockers, mineralocorticoid receptor antagonists). K+ was modelled by using restricted cubic splines with five knots, and a statistical interaction between K+ and eGFR category was included. Reference ranges are computed by fixing all remaining covariates to their median (most frequent) value.
When applying the K+ range of 3.5–5.0 mmol/L, the HR for 90-day mortality associated with out of range K+ values was significantly lower (non-overlapping 95% CI) in patients with eGFR G4–G5 (1.73, 95% CI 1.51–1.95) when compared with eGFR G1–G2 (2.66, 95% CI 2.48–2.85). When applying our eGFR-specific ranges, the HR was similar across eGFR strata (Supplementary data, Figure S6 and Supplementary data, Table S13). A considerable proportion of individuals would be reclassified by our proposed eGFR-specific ranges (Supplementary data, Table S14).
DISCUSSION
The main findings of this large healthcare-based study are: (i) patients with CKD had progressively higher concentration of plasma K+; (ii) the association between plasma K+ and mortality was U-shaped, with the lowest mortality observed in the range of 4.0–4.3 mmol/L depending on the underlying kidney function; and (iii) K+ ranges for mortality prediction varied by underlying kidney function, being shifted upwards in individuals with moderate and severe/end-stage CKD. Thus, although our study supports the view that hyperkalaemia is better tolerated in CKD, it challenges the current use of a single clinical K+ range for all patients.
The kidney plays a fundamental role in K+ homoeostasis [6], and our study convincingly showed an important shift in both crude and multivariable-adjusted plasma K+ distribution with lower eGFR. How this chronic K+ accumulation may influence clinical outcomes is not well known, but small-scale reports suggested hyperkalaemia to be a less threatening condition in CKD. These studies compare the mortality associations of current clinical K+ thresholds in patients with CKD: Einhorn et al. [12] were the first to suggest a stronger association between hyperkalaemia and 1-day mortality among patients with normal renal function than among patients with CKD; patients with end-stage renal disease in the study by Nakhoul et al. [15] also had lower death hazards with hyperkalaemia relative to the entire cohort; An et al. [13] showed, in 923 consecutive hospital admissions, a graded decrease in risk of death among patients with extreme levels of hyperkalaemia as CKD stage worsened; finally, a prospective analysis of sustained hyperkalaemia and outcomes in 820 patients with creatinine clearance <50 mL/min suggested that serum K+ in the ranges of 5.0–6.0 mmol/L was well tolerated and associated with lower mortality risk when compared with ≤4.0 mmol/L [16]. Of note, similar effect differences were reported in acute myocardial infarction cohorts when comparing dialysis versus non-CKD patients with hyperkalaemia [3, 14]. We could indeed observe the same HR attenuation in our study when using the currently established single clinical thresholds.
Our study expands previous evidence with the novel demonstration that the U-shaped association between K+ and death flattens across worse CKD stages. Based on this flattening, we suggest K+ ranges for different scenarios of risk prediction, and show a clear gradual shift in the upper K+ threshold across stages of CKD. We note that our most conservative range estimation in individuals with normal kidney function (3.45–4.95 mmol/L for 90-day mortality risk) approximates to the currently accepted single threshold of 3.5–5.0 mmol/L. However, this same estimation suggests a difference of 0.5 mmol/L in the upper threshold of individuals with CKD G4–G5 (3.26–5.53 mmol/L). This is consequent with the biological plausibility of a physiological adaptation to chronic hyperkalaemia in these patients [17–22]. Yet, our results disagree with the size effect attenuation reported in previous small studies [16], and we note that plasma K+ >5.5 mmol/L strongly and independently predicted mortality in all eGFR strata, suggesting that K+ concentrations in these ranges continue to deserve attention, strict monitoring and treatment to minimize adverse outcomes. Recently [28], a meta-analysis of the CKD prognosis consortium reported no difference in the association between serum K+ and mortality by eGFR strata among 1.2 million participants from 27 international cohorts. The diversity of populations considered in that analysis (10 general population cohorts or healthcare extractions, 7 high cardiovascular risk cohorts and 10 CKD-referred cohorts) may hamper comparison with our results. Furthermore, this research question was not formally addressed, given serum K+ within each eGFR strata was compared against the same reference category (4.2 mmol/L) that is based on the lowest risk prediction for the whole population.
The mechanisms behind this possible adaptation to increased K+ in CKD are not well described and cannot be ascertained from our observational analyses. Of the possible mediators of the association between hyperkalaemia and death, cardiac arrhythmia caused by alteration in the transmembrane potential is probably the most relevant. K+ has a major role in maintaining the resting membrane potential, with implications in regulating transmission of nerve impulses and cardiac rhythm. In myocardial cells, there are about 10 different K+ ion channels that are responsible for the intricate maintenance of a stable resting membrane potential through repolarization of the cell [29]. The K+ channels display different properties and movements of K+ are also influenced by other ions such as protons, calcium and magnesium. CKD patients may to some extent adapt to the higher K+ levels through different mechanisms (intestinal and tubular secretion), thereby controlling hyperkalaemia. Nonetheless, we are not aware of any studies showing adaptation to higher K+ levels in other cells, e.g. myocardiocytes. However, K+ ion channels of the myocardium are sensitive to endogenous factors and may change both the number and the functioning as a result of structural [30, 31] and environmental [32, 33] alterations. We hypothesize that similar mechanisms may take place in CKD patients by slowly increasing K+ levels that are already in the high normal range. Finally, because of the interdependence between K+, acidosis and calcium/magnesium, it would be interesting to determine whether, for instance, acidosis modulates the association between circulating K+ and subsequent mortality.
A second novelty in our study is the focus on plasma K+ determinations. Plasma K+ is becoming standard and preferred to serum in many countries, owing to its faster turn around and not being influenced by pre-analytical issues (such as thrombocytosis, tourniquet compression or violent sample handling, thus reducing the risk of false positives—e.g. pseudokalaemias) [34]. Despite this, plasma K+ is not currently considered by clinical guidelines, which either refer to serum or do not make distinction between the sources of K+ determination [7–10]. Our plasma-derived K+ ranges may potentially be helpful to estimate risk in clinics or regions that use this method.
These findings may have clinical implications. On one hand, we add robust evidence to ongoing discussions on the need to develop disease-specific ‘optimal’ K+ ranges [35]. Although current clinical guidelines suggest maintaining K+ within a range of 3.50–5.00 mmol/L, observational studies exploring mortality-associated ranges in elderly [2], and patients with myocardial infarction [3] or hypertension [4], suggest these ranges to be narrower, in the range of 3.5–4.5 mmol/L. Our less conservative (<50% risk increase) observed range in individuals with normal kidney function (3.61–4.61 mmol/L for 90-day mortality) would agree with these studies, but again suggests a difference of 0.5 mmol/L in the upper threshold of individuals with CKD G4–G5 (3.50–5.09 mmol/L).
On the other hand, clinical guidelines recommend some clinical decisions based on these K+ thresholds, such as not to initiate RAAS blockade therapy when K+ is >5.0 mmol/L [7–10]. Given the widely demonstrated effectiveness of these therapies and our observed shift in K+ ranges, interventional studies and/or post hoc analyses of existing trials may be needed to re-evaluate these assumptions. Studies should ideally follow to confirm our findings and, specially, to report on serum K+ ranges across renal function categories. If we consider that serum K+ concentration can be typically 0.1–0.4 mmol/L higher than that measured in an anticoagulated plasma sample [36], then this may have larger consequences in both the use of these therapies and the management of dyskalaemias in persons with CKD.
Our study was observational, and we recognize that despite the use of robust methods, there is residual/unknown confounding, and that the relationship between K+ and death may represent reverse causation. It is also conceivable that the relative importance of hyperkalaemia decrease with lower eGFR as the underlying absolute risk of mortality is larger and patients die from other causes. Hyperkalaemia is also less common in individuals with normal renal function. Hence, the increased risk of mortality in that group may be a proxy of severe acute illnesses that we may not have accounted for in the analysis (detection bias). Nevertheless, even if K+ is just a marker of illness, clinical ranges are useful to aid in clinical decisions and may still vary by CKD stage. As study strengths, SCREAM and the Swedish National Health registries contain uniquely detailed information, and we were able to extract reliable and complete data on K+ tests, comorbid illnesses, concomitant medication and date of death, thus overall strengthening the reliability of our findings.
To conclude, our study shows that individuals with CKD require higher plasma K+ to predict a mortality risk similar to that of persons with normal renal function. Although we hope that our efforts open discussions on the need for disease-specific as opposed to a single clinical K+ range for all patients, we note that physiological adaptation in CKD incompletely explains why mortality risk could be diminished once hyperkalaemia has been established. As recently discussed by Montford and Linas [1], frequent metabolic derangements (such as metabolic acidosis) and structural heart disease (such atrial fibrillation or heart failure) in CKD patients should theoretically predispose them to more toxicity with hyperkalaemia due to lower arrhythmogenic potential. Trials that randomize patients with CKD to different K+ targets would be necessary to definitively establish the optimal range for maintaining K+ levels.
FUNDING
This study was supported by an institutional grant from AstraZeneca to Karolinska Institutet. In addition, we acknowledge additional grant support from the Swedish Heart and Lung Foundation, the Stockholm County Council, Vifor Fresenius Medical Care Renal Pharma and the Martin Rind’s and Westman’s Swedish Foundations.
CONFLICT OF INTEREST STATEMENT
J.-J.C. received research grants from Viforpharma, Astellas, Merck Sharp & Dome; H.X. was employed by AstraZeneca; T.J. was lecturing and consulting for Astra-Zeneca, Merck and Aspen; L.H.L. received research grants and was consulting for AstraZeneca and ViforPharma, and consulting for Bayer. The other authors have no conflict of interest to declare.
Supplementary Material
REFERENCES
- 1. Montford JR, Linas S.. How dangerous is hyperkalemia? J Am Soc Nephrol 2017; 28: 3155–3165 [DOI] [PMC free article] [PubMed] [Google Scholar]
- 2. Collins AJ, Pitt B, Reaven N. et al. Association of serum potassium with all-cause mortality in patients with and without heart failure, chronic kidney disease, and/or diabetes. Am J Nephrol 2017; 46: 213–221 [DOI] [PMC free article] [PubMed] [Google Scholar]
- 3. Goyal A, Spertus JA, Gosch K. et al. Serum potassium levels and mortality in acute myocardial infarction. JAMA 2012; 307: 157–164 [DOI] [PubMed] [Google Scholar]
- 4. Krogager ML, Torp-Pedersen C, Mortensen RN. et al. Short-term mortality risk of serum potassium levels in hypertension: a retrospective analysis of nationwide registry data. Eur Heart J 2017; 38: 104–112 [DOI] [PubMed] [Google Scholar]
- 5. Luo J, Brunelli SM, Jensen DE. et al. Association between serum potassium and outcomes in patients with reduced kidney function. Clin J Am Soc Nephrol 2016; 11: 90–100 [DOI] [PMC free article] [PubMed] [Google Scholar]
- 6. Kovesdy CP, Appel LJ, Grams ME. et al. Potassium homeostasis in health and disease: a Scientific Workshop Cosponsored by the National Kidney Foundation and the American Society of Hypertension. Am J Kidney Dis 2017; 70: 844–858 [DOI] [PubMed] [Google Scholar]
- 7. Yancy CW, Jessup M, Bozkurt B. et al. 2013 ACCF/AHA guideline for the management of heart failure: a report of the American College of Cardiology Foundation/American Heart Association Task Force on Practice Guidelines. J Am Coll Cardiol 2013; 62: e147–e239 [DOI] [PubMed] [Google Scholar]
- 8. Lindenfeld JAnn, Albert NM, Boehmer JP. et al. HFSA 2010 Comprehensive Heart Failure Practice Guideline. J Card Fail 2010; 16: e1–e194 [DOI] [PubMed] [Google Scholar]
- 9. Kidney Disease Outcomes Quality Initiative. K/DOQI clinical practice guidelines on hypertension and antihypertensive agents in chronic kidney disease. Am J Kidney Dis 2004; 43 (5 Suppl 1): S1–S290 [PubMed] [Google Scholar]
- 10.NICE Clinical guideline [CG182]: Chronic Kidney Disease in Adults: Assessment and Management. 2014 (last update January 2015). https://www.nice.org.uk/guidance/cg182. (15 February 2018, date last accessed)
- 11. Nilsson E, Gasparini A, Arnlov J. et al. Incidence and determinants of hyperkalemia and hypokalemia in a large healthcare system. Int J Cardiol 2017; 245: 277–284 [DOI] [PubMed] [Google Scholar]
- 12. Einhorn LM, Zhan M, Hsu VD. et al. The frequency of hyperkalemia and its significance in chronic kidney disease. Arch Intern Med 2009; 169: 1156–1162 [DOI] [PMC free article] [PubMed] [Google Scholar]
- 13. An JN, Lee JP, Jeon HJ. et al. Severe hyperkalemia requiring hospitalization: predictors of mortality. Crit Care 2012; 16: R225. [DOI] [PMC free article] [PubMed] [Google Scholar]
- 14. Grodzinsky A, Goyal A, Gosch K. et al. Prevalence and prognosis of hyperkalemia in patients with acute myocardial infarction. Am J Med 2016; 129: 858–865 [DOI] [PMC free article] [PubMed] [Google Scholar]
- 15. Nakhoul GN, Huang H, Arrigain S. et al. Serum potassium, end-stage renal disease and mortality in chronic kidney disease. Am J Nephrol 2015; 41: 456–463 [DOI] [PMC free article] [PubMed] [Google Scholar]
- 16. Korgaonkar S, Tilea A, Gillespie BW. et al. Serum potassium and outcomes in CKD: insights from the RRI-CKD cohort study. Clin J Am Soc Nephrol 2010; 5: 762–769 [DOI] [PMC free article] [PubMed] [Google Scholar]
- 17. Allon M. Hyperkalemia in end-stage renal disease: mechanisms and management. J Am Soc Nephrol 1995; 6: 1134–1142 [DOI] [PubMed] [Google Scholar]
- 18. Gennari FJ, Segal AS.. Hyperkalemia: An adaptive response in chronic renal insufficiency. Kidney Int 2002; 62: 1–9 [DOI] [PubMed] [Google Scholar]
- 19. Grimm PR, Sansom SC.. BK channels in the kidney. Curr Opin Nephrol Hypertens 2007; 16: 430–436 [DOI] [PubMed] [Google Scholar]
- 20. Salem MM, Rosa RM, Batlle DC.. Extrarenal potassium tolerance in chronic renal failure: implications for the treatment of acute hyperkalemia. Am J Kidney Dis 1991; 18: 421–440 [DOI] [PubMed] [Google Scholar]
- 21. Sandle GI, Gaiger E, Tapster S. et al. Evidence for large intestinal control of potassium homoeostasis in uraemic patients undergoing long-term dialysis. Clin Sci 1987; 73: 247–252 [DOI] [PubMed] [Google Scholar]
- 22. Foster ES, Jones WJ, Hayslett JP. et al. Role of aldosterone and dietary potassium in potassium adaptation in the distal colon of the rat. Gastroenterology 1985; 88: 41–46 [DOI] [PubMed] [Google Scholar]
- 23. Runesson B, Gasparini A, Qureshi AR. et al. The Stockholm CREAtinine Measurements (SCREAM) project: protocol overview and regional representativeness. Clin Kidney J 2016; 9: 119–127 [DOI] [PMC free article] [PubMed] [Google Scholar]
- 24. Levey AS, Stevens LA, Schmid CH. et al. A new equation to estimate glomerular filtration rate. Ann Intern Med 2009; 150: 604–612 [DOI] [PMC free article] [PubMed] [Google Scholar]
- 25. Rustad P, Felding P, Franzson L. et al. The Nordic Reference Interval Project 2000: recommended reference intervals for 25 common biochemical properties. Scand J Clin Lab Invest 2004; 64: 271–284 [DOI] [PubMed] [Google Scholar]
- 26. Quan H, Sundararajan V, Halfon P. et al. Coding algorithms for defining comorbidities in ICD-9-CM and ICD-10 administrative data. Med Care 2005; 43: 1130–1139 [DOI] [PubMed] [Google Scholar]
- 27.R Core Team. R: A Language and Environment for Statistical Computing R Foundation for Statistical Computing, Vienna, Austria. 2018; https://www.R-project.org/
- 28. Kovesdy CP, Matsushita K, Sang Y. et al. Serum potassium and adverse outcomes across the range of kidney function: a CKD Prognosis Consortium meta-analysis. Eur Heart J 2018; 39: 1535–1542 [DOI] [PMC free article] [PubMed] [Google Scholar]
- 29. Khan E, Spiers C, Khan M.. The heart and potassium: a banana republic. Acute Card Care 2013; 15: 17–24 [DOI] [PubMed] [Google Scholar]
- 30. Stillitano F, Lonardo G, Zicha S. et al. Molecular basis of funny current (If) in normal and failing human heart. J Mol Cell Cardiol 2008; 45: 289–299 [DOI] [PubMed] [Google Scholar]
- 31. Berti C, Zsolnay V, Shannon TR. et al. Sarcoplasmic reticulum Ca(2+), Mg(2+), K(+), and Cl(-) concentrations adjust quickly as heart rate changes. J Mol Cell Cardiol 2017; 103: 31–39 [DOI] [PMC free article] [PubMed] [Google Scholar]
- 32. Wang X, Fitts RH.. Ventricular action potential adaptation to regular exercise: role of beta-adrenergic and KATP channel function. J Appl Physiol (1985) 2017; 123: 285–296 [DOI] [PubMed] [Google Scholar]
- 33. Badr A, Hassinen M, El-Sayed MF. et al. Effects of seasonal acclimatization on action potentials and sarcolemmal K(+) currents in roach (Rutilus rutilus) cardiac myocytes. Comp Biochem Physiol A Mol Integr Physiol 2017; 205: 15–27 [DOI] [PubMed] [Google Scholar]
- 34. Asirvatham JR, Moses V, Bjornson L.. Errors in potassium measurement: a laboratory perspective for the clinician. N Am J Med Sci 2013; 5: 255–259 [DOI] [PMC free article] [PubMed] [Google Scholar]
- 35. Pitt B, Rossignol P.. Mineralocorticoid receptor antagonists in high-risk heart failure patients with diabetes mellitus and/or chronic kidney disease. J Am Heart Assoc 2017; 6: e008054. [DOI] [PMC free article] [PubMed] [Google Scholar]
- 36. Nijsten MW, de Smet BJ, Dofferhoff AS.. Pseudohyperkalemia and platelet counts. N Engl J Med 1991; 325: 1107. [DOI] [PubMed] [Google Scholar]
Associated Data
This section collects any data citations, data availability statements, or supplementary materials included in this article.