

Abstract
The last common ancestor of the Gammaproteobacteria carried an important 40-kb chromosome section encoding 51 proteins of the transcriptional and translational machinery. These genes were organized into eight contiguous operons (rrnB-tufB-secE-rpoBC-str-S10-spc-alpha). Over 2 Gy of evolution, in different lineages, some of the operons became separated by multigene insertions. Surprisingly, in many Enterobacteriaceae, much of the ancient organization is conserved, indicating a strong selective force on the operons to remain colinear. Here, we show for one operon pair, tufB-secE in Salmonella, that an interruption of contiguity significantly reduces growth rate. Our data show that the tufB-secE operons are concatenated by an interoperon terminator–promoter overlap that plays a significant role regulating gene expression. Interrupting operon contiguity interferes with this regulation, reducing cellular fitness. Six operons of the ancestral chromosome section remain contiguous in Salmonella (tufB-secE-rpoBC and S10-spc-alpha) and, strikingly, each of these operon pairs is also connected by an interoperon terminator–promoter overlap. Accordingly, we propose that operon concatenation is an ancient feature that restricts the potential to rearrange bacterial chromosomes and can select for the maintenance of a colinear operon organization over billions of years.
Keywords: tufA, tufB, inversion, promoter–terminator overlap
Introduction
The linear organization of genes on bacterial chromosomes is highly variable. A comparison of genome sequences of distantly related bacterial species has revealed that there is no long-range colinearity in gene order (Koonin et al. 1996; Tatusov et al. 1996). Genes that display a higher degree of conserved colinearity throughout the bacterial tree of life usually encode proteins of related functions and are organized within operons (Tamames et al. 1997; Ermolaeva et al. 2001; Moreno-Hagelsieb et al. 2001), a feature that has been used to identify functional groups of genes (Overbeek et al. 1999; Snel et al. 2002). Gene order within operons might be selected due to coregulation or it could reflect horizontal transfer of a fully functional unit but even the conservation of operon organization is generally low over evolutionary time spans (Lawrence and Roth 1996; Itoh et al. 1999). Rearrangements in the order of genes can reflect significant events in evolution as shown for the dcw cluster where the order of the genes within the operon might be linked to cellular morphology of bacteria, probably due to differential expression depending on gene order (Tamames et al. 2001).
A few regions of bacterial chromosomes do display an unusually high degree of gene order conservation (Tamames 2001). The most remarkable example is the S10-spc-alpha operon cluster. This cluster contains approximately half of the bacterial ribosomal proteins organized into three transcriptional units S10 (11 ribosomal proteins), spc (11 ribosomal proteins and SecY), and alpha (4 ribosomal proteins and RpoA). The organization of these three operons is conserved within bacteria and archaea indicating that this gene cluster was present in the last common ancestor of the bacteria and archaea (Wachtershauser 1998; Barloy-Hubler et al. 2001; Coenye and Vandamme 2005). The alignment of conserved gene clusters indicates that at least five more operons are part of this conserved genomic region. These operons are rrnB (three ribosomal rRNA and two tRNA genes), tufB (four tRNA genes, EF-TuB), secE (SecE, NusG), rpoBC (four ribosomal proteins, RpoB and RpoC), and str (two ribosomal proteins, EF-G and EF-TuA) (Wachtershauser 1998). Together, this supercluster of operons encodes a substantial part of the transcriptional and translational machinery. Much of the suggested organization of these eight operons is still present in many species of the Gammaproteobacteria, consistent with this organization being present in the last common ancestor of the Gammaproteobacteria. Over 2 Gy of evolution, some operons became separated by multigene insertions but surprisingly, in many of the Enterobacteriaceae the ancient organization of multiple operons is conserved (McClelland et al. 2001; Brocks et al. 2005; Brocks and Schaeffer 2008; Marin et al. 2017). This indicates a strong selective force on the operons to remain colinear. However, the underlying selective mechanism is not understood.
Using a contiguous operon pair, tufB-secE in Salmonella as a model system, we show that the two operons are concatenated by an interoperon terminator–promoter overlap that plays a significant role in regulating gene expression. A rearrangement that interrupts operon contiguity interferes with this regulation, reducing cellular fitness. Further, we show that the other operons of this ancient cluster that remain contiguous in Salmonella (tufB-secE-rpoBC and S10-spc-alpha) are also each connected by an interoperon terminator–promoter overlap. Accordingly, we propose that the concatenation of operons is an ancient feature that restricts the potential to rearrange bacterial chromosomes and can select for the maintenance of a colinear operon organization over billions of years.
Results
The Organization of the rrnB-tufB-secE-rpoBC-str-S10-spc-alpha Supercluster Is Conserved within the Gammaproteobacteria
Salmonella enterica is a genetically amenable and well-studied model organism within the Gammaproteobacteria. A comparison of the operon order in Salmonella to the previously described rrnB-tufB-secE-rpoBC-str-S10-spc-aplpha supercluster (Wachtershauser 1998; Barloy-Hubler et al. 2001; Coenye and Vandamme 2005) shows that the operon order in Salmonella is slightly altered relative to the ancient organization. A chromosomal rearrangement has translocated the rrnB-tufB-secE-rpoBC operons from the str-S10-spc-aplpha operons and three to four genes were inserted between the rrnB-tufB and the str-S10 operon pairs (fig. 1). A comparison of the gene order in selected species within the Proteobacteria is in full agreement with the previous finding that the operon supercluster is ancient and that the last common ancestor of the Gammaproteobacteria contained the ancient operon organization (fig. 1). A parsimonious hypothesis for the potential temporal order in which changes to the operon cluster in Salmonella evolved indicates that rearrangements in the organization of these genes initially started with a small multigene insertion, sometimes followed by a larger rearrangement (fig. 1). Overall, the ancient organization of the operons within the supercluster has been conserved over 2 Gy of evolution indicating a strong selective force on these operons to remain colinear.
Fig. 1.

Comparison of the ancient supercluster organization. (A) Comparison of the operon organization in the Gammaproteobacteria. Species were chosen to display a potential temporal order, based on a parsimonious hypothesis, of the changes to the operon supercluster in Salmonella. Events that led to the alterations in the supercluster of Salmonella compared with the proto Gammaproteobacteria version are indicated by gray boxes and are annotated according to their sequential order of appearance (A–C). Two events that could not be separated are annotated together (B). (B) Comparison of the operon organization within the Proteobacteria. Operons are indicated according to the Salmonella organization. Small multigene insertions are indicated by a triangle with the number of inserted genes denoted below. Larger chromosomal rearrangements between the operons are indicated by arrows. Absent genes are indicated by a cross and fused genes are connected by a dotted line. The phylogenetic schemes are adapted from Williams et al. (2010) for the Gammaproteobacteria and from Ciccarelli et al. (2006) for the Proteobacteria and do not represent phylogenetic distance (Ciccarelli et al. 2006; Williams et al. 2010).
An Inversion between the tuf Genes Is Associated with a Fitness Cost
Elongation factor Tu (EF-Tu) is the most abundant cytoplasmic protein in Salmonella, making up 9% of total cytoplasmic protein in the cell under fast growth conditions (Tubulekas and Hughes 1993). In Salmonella, EF-Tu is encoded by two separate genes, tufA and tufB (Jaskunas et al. 1975; Hughes 1986) that are located on opposite sides of the origin of replication and separated by 761 kb of DNA sequence (McClelland et al. 2001). The tuf genes of Salmonella evolve in concert, using homologous recombination to exchange genetic information between them (Abdulkarim and Hughes 1996; Paulsson et al. 2017; Brandis et al. 2018). Our previous studies have shown that recombination can also lead to a chromosomal inversion of the region between the tuf genes in up to 50% of tufA-tufB recombination events (Hughes 2000). We decided to use an inversion between the tuf genes to study the selective forces acting to maintain colinearity of the operons in the supercluster since, 1) the inversion occurs frequently, 2) strains carrying the inversion are viable, and 3) the inversion leads to a minor change in the supercluster gene order (exchanging the relative chromosomal locations of the tufB and str operons). We constructed this inversion in a S. typhimurium LT2 strain and measured its effect on cellular fitness. The chromosomal inversion caused an 8% reduction in growth rate which would be sufficient to select against strains carrying this inversion in natural isolates (fig. 2A and B).
Fig. 2.

Overview over the various tuf operons constructed in this study. (A) Wild-type tufA operon (rpsL-rpsG-fusA-tufA) and tufB operon (thrU-tyrU-glyT-thrT-tufB). (B) tuf hybrid operons in the inversion strains. (C, D) Strains that carry the chromosomal inversion but contain a hybrid operon where the original order of promoter, genes and terminator has been reinstated. Promoters (P) and terminators (T) of the respective operons are indicated. Fitness relative to wild type ± standard deviation (n = 10) of each construct is indicated below to the construct. (E) Relative expression levels ± standard deviation (n = 4) of genes within the tufA and secE-nusG operon in the wild type and inversion strain. Individual data points are shown as black circles. Significance was calculated using a two-sided unpaired t-test (n.s.: nonsignificant; **P < 0.01). (F) Relative fitness of the inversion strain as a function of secE and nusG overexpression. All values are mean ± standard deviation (n = 4). Individual data points are shown as black symbols.
The Interruption of the tufB-secE Operon Order Causes the Fitness Cost
The tuf genes are the last genes within their respective operons and encode identical proteins. The inversion creates tufA/B and tufB/A hybrid operons that are unchanged in both gene content and protein coding sequences. However, a novel feature of these hybrid operons is that each has the promoter sequence of one operon fused to the transcriptional terminator sequence of the other operon (fig. 2A and B). Thus, the tufA/B hybrid operon combines the tufA promoter with the tufB terminator and the tufB/A hybrid operon combines the tufB promoter with the tufA terminator sequence (fig. 2A and B). To test whether this hybrid organizational feature caused the observed fitness reduction we restored the natural linkage of promoters and transcriptional terminators in each operon (while retaining the chromosomal inversion) and remeasured fitness. Restoring matching promoter and terminators sequence to the tufB/A hybrid operon had no effect on cellular fitness (fig. 2C) indicating that this hybrid operon was not responsible for the reduction in fitness of the inversion strain. In contrast, placing the tufA terminator after the tufA/B hybrid operon led to a significant further reduction in cellular fitness (fig. 2D). This latter result indicates that this particular junction of the chromosomal inversion, containing the region between the tufA/B hybrid operon and the secE-nusG operon, is sensitive to changes on the DNA level. To test this hypothesis, we measured cellular mRNA levels for genes within the tufA/B and secE-nusG operon using quantitative real-time polymerase chain reaction (qPCR). The mRNA levels of genes within the tufA/B operon were unchanged in the strain with the inversion compared with the wild type but mRNA levels of secE and nusG were significantly reduced (fig. 2E). We next cloned the secE and nusG genes behind a series of constitutively expressed promoters with different strengths to test if one of the two genes is responsible for the reduction in cellular fitness. Overexpression of secE did not improve fitness of the strain with the chromosomal inversion but expression of nusG did. The fitness cost caused by the inversion was fully ameliorated at the highest level of nusG expression (fig. 2F).
We analyzed the intergenic sequence between the tufB and secE operons to identify how the inversion between the tuf genes could affect the expression of an operon downstream of the inversion junction. This analysis showed that the tufB operon terminator sequence overlaps with the promoter for the secE operon. We hypothesized that the expression level of the tufB gene directly affects transcriptional initiation at the secE-nusG promoter. The chromosomal inversion fuses the stronger tufA promoter to the tufB gene and thereby significantly increased the RNA polymerase (RNAP) load on the tufB terminator (Hughes 1990). This increased RNAP load is most likely the cause of the reduced transcriptional initiation of the secE-nusG promoter.
Reduction in Cellular NusG Level Disrupts Rho-NusG versus Rho-NusA Balance
Our data indicate that reduced cellular NusG levels are responsible for the fitness cost of the inversion between the tuf genes but it is not clear how NusG levels affect the cells. Since NusG is a transcription termination factor, we performed global RNA sequencing of the wild type and the inversion strain to further analyze the mechanism behind the fitness cost. The results showed that a total of 97 genes had significantly changed expression levels with the vast majority (79/97 genes, 81%) displaying increased expression (supplementary table S1, Supplementary Material online). As expected, expression levels of secE and nusG were decreased, corroborating the qPCR results. Fifty-five out of the remaining ninety-five genes (58%, excluding secE and nusG) could be placed into five functional groups that are likely involved in the observed fitness cost, namely 1) transcription factors (5 genes), 2) DNA repair (4 genes), 3) membrane synthesis (8 genes), 4) iron homeostasis (17 genes), and 5) flagella synthesis (21 genes) (supplementary table S2, Supplementary Material online). The majority of the genes within these five functional groups (50/55 genes, 91%) show increased expression levels indicating that the inversion strain has increased production of LPS and peptidoglycan in the membrane, induced iron uptake systems, and increased production of flagella proteins. The overexpressed DNA repair genes involved in base excision repair of oxidized bases also suggests increased DNA damage within the cells. Most interesting was a 5.7-fold increase in the mRNA levels of rho (supplementary table S2, Supplementary Material online). Rho is an essential transcription termination factor (Roberts 1969) and NusG modulates its function (Burns and Richardson 1995). Expression of rho is autoregulated by a Rho-dependent attenuator (rhoL) (Matsumoto et al. 1986). Increased levels of rho mRNA therefore indicate that Rho function is compromised, most likely by the reduced level of NusG. A reduction in Rho function, leading to reduced transcriptional termination, would also explain the strong bias toward increased gene expression in the inversion strain (supplementary table S2, Supplementary Material online).
We decided to evolve the inversion strain, selecting for increased fitness, to further validate our RNA sequencing results. The recA gene was removed from the strain to prevent a reinversion between the tuf genes and ten lineages were serially passage for 500 generations after which a single clone per lineage was isolated and whole-genome sequenced. Each of the ten isolates carried at least one mutation that was previously linked to media adaptation (Knoppel et al. 2018) but nine of the isolates carried an additional mutation that might be linked to the inversion (supplementary tables S3 and S4, Supplementary Material online). Seven isolates had either a frameshift (2×) or a nonsense mutation (5×) in the early coding sequence of the infB gene, encoding initiation factor 2 (IF2), that each lead to the deletion of the IF2α isoform, while the IF2β and IF2β′ isoforms remain intact (Sacerdot et al. 1992). One isolate had a truncated nusA gene, encoding termination–antitermination factor NusA, and one isolate had a mutation in the regulatory region of fis, encoding transcription factor Fis. Interestingly, nusA and infB are cotranscribed in the same operon, which has a regulatory Fis-binding site. It is therefore possible that the three types of mutations compensate the fitness cost of the chromosomal inversion by a shared mechanism. We reconstructed one of the infB mutations, the nusA mutation and the fis mutation in a clean inversion background and were able to show that these mutations were necessary and sufficient to restore cellular fitness back to wild-type levels (table 1). We then performed RNA sequencing on the three reconstructed strains (supplementary table S1, Supplementary Material online) and specifically analyzed the 97 genes with changed expression in the inversion strain (supplementary table S2, Supplementary Material online). The rho mRNA level was restored in all three strains indicating that the compensatory mutations restore Rho function. As a result of this, expression of the majority of the analyzed genes (77 genes, 79%) was restored to wild-type level for at least one of the three isolates and their general expression pattern overlaps strongly (supplementary fig. S1, Supplementary Material online). Surprisingly, the mRNA level of nusG was not changed in any of the strains as could have been expected from the restored Rho function. This indicates that the low NusG levels in the inversion strain are not the only factor that inhibits Rho function but that there must be an additional contributing factor. One possible candidate for this is NusA since it is another cofactor for Rho and all compensatory mutations are related to the nusA operon. We decided to measure protein expression levels of NusG, NusA, and IF2 using a translational fluorescence protein fusion in the inversion strain and the three compensated mutants to further investigate this possibility. Our results showed that the three compensated strains displayed individual expression patterns (table 1). The infB mutation did not change NusG levels but decreased NusA and IF2 expression, the nusA mutation increased the protein levels of all three genes, and the fis mutation had no effect on any of the genes. Even though the nusA mutation increased the total NusA protein level it produced a truncated form with reduced function (Tsugawa et al. 1988). It is therefore likely that both the infB and nusA mutation lead to a reduction of NusA protein level/function indicating that NusA function in the inversion strain is partly responsible for the observed fitness cost. It is possible that an imbalance of NusG and NusA levels in the inversion strain lead to the observed reduction in Rho function (or skew toward the “wrong” termination sites). The compensatory function of the fis mutation remains unclear but might be due to global changes in gene expression.
Table 1.
Effect of Chromosomal Inversion and Compensatory Mutations on Fitness and Protein Expression Levels of Selected Genes.
| Genotype | Relative Fitness ± SD | Relative Protein Level ± SD |
||
|---|---|---|---|---|
| NusG | NusA | IF2 | ||
| INV(tufA–tufB) | 0.92 ± 0.02 | 1.00 ± 0.03 | 1.00 ± 0.02 | 1.00 ± 0.03 |
| INV(tufA–tufB), infB Q130* | 0.99 ± 0.02 | 1.04 ± 0.01 | 0.81 ± 0.01 | 0.44 ± 0.03 |
| INV(tufA–tufB), nusA Q350* | 1.02 ± 0.01 | 1.36 ± 0.02 | 1.88 ± 0.04 | 1.22 ± 0.04 |
| INV(tufA–tufB), fis nt G-72C | 0.97 ± 0.01 | 1.03 ± 0.01 | 1.07 ± 0.02 | 1.06 ± 0.02 |
Fitness relative to wild type ± standard deviation (n = 10).
Protein expression relative to inversion strain ± standard deviation (n = 4).
Combining our data, we propose the following scenario to explain the fitness cost in the inversion strain (fig. 3): 1) The inversion between the tuf genes fuses the strong tufA promoter to the tufB terminator. 2) The increased RNAP load on the tufB terminator reduces transcriptional initiation on the secE-nusG promoter, which reduces the cellular NusG level. 3) Rho function is disturbed by the imbalance in its cofactors NusG and NusA, which leads to the activation of membrane synthesis genes, flagella synthesis and iron scavenging systems. 4) An increase of the cellular iron level creates hydroxyl radicals via the Fenton reaction (Henle and Linn 1997), which oxidizes DNA bases and leads to the activation of the base excision repair genes. One, or a combination of these cellular changes, lead to the observed reduction of cellular fitness in the inversion strain.
Fig. 3.

Model of cellular changes in the inversion strain. The inversion between the tuf genes fuses the strong tufA promoter to the tufB terminator. The increased RNAP load on the tufB terminator reduces transcriptional initiation on the secE-nusG promoter, which reduces the cellular NusG level. Rho function gets disturbed by the imbalance of its cofactors NusG and NusA, which leads to the activation of membrane synthesis genes, flagella synthesis, and iron scavenging systems. An increase of the cellular iron level creates hydroxyl radicals via the Fenton’s reaction, which oxidizes DNA bases and leads to the activation of the base excision repair genes.
The Terminator–Promoter Overlap Potentially Serves as a Regulatory Element
Our results show that the concatenation of the tufB terminator and the secE promoter can affect expression of the secE operon. This indicates that the terminator–promoter overlap might have a regulatory function. We have recently shown that the expression of the tufB operon is autoregulated and that this regulation involves Rho-dependent transcriptional termination (Brandis et al. 2016). When tufB expression levels need to be high, transcriptional termination of the tufB gene gets inhibited, whereas Rho terminates transcription when tufB levels need to be low (Brandis et al. 2016). Our data show that tufB expression levels affect nusG expression and thereby affect Rho function. We suggest that this is a regulatory feedback mechanism that affects Rho functionality to support the tufB expression levels required (fig. 4).
Fig. 4.
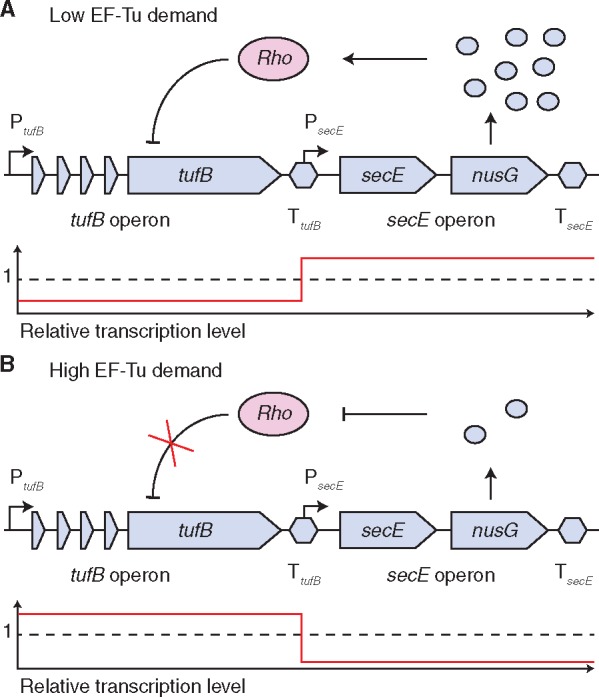
Model of the potential tufB-nusG regulatory feedback mechanism. (A) Reduced tufB expression levels increase expression of nusG. Elevated NusG levels interact with Rho to further reduce transcription of the tufB operon. (B) High expression levels of tufB inhibit transcriptional initiation of nusG. The reduced cellular NusG level inhibits Rho functionality and thereby inhibits Rho-dependent termination of the tufB gene. Relative transcription levels of all genes are indicated in the graph below the sequences. The dashed line indicates average expression levels.
Operon Concatenation Inhibits Fixation of Chromosomal Rearrangements That Separate the tufB and secE Operons
We found that the tufB terminator sequence overlaps with the secE-nusG promoter and that inversions between the tuf genes lead to reduced expression of secE and nusG, providing a selective force to maintain the colinearity of tufB and secE operons. We next decided to compare the tufB-secE intergenic sequence between a variety of Gammaproteobacteria species to see how conserved this chromosomal organization is. We found that this specific interoperon terminator–promoter organization evolved in the last common ancestor of the Enterobacteriales, Pasteurellales, and Vibrionales (fig. 5A). This coincides with the deletion of the tRNA gene from the secE operon, potentially linking these two events (fig. 1). The terminator–promoter overlap is highly conserved within these species with the exception of the Pasteurellales and the Morganellaceae. Interestingly, we found that the species that did not contain the interoperon terminator–promoter overlap all had rearrangements of the chromosome (translocations or inversions between the tuf genes) that interrupt the contiguity of the tufB and secE operons (fig. 5A). These data support the notion that chromosomal rearrangements separating the tufB and secE operons and the interoperon terminator–promoter organization are mutually exclusive.
Fig. 5.

Analysis of the interoperon sequences. (A) Comparison of tufB-secE interoperon sequence in the Enterobacteriales, Pasteurellales, Vibrionales orders with Aeromonas and Shewanella as closely related outgroup species. The phylogenetic tree is adapted from Williams et al. (2010) and Adeolu et al. (2016) and does not represent phylogenetic distance (Williams et al. 2010; Adeolu et al. 2016). The green star in the phylogenetic tree denotes the point at which the terminator–promoter overlap evolved and the magenta starts indicates events at which the overlap got lost. Species with chromosomal rearrangements between the tufB and secE operons are highlighted in blue. Analysis of (B) secE-rpoBC, (C) S10-spc, and (D) spc-alpha interoperon sequence in Salmonella. The −10 and −35 regions of promoters are shown in green and the terminator sequences are shown in magenta. The structure of terminators is indicated above the sequences. (E) Organization of the operon supercluster in Salmonella. Operons that remain colinear are indicated by brackets.
Operons of the Ancient Cluster That Remain Contiguous in Salmonella Are Concatenated
In Salmonella, six operons of the ancestral supercluster remain contiguous (tufB-secE-rpoBC and S10-spc-alpha). Our data show that the concatenation of the tufB and secE operons can explain the strong selection for the tufB-secE operon pair to remain colinear. We performed an analysis of the interoperon sequences of the other three operon pairs (secE-rpoBC, S10-spc, and spc-alpha) and found that each of the three intergenic sequences contained a similar terminator–promoter overlap (fig. 5B–D). These data indicate that operon concatenation is an ancient feature that could restrict the potential to rearrange bacterial chromosomes and select for the maintenance of a colinear operon organization over billions of years.
Discussion
The order of genes and operons on the bacterial chromosome is not conserved between distantly related species indicating that there is very little general selection at the chromosome level to maintain a specific linear gene organization (Koonin et al. 1996; Tatusov et al. 1996). Surprisingly, there are some striking exceptions to this rule where operons have remained colinear since the split of the archaea and bacteria, demonstrating a significant selective pressure to maintain the ancient order. So far, the underlying mechanism behind this selection is only poorly understood (Tamames 2001).
Here, we have shown that the operon pairs of the ancestral Gammaproteobacterial operon supercluster that remained colinear in Salmonella (tufB-secE, secE-rpoBC, S10-spc, and spc-alpha) are each concatenated by interoperon terminator–promoter overlaps. For one operon pair, tufB-secE, we have shown that this interoperon feature is a strong selective force for the two operons to remain colinear as a chromosomal rearrangement that separates the operons is associated with a significant fitness cost. Furthermore, our data in combination with our previous study (Brandis et al. 2016) indicate that the terminator–promoter overlap serves a regulatory function in optimizing gene expression levels. Our evolution experiment shows that the fitness cost associated with the separation of the tufB and secE operons can be compensated for while growing under optimal conditions in rich medium. The compensatory mechanisms involve changes to genes that are crucially important to global regulatory networks (Fis and NusA). Although having a benefit to the bacteria under these constant and optimal growth conditions, it is unlikely that these changes are beneficial under the varying conditions that bacteria have to face in the environment. This effect was evident during growth in minimal media, where the compensatory mutations reduced the cellular fitness by up to 50% (supplementary table S5, Supplementary Material online).
The interoperon terminator–promoter sequences that we have identified could explain the maintained organization of these operons in multiple ways. First of all, this organization restricts the sequence region in which new genetic information could be inserted in a neutral fashion to the region between the stop codon of the last coding sequence in one operon and the beginning of the promoter of the next operon. In the case of the tufB-secE region, this space is only 13 nucleotides long (McClelland et al. 2001). Any insertion beyond this point would require the new insert to carry a suitable promoter to express the genes of the succeeding operon. The operons in this supercluster are generally highly expressed and regulated on multiple levels making it unlikely that any random promoter would be able to satisfy the conditions to produce these proteins in an efficient and suitably regulated manner (Dean and Nomura 1980; Yates et al. 1980). Second, as shown here, the interoperon feature in tufB-secE operon pair links the expression regulation of the two operons and therefore directly selects against operon separation. The terminator–promoter overlaps possibly affect gene expression of the other operon pairs in a similar fashion. It is surprising that such an interoperon feature is found in all of the operon pairs that have remained in the ancestral organization. It is an intriguing speculation that this feature represents an ancient mechanism of gene expression regulation that does not require separately encoded transcription factors but is based instead on promoter exclusion.
Our data indicate that the separation of these conserved operons follows a predictable pattern that is initiated by a small multigene insertion. Interestingly, the genes that are inserted between the operons in Salmonella (rrnB-tufB: murB, birA, coaA, and STM4141; str-S10: bfd, bfr, and hopD) are not associated with genetic mobility. This raises the question of how these genes were initially inserted into these locations. Acquisition of a horizontally transferred segment from a bacterium with a different chromosomal organization could be an explanation but would only move the question of the rearrangement to another bacterium. Other potential explanations are that mobile genetic elements translocate a segment of the genome and excise without leaving a trace or that the bacterial recombination systems accidentally relocate chromosomal segments with short or imperfect homologies. Independent of the precise underlying mechanism, these results show that small multigene segments can translocate within the bacterial genome and present an example of chromosome fluidity.
In summary, we have shown that concatenated operons encoding genes of the transcriptional and translational machinery are an ancient and highly conserved feature of prokaryotic organisms. In the case of the tufB-secE operons, the overlap of transcription termination and promoter regions plays a significant role in global gene expression regulation. Disrupting this chromosome organizational feature reduces bacterial fitness and acts as a strong selection to maintain the ancient organization over evolutionary timescales.
Materials and Methods
Bacterial Growth Conditions
Bacteria were grown in Lysogeny Broth (LB) medium medium (10% tryptone, 5% yeast extract [Oxoid, Basingstoke, UK] and 10% NaCl [Merck, Darmstadt, Germany]), on LA plates (LB with 1.5% agar, Oxoid) or on M9 minimal media plates (35-mM Na2HPO4, 22-mM KH2PO4, 7-mM NaCl, 19-mM NH4Cl, 0.1-mM CaCl, and 1-mM MgSO4 [Sigma Aldrich, Steinheim, Germany] with 1.5% agar [Oxoid]) with 0.2% lactose.
Bacterial Strains and Strain Constructions
All strains are derivatives of Salmonella enterica serovar Typhimurium, strain LT2 (McClelland et al. 2001). Strain constructions were performed using dsDNA recombineering (Yu et al. 2000) or by recombineering using ssDNA oligonucleotides (Ellis et al. 2001). Genetic markers were moved between isolates using the Duplication-Insert recombineering method (Nasvall et al. 2017) and P22 HT phage mediated transduction (Schmieger and Backhaus 1973).
Construction of Chromosomal Inversion
A chromosomal inversion between the tuf genes was constructed in four steps. 1) A translational fusion of a tufB-lacZ gene was constructed turning the resulting Salmonella strain Lac+. 2) A stop codon was inserted into the middle of the tufB gene to render the strain Lac−. 3) Cultures were plated on minimal medium containing 0.2% lactose to select for growth on lactose. This phenotype can be achieved by homologous recombination that causes an inversion between the two tuf genes and replace the stop codon (Abdulkarim and Hughes 1996). A PCR-based screen was used to identify inversions. 4) A strain containing the inversion between the tuf genes was isolated and the lacZ gene was removed. The resulting strain was whole-genome sequenced to confirm the genotype.
Fitness Determination
Relative fitness was determined in growth competition experiments against an isogenic wild type. Fluorescent markers (bfp or yfp) were inserted into the galK gene for strain identification. The competing strains were grown separately overnight in LB medium after which they were mixed equally. The bacterial mixture was serially passaged by 128-fold dilution in 0.2-ml fresh LB medium followed by overnight growth (resulting in seven generations of growth per cycle) for two cycles. The ratio between the two isolates was determined using a MACSQuant VYB (Miltenyi Biotec), counting 105 cells at each cycle. Relative fitness was calculated as previously described (Gullberg et al. 2011). All values are the mean ± standard deviation of ten independent experiments.
Gene Overexpression Assay
The nusG and secE genes were cloned behind a set of constitutively expressed promoters. A bfp gene was transcriptionally fused to the respective genes to determine promoter activity. The resulting constructs were moved into the galK genes of a wild type and an inversion strain. Fitness effects of gene overexpression were determined relative to the isogenic wild type and promoter strength was measured as BFP intensity was using a MACSQuant VYB (Miltenyi Biotec) counting 105 cells. All values are mean ± standard deviation of four independent experiments.
Evolution by Serial Passage
Ten independent lineages were grown in 15-ml tubes with shaking at 37 °C overnight in LB. The lineages were serially passaged after each cycle of growth by transferring 2 µl of overnight culture into 2 ml of fresh media to initiate the next cycle of growth. Each lineage was evolved for 50 cycles (500 generations), after which dilutions were plated on LA and visually examined after overnight incubation at 37 °C. For each lineage, the colony with the largest colony size was isolated for further analysis.
PCR and DNA Sequencing
PCRs for recombineering were done using Phusion High Fidelity PCR Master Mix (New England Biolabs, Ipswich, USA). For screening and sequencing, the Taq polymerase-based PCR Master Mix from Thermo Scientific (Waltham, USA) was used. Reactions were run on a S1000 Thermal Cycler from Bio-Rad (Hercules, USA). Oligos for PCR were all purchased from Sigma Aldrich. Denaturing temperature for PCR reactions was either 98 or 95 °C, for Phusion or Taq polymerase, respectively. The primer annealing temperature was calculated as 5 °C below the primer melting temperature and the elongation time set as 1 min/kb of product length. PCR products were prepared with the QIAquick PCR Purification Kit (Qiagen). Local sequencing was carried out by Macrogen Incorporated, Amsterdam, the Netherlands. The software CLC Main Workbench 7.7.2 from Qiagen was used for primer design, sequence analysis, and sequence comparisons. Whole-genome sequencing was performed as follows: Genomic DNA was prepared using the MasterPure DNA Purification Kit (Epicenter, Illumina Inc., Madison, WI) according to the manufacturer’s instructions. Genomic DNA concentrations were measured in a Qubit 2.0 Fluorometer (Invitrogen via ThermoFisher Scientific). DNA was diluted to 0.2 ng μl−1 in water (Sigma-Aldrich, Sweden) and the samples were prepared for whole-genome sequencing as according to Nextera XT DNA Library Preparation Guide (Rev. D) (Illumina Inc.). After the PCR cleanup-step, samples were validated for DNA fragment size distribution using the Agilent High Sensitivity D1000 ScreenTape System (Agilent Technologies, Santa Clara, CA). Sequencing was performed using MiSeq desktop sequencer, according to the manufacturer’s instructions (Illumina Inc.).
mRNA Expression Analysis
Expression levels of genes in the tufA and secE operon were determined using quantitative real-time PCR. Cultures were grown under aeration at 37 °C to midexponential phase and 1.5 ml of each culture were treated with 3-ml RNAprotect Bacteria Reagent (Qiagen). Total RNA was extracted using the RNeasy Mini Kit (Qiagen) and treated with the DNAase Turbo DNA-free kit (Ambion, Life Technologies) to remove chromosomal DNA. RNA was reverse transcribed into cDNA using the High Capacity Reverse Transcription kit (Applied Biosystems). The Eco Real-Time PCR system (Illumina) and PerfeCTa SYBR Green FastMix (Quanta BioSciences) were used for mRNA quantification. All used oligonucleotides are listed in supplementary table S6, Supplementary Material online. All results are mean ± standard deviation of four independent experiments.
For full transcriptome analysis, cultures were grown under aeration at 37 °C to midexponential phase. Three milliliters of each culture were mixed with 6 ml of RNAprotect Bacteria Reagent (Qiagen) and pelleted under centrifugation. Frozen cell pellets were sent to BGI (Tai Po, Hong Kong) for analysis. Differential expression was determined by BGI using the EBSeq method testing for the posterior probability of equal expression. All RNA sequencing was done on two independent cultures per isolate.
Protein Expression Analysis
Protein expression analysis of NusG, NusA, and IF2 was performed using a translational yfp fusion. A genetic cassette consisting of a yfp gene without start codon followed by a transcriptionally fused kanamycin resistance gene (as selectable marker) was used to replace the stop codon of the nusG and infB genes or codon 350 of the nusA gene (due to the premature stop codon in one of the isolates). Translational fusions of these genes to a yfp gene most likely lead to inactivation of their function. Therefore, the recombineering was designed to simultaneously duplicate the respective operons so that one copy is a translational fusion to yfp (fluorescence can be used as a measure of protein expression level) and the other copy remains functional to ensure cell viability. YFP intensity was using a MACSQuant VYB (Miltenyi Biotec), counting 105 cells of overnight cultures. All values are mean ± standard deviation of four independent experiments.
Phylogenetic Analysis
The reconstruction of the ancestral gene order of the operon supercluster was previously performed (Wachtershauser 1998; Barloy-Hubler et al. 2001; Coenye and Vandamme 2005). Phylogenetic relationships of the displayed species are adapted from Adeolu et al. (2016) for Enterobacteriales, Williams et al. (2010) for Gammaproteobacteria, and Ciccarelli et al. (2006) for Proteobacteria (Ciccarelli et al. 2006; Williams et al. 2010; Adeolu et al. 2016). Analysis of chromosomal gene orders and sequence alignments were performed using software CLC Main Workbench 7.7.2 (Qiagen). Strain details and accession numbers are listed in supplementary table S7, Supplementary Material online.
Statistical Analysis
Statistical analysis of the quantitative real-time PCR results was performed with the R software version 2.15.2 using two-sided unpaired t-tests. All results are presented as mean ± standard deviation of four independent experiments. Transcriptome analysis was performed by BGI using the EBSeq method testing for the posterior probability of equal expression. All values are mean of two independent experiments.
Supplementary Material
Supplementary data are available at Molecular Biology and Evolution online.
Supplementary Material
Acknowledgments
This work was supported by grants to D.H. from the Swedish Science Research Council (Vetenskapsrådet, grant numbers 2016-04449 and 2017-03953) and the Carl Trygger Foundation (grant numbers CTS16:194 and CTS17:204). We like to thank Lionel Guy for constructive discussions on the phylogenetic analysis.
Author Contributions
G.B., S.C., and D.H. designed the study. G.B. and S.C. performed the experiments and analyzed the data. G.B., S.C., and D.H. wrote the manuscript.
References
- Abdulkarim F, Hughes D.. 1996. Homologous recombination between the tuf genes of Salmonella typhimurium. J Mol Biol. 2604:506–522. [DOI] [PubMed] [Google Scholar]
- Adeolu M, Alnajar S, Naushad S, Gupta RS.. 2016. Genome-based phylogeny and taxonomy of the ‘Enterobacteriales’: proposal for Enterobacterales ord. nov divided into the families Enterobacteriaceae, Erwiniaceae fam. nov., Pectobacteriaceae fam. nov., Yersiniaceae fam. nov., Hafniaceae fam. nov., Morganellaceae fam. nov., and Budviciaceae fam. nov. Int J Syst Evol Microbiol. 66:5575–5599. [DOI] [PubMed] [Google Scholar]
- Barloy-Hubler F, Lelaure V, Galibert F.. 2001. Ribosomal protein gene cluster analysis in eubacterium genomics: homology between Sinorhizobium meliloti strain 1021 and Bacillus subtilis. Nucleic Acids Res. 2913:2747–2756. [DOI] [PMC free article] [PubMed] [Google Scholar]
- Brandis G, Bergman JM, Hughes D.. 2016. Autoregulation of the tufB operon in Salmonella. Mol Microbiol. 1006:1004–1016. [DOI] [PubMed] [Google Scholar]
- Brandis G, Cao S, Hughes D.. 2018. Co-evolution with recombination affects the stability of mobile genetic element insertions within gene families of Salmonella. Mol Microbiol. 1086:697–710. [DOI] [PubMed] [Google Scholar]
- Brocks JJ, Love GD, Summons RE, Knoll AH, Logan GA, Bowden SA.. 2005. Biomarker evidence for green and purple sulphur bacteria in a stratified Palaeoproterozoic sea. Nature 4377060:866–870. [DOI] [PubMed] [Google Scholar]
- Brocks JJ, Schaeffer P.. 2008. Okenane, a biomarker for purple sulfur bacteria (Chromatiaceae), and other new carotenoid derivatives from the 1640 Ma Barney Creek Formation. Geochim Cosmochim Acta 725:1396–1414. [Google Scholar]
- Burns CM, Richardson JP.. 1995. NusG is required to overcome a kinetic limitation to Rho-function at an intragenic terminator. Proc Natl Acad Sci U S A. 9211:4738–4742. [DOI] [PMC free article] [PubMed] [Google Scholar]
- Ciccarelli FD, Doerks T, von Mering C, Creevey CJ, Snel B, Bork P.. 2006. Toward automatic reconstruction of a highly resolved tree of life. Science 3115765:1283–1287. [DOI] [PubMed] [Google Scholar]
- Coenye T, Vandamme P.. 2005. Organisation of the S10, spc and alpha ribosomal protein gene clusters in prokaryotic genomes. FEMS Microbiol Lett. 2421:117–126. [DOI] [PubMed] [Google Scholar]
- Dean D, Nomura M.. 1980. Feedback regulation of ribosomal protein gene expression in Escherichia coli. Proc Natl Acad Sci U S A. 776:3590–3594. [DOI] [PMC free article] [PubMed] [Google Scholar]
- Ellis HM, Yu DG, DiTizio T, Court DL.. 2001. High efficiency mutagenesis, repair, and engineering of chromosomal DNA using single-stranded oligonucleotides. Proc Natl Acad Sci U S A. 9812:6742–6746. [DOI] [PMC free article] [PubMed] [Google Scholar]
- Ermolaeva MD, White O, Salzberg SL.. 2001. Prediction of operons in microbial genomes. Nucleic Acids Res. 295:1216–1221. [DOI] [PMC free article] [PubMed] [Google Scholar]
- Gullberg E, Cao S, Berg OG, Ilback C, Sandegren L, Hughes D, Andersson DI.. 2011. Selection of resistant bacteria at very low antibiotic concentrations. PLoS Pathog. 77:e1002158.. [DOI] [PMC free article] [PubMed] [Google Scholar]
- Henle ES, Linn S.. 1997. Formation, prevention, and repair of DNA damage by iron hydrogen peroxide. J Biol Chem. 27231:19095–19098. [DOI] [PubMed] [Google Scholar]
- Hughes D. 1986. The isolation and mapping of EF-Tu mutations in Salmonella typhimurium. Mol Gen Genet. 2021:108–111. [DOI] [PubMed] [Google Scholar]
- Hughes D. 1990. Both genes for EF-Tu in Salmonella typhimurium are individually dispensable for growth. J Mol Biol. 2151:41–51. [DOI] [PubMed] [Google Scholar]
- Hughes D. 2000. Co-evolution of the tuf genes links gene conversion with the generation of chromosomal inversions. J Mol Biol. 2972:355–364. [DOI] [PubMed] [Google Scholar]
- Itoh T, Takemoto K, Mori H, Gojobori T.. 1999. Evolutionary instability of operon structures disclosed by sequence comparisons of complete microbial genomes. Mol Biol Evol. 163:332–346. [DOI] [PubMed] [Google Scholar]
- Jaskunas SR, Lindahl L, Nomura M.. 1975. Identification of two copies of the gene for the elongation factor EF-Tu in E. coli. Nature 2575526:458–462. [DOI] [PubMed] [Google Scholar]
- Knoppel A, Knopp M, Albrecht LM, Lundin E, Lustig U, Nasvall J, Andersson DI.. 2018. Genetic adaptation to growth under laboratory conditions in Escherichia coli and Salmonella enterica. Front Microbiol. 9:756.. [DOI] [PMC free article] [PubMed] [Google Scholar]
- Koonin EV, Mushegian AR, Rudd KE.. 1996. Sequencing and analysis of bacterial genomes. Curr Biol. 64:404–416. [DOI] [PubMed] [Google Scholar]
- Lawrence JG, Roth JR.. 1996. Selfish operons: horizontal transfer may drive the evolution of gene clusters. Genetics 1434:1843–1860. [DOI] [PMC free article] [PubMed] [Google Scholar]
- Marin J, Battistuzzi FU, Brown AC, Hedges SB.. 2017. The timetree of prokaryotes: new insights into their evolution and speciation. Mol Biol Evol. 342:437–446. [DOI] [PubMed] [Google Scholar]
- Matsumoto Y, Shigesada K, Hirano M, Imai M.. 1986. Autogenous regulation of the gene for transcription termination factor-Rho in Escherichia coli—localization and function of its attenuators. J Bacteriol. 1663:945–958. [DOI] [PMC free article] [PubMed] [Google Scholar]
- McClelland M, Sanderson KE, Spieth J, Clifton SW, Latreille P, Courtney L, Porwollik S, Ali J, Dante M, Du FY.. 2001. Complete genome sequence of Salmonella enterica serovar Typhimurium LT2. Nature 4136858:852–856. [DOI] [PubMed] [Google Scholar]
- Moreno-Hagelsieb G, Trevino V, Perez-Rueda E, Smith TF, Collado-Vides J.. 2001. Transcription unit conservation in the three domains of life: a perspective from Escherichia coli. Trends Genet. 174:175–177. [DOI] [PubMed] [Google Scholar]
- Nasvall J, Knoppel A, Andersson DI.. 2017. Duplication-insertion recombineering: a fast and scar-free method for efficient transfer of multiple mutations in bacteria. Nucleic Acids Res. 455:e33.. [DOI] [PMC free article] [PubMed] [Google Scholar]
- Overbeek R, Fonstein M, D’Souza M, Pusch GD, Maltsev N.. 1999. The use of gene clusters to infer functional coupling. Proc Natl Acad Sci U S A. 966:2896–2901. [DOI] [PMC free article] [PubMed] [Google Scholar]
- Paulsson J, El Karoui M, Lindell M, Hughes D.. 2017. The processive kinetics of gene conversion in bacteria. Mol Microbiol. 1045:752–760. [DOI] [PMC free article] [PubMed] [Google Scholar]
- Roberts JW. 1969. Termination factor for RNA synthesis. Nature 2245225:1168. [DOI] [PubMed] [Google Scholar]
- Sacerdot C, Vachon G, Laalami S, Morel-Deville F, Cenatiempo Y, Grunberg-Manago M.. 1992. Both forms of translational initiation factor-IF2 (alpha and beta) are required for maximal growth of Escherichia coli—evidence for 2 translational initiation codons for IF2-beta. J Mol Biol. 2251:67–80. [DOI] [PubMed] [Google Scholar]
- Schmieger H, Backhaus H.. 1973. The origin of DNA in transducing particles in P22-mutants with increased transduction-frequencies (HT-mutants). Mol Gen Genet. 1202:181–190. [DOI] [PubMed] [Google Scholar]
- Snel B, Bork P, Huynen MA.. 2002. The identification of functional modules from the genomic association of genes. Proc Natl Acad Sci U S A. 999:5890–5895. [DOI] [PMC free article] [PubMed] [Google Scholar]
- Tamames J. 2001. Evolution of gene order conservation in prokaryotes. Genome Biol. 26:RESEARCH0020.. [DOI] [PMC free article] [PubMed] [Google Scholar]
- Tamames J, Casari G, Ouzounis C, Valencia A.. 1997. Conserved clusters of functionally related genes in two bacterial genomes. J Mol Evol. 441:66–73. [DOI] [PubMed] [Google Scholar]
- Tamames J, Gonzalez-Moreno M, Mingorance J, Valencia A, Vicente M.. 2001. Bringing gene order into bacterial shape. Trends Genet. 173:124–126. [DOI] [PubMed] [Google Scholar]
- Tatusov RL, Mushegian AR, Bork P, Brown NP, Hayes WS, Borodovsky M, Rudd KE, Koonin EV.. 1996. Metabolism and evolution of Haemophilus influenzae deduced from a whole-genome comparison with Escherichia coli. Curr Biol. 63:279–291. [DOI] [PubMed] [Google Scholar]
- Tsugawa A, Saito M, Court DL, Nakamura Y.. 1988. NusA amber mutation that causes temperature-sensitive growth of Escherichia coli. J Bacteriol. 1702:908–915. [DOI] [PMC free article] [PubMed] [Google Scholar]
- Tubulekas I, Hughes D.. 1993. Growth and translation elongation rate are sensitive to the concentration of EF-Tu. Mol Microbiol. 84:761–770. [DOI] [PubMed] [Google Scholar]
- Wachtershauser G. 1998. Towards a reconstruction of ancestral genomes by gene cluster alignment. Syst Appl Microbiol. 21:473–477. [Google Scholar]
- Williams KP, Gillespie JJ, Sobral BWS, Nordberg EK, Snyder EE, Shallom JM, Dickerman AW.. 2010. Phylogeny of Gammaproteobacteria. J Bacteriol. 1929:2305–2314. [DOI] [PMC free article] [PubMed] [Google Scholar]
- Yates JL, Arfsten AE, Nomura M.. 1980. In vitro expression of Escherichia coli ribosomal protein genes: autogenous inhibition of translation. Proc Natl Acad Sci U S A. 774:1837–1841. [DOI] [PMC free article] [PubMed] [Google Scholar]
- Yu DG, Ellis HM, Lee EC, Jenkins NA, Copeland NG, Court DL.. 2000. An efficient recombination system for chromosome engineering in Escherichia coli. Proc Natl Acad Sci U S A. 9711:5978–5983. [DOI] [PMC free article] [PubMed] [Google Scholar]
Associated Data
This section collects any data citations, data availability statements, or supplementary materials included in this article.