


Abstract
The understanding of the multi-scale nature of molecular networks represents a major challenge. For example, regulation of a timely cell cycle must be coordinated with growth, during which changes in metabolism occur, and integrate information from the extracellular environment, e.g. signal transduction. Forkhead transcription factors are evolutionarily conserved among eukaryotes, and coordinate a timely cell cycle progression in budding yeast. Specifically, Fkh1 and Fkh2 are expressed during a lengthy window of the cell cycle, thus are potentially able to function as hubs in the multi-scale cellular environment that interlocks various biochemical networks. Here we report on a novel ChIP-exo dataset for Fkh1 and Fkh2 in both logarithmic and stationary phases, which is analyzed by novel and existing software tools. Our analysis confirms known Forkhead targets from available ChIP-chip studies and highlights novel ones involved in the cell cycle, metabolism and signal transduction. Target genes are analyzed with respect to their function, temporal expression during the cell cycle, correlation with Fkh1 and Fkh2 as well as signaling and metabolic pathways they occur in. Furthermore, differences in targets between Fkh1 and Fkh2 are presented. Our work highlights Forkhead transcription factors as hubs that integrate multi-scale networks to achieve proper timing of cell division in budding yeast.
INTRODUCTION
Biological systems exploit their functions across space and time, and their robustness results from the coherent integration of functionally diverse elements (e.g. molecules and modules) that interact selectively and non-linearly (1). Thus, the cross-talk between modules representing cellular layers of regulation (e.g. gene regulation, cell cycle, metabolism and signal transduction) is crucial to achieve system’s functions. In this context, identification of elements with high connectivity (hubs) bridging multiple spatial, temporal and functional scales within cellular networks is a major challenge in Systems Biology. This also holds for the generation of multi-scale models to understand how a function emerges from a network of interactions (2).
Transcription factors are pivotal in gene regulation, by switching on or off entire molecular pathways, thus modulating their activity or, more subtly, affecting the timing of their activation. Among these regulators, Forkhead (Fkh) transcription factors (Forkhead Box (FOX) in mammals) are highly conserved across eukaryotes, and have garnered interest because of their involvement in multiple cellular pathways that, when dysregulated, may lead to development of pathologies such as neurodegeneration and cancer, and aging (3–6).
The homologues of the FOX proteins in budding yeast, Fkh1 and Fkh2, play an essential role as regulators of the CLB2-cluster, i.e. a set of genes transcriptionally regulated after CLB2 activation (7). This set consists of 33 genes whose transcription peaks in late G2/early M phase of the cell cycle (7). Fkh2 promotes activation of the CLB2 promoter, in complex with the Mcm1 scaffold protein and the co-activator Ndd1, leading to cell division (8–11). Fkh1 function overlaps with Fkh2, but it binds less efficiently to the CLB2 promoter and represses CLB2 transcription (12–14).
We have recently demonstrated that Fkh2 synchronizes the temporal expression of mitotic CLB genes by connecting the cyclins CLB5, CLB3 and CLB2 in a linear cascade, and ensuring their timely activation (15). We also showed, with others (16), an Ndd1/Fkh interaction, but the function of this complex is currently not understood. Fkh1 is expressed during S and G2 phases, and its transcript levels peak in the S phase, whereas Fkh2 is expressed from G1 until the M phase, and its transcript levels peak during the G1(P) (pre-replicative G1) and S phase (17,18). This relatively lengthy window of expression, in particular for Fkh2, may allow the Fkh’s to potentially interact with a diverse set of temporally separated cellular pathways.
We have also shown an interplay between metabolism and cell cycle, with the NAD+-dependent histone deacetylases Sir2 modulating the Fkh-dependent regulation of target genes (19). Sir2 associates with Fkh in the G1 and M phases, where it inhibits activation of CLB2 through Fkh-mediated binding to the CLB2 promoter (19). The NAD+/NADH ratio reflects the intracellular redox state, and is a readout of metabolic activity (20).
Additional data also suggest a possible role of Fkh in cellular processes beside cell cycle regulation. A genetic approach based on a microarray-based RNA profiling identified four target genes of Fkh1 and two targets of Fkh2 (21). Furthermore, chromatin immunoprecipitation (ChIP)-based methodologies, specifically ChIP-chip (22), have retrieved hundreds of targets of Fkh1 and Fkh2 (23–25). Moreover, ChIP-chip-based computational strategies to identify sequence patterns that bind to transcription factors (referred to as binding motifs) have identified similar binding motifs for Fkh1 and Fkh2 (25), as also reported in the YeTFaSCo database (26).
These studies identified several potential Fkh targets in metabolism. For example, Fkh1 has been suggested to regulate FAB1, which encodes a vacuolar membrane kinase that generates phosphatidylinositol—the latter involved in vacuolar sorting and homeostasis—and ALG5, which encodes a β-glucosyltransferase that is involved in asparagine-linked glycosylation in the endoplasmic reticulum (23–25). Similarly, Fkh2 has been suggested to regulate several metabolic enzymes such as: GLN1, encoding a glutamine synthetase that synthesizes glutamine from glutamate and ammonia; IDI1, encoding an isopentenyl diphosphate that catalyzes an essential activation step in the isoprenoid biosynthetic pathway; and UTH1, encoding a mitochondrial inner membrane protein implicated in cell wall biogenesis (23–25). Furthermore, HOS3, encoding a histone deacetylase, has been shown as a common enzymatic target of Fkh1 and Fkh2 (23–25). Together, this evidence suggests a Fkh-mediated connectivity between cell cycle and metabolism.
Here, we provide a comprehensive, up-to-date overview of the current knowledge of Fkh target genes. First, we report on a novel dataset of Fkh targets using ChIP-exo, which combines ChIP with lambda exonuclease digestion followed by high-throughput sequencing, which allows identification of a nearly complete set of binding sites at near single-nucleotide resolution (27). We have recently employed ChIP-exo to investigate targets of transcription factors in budding yeast (28,29). The ChIP-exo dataset generated in this study was annotated using GEMMER, a novel web-based data-integration and visualization tool that we have recently developed to integrate and visualize the large experimental data available for budding yeast (30). Subsequently, known and novel Fkh target genes were analyzed with respect to their function, temporal expression during the cell cycle as well as signaling and metabolic pathways they occur in. Emphasis is given to target connecting cell cycle with other cellular processes, in particular metabolism. Our study clarifies and expands the understanding on the role that Fkh have as hubs that integrate multi-scale regulatory networks to achieve proper timing of cell division.
MATERIALS AND METHODS
Yeast strains and growth conditions
The yeast strain BY4741 (MATa his3Δ1 leu2Δ0 met15Δ0 ura3Δ0) was used to generate the respective strains Fkh1-Myc (FKH1-MYC9::kanMX6) and Fkh2-Myc (FKH2-MYC9::kanMX6), as described (19). Yeast strains were grown on plates with YPD with G418 (Formedium) 200 mg/l or in liquid cultures of defined media containing NH4SO4 3.75 g/l, KH2PO4 7.18 g/l, MgSO4 0.25 g/l, glucose 10 g/l, Complete supplement mix (Formedium, DCS0019 - Adenine 5 mg/l, L-Arg 25 mg/l, L-Asp 40 mg/l, L-His 10 mg/l, L-Iso 25 mg/l, L-Leu 50 mg/l, L-Lys 25 mg/l, L-Met 10 mg/l, l-Phe 25 mg/l, L-Thr 50 mg/l, L-Trp 25 mg/l, L-Tyr 25 mg/l, Uracil 10 mg/l, Val 70 mg/l), Vitamin solution (D-Biotin 0.05 mg/l, D-Pantothenic acid 1 mg/l, Thiamin-HCl 1 mg/l, Pyridoxin-HCl 1 mg/l, Nicotinic acid 1 mg/l, 4-aminobenzoic acid 0.2 mg/l, myo-insoitol 25 mg/l) and Trace metal solution (FeSO4 3 mg/l, ZnSO4 4.5 mg/l, CaCl2 4.5 mg/l, MnCl2 0.84 mg/l, CoCl2 0.3 mg/l, CuSO4 0.3 mg/l, Na2MoO4 0.4 mg/l, H3BO3 1.0 mg/l, KI 0.1 mg/l, Na2EDTA 19 mg/l). pH of defined media was adjusted to 6.35 by adding KOH.
ChIP-exo
To start the liquid cultures, a yeast colony carrying Fkh1-Myc or Fkh2-Myc was picked mid-day into the above defined media and cultured with shaking at 30°C until the next morning. Cultures were then split to become logarithmic and stationary phase cultures. Cultures in logarithmic phase were started at OD600 ∼ 0.2 and grown until OD600 for Fkh1 replicates: 0.75, 0.72 and Fkh2 replicates: 0.80, 0.80. Cultures in stationary phase were grown until the afternoon and collected until OD600 for Fkh1 replicates: 2.00, 1.70 and Fkh2 replicates: 1.76, 1.78. For the ChIP-exo experiments, 100 OD of cells were collected from each culture, diluted to OD600 ∼ 0.7 with water, added with formaldehyde (Sigma F8775) to a final concentration of 1% and left shaking at room temperature for 15 min. Glycine (Sigma G7126) was added to quench the cross-linking at a final concentration of 125 mM and left shaking for 5 min. Cells were then washed twice with cold TBS (Tris-HCl (Sigma 252859) pH 7.5 1 mM, NaCl (Sigma, S3014) 150 mM) and snap frozen in liquid N2. ChIP-exo was performed according to the original protocol (27) with modifications as described (31).
Data processing
Raw reads were mapped to the SacCer3 genome (S288C_reference_sequence_R64–2-1_20150113.fsa, downloaded from the Saccharomyces Genome Database (SGD) website (https://downloads.yeastgenome.org/sequence/S288C_reference/genome_releases/) with Bowtie2 (32). SAM files were converted to BAM files, sorted and indexed using SAMtools 1.3.1 (33). ChIP-exo data analysis was performed through a pipeline that uses two existing software tools and a novel method, which we refer to as maxPeak, for peak detection. The existing tools, GEM (Genome wide Event finding and Motif discovery) (34) and MACE (Model based Analysis of ChIP-Exo) (35), require the sorted and indexed BAM files as input and use iteration schemes to identify and enrich peaks. Data analysis by GEM and MACE was performed through the command line. GEM and MACE require a relatively large amount of strong peaks to iterate successfully. MACE was able to analyze the Fkh1 data but unable to iterate on the Fkh2 data due to the relatively low number of peaks detected. Specifically, MACE detected only 25 strong peaks (called ‘elite border pairs’) for the Fkh2 data, while it requires more than 30 by default. Therefore, in order to analyze the Fkh2 data, the threshold was reduced to 25 elite border pairs. This choice comes at the cost of a higher potential for picking up noise and low quality binding events.
The maxPeak peak detection method was applied, starting from the indexed BAM files, using a combination of bash scripts and R scripts. Based on the principle of ChIP-exo, there is a transcription factor-specific optimal read length, where the whole binding site is covered by reads on both DNA strands, which corresponds to the width of the DNA covered by the transcription factor. We manually identified this read length by comparing the raw read alignments for several genes exhibiting a strong peak. We observed that a read length of 12 bp corresponds well to the strong peaks for both Fkh1 and Fkh2 (data not shown). This is consistent with the previously identified binding motifs for Fkh1 and Fkh2, which have been reported to cover a length of 8 and 7 bp, respectively (25), as the ChIP-exo read length is slightly larger than the binding motif due to additional ‘head room’ that the exonuclease cannot reach.
In the maxPeak method, the number of reads on both + and – DNA strands was summed up genome wide for each nucleotide position. At this stage, biological duplicates were averaged. Finally, by using the R environment for statistical computing and graphics, the 65th percentile of the maximum read counts for genes that had a maximum > 0 was calculated for each experimental condition (logarithmic and stationary phases) independently, creating one noise threshold level per experiment. The highest read count per gene was then divided by the noise threshold for each experiment to calculate the signal-to-noise ratio (SNR). Essentially, maxPeak ranks genes based on their signal. The 65th percentile normalization threshold is irrelevant for the ranking of the genes, and it only serves to set a rough threshold below which a gene’s signal is considered as noise. We did not average the read counts among the experiments of each Fkh transcription factor because a significantly higher signal in the stationary phase experiments for both Fkh1 and Fkh2 was observed. This evidence suggests that there is no equal background noise across the different conditions, and that averaging may result in retrieving false positives as a consequence of the lowered threshold for the stationary phase experiments.
To score the significance of the target genes retrieved, maxPeak and GEM assign SNRs, whereas MACE assigns P-values. A comparison between the principle of working of maxPeak, GEM and MACE methods is shown in Supplementary Materials and Methods, Supplementary Figure S1, whereas the specific thresholds used for each peak detection method (PDM) are indicated in Figure 1 and in Supplementary Materials and Methods, Supplementary Figures S2–S4. The scripts used for data processing and the unannotated output from maxPeak, GEM and MACE are available as Supplementary Code Repository.
Figure 1.

Comparison of GEM SNRs versus MACE SNRs for target genes that scored a MACE P-value lower than 0.01. (A) Fkh1, exponential phase. (B) Fkh1, stationary phase. (C) Fkh2, exponential phase. (D) Fkh2, stationary phase. The horizontal and vertical black dotted lines represent the GEM and MACE target thresholds, respectively. Blue circles represent genes that were assigned a SNR ≥ 1 by maxPeak. Red circles represent genes that were assigned a SNR < 1. Genes with circles in the upper-left quadrant of each panel were considered targets. Blue circles in the bottom-left and upper-right quadrants of each panel were also considered targets.
Gene annotation and data analysis
In budding yeast, the median promoter length is 455 bp (36). To also cover the promoter regions that are longer than this median length, we have recently considered a window length of 1000 bp (28,29,31). In this work, we analyzed the data for binding enrichment up to 1000 bp upstream of the start of 7217 ORFs (Open Reading Frames) annotated in the sacCer3 genome, possibly reaching the coding sequence of an upstream gene. Gene annotation was performed through GEMMER, a novel web-based data-integration and visualization tool that we have recently developed for budding yeast (30) (Supplementary Materials and Methods Section S1). We retrieved annotation from GEMMER for the ∼6800 protein-coding genes, as identified by SGD. As in GEMMER, we considered genes that have an annotated E.C. number to be enzymes; we referred to enzymes that catalyze reactions in the Yeast 7.6 metabolic map (37,38) as metabolic enzymes to emphasize their specific function. The SNRs and P-values assigned by maxPeak, GEM and MACE were all merged into one dataset together with the annotation (Supplementary Excel Supplementary Table S1). Data analysis was performed on the processed and annotated dataset described above using Python 3.6 and the Pandas and Matplotlib modules. A collection of Python scripts reproducing the data integration and Jupyter notebooks reproducing the data analysis are available in the Supplementary Code Repository and as part of a Github repository (https://github.com/barberislab/Fkh_ChIP-exo).
KEGG pathway map visualization
We used the R library Pathview to superimpose the experimental data on KEGG pathway maps (39). We performed the mapping two times, first by mapping the set of targets identified in our experiments. Second, we associated each gene with a verification score and an associated color: (i) a value of -1 (yellow) for genes not suggested as a target by our ChIP-exo experiments, but shown by one or more of the available ChIP-chip studies (23–25); (ii) a value of 0 (red) for target genes identified only by our ChIP-exo experiments; (iii) a value of +1 (green) for target genes identified by at least one ChIP-chip study and our ChIP-exo experiments. The R script to reproduce the image generation (see Supplementary Code Repository, and images (Supplementary KEGG Figures) are available.
RESULTS
Data analysis pipeline using the novel maxPeak method to detect high-confidence targets
ChIP-exo experiments were performed on Fkh1 and Fkh2, in logarithmic and stationary phases, for a total of four experiments (see ‘Materials and Methods’ section). Subsequently, two existing peak detection methods (PDMs) were applied to the ChIP-exo datasets: GEM (34) and MACE (35). We observed a significant divergence in the target genes retrieved when comparing GEM (SNR ≥ 1) and MACE (P-value ≤ 0.01) (Supplementary Text, Supplementary Figure S5). The large number of targets retrieved only by GEM or only by MACE led us to develop a novel ChIP-exo data analysis method, which we have named maxPeak, which does not use iteration and is not sensitive to a relatively low number of strong peaks. Application of three PDMs simultaneously on the ChIP-exo dataset allowed us to identify genes that are consistently retrieved as targets by Fkh1 and Fkh2 across multiple PDMs. In order for a target gene to be retrieved, it had to score above (GEM and maxPeak) or below (MACE) threshold in at least two out of three PDMs. To set thresholds that define which genes are considered targets by each of the three PDMs, we generated three 2 × 2 score comparisons (see Figure 1 and Supplementary Materials and Methods, Supplementary Figures S2–S4). We considered any target gene that is retrieved as significant by both GEM and MACE as a confident target. Consequently, we set the threshold of significance for maxPeak to the lowest score obtained across all four experimental conditions by any gene that was retrieved by both GEM and MACE. Altering the 65th percentile normalization threshold that we applied for maxPeak (see ‘Materials and Methods’ section) would not have an impact on the set of the retrieved target genes. By following this approach, we could then use maxPeak to discriminate between those target genes that are retrieved by only GEM or only MACE. The overlap of target genes among the three PDMs is shown in Supplementary Text, Supplementary Figures S6. Figure 2 shows the data processing pipeline implementing the three PDMs: GEM, MACE and the novel maxPeak.
Figure 2.

Illustration of the pipeline implemented for the identification of target genes from ChIP-exo data. First, BAM files were generated, sorted and indexed, on which GEM and MACE are run. For the maxPeak peak detection method, the number of reads on both DNA strands for each nucleotide is counted and, subsequently, the highest read count at a single nucleotide per gene is assigned as the gene’s signal. Finally, the read count for each gene is normalized by the 65th percentile of all genes with a read count > 0, calculating a signal-to-noise ratio (SNR). Finally, target genes (indicated by a ‘T’ in the pie chart) are selected if these are retrieved as significant by at least two out of three peak detection methods (PDMs); conversely, target genes that are retrieved as significant by only one PDM (indicated as ‘NT’ in the pie chart) are not considered further in the analyses.
ChIP-exo identifies a consensus of verified and novel targets of Fkh1 and Fkh2
The pipeline presented in Figure 2 identified several hundred target genes of Fkh1 and Fkh2. An overview of the number of target genes that were retrieved in the four ChIP-exo experiments is reported in Table 1, and the targets are listed per experimental condition in Supplementary Excel Supplementary Table S2. A higher number of Fkh1 targets was retrieved as compared to Fkh2 targets, and a higher number of Fkh targets was retrieved in stationary phase as compared to logarithmic phase. CLB2 is considered to be the major Fkh target gene; thus, it has been considered as a positive control for both Fkh1 and Fkh2. CLB2 was not considered significant as a Fkh1 target in logarithmic phase by both GEM and MACE; hence, this gene was not considered a target for subsequent analyses. Conversely, in the other three experimental conditions, CLB2 was retrieved as a Fkh target. Specifically, in all ChIP-exo experiments, CLB2 revealed a SNR > 2 (Supplementary Excel Supplementary Table S2) assigned by the maxPeak method. Notably, in Fkh2 datasets, CLB2 scores the fourth highest SNR in logarithmic phase and the highest SNR in stationary phase. These results agree with CLB2 being the pivotal Fkh2 target required for cell division (8–11).
Table 1.
Number of target genes identified in this study for specific subgroups
| Target genes | Fkh1 logarithmic | Fkh1 stationary | Fkh2 logarithmic | Fkh2 stationary |
|---|---|---|---|---|
| Total | 291 | 416 | 105 | 220 |
| 4x ChIP verified | 29 | – | 15 | – |
| 3x PDM verified | 31 | 84 | 6 | 25 |
| Novel | 43 | – | 38 | – |
| Cell cycle-regulated | 84 | 122 | 46 | 65 |
| Enzymes | 60 (31) | 103 (51) | 18 (10) | 50 (27) |
‘4x ChIP verified’, verified targets retrieved by our ChIP-exo experiments and three available ChIP-chip studies. ‘3x PDM verified’, targets retrieved by three peak detection methods, PDMs (maxPeak, GEM and MACE). ‘Novel’, novel targets retrieved by this study but not by the three available ChIP-chip studies. ‘Cell-cycle regulated’, targets retrieved by this study that have been described as cell cycle-regulated genes (17). ‘Enzymes’, targets retrieved by this study that are enzymes; specifically, the number of enzymes that catalyze reactions in the Yeast 7.6 metabolic map (i.e. metabolic enzymes) is indicated within parentheses. Since the available ChIP-chip studies were performed in logarithmic phase, verified and novel targets are not available for the stationary phase experiments.
A subset of target genes scored above threshold in all three PDMs (referred to as ‘3x PDM verified’ in Table 1); the detailed list of targets for each experiment is reported in Supplementary Excel Table S3 and Supplementary Text, Supplementary Table S1. A number of available genome-wide studies provide datasets of Fkh target genes (21,23–25). We focused specifically on the previous ChIP-chip studies (23–25), where experiments were performed after growing cells in exponential phase: MacIsaac et al. to an OD ∼ 0.8 (25) (the experimental work was originally performed in (40)), Venters et al. to an OD ∼ 1.0 (24), and Ostrow et al. to an OD ∼ 0.8 (23). For this reason, for the comparison of our ChIP-exo datasets with the ChIP-chip studies, the experiments performed in stationary phase were neglected.
We quantified the agreement between the ChIP-exo peak locations and the enriched regions identified in the most recent ChIP-chip dataset (23) by overlaying them on chromosome-wide summary plots and counting the overlap (see Supplementary Text, Section S4). In Figure 3, a summary plot for Fkh2 in logarithmic phase is shown for chromosome XVI, which contains the CLB2 gene, a major Fkh2 target (see Supplementary exo-chip Figures for all summary plots). We observed that, in logarithmic phase, 81% and 59% of the ChIP-exo target genes show peaks within enriched windows identified by the ChIP-chip experiments for Fkh1 and Fkh2, respectively (see Supplementary Text, Supplementary Table S2). The remaining 19% and 41% of the ChIP-exo target genes are peak locations upstream of ORFs that the ChIP-chip study did not identify. Vice versa, 51% and 46% of the enriched ChIP-chip regions upstream of ORFs for Fkh1 and Fkh2, respectively, contain at least one significant peak event (in any PDM) as identified by ChIP-exo using our PDM thresholds (see Supplementary Text, Supplementary Table S3). These results highlight the increased specificity achieved using ChIP-exo as compared to ChIP-chip, and the higher stringency applied by (i) the thresholds used in this work and (ii) the requirement of passing the threshold in at least 2 PDMs.
Figure 3.

Comparison of ChIP-exo peak locations as identified by three different PDMs (maxPeak, GEM and MACE) and the ChIP-chip enriched regions identified by Ostrow et al. for Fkh2 in logarithmic phase on chromosome XVI. The horizontal green dotted line indicates the threshold for GEM and maxPeak; the horizontal blue dotted line indicates the threshold for MACE. All ChIP-exo peak locations with a SNR >  (for GEM and maxPeak) and/or a P-value < 0.01 (MACE) are displayed. ChIP-exo target gene peaks are labeled as identified through the pipeline reported in Figure 2. When multiple gene names are comma-separated in one label, the peak location was within a window of 1000 bp upstream of all listed gene ORFs.
To highlight new targets of Fkh1 and Fkh2 identified using ChIP-exo, we compared the overlap between our ChIP-exo targets and the ChIP-chip targets (23–25). Strikingly, only 42 out of 2939 Fkh1 target genes and 18 out of 1553 Fkh2 target genes are in common between the three published ChIP-chip studies (see Supplementary Text, Supplementary Figure S7 and Supplementary Excel Supplementary Table S4). This lack of overlap among ChIP-chip studies is a general observation; for this reason, the recently developed ChIP-exo methodology may help to clarify these discrepancies. Indeed, our ChIP-exo experiments recovered the majority of the target genes retrieved by all three ChIP-chip studies. Furthermore, it highlights a number of novel, previously not detected, Fkh target genes. Table 1 summarizes the number of verified and novel target genes. The verified, thus highly reproducible, target genes by all four ChIP experiments are 29 for Fkh1 (ADD37, ALG5, ATG42, BDF1, BUD4, CDS1, CIK1, DIN7, DSE1, DYN1, EGO2, ERS1, ESP1, FHL1, HOS3, JSN1, KIP2, MKK2, NEW1, RHO4, RPN11, SPC24, SSO2, SUB2, TDA7, TEL2, VTI1, YBR138C, YPI1) and 15 for Fkh2 (ATG42, BUD4, CDC20, CHS2, IRC8, JSN1, MTC6, PPN1, SCO1, SPO12, SUR7, SWI5, UTH1, YHP1 and YML053C) (see Figure 4 and Supplementary Excel Supplementary Table S5). Among these common target genes, 8 (for Fkh1) and 4 (for Fkh2) are enzymes. Three target genes are in common among both Fkh: ATG42, coding a vacuolar carboxypeptidase; BUD4, coding for a protein that has a role in bud site selection and is a substrate of the Clb2/Cdk1 kinase activity; and JSN1, coding an RNA-binding protein that interacts with mRNAs of membrane-associated proteins of the mitochondria. Strikingly, a potential metabolic role of Fkh target genes is suggested by the Fkh1 targets CDS1, coding a phosphatidate cytidylyltransferase involved in the synthesis of all major yeast phospholipids, and ERS1, coding a cysteine transport protein that localizes to membranes of organelles, and by the Fkh2 target the CHS2, coding a chitin synthase required for chitin synthesis prior cell division. Moreover, a subset of target genes highlight the known role that Fkh2 plays in the control of cell division: SWI5, coding for the transcription factor of SIC1, which coded protein is the stoichiometric inhibitor of mitotic cyclin/Cdk1 kinase activities; CDC20, activator of the anaphase-promoting complex/cyclosome (APC/C) required for the metaphase/anaphase transition; and BUD4 (described earlier). Furthermore, the Fkh1 target MKK2, coding for a MAP kinase kinase (MAPKK) involved in the protein kinase C signaling pathway and in the control of cell integrity, points to a potential role in signal transduction. Finally, our study retrieves 43 novel Fkh1 targets and 38 novel Fkh2 targets (Figure 4), among which 3 and 6, respectively, are enzymes (see Table 1 and Supplementary Excel Supplementary Table S6).
Figure 4.

Identification of subsets of novel and verified Fkh target genes. 4-way Venn diagrams for Fkh1 (A) and Fkh2 (B) showing the overlap between ChIP-exo datasets and previous ChIP-chip studies that have identified Fkh target genes (21,23–25).
Correlation analysis between Fkh expression levels and targets
To evaluate the quality of our results, we monitored the correlation between the expression level of Fkh1 and Fkh2 and their targets, by using publicly available gene expression datasets. We combined the target genes identified in logarithmic and stationary phases (listed in Supplementary Excel Supplementary Table S2) for each Fkh transcription factor, and analyzed them using the SCEPTRANS database (http://moment.utmb.edu/cgi-bin/sceptrans.cgi). We tabulated the total number of genes and the number of retrieved target genes that are correlated with Fkh1 or Fkh2, based on correlation coefficient thresholds of 0.60 and 0.80, across the nine microarray datasets from five studies in SCEPTRANS (7,41–44). The correlated genes grouped by the threshold and by microarray dataset are listed in Supplementary Excel Supplementary Table S7. In total, 305 and 157 of the retrieved target genes (72% and 69%) are correlated with Fkh1 and Fkh2, respectively, in at least one of the nine datasets.
Furthermore, we tabulated the genome-wide fraction of genes correlated with Fkh1 and Fkh2 across each of the nine datasets. By multiplying that fraction with the number of target genes, we calculated the expected number of correlated ChIP-exo target genes if the target genes were randomly selected from the total pool of genes. We then calculated the ratio of the actual number of correlated ChIP-exo target genes and the expected number. We observed an enrichment in correlated Fkh1 target genes (i.e. a ratio > 1.5) in eight out of nine microarray datasets. Fkh2-correlated target genes were enriched in six out of eight microarray datasets (see Supplementary Excel Supplementary Table S7).
Dynamics of cell cycle-regulated target genes highlight a distinct activation of Fkh1 and Fkh2 functions across cell cycle phases
An earlier study applied a deconvolution algorithm to one of the nine microarray datasets analyzed above (43) and has identified 1082 genes as being cell cycle-regulated (i.e. expressed cyclically), among which 198 metabolic enzymes, reporting the time of peak expression and cell cycle phase where it occurs for each such gene (17). Fkh1 and Fkh2 were considered part of the ‘high-quality’ set of 694 cell cycle transcriptionally regulated (CCTR) genes with 95% confidence or better. Subsets of 84 and 122 target genes for Fkh1 and 46 and 65 target genes for Fkh2 belong to the extended CCTR set for logarithmic and stationary phases, respectively (see Table 1). The main expression peaks of Fkh1 and Fkh2 were identified to occur at 67 and 3 min during S and G1(P) phase, respectively. In addition, Fkh2 did exhibit a secondary expression peak at 74.5 min during S phase.
We analyzed the subset of identified targets that are cell cycle-regulated (Supplementary Excel Supplementary Table S8) in terms of their cell cycle phase of peak expression (Figure 5). When comparing the distributions of the identified target genes in the four ChIP-exo experiments to the genome-wide distribution (17), for both Fkh1 and Fkh2 we observed an enrichment of targets whose expression peaks in the mid cell cycle (S phase) and an underrepresentation of targets that peak in the early cell cycle (G1, G1(P), G1/S phases), in both logarithmic and stationary phases (see Figure 5 and Table 2). The enrichment of targets that peak in S phase is significantly higher for Fkh1 than Fkh2. Conversely, Fkh2 but not Fkh1 targets are enriched in the late cell cycle (G2, G2/M, M, M/G1 phases), consistent with earlier data showing that Fkh2 is expressed during the late stages of the cell cycle (18). Analyzing the data in more detail, we observed that both Fkh1 and Fkh2 targets are shifted toward S and G2 and away from G1, G1(P), G1/S and M, in both logarithmic and stationary phases. Moreover, Fkh1 and Fkh2 targets show an opposite trend at the G2/M and M/G1 transitions as compared to the genome-wide distribution (17): Fkh1 targets are under-represented in G2/M and enriched in M/G1, whereas Fkh2 targets are enriched in G2/M and under-represented in M/G1. Taken together, these findings highlight a tendency for the Fkh1 targets to peak earlier (in the S phase) as compared to the Fkh2 targets, which peak in the late cell cycle phases (G2 through M/G1 phases).
Figure 5.

Distribution of the phases of peak expression for cell cycle-regulated Fkh target genes. A genome-wide dataset (17) was compared to the ChIP-exo Fkh dataset to identify target genes that are cell cycle-regulated. The distribution of the cell cycle-regulated genes (17) is shown on top, whereas the other four pie charts show the distribution of Fkh1 and Fkh2 targets, in both logarithmic and stationary phases.
Table 2.
Enrichment of targets for which expression peaks in the early, middle or late cell cycle phases as compared to the cell cycle-regulated genes as previously identified (17)
| Experimental condition | Early (G1, G1(P), G1/S) | Mid (S) | Late (G2, G2/M, M, M/G1) |
|---|---|---|---|
| Fkh1 logarithmic | −12% | +13% | −1% |
| Fkh1 stationary | −13% | +13% | 0% |
| Fkh2 logarithmic | −20% | +2% | +18% |
| Fkh2 stationary | −13% | +6% | +8% |
The numbers reported are inferred from the pie charts shown in Figure 5.
Figure 6 visualizes the set of cell cycle-regulated targets of Fkh1 and Fkh2 in logarithmic phase as a stack plot. Each target is colored according to the function associated to the GO annotation, which was performed through GEMMER (see ‘Materials and Methods’ section). The stack plot of Fkh1 and Fkh2 targets in stationary phase is visualized in Supplementary Text, Supplementary Figure S8. The position on the y-axis within each column, corresponding to a cell cycle phase where the expression is maximal for each gene, is dictated by the maxPeak SNR of the ChIP-exo experiments. We observe that the majority of Fkh1 cell-cycle regulated targets show their expression peak in the S phase. Moreover, when focusing on the cell cycle-regulated enzymes (indicated in bold in Figure 6A) across different cell cycle phases, we observe that among the 24 Fkh1 enzymatic targets the majority is enriched in the early and mid cell cycle (G1, G1(P), G1/S and S phases) as compared to the late cell cycle (G2, G2/M, M and M/G1 phases). Conversely, the eight enzymatic targets of Fkh2 are equally distributed throughout early and late cell cycle phases (indicated in bold in Figure 6B). These findings suggest that Fkh1 cellular functions, mediated by the activity of its targets, are realized earlier than Fkh2 functions.
Figure 6.

Stack plot of target genes identified by ChIP-exo in logarithmic phase that have a cell cycle-regulated peak expression level (17). (A) Fkh1 target genes. (B) Fkh2 target genes. Within each column a higher position on the y-axis indicates a higher maxPeak SNR. The x-axis indicates the phases of peak expression of genes, as reported (17). The color for each target gene indicates its major biological function if identified in GEMMER (30). Targets marked with an asterisk are verified by all four (4x) ChIP studies, whereas targets marked with a triangle indicate novel target genes that have not been reported in the previous ChIP studies. Targets identified as significant by all three PDMs are shown with a dashed border.
Using the CDC28 data from (17) as an informative example (see Supplementary Text, Section S7), target genes that are cell cycle regulated, with expression peaks within a window of -25 to 45 min after Fkh1 and Fkh2 expression peaks, may be considered to align with expected behavior for Fkh1- and Fkh2-regulated genes. This implies a target window of 42–102 min (from the end of G1/S to mid G2 phase) for Fkh1. For Fkh2, this would suggests two target windows: from (i) 278–48 min (from the end of G1 to the start of G1/S phase) and from (ii) 49.5–109.5 min (from the end of G1 to mid G2 phase). We conclude that genes listed in Figure 6 and Supplementary Figure S8 that fall within these time windows show expected behavior for genes regulated by Fkh1 and Fkh2. The well-known Fkh1/Fkh2 target genes CLB1 and CLB2 fall within these windows; furthermore, CLB3, which we have shown to be regulated by Fkh2 (15) falls within the Fkh2 window. However, it should be noted that, given that Fkh2 exhibits two expression peaks, it may well be present in the intermittent time-period as well so that targets peaking in the window 109.5–278 should not be discounted.
Functional enrichment of identified Fkh targets genes
For all identified Fkh target genes we performed an overrepresentation analysis for GO terms with respect to the biological processes they are involved in, by using the Fisher’s exact test through the PANTHER database (45). We found several significantly overrepresented terms for a false discovery rate (FDR) threshold of 0.05 (Supplementary Excel Supplementary Table S9 lists the FDR for all GO terms across all experimental conditions). The GO terms for cell cycle and mitotic cell cycle were enriched across all four ChiP-exo experiments. Furthermore, the GO terms for (mitotic) cell cycle and cell division were enriched across three out of four ChiP-exo experiments (lacking in Fkh2 stationary phase and Fkh1 stationary phase, respectively). Fkh1 has uniquely enriched terms for organelle fission, (mitotic) nuclear division and (mitotic) sister chromatid segregation. Moreover, the Fkh1 logarithmic experiment showed unique enrichment in the terms for (nuclear) chromosome segregation, whereas the Fkh1 stationary experiment showed unique enrichment in the terms for regulation of cell cycle and regulation of (mitotic) cell cycle process. Finally, the Fkh2 stationary experiment showed no uniquely enriched terms, whereas the Fkh2 logarithmic experiment showed a unique enrichment in the terms (fungal-type) cell wall organization and external encapsulating structure organization. In addition to the formal enrichment test of GO terms, the Fkh target genes identified in the four ChIP-exo experiments were analyzed for their global, rather than for their specific, function, showing an enrichment of targets with a function in cell cycle and cell division (see Supplementary Text, Supplementary Table S4). This result supports the earlier finding that Fkh targets are primarily cell cycle genes (7).
Interestingly, even though no GO terms related to metabolism were enriched in the analyses above, we observed that a fraction of genes with a metabolic function was present among the Fkh targets. Specifically, we identified 60 and 18 enzymatic targets of Fkh1 and Fkh2, respectively, in logarithmic phase, and 103 and 50 enzymatic targets, respectively, in stationary phase, most of which catalyze metabolic reactions (see Table 1 and Supplementary Excel Supplementary Table S10). This provides a clear indication of the potential role of Fkh1,2 as hubs connecting cell cycle and metabolism.
Fkh targets in their functional context through projection onto KEGG Pathways
With the aim to explore the pathways where a metabolic function was observed for Fkh targets, our ChIP-exo results were superimposed on a set of 25 KEGG maps of interest, in order to intuitively display the (metabolic) function of Fkh targets (see ‘Materials and Methods’ section), by using the Pathview library for R (see Supplementary KEGG Figures). In particular, we focused on Fkh1 and Fkh2 targets in central carbon metabolism as identified by ChIP-exo (Figure 7). In Supplementary Text, Supplementary Figure S9 a similar overview includes Fkh targets previously identified in ChIP-chip studies that were not recovered by ChIP-exo. Noteworthy, 16 (iso)enzymes catalyzing 14 reactions in the visualized part of central carbon metabolism are potentially regulated by Fkh. About 14 enzymes out of 16 are potential Fkh1 targets and 5 enzymes out of 16 are potential Fkh2 targets, pointing once again to a predominant metabolic role for Fkh1 as compared to Fkh2. Remarkably, all three isoenzymes of the citrate synthase (CIT), rate-limiting enzyme of the TCA cycle, as well as enzymes involved in ethanol fermentation were retrieved as targets. In detail, for the TCA cycle: CIT1 as Fkh1 target in both logarithmic and stationary phases; CIT2 as Fkh1 target in stationary phase; and CIT3 as both Fkh1 and Fkh2 target in logarithmic phase. For the ethanol fermentation, the pyruvate decarboxylase PDC1 and the alcohol dehydrogenase ADH4 were retrieved as Fkh1 targets in both logarithmic and stationary phases. All 16 enzymatic targets, with the exception of GND1 and IDH2 for Fkh2 and CIT3 for Fkh1, have been previously reported by ChIP-chip studies (23,24).
Figure 7.

Overview of metabolic enzymes in central carbon metabolism that are targets of Fkh1 and Fkh2. Each enzyme is associated with eight squares divided in two rows (Fkh1, top row; Fkh2, bottom row) representing data analysis of four different genome-wide studies: MacIsaac et al., Venters et al., Ostrow et al. and this study. Empty squares indicate genes that were not retrieved as significant targets, whereas colored squares indicated a positive evidence. A distinction between the results in logarithmic and stationary phases is visualized through the color of the squares (see the figure insert). Isoenzymes that have no available evidence in any of the four studies were neglected. In some cases, metabolic enzymes may have no associated squares when no isoenzyme is available with an experimental validation.
We annotated the ChIP-exo dataset with the KEGG pathways that each of the 7217 target genes occurs in. Together, the Fkh targets in all four experimental conditions map onto 89 distinct KEGG pathways, ranging from cell cycle to signaling and metabolism (see Supplementary Excel Supplementary Table S11). In Supplementary Excel Supplementary Table S10, all enzymatic targets of Fkh1 and Fkh2 in logarithmic and stationary phases are reported with the KEGG pathways they occur in and their cell cycle phase of peak expression (if available). Moreover, examples of Fkh1,2 targets in autophagy, signal transduction and cell cycle are shown in Supplementary Text, Supplementary Figure S10. To illustrate the multi-scale nature of Fkh1 and Fkh2 target genes, we highlighted 13 pathways and the Fkh target genes that function therein in Supplementary Text, Supplementary Table S5.
Altogether, our findings provide the field with an up-to-date overview of the current knowledge of Fkh targets within their functional context. The functional diversity of these targets points out to the potential of Fkh1 and Fkh2 as hubs that integrate cell cycle regulation with signaling and metabolic processes.
DISCUSSION
As compared to previous ChIP-based methodologies, our ChIP-exo analyses were performed for the Fkh1 and Fkh2 transcription factors in two experimental conditions: logarithmic and stationary phases. Due to a relatively large amount of targets identified by the GEM and MACE PDMs we have developed a novel PDM that we named maxPeak and used it alongside GEM and MACE for the analysis of our ChIP-exo dataset. We considered only those target genes as targets that scored above threshold (see Figure 1 and Supplementary Materials and Methods, Supplementary Figures S2–S4) in at least two out of three methods. In this way we aimed at minimizing the occurrence of false positives and false negatives and maximizing true negatives and true positives.
We have observed that different ChIP-based methodologies retrieve different numbers and collections of Fkh targets. However, by analysing the verified Fkh targets in common between various studies, we have provided a comprehensive view of the most likely genes whose expression may be modulated by Fkh1 and Fkh2. Noteworthy, when we conducted the data analysis comparing the outcome of the three PDMs (maxPeak, GEM and MACE) we observed that the divergence in the target genes retrieved between GEM and MACE as well as between both software tools and the novel maxPeak method is substantial (a detailed analysis is presented in Supplementary Text, Supplementary Figures S5–S6). This evidence points out a need in the field to (i) identify the stability of the methods, (ii) investigate advantages and shortcomings of each method, and (iii) measure the accuracy of the methods with regard to the identification of functional targets. Our analysis of the targets retrieved by at least two out of three PDMs solidifies the global perspective on the functions possibly exerted by Fkh, and highlights the role that Fkh have as hubs that integrate multi-scale regulatory networks, exemplified by metabolism and cell cycle, to achieve proper timing of cell division.
Fkh1 and Fkh2 are paralogs that have diverged, with a protein identity of 70.65% and a protein similarity of 85% (46). The previously identified canonical Fkh1/Fkh2 binding motif 5′-GTAAACAA-3′ reported in the YeTFaSCo database (26) and by MacIsaac et al. (25), is present in over 1400 locations throughout the genome. To analyze the enrichment of this binding motif on our ChIP-exo dataset, we extracted all peak locations corresponding to the target genes spanning a -250 to +250 bp window around the peak location. We combined the sequences for both logarithmic and stationary phase experiments for each transcription factor to obtain a robust motif identification. This collection of sequences was analyzed using three algorithms from the MEME-suit (47) with complementary characteristics: MEME (48), DREME (49) and CentriMo (50). MEME and DREME identify long and short ungapped motifs, respectively, whereas CentriMo identifies known DNA-binding motifs from other transcription factors. The top significantly enriched motifs returned by MEME and DREME either contain, or are similar to, the canonical DNA-binding motif (Figure 8). The DREME motifs for Fkh1/Fkh2 are virtually equal to the canonical motif, and differ among each other only in terms of possible alternatively preferred bases at 2 or 3 locations. The enriched sequence pattern identified by MEME is longer than the established canonical motif (19–21 bp) but the latter can be clearly identified within it for both Fkh1 and Fkh2. We observe that this top motif is very similar for both Fkh1 and Fkh2, but with a changed and increased preference for the surrounding bases for Fkh2. The presence of a longer and more specific motif for Fkh2 as compared to Fkh1 may translate to a different set of target genes and/or a different affinity for such target genes.
Figure 8.

Top DNA-binding motifs for Fkh1 and Fkh2 based on the ChIP-exo target gene peak sequences, as identified by the MEME and DREME algorithms using MEME-ChIP.
Given the similarity of their protein sequence and DNA-binding motifs, we were interested to explore the overlap between targets of Fkh1 and Fkh2 in both logarithmic and stationary phases. The ChIP-chip studies (23–25) already showed a large set of unique targets, with only 10.6–44.1% of identified Fkh1 targets shared with Fkh2 (see Supplementary Text, Supplementary Table S6). In Table 3, we report the number of overlapping ChIP-exo Fkh targets in the two experimental conditions, as well as among the set of 4x ChIP verified targets. Using ChIP-exo we observed less common targets than in the published ChIP-chip studies, strengthening the hypothesis of divergent functions for Fkh1 and Fkh2. The percentage of overlapping Fkh target genes is 7.0% and 11.4% for logarithmic and stationary phases, respectively. Considering the number of overlapping versus specific (Fkh1 only and Fkh2 only) targets reported in Table 3, we conclude that the vast majority of Fkh targets is unique for Fkh1 and Fkh2 specific functions. A similar outcome was observed for the 4x ChIP verified targets, with a percentage of overlapping Fkh target genes equal to 7.3%. These data suggest that, regardless of the different ChIP methodologies employed, Fkh1 and Fkh2 appear to have divergent functions.
Table 3.
Overlap between Fkh1 and Fkh2 target genes
| Targets genes | Logarithmic | Stationary | 4x ChIP verified |
|---|---|---|---|
| Overlap | 26 | 65 | 3 |
| Fkh1 specific | 265 | 351 | 26 |
| Fkh2 specific | 79 | 155 | 12 |
The observation of divergent target genes for Fkh1,2 is further highlighted by the analyses of the subset of cell cycle-regulated targets (Figure 5), which indicate a major metabolic role for Fkh1 in the early cell cycle (from G1/S through S phases) and a major cell cycle role for Fkh2 in the late cell cycle (from S through M phases). These findings are in agreement with early data showing that Fkh1 is expressed earlier than Fkh2 (18). Furthermore, the same analyses suggest a metabolic function for both Fkh1 and Fkh2, which however may be realized at different times throughout cell cycle regulation.
We investigated the height of the ChIP-exo signal upstream of non-overlapping target genes for the Fkh for which they were not considered a target. We observed that roughly half (44–59%) of the genes that we list as unique target genes in Table 3 cross the threshold in one of the three PDMs and that, similarly, the other half does so in none of the PDMs. The latter subset supports the conclusion that there are substantial differences in the set of target genes. Simultaneously, the former subset points out that many of the unique target genes may show some limited, but lower binding affinity, for the other Fkh, potentially indicating a compensatory interplay between the two transcription factors. This result calls for a detailed investigation of the binding affinity on targets shared between Fkh1 and Fkh2.
It remains speculative whether or not the differences in the observed motifs for Fkh1 and Fkh2 contribute to the difference in target genes that we retrieved. It has previously been observed that both redundant and different functions for Fkh1 and Fkh2 exist, and that these differences were not attributable to the DNA-binding domain (14). Fkh1 and Fkh2 are paralogs with a similar DNA-binding motif, and we observed that they bind only to partially overlapping sets of a target genes (potentially with a different affinity). This evidence suggests that the evolutionary divergence between the two transcription factors, together with the shift in the timing of the expression window (17), left in place a common set of redundant functions but, over time, gave rise to more specific sets of target genes.
Aside from a difference in the main binding motif, it is possible that that Fkh1 and Fkh2 bind different secondary motifs or interact (in complex) with different secondary transcription factors. Our motif analysis suggested secondary enriched motifs which differed between Fkh1 and Fkh2 that are similar to binding sequences of other transcription factors. Mcm1 acts as a scaffold protein for both Fkh2 and the co-activator Ndd1, regulating the G2/M transition and, thus, cell division (9,11). Since the Mcm1 motif showed an E-value of 10−12 for Fkh2, we considered all enriched motifs above this threshold. We found enriched motifs matching eight transcription factors (Ecm22, Azf1, Ixr1 Hmlalpha2, Mcm1, Hmra2, Matalpha2 and Dal82) for Fkh1 and two transcription factors for Fkh2 (Gcn4 and Mcm1). We observed that the Azf1 and Hmra2 motifs were very similar to the canonical Fkh motif, therefore disregarded these. None of the remaining transcription factors with similar binding motifs have known physical or genetic interactions with Fkh1 or Fkh2, with the exception of Mcm1. For several transcription factors with similar binding motifs of Fkh1, genetic evidence of an interaction with Fkh2 is available. Specifically, a genetic interaction of Fkh2 was suggested with Ixr1 and Rox1 (51), transcriptional repressors that regulate hypoxic genes during normoxia. Furthermore, a genetic interaction was reported between Fkh2 and Dal82 (52), regulator of allophanate inducible genes. In light of the observation that Fkh1 and Fkh2 target a different set of genes, currently no reason may be envisioned regarding the enrichment of these motifs within peak regions. However, this evidence calls for detailed experimental investigations of the possible interplay between Fkh1 and Fkh2 and these transcription factors.
Interestingly, our work highlights a number of metabolic enzymes as targets of Fkh1 and Fkh2, 16 of which play a role in central carbon metabolism (Figures 6 and 7): HXT5, GND1, RPE1, TAL1, PFK2, PYK1 / CDC19, PYC2, PDC1, ADH4, CIT1, CIT2, CIT3, ACS1, ACS2 (Fkh1 targets) and GND1, PYK1 / CDC19, CIT3, ACO2, IDH2 (Fkh2 targets). The deletion of two of these enzyme is inviable: pyruvate kinase (PYK1 / CDC19) for both Fkh1 and Fkh2 and acetyl-coA synthetase (ACS2) for Fkh1. Furthermore, deletion of many among the other 16 genes results in reduced growth rates in a number of experimental conditions (e.g. GND1, RPE1, PFK2, PYC2, PDC1, CIT1, CIT2, ACS1, ACS2 and IDH2). Consequently, the altered growth rate observed in fkh1Δ, fkh2Δ and fkh1Δ fkh2Δ mutants (14) may be due to absence in the regulation of one or more of the 16 target enzymes in the central carbon metabolism. Thus, our work highlights a potentially significant role for both Fkh1 and Fkh2 in central carbon metabolism.
When focusing on the 24 (Fkh1) and 8 (Fkh2) cell cycle-regulated metabolic enzymes across different cell cycle phases (indicated in bold in Figure 6 and Supplementary Text, Supplementary Figure S8), we observed that Fkh1 and Fkh2 target several cyclically expressed metabolic enzymes that are involved in membrane processes, which are centered around the two major cell cycle transition. Specifically, Fkh1 targets PMA1, ALG3, ERS1, ALG2, ALG5 and MNT2 around the G1/S transition (G1(P)–G1/S–S) and EXG1, SUN4 and STE6 around the M/G1 transition (M–M/G1–G1). Similarly, Fkh2 targets PMA1, UTH1 and ALG5 around the G1/S transition (G1(P)–G1/S–S). We hypothesize that Fkh transcription factors, which are not active after cell cycle exit until the next S phase upon Ndd1 activation (53), affect the plasma membrane by: (i) switching on their targets centred around the G1/S transition, and (ii) switching these off in S phase due to Fkh activation upon binding of the co-activator Ndd1 (8,11). Following this line of thought, Fkh1 will subsequently affect the plasma membrane at the late cell cycle phases, when Fkh are inactivated until the following S phase.
The Forkhead family of transcription factors is defined by a shared DNA-binding motif, referred to as the winged-helix domain. The mammalian Forkhead family encompasses 18 subfamilies (54,55), and the human genome contains over 40 FOX genes. Of these, the FoxM1 and FoxP proteins represent the closest homologs of Fkh1,2 (46,56). FoxM1 was identified to have the in vitro DNA-binding consensus site TAAACA (57). This motif shares the core sequence recognized by other members of the Forkhead family (57) and also matches part of the motif we, and others (25), identified for Fkh1,2. The similarity in the binding motif suggests that some of the target genes retrieved in this work may carry over to the FoxM1 transcription factor. FoxM1 is involved in cell cycle regulation, stress response, chromatin silencing and aging (56). However, if the suggested Fkh1,2-mediated regulation of metabolic genes would translate to FoxM1, it would be especially interesting since FoxM1 has already been implicated in cell division by regulating the expression of the mitotic Cyclin B (58), homolog of Clb2, and its expression has been observed in multiple tumor-derived cell-lines (see (59) and references therein).
Considering that our data point to multiple roles for Fkhs in cell cycle progression, we have explored the relevance of our ChIP-exo findings for Fkh1 and Fkh2 on cell cycle dynamics (Figure 9). In Figure 9A, the regulatory cascade driving phase-specific events in cell cycle progression is shown: in G1 phase, the cyclin Cln2, together with the kinase Cdk1, inhibits the cyclin/Cdk1 inhibitor Sic1. When Sic1 activity is blocked, Sic1-mediated inhibition of Clb5/Cdk1 is released, allowing it to activate substrates required for DNA replication in S phase. Subsequently, a Clb/Cdk1 cascade is activated, involving waves of Clb5, Clb3 and Clb2 cyclins (all bound to Cdk1). These waves of cyclins are responsible for the control of DNA replication and mitotic entry/exit from S through M (60,61). In Figure 9B, we summarize the evidence of Fkh binding at promoters of target genes in this cascade. In our ChIP-exo study, CLB2 is confirmed to be a major target of Fkh1 and Fkh2, as reported (8–14). Noteworthy, our findings highlight that this is evident in both logarithmic and stationary phases for Fkh2. We also confirm SWI5 being target of Fkh2 (9,10,62) and FKH2 being target of Fkh1, as reported by multiple genome-wide studies (23,24).
Figure 9.
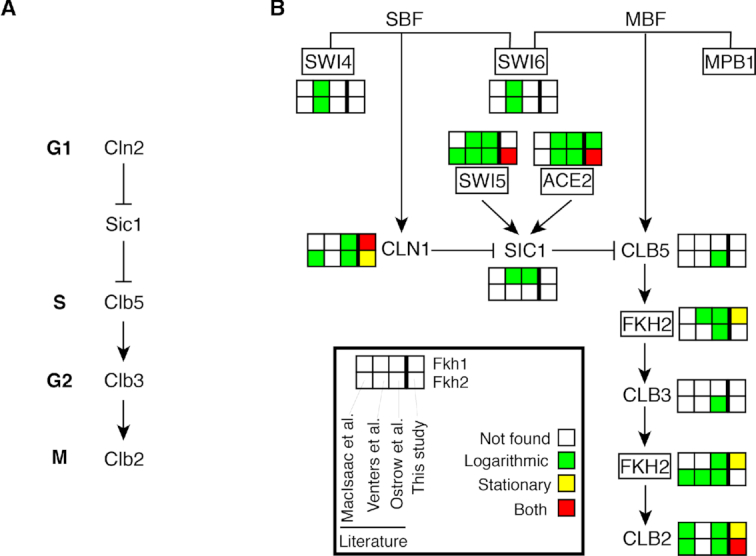
Fkh1 and Fkh2 target genes in the molecular cascade regulating dynamics of cell cycle progression. (A) Molecular players driving phase-specific cell cycle events (see text for details). (B) Overview of cell cycle regulators that are Fkh targets. The transcription factors SWI4, SWI6, MPB1, SWI5, ACE2 and FKH2 are shown within rectangles.
Besides known verified targets in the cell cycle cascade, our ChIP-exo experiments highlight three Fkh targets in the cell cycle cascade, previously identified only by some but not all the ChIP-chip studies, for which experimental validation in currently lacking: CLN1 and ACE2 being targets of both Fkh1 and Fkh2, and NDD1 being a target of Fkh1 (not shown). Further analyses are required in order to validate these findings, shedding light on possible novel regulatory mechanisms of Fkhs in cell cycle regulation.
Our study also points to limitations of genome-wide studies, including ChIP-exo, in the identification of targets, such as the CLB3 gene. Fkh2 binding to CLB3 promoter was shown only by one ChIP-chip study (23). Furthermore, we have recently demonstrated that Fkh2 binds to the CLB3 promoter and regulates Clb3 expression, thus synchronizing the temporal expression of mitotic CLB genes in a linear cascade (Clb5 → Clb3 → Clb2) (15). However, in our ChIP-exo data for Fkh2, CLB3 does not score above threshold in any of the three PDMs, and therefore it was not considered as a Fkh2 target gene (false negative). This example highlights that genes that show low DNA binding signal in ChIP studies should not be regarded as not being regulated. Conversely, a potential regulation may be suggested for high-scoring target genes. Binding data of transcription factors provide an indication of potential regulatory activities; however, these are not proof of such activity, for which an experimental validation would be required.
In addition, our findings do not support previously suggested Fkh targets: SWI4 and SWI6 for both Fkh1 and Fkh2 (24), SIC1 for Fkh1 (23,24), and CLB5 for Fkh2 (23). The latter scenario has been recently excluded by our independent experimental analyses, showing that CLB5 may not be a Fkh2 target (15), thus highlighting the occurrence of false positives identified by previous ChIP-chip studies.
We observed a higher number of correlated retrieved target genes than randomly expected for both Fkh1 and Fkh2 across nine publicly available microarray datasets (Supplementary Excel Supplementary Table S7). This work points towards future studies aimed to the experimental validation of the targets retrieved, by assessing changes in gene expression upon Fkh knockout. In our view, priority should be given to: (i) high scoring target genes as ranked by all three PDMs (Supplementary Excel Supplementary Table S3), (ii) high scoring target genes identified by all four ChIP studies available for Fkh1 and Fkh2 (see Figure 6 and Supplementary Excel Supplementary Table S5) and (iii) target genes that we identified as highly correlated with Fkh1 and Fkh2 in available gene expression studies (Supplementary Excel Supplementary Table S7).
Finally, by referencing the KEGG pathways the target genes mapped on, and providing the number of metabolic targets, our analyses highlighted the potential of Fkh1 and Fkh2 to connect their specific functions within the core cell cycle network with other regulatory processes in metabolism and signal transduction. Altogether, the data presented in this study clearly provide evidence of the wide-reaching influence of Fkh, and open avenues for further research by pointing to the Fkh transcription factors as hubs that integrate multi-scale regulatory networks to achieve proper timing of cell division in budding yeast.
DATA AVAILABILITY
A collection of Python scripts reproducing the data integration and Jupyter notebooks reproducing the data analysis are available as Supplementary Code Repository and as part of a GitHub repository Github repository (https://github.com/barberislab/ChIP-exo_Fkh1_Fkh2).
Supplementary Material
ACKNOWLEDGEMENTS
The authors thank the anonymous reviewers for insightful comments.
Author Contributions: M.B. conceived and designed the study. P.H. and M.B. designed the experimental analysis, which was performed by P.H.. P.H. implemented the peak detection pipeline with contributions from T.D.G.A.M. and M.B.. M.B. and T.D.G.A.M. designed the data analysis, which was performed by T.D.G.A.M.. T.D.G.A.M. and M.B. analyzed the data. M.B. provided the biological interpretation of data. M.B. and T.D.G.A.M. wrote the paper, with contribution from P.H. and J.N.. M.B. provided scientific leadership and supervised the study.
SUPPLEMENTARY DATA
Supplementary Data are available at NAR Online.
FUNDING
Systems Biology Grant of the University of Surrey (to M.B.); the Swammerdam Institute for Life Science Starting Grant of the University of Amsterdam (to M.B.); Novo Nordisk Foundation, Vetenskapsrådet, and Knut and Alice Wallenberg Foundation (to J.N.). Funding for open access charge: Internal.
Conflict of interest statement. None declared.
REFERENCES
- 1. Kitano H. Computational systems biology. Nature. 2002; 420:206–210. [DOI] [PubMed] [Google Scholar]
- 2. Castiglione F., Pappalardo F., Bianca C., Russo G., Motta S.. Modeling biology spanning different scales: an open challenge. Biomed Res. Int. 2014; 2014:902545. [DOI] [PMC free article] [PubMed] [Google Scholar]
- 3. Link W., Fernandez-Marcos P.J.. FOXO transcription factors at the interface of metabolism and cancer. Int. J. Cancer. 2017; 141:2379–2391. [DOI] [PubMed] [Google Scholar]
- 4. Murtaza G., Khan A.K., Rashid R., Muneer S., Hasan S.M.F., Chen J.. FOXO transcriptional factors and long-term living. Oxid. Med. Cell. Longev. 2017; 2017:3494289. [DOI] [PMC free article] [PubMed] [Google Scholar]
- 5. Golson M.L., Kaestner K.H.. Fox transcription factors: from development to disease. Development. 2016; 143:4558–4570. [DOI] [PMC free article] [PubMed] [Google Scholar]
- 6. Lam E.W., Brosens J.J., Gomes A.R., Koo C.Y.. Forkhead box proteins: tuning forks for transcriptional harmony. Nat. Rev. Cancer. 2013; 13:482–495. [DOI] [PubMed] [Google Scholar]
- 7. Spellman P.T., Sherlock G., Zhang M.Q., Iyer V.R., Anders K., Eisen M.B., Brown P.O., Botstein D., Futcher B.. Comprehensive identification of cell cycle-regulated genes of the yeast Saccharomyces cerevisiae by microarray hybridization. Mol. Biol. Cell. 1998; 9:3273–3297. [DOI] [PMC free article] [PubMed] [Google Scholar]
- 8. Reynolds D., Shi B.J., McLean C., Katsis F., Kemp B., Dalton S.. Recruitment of Thr319-phosphorylated Ndd1p to the FHA domain of Fkh2p requires Clb kinase activity: a mechanism for CLB cluster gene activation. Genes Dev. 2003; 17:1789–1802. [DOI] [PMC free article] [PubMed] [Google Scholar]
- 9. Pic A., Lim F.L., Ross S.J., Veal E.A., Johnson A.L., Sultan M.R., West A.G., Johnston L.H., Sharrocks A.D., Morgan B.A.. The forkhead protein Fkh2 is a component of the yeast cell cycle transcription factor SFF. EMBO J. 2000; 19:3750–3761. [DOI] [PMC free article] [PubMed] [Google Scholar]
- 10. Kumar R., Reynolds D.M., Shevchenko A., Shevchenko A., Goldstone S.D., Dalton S.. Forkhead transcription factors, Fkh1p and Fkh2p, collaborate with Mcm1p to control transcription required for M-phase. Curr. Biol. 2000; 10:896–906. [DOI] [PubMed] [Google Scholar]
- 11. Koranda M., Schleiffer A., Endler L., Ammerer G.. Forkhead-like transcription factors recruit Ndd1 to the chromatin of G2/M-specific promoters. Nature. 2000; 406:94–98. [DOI] [PubMed] [Google Scholar]
- 12. Sherriff J.A., Kent N.A., Mellor J.. The Isw2 chromatin-remodeling ATPase cooperates with the Fkh2 transcription factor to repress transcription of the B-type cyclin gene CLB2. Mol. Cell Biol. 2007; 27:2848–2860. [DOI] [PMC free article] [PubMed] [Google Scholar]
- 13. Hollenhorst P.C., Pietz G., Fox C.A.. Mechanisms controlling differential promoter-occupancy by the yeast forkhead proteins Fkh1p and Fkh2p: implications for regulating the cell cycle and differentiation. Genes Dev. 2001; 15:2445–2456. [DOI] [PMC free article] [PubMed] [Google Scholar]
- 14. Hollenhorst P.C., Bose M.E., Mielke M.R., Müller U., Fox C.A.. Forkhead genes in transcriptional silencing, cell morphology and the cell cycle. Overlapping and distinct functions for FKH1 and FKH2 in Saccharomyces cerevisiae. Genetics. 2000; 154:1533–1548. [DOI] [PMC free article] [PubMed] [Google Scholar]
- 15. Linke C., Chasapi A., González-Novo A., Al Sawad I., Tognetti S., Klipp E., Loog M., Krobitsch S., Posas F., Xenarios I. et al.. A Clb/Cdk1-mediated regulation of Fkh2 synchronizes CLB expression in the budding yeast cell cycle. NPJ Syst. Biol. Appl. 2017; 3:7. [DOI] [PMC free article] [PubMed] [Google Scholar]
- 16. Shi B.J. Decoding common and divergent cellular functions of the domains of forkhead transcription factors Fkh1 and Fkh2. Biochem. J. 2016; 473:3855–3869. [DOI] [PubMed] [Google Scholar]
- 17. Rowicka M., Kudlicki A., Tu B.P., Otwinowski Z.. High-resolution timing of cell cycle-regulated gene expression. Proc. Natl. Acad. Sci. U.S.A. 2007; 104:16892–16897. [DOI] [PMC free article] [PubMed] [Google Scholar]
- 18. Lee T.I., Rinaldi N.J., Robert F., Odom D.T., Bar-Joseph Z., Gerber G.K., Hannett N.M., Harbison C.T., Thompson C.M., Simon I. et al.. Transcriptional regulatory networks in Saccharomyces cerevisiae. Science. 2002; 298:799–804. [DOI] [PubMed] [Google Scholar]
- 19. Linke C., Klipp E., Lehrach H., Barberis M., Krobitsch S.. Fkh1 and Fkh2 associate with Sir2 to control CLB2 transcription under normal and oxidative stress conditions. Front. Physiol. 2013; 4:173. [DOI] [PMC free article] [PubMed] [Google Scholar]
- 20. Lin S.J., Ford E., Haigis M., Liszt G., Guarente L.. Calorie restriction extends yeast life span by lowering the level of NADH. Genes Dev. 2004; 18:12–16. [DOI] [PMC free article] [PubMed] [Google Scholar]
- 21. Hu Z., Killion P.J., Iyer V.R.. Genetic reconstruction of a functional transcriptional regulatory network. Nat. Genet. 2007; 39:683–687. [DOI] [PubMed] [Google Scholar]
- 22. Viggiani C.J., Aparicio J.G., Aparicio O.M.. ChIP-chip to analyze the binding of replication proteins to chromatin using oligonucleotide DNA microarrays. Methods Mol. Biol. 2009; 521:255–278. [DOI] [PubMed] [Google Scholar]
- 23. Ostrow A.Z., Nellimoottil T., Knott S.R., Fox C.A., Tavaré S., Aparicio O.M.. Fkh1 and Fkh2 bind multiple chromosomal elements in the S. cerevisiae genome with distinct specificities and cell cycle dynamics. PLoS One. 2014; 9:e87647. [DOI] [PMC free article] [PubMed] [Google Scholar]
- 24. Venters B.J., Wachi S., Mavrich T.N., Andersen B.E., Jena P., Sinnamon A.J., Jain P., Rolleri N.S., Jiang C., Hemeryck-Walsh C. et al.. A comprehensive genomic binding map of gene and chromatin regulatory proteins in Saccharomyces. Mol. Cell. 2011; 41:480–492. [DOI] [PMC free article] [PubMed] [Google Scholar]
- 25. MacIsaac K.D., Wang T., Gordon D.B., Gifford D.K., Stormo G.D., Fraenkel E.. An improved map of conserved regulatory sites for Saccharomyces cerevisiae. BMC Bioinformatics. 2006; 7:113. [DOI] [PMC free article] [PubMed] [Google Scholar]
- 26. de Boer C.G., Hughes T.R.. YeTFaSCo: a database of evaluated yeast transcription factor sequence specificities. Nucleic Acids Res. 2012; 40:D169–D179. [DOI] [PMC free article] [PubMed] [Google Scholar]
- 27. Rhee H.S., Pugh B.F.. ChIP-exo method for identifying genomic location of DNA-binding proteins with near-single-nucleotide accuracy. Curr. Protoc. Mol. Biol. 2012; 100:1–14. [DOI] [PMC free article] [PubMed] [Google Scholar]
- 28. Ouyang L., Holland P., Lu H., Bergenholm D., Nielsen J.. Integrated analysis of the yeast NADPH-regulator Stb5 reveals distinct differences in NADPH requirements and regulation in different states of yeast metabolism. FEMS Yeast Res. 2018; 18:foy091. [DOI] [PubMed] [Google Scholar]
- 29. Holland P., Bergenholm D., Börlin C.S., Liu G., Nielsen J.. Predictive models of eukaryotic transcriptional regulation reveals changes in transcription factor roles and promoter usage between metabolic conditions. Nucleic Acids Res. 2019; 47:gkz253. [DOI] [PMC free article] [PubMed] [Google Scholar]
- 30. Mondeel T.D.G.A., Crémazy F., Barberis M.. GEMMER: GEnome-wide tool for Multi-scale Modeling data Extraction and Representation for Saccharomyces cerevisiae. Bioinformatics. 2018; 34:2147–2149. [DOI] [PMC free article] [PubMed] [Google Scholar]
- 31. Liu G., Bergenholm D., Nielsen J.. Genome-Wide mapping of binding sites reveals multiple biological functions of the transcription factor Cst6p in Saccharomyces cerevisiae. MBio. 2016; 7:e00559-16. [DOI] [PMC free article] [PubMed] [Google Scholar]
- 32. Langmead B., Salzberg S.L.. Fast gapped-read alignment with Bowtie 2. Nat. Methods. 2012; 9:357–359. [DOI] [PMC free article] [PubMed] [Google Scholar]
- 33. Li H., Handsaker B., Wysoker A., Fennell T., Ruan J., Homer N., Marth G., Abecasis G., Durbin R. 1000 Genome Project Data Processing Subgroup . The Sequence Alignment/Map format and SAMtools. Bioinformatics. 2009; 25:2078–2079. [DOI] [PMC free article] [PubMed] [Google Scholar]
- 34. Guo Y., Mahony S., Gifford D.K.. High resolution genome wide binding event finding and motif discovery reveals transcription factor spatial binding constraints. PLoS Comput. Biol. 2012; 8:e1002638. [DOI] [PMC free article] [PubMed] [Google Scholar]
- 35. Wang L., Chen J., Wang C., Uusküla-Reimand L., Chen K., Medina-Rivera A., Young E.J., Zimmermann M.T., Yan H., Sun Z. et al.. MACE: model based analysis of ChIP-exo. Nucleic Acids Res. 2014; 42:e156. [DOI] [PMC free article] [PubMed] [Google Scholar]
- 36. Kristiansson E., Thorsen M., Tamás M.J., Nerman O.. Evolutionary forces act on promoter length: identification of enriched cis-regulatory elements. Mol. Biol. Evol. 2009; 26:1299–1307. [DOI] [PubMed] [Google Scholar]
- 37. Aung H.W., Henry S.A., Walker L.P.. Revising the representation of fatty acid, glycerolipid, and glycerophospholipid metabolism in the consensus model of yeast metabolism. Ind. Biotechnol. 2013; 9:215–228. [DOI] [PMC free article] [PubMed] [Google Scholar]
- 38. Herrgård M.J., Swainston N., Dobson P., Dunn W.B., Arga K.Y., Arvas M., Blüthgen N., Borger S., Costenoble R., Heinemann M. et al.. A consensus yeast metabolic network reconstruction obtained from a community approach to systems biology. Nat. Biotechnol. 2008; 26:1155–1160. [DOI] [PMC free article] [PubMed] [Google Scholar]
- 39. Luo W., Brouwer C.. Pathview: an R/Bioconductor package for pathway-based data integration and visualization. Bioinformatics. 2013; 29:1830–1831. [DOI] [PMC free article] [PubMed] [Google Scholar]
- 40. Harbison C.T., Gordon D.B., Lee T.I., Rinaldi N.J., Macisaac K.D., Danford T.W., Hannett N.M., Tagne J.B., Reynolds D.B., Yoo J. et al.. Transcriptional regulatory code of a eukaryotic genome. Nature. 2004; 431:99–104. [DOI] [PMC free article] [PubMed] [Google Scholar]
- 41. Cho R.J., Campbell M.J., Winzeler E.A., Steinmetz L., Conway A., Wodicka L., Wolfsberg T.G., Gabrielian A.E., Landsman D., Lockhart D.J. et al.. A genome-wide transcriptional analysis of the mitotic cell cycle. Mol. Cell. 1998; 2:65–73. [DOI] [PubMed] [Google Scholar]
- 42. Klevecz R.R., Bolen J., Forrest G., Murray D.B.. A genomewide oscillation in transcription gates DNA replication and cell cycle. Proc. Natl. Acad. Sci. U.S.A. 2004; 101:1200–1205. [DOI] [PMC free article] [PubMed] [Google Scholar]
- 43. Tu B.P., Kudlicki A., Rowicka M., McKnight S.L.. Logic of the yeast metabolic cycle: temporal compartmentalization of cellular processes. Science. 2005; 310:1152–1158. [DOI] [PubMed] [Google Scholar]
- 44. Pramila T., Wu W., Miles S., Noble W.S., Breeden L.L.. The Forkhead transcription factor Hcm1 regulates chromosome segregation genes and fills the S-phase gap in the transcriptional circuitry of the cell cycle. Genes Dev. 2006; 20:2266–2278. [DOI] [PMC free article] [PubMed] [Google Scholar]
- 45. Mi H., Huang X., Muruganujan A., Tang H., Mills C., Kang D., Thomas P.D.. PANTHER version 11: expanded annotation data from Gene Ontology and Reactome pathways, and data analysis tool enhancements. Nucleic Acids Res. 2017; 45:D183–D189. [DOI] [PMC free article] [PubMed] [Google Scholar]
- 46. Ostrow A.Z., Kalhor R., Gan Y., Villwock S.K., Linke C., Barberis M., Chen L., Aparicio O.M.. Conserved forkhead dimerization motif controls DNA replication timing and spatial organization of chromosomes in S. cerevisiae. Proc. Natl. Acad. Sci. U.S.A. 2017; 114:E2411–E2419. [DOI] [PMC free article] [PubMed] [Google Scholar]
- 47. Bailey T.L., Boden M., Buske F.A., Frith M., Grant C.E., Clementi L., Ren J., Li W.W., Noble W.S.. MEME SUITE: tools for motif discovery and searching. Nucleic Acids Res. 2009; 37:W202–W208. [DOI] [PMC free article] [PubMed] [Google Scholar]
- 48. Bailey T.L., Williams N., Misleh C., Li W.W.. MEME: discovering and analyzing DNA and protein sequence motifs. Nucleic Acids Res. 2006; 34:W369–W373. [DOI] [PMC free article] [PubMed] [Google Scholar]
- 49. Bailey T.L. DREME: motif discovery in transcription factor ChIP-seq data. Bioinformatics. 2011; 27:1653–1659. [DOI] [PMC free article] [PubMed] [Google Scholar]
- 50. Bailey T.L., Machanick P.. Inferring direct DNA binding from ChIP-seq. Nucleic Acids Res. 2012; 40:e128. [DOI] [PMC free article] [PubMed] [Google Scholar]
- 51. Bandyopadhyay S., Mehta M., Kuo D., Sung M.K., Chuang R., Jaehnig E.J., Bodenmiller B., Licon K., Copeland W., Shales M. et al.. Rewiring of genetic networks in response to DNA damage. Science. 2010; 330:1385–1389. [DOI] [PMC free article] [PubMed] [Google Scholar]
- 52. Kuzmin E., VanderSluis B., Wang W., Tan G., Deshpande R., Chen Y., Usaj M., Balint A., Mattiazzi Usaj M., van Leeuwen J. et al.. Systematic analysis of complex genetic interactions. Science. 2018; 360:eaao1729. [DOI] [PMC free article] [PubMed] [Google Scholar]
- 53. Sajman J., Zenvirth D., Nitzan M., Margalit H., Simpson-Lavy K.J., Reiss Y., Cohen I., Ravid T., Brandeis M.. Degradation of Ndd1 by APC/C(Cdh1) generates a feed forward loop that times mitotic protein accumulation. Nat. Commun. 2015; 6:7075. [DOI] [PubMed] [Google Scholar]
- 54. Tuteja G., Kaestner K.H.. SnapShot: forkhead transcription factors I. Cell. 2007; 130:1160. [DOI] [PubMed] [Google Scholar]
- 55. Tuteja G., Kaestner K.H.. Forkhead transcription factors II. Cell. 2007; 131:192. [DOI] [PubMed] [Google Scholar]
- 56. Murakami H., Aiba H., Nakanishi M., Murakami-Tonami Y.. Regulation of yeast forkhead transcription factors and FoxM1 by cyclin-dependent and polo-like kinases. Cell Cycle. 2010; 9:3233–3242. [DOI] [PubMed] [Google Scholar]
- 57. Korver W., Roose J., Clevers H.. The winged-helix transcription factor Trident is expressed in cycling cells. Nucleic Acid Res. 1997; 25:1715–1719. [DOI] [PMC free article] [PubMed] [Google Scholar]
- 58. Laoukili J., Kooistra M.R, Brás A., Kauw J., Kerkhoven R.M., Morrison A., Clevers H., Medema R.H.. FoxM1 is required for execution of the mitotic programme and chromosome stability. Nat. Cell Biol. 2005; 7:126–136. [DOI] [PubMed] [Google Scholar]
- 59. Laoukili J., Stahl M., Medema R.H.. FoxM1: at the crossroads of ageing and cancer. Biochim. Biophys. Acta. 2007; 1775:92–102. [DOI] [PubMed] [Google Scholar]
- 60. Bloom J., Cross F.R.. Multiple levels of cyclin specificity in cell-cycle control. Nat. Rev. Mol. Cell Biol. 2007; 8:149–160. [DOI] [PubMed] [Google Scholar]
- 61. Breeden L.L. Cyclin transcription: Timing is everything. Curr. Biol. 2000; 10:R586–R588. [DOI] [PubMed] [Google Scholar]
- 62. Zhu G., Spellman P.T., Volpe T., Brown P.O., Botstein D., Davis T.N., Futcher B.. Two yeast forkhead genes regulate the cell cycle and pseudohyphal growth. Nature. 2000; 406:90–94. [DOI] [PubMed] [Google Scholar]
Associated Data
This section collects any data citations, data availability statements, or supplementary materials included in this article.
Supplementary Materials
Data Availability Statement
A collection of Python scripts reproducing the data integration and Jupyter notebooks reproducing the data analysis are available as Supplementary Code Repository and as part of a GitHub repository Github repository (https://github.com/barberislab/ChIP-exo_Fkh1_Fkh2).