Abstract
Size- and shape-dependent features of plasmonic nanocrystals govern the development of their applications. In the past decades, gold nanostructures, such as gold nanorods and nanoshells, have been well studied and applied for sensing, bioimaging, and photothermal generation. However, knowledge of copper chalcogenide, a new generation of plasmonic nanomaterials, is limited, especially about their preparation and size- and shape-dependent photothermal properties. In this work, controllable size and shape Cu2–xS nanocrystals (NCs) are synthesized by a facile aqueous route. Using low-molecular-weight polyethylenimine (PEI) as the reducing and capping agents, the size and shape of Cu2–xS NCs can be controlled with lengths from 6.5 to 46.5 nm and the aspect ratio from 2.2 to 7.5 by adjusting the concentration of PEI. The plasmonic peak of Cu2–xS experiences a redshift (from 1145 to 1369 nm) when the length increases from 6.5 to 44.5 nm. Under the irradiation of 1064 nm laser with 1.33 W/cm2, an excellent photothermal conversion rate (from 34.9 to 49.0%) is obtained. The characterization of Cu2–xS NCs is conducted with a UV–vis spectrometer, transmission electron microscopy, powder X-ray diffraction measurements, and 1064 nm laser.
Introduction
Over the past two decades, semiconductor nanocrystals (NCs), such as CdTe,1 CdSe,2 ZnS,3 and PbSe,4 have played important roles in different research fields due to their unique size- and shape-dependent properties. The energy states and band gap of these NCs can be tuned by varying the sizes and shapes, doping with impurities, and growing core–shell structures. Their optical and electrical properties have been well studied and extensively applied in biomedical imaging,5 photovoltaic,2 nanophotonic, and sensing research.6 In recent years, copper-based chalcogenide NCs are emerging in the research community because of their capability of heavy doping, resulting in creating hole carriers in the NCs. In the case of copper sulfide (i.e., Cu2–xS), it is a p-type semiconductor, which has strong near infrared (NIR) absorption originated from localized surface plasmon resonance (LSPR7) of free holes. This newly discovered plasmonic property in semiconductor NCs has attracted considerable attention. In particular, the optical and plasmonic properties of Cu2–xS NCs are highly dependent on the doping level, crystal structure, size, and shape. For this reason, comprehensive studies have been conducted on investigating their nanostructures, synthesizing chemistry, optical responses, and potential applications. In 2011, Alivisatos et al.8 investigated the influence of size (ranging from 2 to 6 nm) of Cu2–xS NCs on the LSPR absorption. This work indicated that when the size of Cu2–xS increases, the LSPR absorption peak exhibits a redshift. In 2015, Mou et al.5 synthesized ultrasmall (<5 nm) Cu2–xS nanodots for deep-tissue photoacoustic imaging and photothermal therapy, and Kar et al.9 fabricated Cu2–xS nanorod and nanowall arrays in reducing carbon dioxide into methane under sunlight. These investigations revealed that the Cu2–xS NCs can be grown into a variety of morphologies and crystal structures and the potential of these NCs has not been fully explored.
Finely, controlling the size and morphology of Cu2–S nanostructures is of great importance in specific applications. Various reports have described the methods for synthesizing Cu2–xS nanoparticles and nanorods. Liu et al.10 synthesized Cu2–xS nanoparticles by injecting sulfur precursors into Cu–O organic solution at 210–220 °C with strict oxygen-free environment. To obtain rod-shaped Cu2–xS NCs, Alivisatos et al.11 replaced the Cd element on cadmium sulfide nanorods with the Cu element through the cation exchange method. Kruszynska et al.12 synthesized copper sulfide nanorods by applying trioctylphosphine oxide (TOPO) and octadecene (ODE) as surface ligands with accurate temperature control in reactions. Our group has reported a nonaqueous millifluidic approach for fabricating a variety of Cu2–xS nanostructures by adjusting the concentration of precursors and flow rates.13 From the literature, it can be observed that varying the sizes and shapes of nanoparticles is relatively easy to achieve in organic phase synthesis.14−16 Inorganic phase synthesis, the use of high temperature and highly concentrated surfactant solution, and the large variety of surfactants can passivate specific crystal faces and facilitate anisotropic growth of nanocrystals, resulting in complex nanostructures. However, there is only limited number of reports on aqueous phase synthesis.
One of the reasons that copper chalcogenide nanoparticles have drawn lots of attention is their photothermal (PTT) effect.17−19 This light-to-thermal feature, which is associated with the interaction between electromagnetic radiation and surface excited carriers, has been applied for cancer therapy within the recent 10 years.20 Due to the noninvasive19 and real-time17 characteristics of PPT, it is a promising way to cure tumor by generated heat in pathological sites. The most studied PTT agents for cancer treatment is gold nanostructures21−26 due to their tunable surface plasmon resonance (SPR) peak range from visible to NIR light. Different morphologies of gold nanoparticles such as nanosphere,22 nanostar,21 nanorod,17,26 and nanocage27 have been studied for photothermal therapy. Very recently, gold nanoshells from AuroLase have been tested for pilot clinical trials.23,24 We envision that the future development of photothermal agents will be on the heat conversion efficiency (HCE)28 (admitted dosage), production cost28 (cost for therapy), and particle size (body clearance).25 The Cu2–xS nanocrystal, which also has been found to possess a photothermal effect,29 could be a potential candidate to replace gold nanostructures as PTT agents. The advantages of Cu2–xS NCs include (i) easy fabrication with low cost,28 (ii) small particle size (normally <10 nm)5,30 and low cytotoxicity,31 (iii) strong NIR absorption located in the “biological transparent window”,29 and (iv) capability of generating a photoacoustic signal for bioimaging.32 According to the previous report, copper-based chalcogenides nanostructures have been investigated corresponding to different crystallographic compositions, such as Cu1.8S,33 Cu9S5,28 Cu7.2S4,34 and CuS.13 Li et al.34 obtained a high HCE (56.7%) in Cu7.2S4 NCs. However, the NCs were synthesized using a complex organic synthesis procedure with a strict oxygen-free environment.
In this paper, we propose a facile way to synthesize controllable size and shape Cu2–xS NCs in an aqueous solution. A highly available copper(II) chloride and sodium sulfide were used as the copper source and sulfur source, respectively. Low-molecular-weight branched polyethylenimine (PEI), which has cationic properties and low cytotoxicity,35 was utilized as the reducing and capping agents. The size and morphology of Cu2–xS NCs can be adjusted with lengths from 6.5 to 46.5 nm and the aspect ratio from 2.2 to 7.5 by simply varying the concentrations of PEI. HCE of nanostructures was also studied, and 34.9 to 49.0% of HCE were obtained accordingly to Cu2–xS NCs with distinct morphology under 1064 nm laser irradiation (1.33 W/cm2). Compared to the reported synthesis methods for Cu2–xS NCs, the method proposed in this article is very simple and easy to implement. Furthermore, the high HCE obtained in this experiment makes PEI-capped Cu2–xS NCs as promising PTT agents.
Results and Discussion
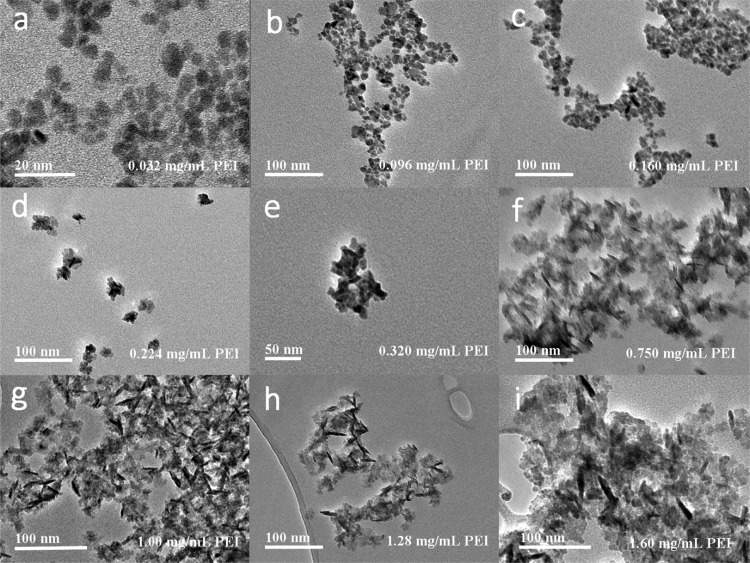
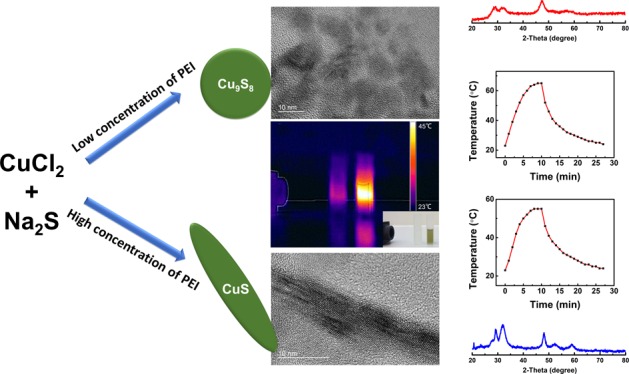
There are a few protocols for producing copper chalcogenide nanoparticles,28,36 the proposed facile method is among the first attempt to use a single capping agent for synthesizing elongated (or rod-shaped) Cu2–xS NCs. A series of samples obtained by this method including nanoparticles and nanorods are shown in Figure 1. The morphology (from dot to rod) of Cu2–xS NCs can be manipulated by adjusting the concentration of PEI from 0.032 to 0.160 mg/mL (dots with ∼7 nm in diameter), 0.224 to 0.750 mg/mL (mixture with dots and short nanorods), and 1.00 to 1.6 mg/mL (homogeneous nanorods) in the synthesis procedure. In addition, it is noticed that the aspect ratio of Cu2–xS nanorods can be tuned from 2.2 ± 0.3 to 7.5 ± 0.5 by applying different PEI concentrations. Furthermore, the crystal structures and LSPR spectra were closely related to the morphology of Cu2–xS NCs. With a shorter dimension of NCs, the crystallographic phase was dominated by yarrowite (Cu9S8), while covellite (CuS) was mainly obtained in Cu2–xS nanorods, as shown in Figure 3. The position of the LSPR peak was also affected by the morphology. With a longer length of nanorods, the LSPR peaks appear to have a clear redshift from 1231 to 1369 nm, as shown in Figure 4.
Figure 1.
TEM images of Cu2–xS nanostructures synthesized with different concentrations of PEI solutions. (a–e) Under low concentration of PEI, Cu2–xS NCs appear more spherical in shape. (f–i) Under high concentration of PEI, the morphology of Cu2–xS NCs becomes more anisotropic.
Figure 3.
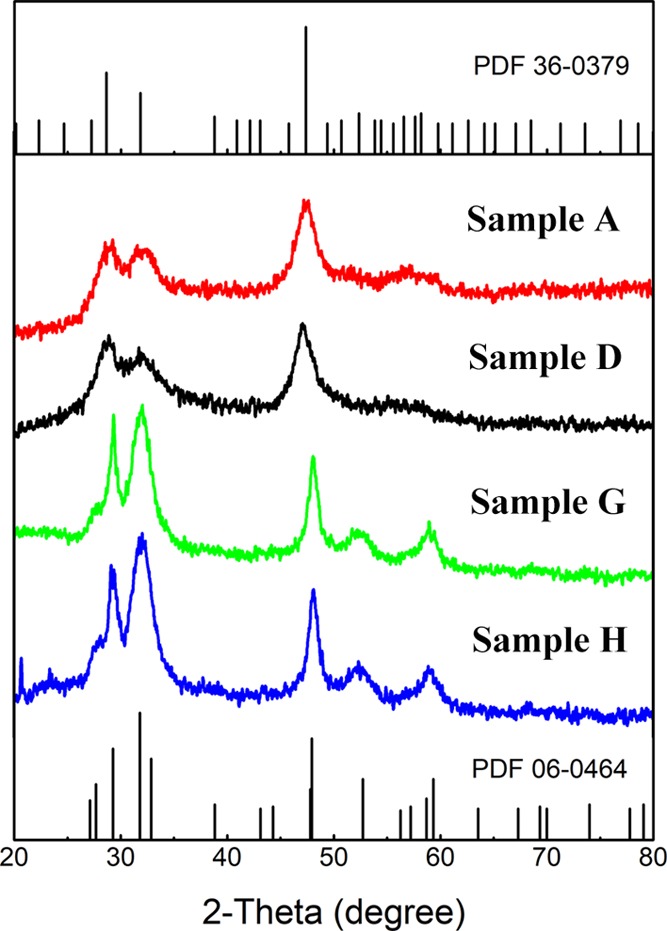
XRD patterns of Samples A, D, G, and H with the reference pattern of hexagonal yarrowite (PDF number 36-0379) and hexagonal covellite (PDF number 06-0646).
Figure 4.
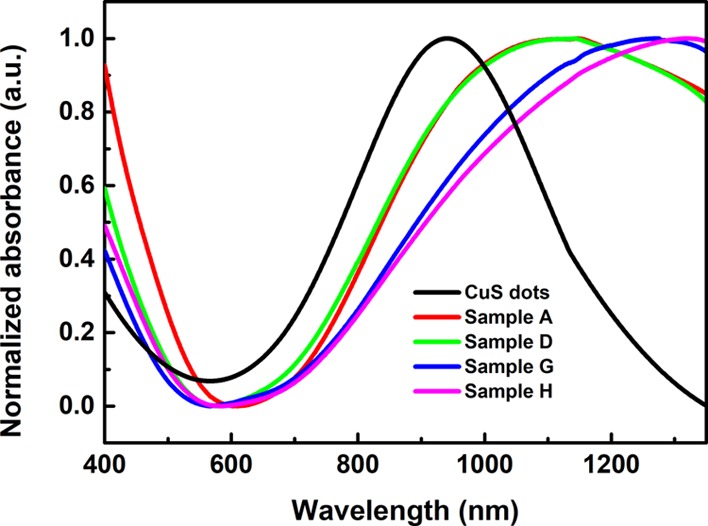
UV–vis–NIR spectrum of Cu2–xS NCs with different morphologies.
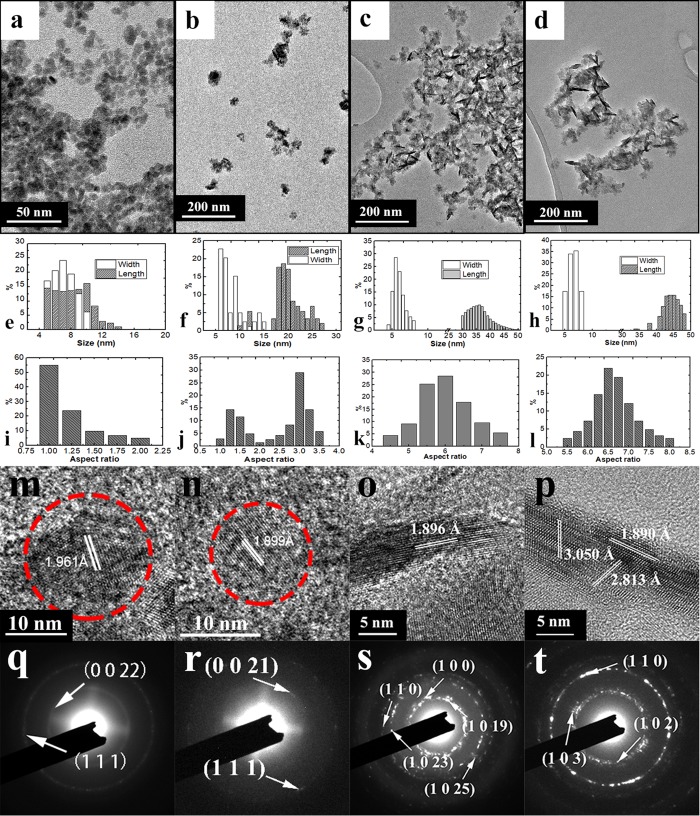
Table 1 summarizes the design condition and major findings of Cu2–xS NCs of different sizes and shapes (Samples A–I). These interesting findings cause the motivation to study on their physical properties. Typically, four samples with distinct features were chosen as representatives to illustrate the morphology and composition change with the variation of the amounts of PEI. Under a low concentration of PEI (0.032 mg/mL), Cu2–xS dots (Sample A) were formed and appeared in a nearly spherical shape with an average size of 6.5 nm. TEM images in Figure 2a,e show the size distribution (5–10 nm). With the concentration of PEI increased to 0.224 mg/mL, Cu2–xS nanoparticles are elongated. Short rod-shaped nanoparticles (Sample D) can be seen in Figure 2b. The differentiation of the width and length can be seen in Figure 2f. The aspect ratio graph in Figure 2j indicates the mixture of nanoparticles and short nanorods. With the concentration of PEI further increases to 1 mg/mL, the morphology of NCs becomes uniform in rod-shaped. In Figure 2c, clear rod-shaped Cu2–xS NCs (Sample G) with a distinguishable width (6.5 nm) and length (38.5 nm) are observed. The aspect ratio also increases from 3.0 to 6.0 compared with samples in Figure 2b. With the PEI concentration in 1.28 mg/mL, longer Cu2–xS nanorods (width, 6.5 nm; length, 44.5 nm) (Sample H) are obtained as shown in Figure 2d. Figure 2l shows that the aspect ratio increases from 6.0 to 6.5. Figure 2 clearly shows a transition of the formation from “dot” to “rod” due to the increase of PEI. A lower concentration (0.032–0.32 mg/mL) of PEI results in the formation of nanoparticles or the mixture of nanoparticles and short nanorods, while uniform nanorods can be obtained with higher PEI concentration (0.75–1.60 mg/mL). The length of nanostructures can be adjusted from 8 to 46 nm, as shown in Figure 2e–h.
Table 1. Size, Shape, and LSPR Peak of Cu2–xS NCs Obtained from Different Concentrations of PEI.
| sample | PEI (mg/mL) | aspect ratio | shape | LSPR peak (nm) |
|---|---|---|---|---|
| A | 0.032 | 1.1 ± 0.2 | dot | 1148 |
| B | 0.096 | 1.2 ± 0.2 | dot | 1145 |
| C | 0.160 | 2.2 ± 0.3 | dot and short rod | 1145 |
| D | 0.224 | 3.0 ± 0.5 | dot and short rod | 1143 |
| E | 0.320 | 2.8 ± 0.2 | dot and short rod | 1189 |
| F | 0.750 | 5.7 ± 0.7 | nanorod | 1231 |
| G | 1.000 | 6.0 ± 0.5 | nanorod | 1277 |
| H | 1.280 | 6.5 ± 0.5 | nanorod | 1323 |
| I | 1.600 | 7.5 ± 0.5 | nanorod | 1369 |
Figure 2.
(a–d) TEM images of Cu2–xS nanocrystals together with (e–h) histograms for the width and length, and (i–l) aspect ratio. (m–p) HRTEM images of Cu2–xS NCs with different morphologies. (q–t) Fast Fourier transformation of nanostructures.
However, as the concentration of PEI increases from 1.28 to 1.60 mg/mL, the length of Cu2–xS nanorods has no significant change. According to the TEM images of the Cu2–xS nanostructure, the width or diameter of the Cu2–xS nanostructure tends to be larger with low PEI concentration. One of the reasons is that the amino group of PEI appears to have strong affinity to particular crystal orientation at high concentration (e.g., 0.75–1.60 mg/mL). Such mechanism can be considered as an analogy to the use of oleylamine and dodecylamine for producing semiconductor nanorods in the organic phase.6,37,38 Similar studies by using citrate acid to synthesize Cu2–xS NCs were conducted. However, no nanorod was found at any surfactant concentration. It could be attributed to the fact that PEI is preferentially bind onto (1 1 0) or (1 0 0) faces of Cu2–xS NCs at high concentration. Under low concentration of PEI, the affinity to (1 1 0) or (1 0 0) faces is much weaker resulting in the formation of dots or dot/nanorod mixture. In addition, the actual shape of PEI-capped CuS nanorods is fusiform, which is quite different with the traditional rod-shaped nanostructure. It is noted that polymer-like materials are observed in Figure 1f–i. We speculate that these materials are the remaining surfactant PEI as high concentration of PEI was used for synthesizing Cu2–xS rods. In contrast, the situation is not obvious in dot-shaped samples as shown in Figure 1a–d.
High-resolution transmission electron microscopy (HRTEM) images reveal the lattice plane spacing of each type of nanostructure. In Figure 2m, the lattice plane spacing of Cu2–xS nanostructures is 1.98 Å, which corresponds to (0 0 34) crystallographic planes of hexagonal yarrowite (PDF card number 36-0379). The lattice plane spacing in Figure 2n is 1.88 Å, which refers to the (1 1 1) plane, one of major planes in yarrowite. The highly similar diffraction patterns of corresponding samples in Figure 2q,r indicate that they are dominated by the same crystallographic phase. According to the HRTEM images of Cu2–xS nanorods, both have ∼1.890 Å lattice plane spacing value, which correspond to (1 1 0) crystallographic planes of hexagonal covellite (PDF card number 06-0464). The (0 0 19), (1 0 23), and (1 0 25) planes illustrated by the diffraction pattern in Figure 2s indicate the coexistence of the hexagonal yarrowite and covellite crystal phase. As the nanorods are further elongated, the covellite phase is dominant in nanostructures as illustrated in Figure 2p,t.
According to the XRD patterns in Figure 3, Cu2–xS nanorods (Samples G and H) were occupied by hexagonal modifications of covellite and yarrowite, respectively. However, Samples A and D, which were synthesized at low concentration of PEI, have a better match XRD pattern with hexagonal yarrowite (Cu9S8, PDF number 36-0379) than covellite (CuS, PDF number 06-0464). Three major peaks of Sample A at 28.65, 31.83, and 47.36° representing the respective (0 0 22), (1 0 13), and (1 1 1) planes of yarrowite. Both Samples A and D (in Figure 3) have a similar XRD pattern. By combining the diffraction pattern in Figure 2q,r, we conclude that both Samples A and D are yarrowite crystal phases. The XRD patterns of the Cu2–xS nanorod appear to match the covellite crystal phase. The distinguishable peaks at 27.68, 29.27, 31.78, 47.94, 52.71, and 59.35° corresponding to (1 0 1), (1 02), (1 0 3), (1 1 0), (1 0 8), and (1 1 6), respectively. In addition, as the XRD signals of Sample H at 29.27, 31.78° has a better match with covellite than Sample G, indicating that the crystal phase of Cu2–xS NCs is morphology-dependent. It is obvious that the concentration of PEI alters the crystal structures. The amino of PEI combines with copper into the coordinate bond and reduces the valence state of copper.
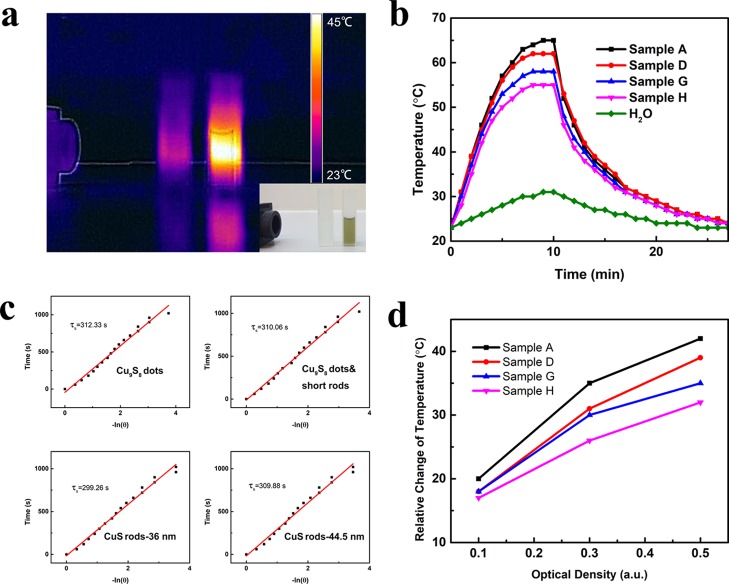
The absorbance of Cu2–xS nanostructures with different morphologies is measured by UV–vis–NIR spectroscopy, as shown in Figure 4. The strong absorption in the NIR range is originated from the collective oscillation of valence-band free carriers (holes) on the surface of Cu2–xS NCs, resulting in the LSPR effect. Both Cu9S8 and CuS NCs exhibit strong NIR absorption. Herein, the LSPR peaks can be tuned from 1148 to 1323 nm with the morphology and composition change of Cu2–xS NCs. As highly self-doped semiconductors, the band gap of Cu2–xS can be tuned by the value of x. According to Cheung et al.,13 as the x value increases, Cu2–xS NCs have higher band gap energy resulting in the blueshift of the LSPR peak. According to Figure 4, CuS dots have an LSPR peak at 940 nm. However, Sample A, with the same morphology but different composition, has an LSPR peak at 1148 nm. In addition, for Cu2–xS NCs with the same composition but elongated nanostructures, for example, Samples G and H, the LSPR peak is nearly 400 nm redshifted away from CuS dots. As shown in this work, the shape is a more predominant factor on affecting the LSPR peak. The strong NIR absorption of PEI-capped Cu2–xS NCs cause the motivation to investigate the photothermal response of these copper-based chalcogenide NCs. Pure water and Cu2–xS NCs were placed in line and irradiated with a 1064 nm laser for 5 min. The NIR irradiation first penetrated the water sample then passed through the Cu2–xS NCs. The IR image in Figure 5a indicates the temperature change of water and Cu2–xS suspension. The temperature of Cu2–xS NCs was raised from 23 to 43 °C in 5 min even with attenuated laser. In sharp contrast, the temperature of water was almost constant (from 23 to 25 °C in 5 min). Detailed photothermal profiles of different Cu2–xS NCs were further examined. Cu2–xS NCs with different morphologies were prepared with the same optical density (0.5 absorbance in 1064 nm) and then irradiated by 1064 nm laser at 1.33 W/cm2 for 10 min. Distilled water was served as a negative control. As shown in Figure 5b, a morphology-dependent photothermal response was observed. Specifically, the temperature of Cu2–xS NC suspension was raised from 23 to 55–65 °C, and Cu2–xS dots possess the faster elevation.
Figure 5.
(a) Infrared thermal image of distilled water and Cu9S8 dots in line. (b) Temperature elevation of distilled water and PEI-capped Cu2–xS NCs aqueous dispersion under the irradiation of a 1064 nm laser with 1.33 W/cm2 for 10 min followed by natural cooling. (c) Time constant for heat transfer from the system determined by applying the linear time data from cooling period (after 10 min) vs negative natural logarithm of driving force temperature. (d) Plot of temperature change (ΔT) over 10 min vs the aqueous dispersions of Cu2–xS NCs with different optical densities.
To have a quantitative comparison of the photothermal response, the heat conversion efficiency (HCE) was calculated. According to Roper’s report,39 the HCE, η, of the synthesized PEI-capped Cu2–xS can be calculated by eq 1
| 1 |
where h is the heat transfer coefficient, S is the surface area of the container, and the value of hS can be obtained from Figure 5c. Tmax is the steady-state temperature of Cu2–xS dispersion, while Tsurr is the surrounding temperature. Qdis represents the energy absorbed by the container and distilled water. I is the power of the laser, while A1064is the absorbance of Cu2–xS NCs at 1064 nm. The optical density of all the nanocrystal suspension was prepared to 0.5 at 1064 nm and irradiated by 1064 nm laser (1.33 W/cm2) until a steady-state temperature was reached. Then, after the laser was shut off, the cooling process of the aqueous dispersion was recorded for measuring the rate of heat transfer from NC dispersion to the ambient environment. Consequently, the obtained HCE of Cu2–xS NCs are summarized in Table 2.
Table 2. Comparison of Heat Conversion Efficiency of Various Cu2–xS Nanostructures.
| plasmonic nanomaterials | shape | light sources | power density (W/cm2) | efficiency | ref |
|---|---|---|---|---|---|
| Cu9S5 | plate | 980 nm laser | 0.51 | ∼25.7% | (28) |
| Cu7.2S4 | sphere | 980 nm laser | 0.29 | 56.7% | (34) |
| Cu2–xS | sphere | 808 nm laser | 2.3 | 16.3% | (29) |
| CuS | sphere | 808 nm laser | 1.0 | 31.4% | (31) |
| Cu2–xS | sphere | 808 nm laser | 1.0 | 27.6% | (30) |
| Cu2–xS | sphere | 1064 nm laser | 1.5 | 30.8% | (30) |
| Cu9S8 | dot | 1064 nm laser | 1.33 | ∼49.0% | this work |
| Cu9S8 | dot and short rod | 1064 nm laser | 1.33 | ∼45.1% | this work |
| CuS | nanorod | 1064 nm laser | 1.33 | ∼36.6% | this work |
| CuS | nanorod | 1064 nm laser | 1.33 | ∼34.9% | this work |
Remarkably, an HCE of 49.0% was obtained from Cu9S8 dots, which is top-ranking among the reported Cu2–xS nanostructures so far. Cu2–xS with elongated morphology has reduced performance in the photothermal response, which is also illustrated in Figure 5d. The reason for the variation of HCE obtained in different Cu2–xS structures is still unclear, and further investigation is needed. In fact, the surfactant has played an important role. For the Cu2–xS nanorods, the surface was heavily encapsulated in the PEI polymer matrix, which may affect the relaxation of phonons and transfer of heat. Another reason could be the shift of the LSPR peak. Although the samples had the same absorption at 1064 nm, the portion of scattering and absorption components could be different.40 Similar to gold nanorods, with the aspect ratio growth, the scattering component increases, while the absorption component decreases,41 Cu2–xS nanorods might have a similar change with growth in the longitudinal direction, resulting in the difference of HCE. The high HCE value of as-prepared Cu2–xS NCs makes them highly superior as photothermal agents. Besides, according to the UV–vis–NIR spectrum of rod-shaped Cu2–xS NCs, the LSPR peaks are located at 1277 and 1323 nm, which enable this material for deep tissue biological applications. In addition, to explore the photothermal stability, Cu2–xS dispersion was irradiated with laser for 10 min followed by a natural cooling with laser off for three repeated cycles. The results indicate good stability and reproducibility of Cu2–xS nanostructures in these cycles (Figure S1).
Conclusions
Cu2–xS nanorods, with an aspect ratio from 2.2 ± 0.3 to 7.5 ± 0.3 and the length from 6.5 to 44.5 nm, have been successfully fabricated using a facile aqueous-based approach. Low-molecular-weight PEI was used as the capping agent. The concentration of PEI has played an important role to vary the shape of NCs. XRD analysis revealed that the dominant crystallographic phase of Cu2–xS (Cu9S8 and CuS) was also altered with the morphology change. As observed from the UV–vis–NIR spectra, when the length of NCs increases, the corresponding LSPR peak exhibits a redshift from 1145 to 1369 nm. The prepared Cu2–xS NCs exhibit high HCE (from 34.9 to 49.0%) under the irradiation of 1064 nm laser with 1.33 W/cm2 power density. In addition, 49.0% of HCE is one of the promising results in the current reported articles.
Experimental Section
Materials
Copper(II) chloride (99%, Sigma-Aldrich), sodium sulfide (90+%, ACROS Organics), Poly(ethyleneimine) solution (Mn ∼1800, Sigma-Aldrich), and absolute ethanol (≥99.5%, Merck) were used in the synthesis of the nanoparticles. All chemicals were used as-received without further purification.
Synthesis of PEI-Capped Cu2–xS NCs
Cu2–xS NCs were synthesized by employing low-molecular-weight branched PEI as reducing and capping agents. Copper(II) chloride and sodium sulfide were employed as the copper source and sulfur source, respectively. The nucleation and growth processes were proceeded at 85 °C, followed by incubation in an ice bath. A typical procedure is as follows: PEI solution was prepared in required concentration, and copper(II) chloride powders were dissolved in PEI aqueous solution with 1 mmol/L concentration under stirring. The solution was blue color. Freshly prepared sodium sulfide solution was then added dropwise until the color turned red-brown. The mixture was sonicated for 10 min and subsequently incubated in an 85 °C water bath for another 10 min. The color of solution changed from red-brown to dark green, indicating the formation of Cu2–xS NCs. The samples were centrifuged with acetone and redispersed in deionized water.
Characterization of Cu2–xS NCs
Transmission electron microscopy (TEM) images of different Cu2–xS NCs were obtained using a JEOL JEM-2011 TEM. All TEM samples were prepared by dropping 20 μL of Cu2–xS aqueous dispersion onto a standard copper TEM grid and dried at room temperature. Powder X-ray diffraction was measured with a Rigaku SmartLab powder XRD diffractometer operating with Cu Kα radiation and Bragg–Brentano θ–2θ geometry. The samples were prepared by dropping Cu2–xS acetone dispersion on the low-background silicon sample holders at 30 °C for removing the solvent. The UV–vis–NIR spectra of Cu2–xS samples were recorded on an Agilent Cary 5000 Scan spectrophotometer. The infrared thermal image was captured by the FLIR ONE device. The hydrodynamic size and zeta potential were measured by a Marvin Nano-ZS90.
Evaluation of Photothermal Performance
The aqueous dispersion (1 mL) of Cu2–xS NCs with different optical densities at 1064 nm were irradiated with an NIR laser (FU1064ADX-F34, 1064 nm, 1.333 W/cm2). The NCs dispersions were placed in quartz cuvettes with a temperature probe attached (with an accuracy of 0.1 °C). The temperature changes of samples were recorded in every 60 s. To investigate the heat transfer efficiency, the aqueous dispersion was irradiated with a 1064 nm NIR laser for 10 min, followed by a naturally cooling process to ambient temperature. Cu2–xS NCs with different morphologies were measured under the same conditions.
Acknowledgments
The work described in this paper was supported by a grant from the Research Grants Council of the Hong Kong Special Administrative Region, China (PolyU 25200914 and PolyU 15200518) and the Natural National Science Foundation of China (31871442). Z.X. was supported by a grant from the Research Committee of The Hong Kong Polytechnic University (RUG5 and G-YBJF).
Supporting Information Available
The Supporting Information is available free of charge on the ACS Publications website at DOI: 10.1021/acsomega.9b02204.
Photothermal stability study of different Cu2–xS nanostructures (PDF)
The authors declare no competing financial interest.
Supplementary Material
References
- Pedetti S.; Nadal B.; Lhuillier E.; Mahler B.; Bouet C.; Abécassis B.; Xu X.; Dubertret B. Optimized Synthesis of Cdte Nanoplatelets and Photoresponse of Cdte Nanoplatelets Films. Chem. Mater. 2013, 25, 2455–2462. 10.1021/cm4006844. [DOI] [Google Scholar]
- Schierhorn M.; Boettcher S. W.; Peet J. H.; Matioli E.; Bazan G. C.; Stucky G. D.; Moskovits M. Cdse Nanorods Dominate Photocurrent of Hybrid Cdse–P3ht Photovoltaic Cell. ACS Nano 2010, 4, 6132–6136. 10.1021/nn101742c. [DOI] [PubMed] [Google Scholar]
- Jana S.; Srivastava B. B.; Pradhan N. Correlation of Dopant States and Host Bandgap in Dual-Doped Semiconductor Nanocrystals. J. Phys. Chem. Lett. 2011, 2, 1747–1752. 10.1021/jz200673q. [DOI] [Google Scholar]
- Choi J. J.; Lim Y.-F.; Santiago-Berrios M. E. B.; Oh M.; Hyun B.-R; Sun L.; Bartnik A. C.; Goedhart A.; Malliaras G. G.; Abruna H. D.; Wise F. W.; Hanrath T. Pbse Nanocrystal Excitonic Solar Cells. Nano Lett. 2009, 9, 3749–3755. 10.1021/nl901930g. [DOI] [PubMed] [Google Scholar]
- Mou J.; Li P.; Liu C.; Xu H.; Song L.; Wang J.; Zhang K.; Chen Y.; Shi J.; Chen H. Ultrasmall Cu2-xS Nanodots for Highly Efficient Photoacoustic Imaging-Guided Photothermal Therapy. Small 2015, 11, 2275–2283. 10.1002/smll.201403249. [DOI] [PubMed] [Google Scholar]
- Yu H.; Wang J.; Wang T.; Yu H.; Yang J.; Liu G.; Qiao G.; Yang Q.; Cheng X. Scalable Colloidal Synthesis of Uniform Bi2S3 nanorods as Sensitive Materials for Visible-Light Photodetectors. CrystEngComm 2017, 19, 727–733. 10.1039/C6CE01879C. [DOI] [Google Scholar]
- Zhao Y.; Pan H.; Lou Y.; Qiu X.; Zhu J.; Burda C. Plasmonic Cu2-xS Nanocrystals: Optical and Structural Properties of Copper-Deficient Copper (I) Sulfides. J. Am. Chem. Soc. 2009, 131, 4253–4261. 10.1021/ja805655b. [DOI] [PubMed] [Google Scholar]
- Luther J. M.; Jain P. K.; Ewers T.; Alivisatos A. P. Localized Surface Plasmon Resonances Arising from Free Carriers in Doped Quantum Dots. Nat. Mater. 2011, 10, 361–366. 10.1038/nmat3004. [DOI] [PubMed] [Google Scholar]
- Kar P.; Farsinezhad S.; Zhang X.; Shankar K. Anodic Cu2S and Cus Nanorod and Nanowall Arrays: Preparation, Properties and Application in CO2photoreduction. Nanoscale 2014, 6, 14305–14318. 10.1039/C4NR05371K. [DOI] [PubMed] [Google Scholar]
- Liu X.; Wang X.; Zhou B.; Law W.-C.; Cartwright A. N.; Swihart M. T. Size-Controlled Synthesis of Cu2-xE (E = S, Se) Nanocrystals with Strong Tunable near-Infrared Localized Surface Plasmon Resonance and High Conductivity in Thin Films. Adv. Funct. Mater. 2013, 23, 1256–1264. 10.1002/adfm.201202061. [DOI] [Google Scholar]
- Sadtler B.; Demchenko D. O.; Zheng H.; Hughes S. M.; Merkle M. G.; Dahmen U.; Wang L.-W.; Alivisatos A. P. Selective Facet Reactivity During Cation Exchange in Cadmium Sulfide Nanorods. J. Am. Chem. Soc. 2009, 131, 5285–5293. 10.1021/ja809854q. [DOI] [PubMed] [Google Scholar]
- Kruszynska M.; Borchert H.; Bachmatiuk A.; Rümmeli M. H.; Büchner B.; Parisi J.; Kolny-Olesiak J. Size and Shape Control of Colloidal Copper (I) Sulfide Nanorods. ACS Nano 2012, 6, 5889–5896. 10.1021/nn302448n. [DOI] [PubMed] [Google Scholar]
- Cheung T.-L.; Hong L.; Rao N.; Yang C.; Wang L.; Lai W. J.; Chong P. H. J.; Law W.-C.; Yong K.-T. The Non-Aqueous Synthesis of Shape Controllable Cu2-xS Plasmonic Nanostructures in a Continuous-Flow Millifluidic Chip for the Generation of Photo-Induced Heating. Nanoscale 2016, 8, 6609–6622. 10.1039/C5NR09144F. [DOI] [PubMed] [Google Scholar]
- Koh W.-k.; Bartnik A. C.; Wise F. W.; Murray C. B. Synthesis of Monodisperse Pbse Nanorods: A Case for Oriented Attachment. J. Am. Chem. Soc. 2010, 132, 3909–3913. 10.1021/ja9105682. [DOI] [PubMed] [Google Scholar]
- Li Z.; Peng X. Size/Shape-Controlled Synthesis of Colloidal Cdse Quantum Disks: Ligand and Temperature Effects. J. Am. Chem. Soc. 2011, 133, 6578–6586. 10.1021/ja108145c. [DOI] [PubMed] [Google Scholar]
- Li Z.; Qin H.; Guzun D.; Benamara M.; Salamo G.; Peng X. Uniform Thickness and Colloidal-Stable Cds Quantum Disks with Tunable Thickness: Synthesis and Properties. Nano Res. 2012, 5, 337–351. 10.1007/s12274-012-0214-5. [DOI] [Google Scholar]
- Huang X.; El-Sayed I. H.; Qian W.; El-Sayed M. A. Cancer Cell Imaging and Photothermal Therapy in the near-Infrared Region by Using Gold Nanorods. J. Am. Chem. Soc. 2006, 128, 2115–2120. 10.1021/ja057254a. [DOI] [PubMed] [Google Scholar]
- Jain P. K.; Huang X.; El-Sayed I. H.; El-Sayed M. A. Noble Metals on the Nanoscale: Optical and Photothermal Properties and Some Applications in Imaging, Sensing, Biology, and Medicine. Acc. Chem. Res. 2008, 41, 1578–1586. 10.1021/ar7002804. [DOI] [PubMed] [Google Scholar]
- O’Neal D. P.; Hirsch L. R.; Halas N. J.; Payne J. D.; West J. L. Photo-Thermal Tumor Ablation in Mice Using near Infrared-Absorbing Nanoparticles. Cancer Lett. 2004, 209, 171–176. 10.1016/j.canlet.2004.02.004. [DOI] [PubMed] [Google Scholar]
- Ji M.; Xu M.; Zhang W.; Yang Z.; Huang L.; Liu J.; Zhang Y.; Gu L.; Yu Y.; Hao W.; An P.; Zheng L.; Zhu H.; Zhang J. Structurally Well-Defined Au@Cu2-xS Core–Shell Nanocrystals for Improved Cancer Treatment Based on Enhanced Photothermal Efficiency. Adv. Mater. 2016, 28, 3094–3101. 10.1002/adma.201503201. [DOI] [PubMed] [Google Scholar]
- Chen H.; Zhang X.; Dai S.; Ma Y.; Cui S.; Achilefu S.; Gu Y. Multifunctional Gold Nanostar Conjugates for Tumor Imaging and Combined Photothermal and Chemo-Therapy. Theranostics 2013, 3, 633. 10.7150/thno.6630. [DOI] [PMC free article] [PubMed] [Google Scholar]
- Zhang J. Z. Biomedical Applications of Shape-Controlled Plasmonic Nanostructures: A Case Study of Hollow Gold Nanospheres for Photothermal Ablation Therapy of Cancer. J. Phys. Chem. Lett. 2010, 1, 686–695. 10.1021/jz900366c. [DOI] [Google Scholar]
- Dickson R.A Pilot Study of Aurolase(Tm) Therapy in Patients with Refractory and/or Recurrent Tumors of the Head and Neck. U.S. National Library of Medicine: 2017, ClinicalTrials.gov Identifier: NCT00848042.
- Goodrich G.A Pilot Study of Aurolase Therapy in Subjects with Primary and/or Metastatic Lung Tumors. U.S. National Library of Medicine: 2016, ClinicalTrials.gov Identifier: NCT01679470.
- Dreaden E. C.; Austin L. A.; Mackey M. A.; El-Sayed M. A. Size Matters: Gold Nanoparticles in Targeted Cancer Drug Delivery. Ther. Delivery 2012, 3, 457–478. 10.4155/tde.12.21. [DOI] [PMC free article] [PubMed] [Google Scholar]
- Alkilany A. M.; Thompson L. B.; Boulos S. P.; Sisco P. N.; Murphy C. J. Gold Nanorods: Their Potential for Photothermal Therapeutics and Drug Delivery, Tempered by the Complexity of Their Biological Interactions. Adv. Drug Delivery Rev. 2012, 64, 190–199. 10.1016/j.addr.2011.03.005. [DOI] [PubMed] [Google Scholar]
- Chen J.; Glaus C.; Laforest R.; Zhang Q.; Yang M.; Gidding M.; Welch M. J.; Xia Y. Gold Nanocages as Photothermal Transducers for Cancer Treatment. Small 2010, 6, 811–817. 10.1002/smll.200902216. [DOI] [PMC free article] [PubMed] [Google Scholar]
- Tian Q.; Jiang F.; Zou R.; Liu Q.; Chen Z.; Zhu M.; Yang S.; Wang J.; Wang J.; Hu J. Hydrophilic Cu9S5 Nanocrystals: A Photothermal Agent with a 25.7% Heat Conversion Efficiency for Photothermal Ablation of Cancer Cells in Vivo. ACS Nano 2011, 5, 9761–9771. 10.1021/nn203293t. [DOI] [PubMed] [Google Scholar]
- Wang S.; Riedinger A.; Li H.; Fu C.; Liu H.; Li L.; Liu T.; Tan L.; Barthel M. J.; Pugliese G.; De Donato F.; D’Abbusco M. S.; Meng X.; Manna L.; Meng H.; Pellegrino T. Plasmonic Copper Sulfide Nanocrystals Exhibiting near-Infrared Photothermal and Photodynamic Therapeutic Effects. ACS Nano 2015, 9, 1788–1800. 10.1021/nn506687t. [DOI] [PubMed] [Google Scholar]
- Hu R.; Fang Y.; Huo M.; Yao H.; Wang C.; Chen Y.; Wu R. Ultrasmall Cu2-xS Nanodots as Photothermal-Enhanced Fenton Nanocatalysts for Synergistic Tumor Therapy at Nir-Ii Biowindow. Biomaterials 2019, 206, 101–114. 10.1016/j.biomaterials.2019.03.014. [DOI] [PubMed] [Google Scholar]
- Huang Y.; Lai Y.; Shi S.; Hao S.; Wei J.; Chen X. Copper Sulfide Nanoparticles with Phospholipid-Peg Coating for in Vivo near-Infrared Photothermal Cancer Therapy. Chem. – Asian J. 2015, 10, 370–376. 10.1002/asia.201403133. [DOI] [PubMed] [Google Scholar]
- Ku G.; Zhou M.; Song S.; Huang Q.; Hazle J.; Li C. Copper Sulfide Nanoparticles as a New Class of Photoacoustic Contrast Agent for Deep Tissue Imaging at 1064 Nm. ACS Nano 2012, 6, 7489–7496. 10.1021/nn302782y. [DOI] [PMC free article] [PubMed] [Google Scholar]
- Liu L.; Zhou B.; Deng L.; Fu W.; Zhang J.; Wu M.; Zhang W.; Zou B.; Zhong H. Thermal Annealing Effects of Plasmonic Cu1.8s Nanocrystal Films and Their Photovoltaic Properties. J. Phys. Chem. C 2014, 118, 26964–26972. 10.1021/jp506043n. [DOI] [Google Scholar]
- Li B.; Wang Q.; Zou R.; Liu X.; Xu K.; Li W.; Hu J. Cu7.2S4 Nanocrystals: A Novel Photothermal Agent with a 56.7% Photothermal Conversion Efficiency for Photothermal Therapy of Cancer Cells. Nanoscale 2014, 6, 3274–3282. 10.1039/c3nr06242b. [DOI] [PubMed] [Google Scholar]
- Wen Y.; Pan S.; Luo X.; Zhang X.; Zhang W.; Feng M. A Biodegradable Low Molecular Weight Polyethylenimine Derivative as Low Toxicity and Efficient Gene Vector. Bioconjugate Chem. 2009, 20, 322–332. 10.1021/bc800428y. [DOI] [PubMed] [Google Scholar]
- Stroyuk O.; Raevskaya A.; Selyshchev O.; Dzhagan V.; Gaponik N.; Zahn D. R. T.; Eychmüller A. “Green” Aqueous Synthesis and Advanced Spectral Characterization of Size-Selected Cu2ZnSnS4 Nanocrystal Inks. Sci. Rep. 2018, 8, 13677. 10.1038/s41598-018-32004-1. [DOI] [PMC free article] [PubMed] [Google Scholar]
- Zheng Y.; Chen N.; Wang C.; Zhang X.; Liu Z. Oleylamine-Mediated Hydrothermal Growth of Millimeter-Long Cu Nanowires and Their Electrocatalytic Activity for Reduction of Nitrate. Nanomaterials 2018, 8, 192. 10.3390/nano8040192. [DOI] [PMC free article] [PubMed] [Google Scholar]
- Zhang Z.; Lu M.; Xu H.; Chin W.-S. Shape-Controlled Synthesis of Zinc Oxide: A Simple Method for the Preparation of Metal Oxide Nanocrystals in Non-Aqueous Medium. Chem. – Eur. J. 2007, 13, 632–638. 10.1002/chem.200600293. [DOI] [PubMed] [Google Scholar]
- Roper D. K.; Ahn W.; Hoepfner M. Microscale Heat Transfer Transduced by Surface Plasmon Resonant Gold Nanoparticles. J. Phys. Chem. C 2007, 111, 3636–3641. 10.1021/jp064341w. [DOI] [PMC free article] [PubMed] [Google Scholar]
- El-Sayed I. H.; Huang X.; El-Sayed M. A. Selective Laser Photo-Thermal Therapy of Epithelial Carcinoma Using Anti-Egfr Antibody Conjugated Gold Nanoparticles. Cancer Lett. 2006, 239, 129–135. 10.1016/j.canlet.2005.07.035. [DOI] [PubMed] [Google Scholar]
- Lee K.-S.; El-Sayed M. A. Dependence of the Enhanced Optical Scattering Efficiency Relative to That of Absorption for Gold Metal Nanorods on Aspect Ratio, Size, End-Cap Shape, and Medium Refractive Index. J. Phys. Chem. B 2005, 109, 20331–20338. 10.1021/jp054385p. [DOI] [PubMed] [Google Scholar]
Associated Data
This section collects any data citations, data availability statements, or supplementary materials included in this article.


