

Abstract
Delayed rectifier potassium current diversity and regulation are essential for signal processing and integration in neuronal circuits. Here, we investigated a neuronal role for MinK-related peptides (MiRPs), membrane-spanning modulatory subunits that generate phenotypic diversity in cardiac potassium channels. Native coimmunoprecipitation from rat brain membranes identified two novel potassium channel complexes, MiRP2-Kv2.1 and MiRP2-Kv3.1b. MiRP2 reduces the current density of both channels, slows Kv3.1b activation, and slows both activation and deactivation of Kv2.1. Altering native MiRP2 expression levels by RNAi gene silencing or cDNA transfection toggles the magnitude and kinetics of endogenous delayed rectifier currents in PC12 cells and hippocampal neurons. Computer simulations predict that the slower gating of Kv3.1b in complexes with MiRP2 will broaden action potentials and lower sustainable firing frequency. Thus, MiRP2, unlike other known neuronal β subunits, provides a mechanism for influence over multiple delayed rectifier potassium currents in mammalian CNS via modulation of α subunits from structurally and kinetically distinct subfamilies.
Keywords: delayed rectifier, hippocampus, KCNE3, Kv2.1, Kv3.1, potassium channel, RNAi
Introduction
Voltage-gated potassium (Kv) currents are generated by a numerous and diverse superfamily of α subunit genes, complemented by formation of channel “supercomplexes” with a range of non-pore-loop β subunits (Deutsch, 2002). The KCNE family of β subunit genes encodes single transmembrane domain (1TM) MinK-related peptides, or MiRPs (Takumi et al., 1988; Abbott and Goldstein, 1998) that coassemble with Kv α subunits to alter their voltage dependence, gating kinetics, unitary conductance, regulation, and pharmacology (Barhanin et al., 1996; Sanguinetti et al., 1996; Abbott et al., 1999; Schroeder et al., 2000; Abbott et al., 2001b). The role of MiRPs in mammalian heart has been widely studied, and their necessity in generating the unique kinetics of key human cardiac delayed rectifier channels has been demonstrated (Barhanin et al., 1996; Sanguinetti et al., 1996; Splawski et al., 1997; Tyson et al., 1997; Abbott et al., 1999; Sesti et al., 2000). Surprisingly, whereas mammalian neurons also exhibit exquisitely timed, delayed rectifier-mediated cellular repolarization, evidence of a neuronal role for mammalian MiRPs has been lacking.
Many mammalian neurons exhibit sustained trains of rapid action potentials, in contrast to the relatively slow action potentials required to sustain human cardiac function. Accumulating evidence strongly suggests that voltage-gated delayed rectifier channels within the Kv3 subfamily are essential for these sustained, high-frequency trains of impulses (Rudy and McBain, 2001). In particular, the suprathreshold activation of Kv3.1 and Kv3.2 channels combined with their ultra-rapid activation and deactivation are perfectly suited to this task. The various Kv3 subunits enjoy widespread, often overlapping, distribution in mammalian CNS, and their disruption by pharmacological or genetic means impairs rapid spiking in inhibitory neurons, increases seizure susceptibility (Lau et al., 2000), and generates increased γ-oscillations and decreased δ-oscillations in the cortex (Joho et al., 1999). Thus, Kv3 subfamily delayed rectifiers are considered a prerequisite for the characteristic fast-spiking properties of, for example, auditory neurons, neocortical interneurons, and subpopulations of neurons within the hippocampus (Gan and Kaczmarek, 1998; Erisir et al., 1999; Lien and Jonas, 2003; Macica et al., 2003).
Members of another Kv subfamily, designated Kv2, exhibit very different properties. Their slower, subthreshold activation and slow deactivation favor lower frequency action potentials and longer refractory periods. Kv2 channels are thought to be the predominant α subunit type in mammalian brain: injection of nonfractionated mRNA from whole brain into Xenopus oocytes elicits a Kv2-like delayed rectifier potassium current, and immunocytochemistry reveals widespread neuronal Kv2.1 expression (Frech et al., 1989; Trimmer, 1991, 1993; Murakoshi and Trimmer, 1999). The delicate balance between Kv2 and Kv3 currents in neurons from regions such as the hippocampus and globus pallidus determines firing frequency and may be disrupted in disease states linked to altered neuronal excitability, including epilepsy, Parkinson's disease, and schizophrenia (Baranauskas et al., 1999). Recently, MPS-1, a MiRP orthologue from Caenorhabditis elegans, was cloned and demonstrated to regulate nematode neurosensory physiology via modulation of KVS-1, a newly-cloned A-type potassium channel similar to Kv4.2 (Bianchi et al., 2003). Here, we show that MiRP2 (KCNE3) is widely expressed in human brain and demonstrate that MiRP2 can slow and downregulate delayed rectifier currents in mammalian neurons by forming native channel complexes with Kv2.1 and with Kv3.1b, two structurally and functionally distinct potassium channels that are opposing determinants of spike frequency and action potential duration in mammalian brain.
Materials and Methods
Northern blot analysis. Northern blots were performed with 32P[ATP]-labeled probes (Amersham Biosciences, Piscataway, NJ) with a 300 bp fragment of human KCNE3 coding region. The membranes (Human Brain II and Human Brain V; Clontech, Cambridge, UK) contained 2 μg of poly(A) + mRNA per lane purified from 12 distinct adult human brain regions and from whole adult human brain and spinal cord. Blots were exposed for 24 hr.
Cell culture and transfection. Chinese hamster ovary (CHO) cells were cultured as before (Abbott et al., 1999). CHO cells were transfected in 60 mm dishes with cDNAs for human MiRP2 (2 μg) or blank plasmid (2 μg) and rat Kv2.1 (0.2 μg) or rat Kv3.1 (0.2 μg) in pCINeo (Promega, Madison, WI) using Superfect transfection reagent (Qiagen, Hilden, Germany), 24 hr before voltage-clamp or immunocytochemistry experiments. Cells were cotransfected with green fluorescent protein (GFP) (in pBOB; 2 μg) for voltage-clamp studies to visualize transfected cells. For immunocytochemistry, a hemagglutinin (HA)-tagged construct of hMiRP2 (Abbott et al., 2001b) was used to facilitate detection with anti-HA antibody.
PC12 cells were cultured as described previously (Tai et al., 2003). PC12 cells were cotransfected with GFP (in pBOB; 2 μg) and rat MiRP2 cDNA, human HA-tagged MiRP2 cDNA (2 μg; in pCI Neo), scrambled control small interfering RNA (siRNA) (0.1 μg), or rat MiRP2 siRNA (0.1 μg) in 6-well plates using Lipofectamine 2000 (Invitrogen, San Diego, CA) and plated on to glass coverslips precoated with poly-l-lysine (0.1 mg/ml) (Sigma, St. Louis, MO) for immunocytochemistry or voltage-clamp studies. Twenty-four hours were allowed for expression of cDNA, and 48 hr for siRNAs.
Hippocampi were dissected from embryonic stage 18 (E18) Sprague Dawley rats, the neurons enzymatically dissociated and plated on coverslips pretreated with poly-d-lysine (30 μg/ml) and laminin (3 μg/ml). Neurons were cultured in neurobasal media (Invitrogen) supplemented with B27, glutamine, and glutamate in vitro for 12-14 d before transfection. Transfection was achieved using Lipofectamine 2000, as described for PC12 cells, and at least 24 hr were allowed for gene expression before cells were used for both immunohistochemistry and electrophysiology.
Reverse transcription-PCR and RNA interference. Kv2.1 and Kv3.1 RNA expression was detected, and a full-length clone of rat MiRP2 was generated by reverse transcription (RT)-PCR. In brief, total RNA was extracted from PC12 cells or primary hippocampal neurons using Trizol (Invitrogen), DNase I cleaned, and reverse transcribed using the Superscript II kit (Invitrogen). Primer sequences were (5′ to 3′): Kv2.1, AGGCCGAACTGTGTCTACTC (sense) and GTCCTCTGCACCCTCCTAAC (antisense) (taken from Conforti and Millhorn, 1997); Kv3.1, CCACAGCCACTTCGACTATG (sense) and GTTGAAGCGCTCGTGAGTCT (antisense); MiRP2, CAGATCGCAGAGTCAGTTTCTAGC (sense) and TCGAGATGAGTTCCGGAGACC (antisense). Gene identities were confirmed by sequencing single bands cut from agarose gels. For both functional experiments and assessment of RNAi gene silencing at the mRNA level, 0.1 μg of double-stranded siRNA 21mer oligos (Dharmacon, Lafayette, CO) corresponding to bases AACAGAGGAUCAUCGGGCUAG of rMiRP2 or GGGAACCACACGGACGCCA for scrambled control siRNA were transfected per 35 mm dish of PC12 cells using Lipofectamine 2000. RNA from cell cultures was extracted using the RNeasy kit (Qiagen), and RNA concentration was measured by spectrophotometry (SmartSpec3000; Bio-Rad, Hercules, CA). RT-PCR was performed with rat β-actin primers (5′ to 3′): CGAGCGTGGCTACAGCTTCA (sense); GGCCAGGATAGAGCCACCAA (antisense) to normalize for mRNA concentration. Optical densities of samples run on a 1% agarose gel and stained with ethidium bromide were measured using a Fluor-S MultiImager (Bio-Rad). Samples normalized to β-actin cDNA concentration were subsequently amplified using rat MiRP2-specific primers, and optical density was quantified as before.
Immunoprecipitation and Western blotting of MiRP2-containing complexes. The brain membrane preparation and immunoprecipitation protocols were adapted from BD Biosciences application notes and Nadal et al. (2003), respectively. Whole brains were obtained from sexually mature normal Sprague Dawley rats of either sex, stripped of meninges, and homogenized in 9 vol of ice-cold dissection buffer (50 mm Tris-acetate, pH 7.4, 10% sucrose, and 5 mm EDTA) containing a freshly added protease inhibitor mixture (Boehringer), using a motor-driven glass/Teflon homogenizer. The homogenate was centrifuged at 800 × g for 20 min (all spins carried out at 4°C), then the supernatant was removed and homogenized again before centrifugation at 16,000 × g for 30 min. The resultant pellet was resuspended in 15 ml per five brains in 320 mm sucrose, and 9 vol of water was added. The mixture was immediately homogenized in glass/Teflon, a protease inhibitor mixture was added, then this mixture was incubated on ice for 30 min, before centrifugation at 25,000 × g for 20 min. The resulting pellet was resuspended in 1 ml of water per rat brain, and sucrose, water, and HEPES were added to give a final volume of 45 ml in 1.2 m sucrose, 5 mm HEPES, plus a mixture of protease inhibitors. This was homogenized, then spun at 9,200 × g for 20 min. The resulting pellet was resuspended in solubilization buffer (50 mm Tris-HCl, pH 7.4, 150 mm NaCl, 1 mm EDTA, 1% Triton X-100, and a protease inhibitor mixture) and incubated on ice for 1 hr to release membrane proteins. After centrifugation at 20,000 × g for 30 min, the supernatant was precleared with protein A-Sepharose 4 beads (Amersham Biosciences, Arlington Heights, IL) for 1 hr at 4°C; these beads were collected by centrifugation at 5,000 × g for 3 min and retained as a negative control for direct bead binding. The precleared supernatant was incubated with antibodies for immunoprecipitation: anti-Kv2.1 (Sigma), anti-Kv3.1 (Sigma), anti-parvalbumin (Sigma), or an in-house primary antibody raised by injection into rabbits of a mammalian expression vector expressing full-length hMiRP2. After 5-10 hr at 4°C, protein A-Sepharose 4B beads were added, and the mixture was incubated for an additional 2-5hrat4°C. The complexed beads were collected by centrifugation, washed for four times for 20 min each, then immunopurified complexes were eluted by incubating the beads for 20 min at 37°Cin5% β-mercaptoethanol, 1 mm EDTA, 1.5% SDS, and 10% glycerol in 50 mm Tris buffer, pH 6.7. After centrifugation, the resulting bead eluate was heated for an additional 20 min at 50-90°C to disrupt stable complexes and then separated by SDS-PAGE. After transfer onto polyvinylidene difluoride membranes, blots were probed with antibodies as indicated; detection was via goat anti-rabbit or anti-mouse horseradish peroxidase-coupled secondary antibodies (Bio-Rad) for fluorography.
Immunohistochemistry. Cells (CHO, PC12, or neurons) were transfected (if appropriate), plated on glass coverslips, and maintained in growth media. Twenty-four hours later, cells were fixed with 4% paraformaldehyde in PBS, quenched with Quench buffer (0.2% dried milk, 150 mm NaOAc, pH7.0), permeabilized with 0.5% Triton X-100 in Quench buffer, and after washing were probed with primary antibodies: 1:2000 anti-Kv2.1 (Sigma); 1:1500 anti-Kv3.1 (Sigma); 1:5000 anti-MAP2 (Sigma); or 1:10000 anti-HA (Pierce, Rockford, IL). Alexa Fluor 594-labeled (red) goat anti-rabbit IgG (Molecular Probes, Eugene, OR) and FITC-labeled (green) goat anti-mouse IgG (Sigma) were used as secondary antibodies for immunofluorescent detection.
Electrophysiology. Whole-cell currents were recorded at room temperature in CHO cells, PC12 cells, and hippocampal neurons using a Multiclamp 700A Amplifier (Axon Instruments, Foster City, CA), an IBM computer, and pCLAMP8 software. Cells were studied on an inverted microscope equipped with epifluorescence optics for GFP detection. Bath solution was (in mm): 135 NaCl, 5 KCl, 1.2 MgCl2, 5 HEPES, 2.5 CaCl2, and 10 d-glucose, pH 7.4. Pipettes were of 3-5 MΩ resistance when filled with intracellular solution containing (in mm): 10 NaCl, 117 KCl, 2 MgCl2, 11 HEPES, 11 EGTA, and 1 CaCl2, pH 7.2.
In electrophysiological experiments using CHO cells, the holding potential was -80 mV. The following voltage protocols were used: protocol 1—from holding, 2 sec test pulses from -60 to + 60 mV in 10 mV steps, followed by a 1 sec tail pulse to -30 mV; protocol 2—from holding, 300 msec test pulses from -60 mV to + 60 mV in 10 mV steps, followed by a 100 msec tail pulse to -30 mV; protocol 3 (pharmacological evaluation)—from holding, step to -100 mV and voltage ramp to + 60 mV over 1 sec, before returning to holding. This was followed by two 500 msec voltage steps to 0 mV and + 60 mV, respectively, and the protocol repeated at 0.1 Hz. The effect of drug block was assessed at steady state during the 0 mV pulse. For all experiments involving pharmacological block using TEA and 4-AP, drugs were prepared in the concentrations stated and applied via the bath during repetitive voltage-clamp pulses, as indicated. After reaching steady-state block, drug washout using normal bath solution was performed, and data discarded if currents did not return to within 10% of original (predrug) current amplitude. For experiments involving PC12 cells and cultured hippocampal neurons, holding potential was -60 mV to reduce contribution of A-type currents. Here, the following voltage protocols were used: protocol 4 —from holding, 1 sec test pulses from -100 to + 60 mV in 10 mV steps, followed by a 500 msec tail pulse to -30 mV; protocol 5—from holding, 1 sec test pulses from -60 to + 60 mV in 10 mV steps, followed by a 500 msec tail pulse to -30 mV; protocol 6 (pharmacological evaluation)—from holding, step to -100 mV and voltage ramp to + 60 mV over 1 sec, before returning to holding; this was followed by two 300 msec voltage steps to 0 mV and + 60 mV, respectively, each followed by a 500 msec tail pulse to -30 mV, and the protocol was repeated at 0.1 Hz. The effects of drug application were assessed at steady state during the 0 mV pulse. All electrophysiological data were analyzed initially using ClampFit (version 8.1) software. Details of fits are included in the text and figure legends. Values are expressed throughout as mean ± SEM, and data sets were statistically analyzed where appropriate using SigmaStat (version 2.0) software. Data were tested for normality, and the relevant parametric or nonparametric test was applied, as described in the figure legends.
Computer simulations. Computer simulations of the effects of MiRP2 on Kv3.1 currents and, thus, neuronal function were based on the equations of a previous model of Kv3.1 currents in medial nucleus of the trapezoid body (MNTB) neurons (Macica et al., 2003). Numerical integration of the differential equations was performed using a forward Euler algorithm implemented in custom software developed in house using the C programming language. We simulated Kv3.1 and Kv3.1-MiRP2 currents by altering the gating and current density parameters of the previous model according to our CHO cell recordings. Our model neuron contained a sodium current INa, the Kv3.1 current IKv3.1, or Kv3.1-MiRP2 current IKv3.1/M2, a low-threshold potassium current ILT, and a leakage conductance IL. INa and IL were given by the equations INa = gNam3h(V - 50) and IL = gL(V + 63), respectively. ILT was simulated by the equation ILT = gLTlr(V + 80), and IKv3.1 was simulated by the equation IKv3.1 = gKv3.1n3(0.7 + 0.3p)(V + 80). The equation for IKv3.1/M2 was identical to the equation for IKv3.1, except gKv3.1/M2 was substituted for gKv3.1. Evolution of the variables m, h, l, r, n, and p was described by Hodgkin-Huxley-type differential equations of the form dx/dt = (x∞ - x)/τx, where x = m, h, l, r, n, and p. Parameters for INa were: gNa = 0.5 μS; τm = 1/[76.4exp(0.037V) + 6.93exp(-0.043V)] ms; m∞ = 76.4τmexp(0.037V); τh = 1/[0.000533exp(-0.0909V) + 7.87exp(0.0691V)] ms; h∞ = 0.000533τhexp(0.037V). Parameters for IL were: gL = 0.002 μS. Parameters for ILT were: gLT = 0.02 μS; τl = 1/[1.2exp(0.03512V) + 0.2248exp(-0.0319V)] ms; l∞ = 1.2τlexp(0.03512V); τr = 1/[0.0438exp(-0.0053V) + 0.0562exp(-0.0047V)] ms; r∞ = 0.0438τrexp(-0.0053V). Parameters for IKv3.1 were: gKv3.1 = 0.15 μS; τn = 4.80963/[1 + exp((V + 20.0741)/16.3219)] + 0.1365exp(0.008775V); n∞ = 1/[1 + exp((V + 11)/(-19))]; τp = 1/[0.01175exp(-0.2699V) + 0.91exp(-0.004476V)] + 0.0002exp(-0.059V); p∞ = 1/[1 + exp((V - 10)/6)]. Parameters for IKv3.1/M2 were: gKv3.1/M2 = 0.15 μS or 0.1 μS; τn = 4.56919/[1 + exp((V - 8.08102)/17.8557)] + 0.24111exp (0.019328V); n∞ = 1/[1 + exp((V + 8)/(-19))]; τp = 1/[0.002234exp(-0.3267V) + 0.5964exp(-0.0076634V)] + 0.0002exp(-0.059V); p∞ = 1/[1 + exp((V -10)/6)]. Responses of the model neuron to current injections were simulated with the equations: C dV/dt = INa + ILT + IKv3.1 + IL + Iext(t); or C dV/dt = INa + ILT + IKv3.1/M2 + IL + Iext(t); in these equations, C is the cell capacitance (0.01 nF), and external currents Iext(t) were presented as repeated current steps (1.4 nA, 0.25 msec) applied at frequencies from 100 to 350 Hz, or a single pulse of 0.05 nA for 250 msec.
Results
Stable MiRP2-Kv2.1 and MiRP2-Kv3.1 complexes form in rat brain membranes
Regional distribution in adult human brain of transcripts for KCNE3, the gene encoding MiRP2, was assessed using multiple brain region Northern blots and KCNE3 coding region as a probe. After a 24 hr exposure, a message was detected in all human CNS regions tested and in spinal cord (Fig. 1A), with a predominant band at ∼3 kb, as reported previously for human MiRP2 (Schroeder et al., 2000). A band was also observed in the right-hand blot at 1.5 kb, as shown previously for MiRP2 in human skeletal muscle (Abbott et al., 2001b). The different bands may reflect tissue-dependent variation in MiRP2 transcript size. The presence of MiRP2 mRNA in cultured rat primary hippocampal neurons was confirmed by RT-PCR (Fig. 1B). To search for neuronal α subunit partners of MiRP2, we focused on key neuronal delayed rectifier potassium channels Kv2.1 and Kv3.1b [the predominant splice variant of Kv3.1 in adult brain (Perney et al., 1992), hereafter referred to as Kv3.1]. Rat brain membranes were isolated and solubilized with 1% Triton X-100. Expression of MiRP2 protein in rat brain membranes was confirmed using anti-MiRP2 antibody, which also recognized cloned rat MiRP2 expressed in CHO cells (Fig. 1C). Immunoprecipitations from rat brain membranes were performed with antibodies raised against MiRP2, Kv2.1, Kv3.1, or parvalbumin (a nonchannel protein present in fast-spiking hippocampal neurons) and protein A sepharose. The resultant immunoprecipitates were size fractionated and Western blotted with antibodies raised against Kv2.1 and Kv3.1. Antibodies against Kv2.1 detected a strong band at ∼90 kDa (as reported previously for Kv2.1) in total extract from rat brain membranes and from CHO cells transfected with Kv2.1 (Fig. 1D). Kv2.1 protein was immunoprecipitated from rat brain membranes with anti-Kv2.1 or anti-MiRP2 antibodies (arrowhead), but not with anti-Kv3.1 or anti-parvalbumin antibodies. In the anti-MiRP2 coimmunoprecipitated fraction, a high molecular weight species probably corresponding to multimeric Kv2.1 was enriched (Fig. 1D, asterisk). Anti-Kv3.1 antibodies detected a strong band at ∼90 kDa (as reported previously for Kv3.1) in total extract from rat brain membranes but did not recognize Kv2.1 overexpressed in CHO cells, indicating there was no cross-reactivity between anti-Kv3.1 antibody and Kv2.1 protein (Fig. 1E). Kv3.1 protein was immunoprecipitated from rat brain membranes with anti-Kv3.1 or anti-MiRP2 antibodies (arrowhead), but not with anti-Kv2.1 or anti-parvalbumin antibodies. In the anti-MiRP2 and anti-Kv3.1 immunoprecipitated fractions, a high molecular weight species probably corresponding to multimeric Kv3.1 was enriched (Fig. 1E, asterisk). Overall, the data strongly suggest that stable MiRP2-Kv2.1 and MiRP2-Kv3.1 complexes form in rat brain membranes.
Figure 1.

Immunopurification of MiRP2-Kv2.1 and MiRP2-Kv3.1 complexes from mammalian brain. A, Northern blot analysis showing distribution of MiRP2 mRNA in adult human brain and spinal cord. Numbers indicate migration distances of 1.35, 2.4, and 4.4 kb markers. B, RT-PCR of MiRP2 from mRNA isolated from E18, 12 DIV rat primary hippocampal neurons. Numbers indicate corresponding molecular weight marker migration distances in base pairs. Products were amplified by PCR from water control, hippocampal neuron mRNA before RT-PCR, or hippocampal neuron mRNA after RT-PCR. The identity of the 596 bp amplicon was confirmed by sequencing as MiRP2 (M2). C, Anti-MiRP2 antibody immunoblots of rat MiRP2-transfected CHO cell lysate (rMiRP2 CHO), mock-transfected CHO cell lysate (con CHO), or rat brain membranes (rat brain m). D, Anti-Kv2.1 antibody immunoblots of crude rat brain membranes (rat brain m), Kv2.1-transfected CHO cell lysate (Kv2.1 CHO), or immunoprecipitations from rat brain membranes using antibodies raised against Kv2.1 (α-Kv2.1 IP), Kv3.1 (α-Kv3.1 IP), parvalbumin (α-parv IP), or MiRP-2 (α-MiRP2 IP). E, Anti-Kv3.1 antibody immunoblots of crude rat brain membranes (rat brain m), Kv2.1-transfected CHO cell lysate (Kv2.1 CHO), or immunoprecipitations from rat brain membranes using antibodies raised against Kv2.1 (α-Kv2.1 IP), Kv3.1 (α-Kv3.1 IP), parvalbumin (α-parv IP), or MiRP-2 (α-MiRP2 IP).
MiRP2 colocalizes with both Kv2.1 and Kv3.1 subunits in CHO cell plasma membranes
The MiRP2-α subunit interactions were next characterized by heterologous coexpression in CHO cells. MiRP2, tagged with a HA epitope to facilitate efficient immunocolocalization, colocalized both with Kv2.1 and with Kv3.1 subunits when the α-β combinations were cotransfected into CHO cells (Fig. 2). Using immunocytochemistry and fluorescence microscopy, nontransfected CHO cells were shown to have no detectable endogenous levels of either α subunit and no significant labeling with the anti-HA antibody (Fig. 2A,B). Transfected alone, HA-MiRP2 did not localize specifically with the plasma membrane, instead exhibiting a diffuse cytoplasmic distribution as reported previously (Schroeder et al., 2000) (Fig. 2C). However, cotransfection of HA-MiRP2 with Kv2.1 revealed that Kv2.1 rescued MiRP2 plasma membrane expression and that distribution of the two subunits strongly overlapped (Fig. 2D-F). Similarly, Kv3.1 colocalized with MiRP2 in the plasma membrane of cotransfected CHO cells (Fig. 2G-I). The data demonstrate that MiRP2 colocalizes with both Kv2.1 and Kv3.1 in CHO cell plasma membranes.
Figure 2.

MiRP2 colocalizes with heterologously expressed Kv2.1 and Kv3.1 subunits in CHO cell plasma membranes. Fluorescence microscopy of fixed and permeabilized CHO cells, either nontransfected or transiently transfected with plasmids encoding HA-tagged MiRP2 or untagged Kv2.1 or Kv3.1. Cells were stained with monoclonal anti-HA and polyclonal anti-Kv2.1 or polyclonal anti-Kv3.1 primary antibodies, and Alexa Fluor 594-labeled (red) goat anti-rabbit IgG and FITC-labeled (green) goat anti-mouse IgG secondary antibodies. Scale bars, 10 μm. A, Red-green overlay of nontransfected cells stained with anti-HA and anti-Kv2.1 antibodies showing no signal. B, Red-green overlay of nontransfected cells stained with anti-HA and anti-Kv3.1 antibodies showing no signal. C, Red-green overlay of HA-MiRP2-transfected cell stained with anti-HA antibody showing predominantly cytoplasmic distribution of HA-MiRP2 (green) when transfected alone. D-F, HA-MiRP2 and Kv2.1 cotransfected cell stained with anti-HA and anti-Kv2.1 antibodies; D, green signal showing membrane distribution of HA-MiRP2; E, red signal showing membrane distribution of Kv2.1; F, red-green overlay showing colocalization (yellow) of HA-MiRP2 and Kv2.1. G-I, HA-MiRP2 and Kv3.1 cotransfected cell stained with anti-HA and anti-Kv3.1 antibodies; G, green signal showing membrane distribution of HA-MiRP2; H, red signal showing membrane distribution of Kv3.1; I, red-green overlay showing colocalization (yellow) of HA-MiRP2 and Kv3.1.
MiRP2 slows activation and deactivation of heterologously expressed Kv2.1 in CHO cells
MiRP2 was next expressed with either α subunit type in CHO cells, and functional effects were quantified using whole-cell voltage-clamp recording. Untransfected CHO cells showed no significant whole-cell currents, neither did cells transfected with MiRP2 alone (Fig. 3A). Transfection of CHO cells with Kv2.1 alone gave robust, moderately fast-activating and deactivating, very slow-inactivating outward currents at depolarized voltages, as reported previously (Fig. 3A,B). Cotransfection of MiRP2 reduced Kv2.1 current density threefold at positive voltages and slowed activation, quantified below (Fig. 3A,B). Plotting of G/V curves (data not shown) revealed that MiRP2 had no significant effect on the voltage dependence of Kv2.1 activation. Fitting with a Boltzmann function, 1/{1 + exp[(V1/2 - V)/Vs]}, gave V1/2 = 1.6 ± 0.9 mV, Vs = 15.1 ± 0.9 mV (Kv2.1); V1/2 = 2.6 ± 1.5 mV, Vs = 20.5 ± 1.6 mV (MiRP2-Kv2.1). Normalization of the early portions of traces showing activation to peak at 0 mV emphasized that MiRP2 significantly slowed the activation rate of Kv2.1 channels (Fig. 3C). Fitting of activation to peak with a single exponential gave an approximation of the time constant of activation (τ), which was increased threefold to fourfold by MiRP2, depending on voltage (Fig. 3D). This translated into a twofold increase in time to peak at all voltages (Fig. 3E). A better fit of activation rate was achieved using a double exponential function, revealing that MiRP2 slowed the slow component of activation by ∼50%, the fast component threefold, and increased the relative amplitude of the slow component threefold (Fig. 3F). The extent of inactivation of Kv2.1 currents at + 60 mV over a 2 sec period was slightly decreased by MiRP2, from 28.3 ± 2.5% to 24.5 ± 1.3% (data not shown). Coassembly with MiRP2 also slowed deactivation of Kv2.1 channels. Deactivation rate at -30 mV was fitted with a double exponential function, revealing a twofold slowing and a 50% increase in relative amplitude of the slow component of deactivation in complexes formed with MiRP2, and a 40% increase in the τ of the fast component of deactivation (Fig. 3G). Effects of MiRP2 on affinity of Kv2.1 channels for TEA and 4-AP were assessed using repetitive depolarizing pulses. MiRP2 increased sensitivity of Kv2.1 to TEA blockade twofold (Fig. 3H), whereas block by 4-AP was unchanged (Fig. 3I). Previously, an R83H mutation in human MiRP2 was associated with periodic paralysis in man and demonstrated to impair the function of skeletal muscle MiRP2-Kv3.4 channels (Abbott et al., 2001b; Abbott and Goldstein, 2002). Here, we tested the effects of the R83H mutation on MiRP2-Kv2.1 using heterologous coexpression and whole-cell voltage-clamp analysis in CHO cells. Coexpression of R83H-MiRP2 with Kv2.1 (data not shown) gave currents with similar mean current density to wild-type MiRP2-Kv2.1 currents in CHO cells, and fitting of activation and deactivation kinetics with double exponential functions showed that R83H-MiRP2-Kv2.1 channels had similar activation and deactivation properties to those of wild-type MiRP2-Kv2.1 channels. The data indicated that the R83H mutation did not disrupt MiRP2-Kv2.1 channel function, and, therefore, this complex did not provide an additional mechanism for R83H-associated symptoms in periodic paralysis.
Figure 3.

MiRP2 slows and downregulates Kv2.1 currents. A, Exemplar traces showing currents recorded using protocol 1 (inset) in nontransfected CHO cells (untrans) or CHO cells cotransfected with GFP and either MiRP2, Kv2.1 (filled square), or MiRP2 plus Kv2.1 (open square), as indicated. Top center and top right traces, expanded view of first 150 msec of Kv2.1 and MiRP2-Kv2.1 traces, as indicated by dashed lines. B,Mean peak current density for CHO cells expressing Kv2.1 alone (filled squares; n = 19) or MiRP2 and Kv2.1 (open squares; n = 10); protocol as in A. Error bars indicate SEM. The double asterisk indicates significant difference between current densities at all voltages between -20 and +60 mV (unpaired t test;p<0.01). C, Current density-normalized early portion of exemplar Kv2.1 and MiRP2-Kv2.1 traces at 0 mV illustrating slowing of Kv2.1 activation by MiRP2. D, Activation rates of Kv2.1 and MiRP2-Kv2.1 currents at different voltages as in B, fitted with a single exponential function, expressed as τact. Error bars indicate SEM. The double asterisk indicates significant difference between τact at all voltages between -20 and +60 mV (unpaired t test, p < 0.01). E, Time to peak current of Kv2.1 and MiRP2-Kv2.1 currents as in B. Error bars indicate SEM. The double asterisk indicates significant difference between times to reach peak at all voltages between -20 and +60 mV (unpaired t test; p < 0.01). F, Mean activation rates of Kv2.1 and MiRP2-Kv2.1 currents at 0 mV as in B, fitted with a double exponential function, error bars indicate SEM. Left, Mean slow and fast τact components; the double asterisk indicates significant difference between the fast components of τact (unpaired t test; p < 0.01). Right, Mean relative amplitudes of the slow component of τact; the single asterisk indicates significant difference (unpaired t test; p < 0.05). G, Mean deactivation rates of Kv2.1 and MiRP2-Kv2.1 currents at -30 mV as in B, fitted with a double exponential function; error bars indicate SEM. Left, Mean slow and fast τdeact components; the single and double asterisks indicate significant differences between the corresponding components of τdeact depending on the presence of MiRP2 (unpaired t tests; p < 0.05 and p < 0.01, respectively). Right, Mean relative amplitudes of the slow component of τdeact; the double asterisk indicates significant difference (unpaired t test; p < 0.01). H, TEA block of Kv2.1 (solid) versus MiRP2-Kv2.1 (open) currents evaluated using protocol 3 (inset) in the absence and presence of 0-30 mm TEA bath and peak currents recorded at equilibrium. Dose-response curves were fit with a logistic dose-response function: y = A2 + (A1-A2 /1 + (x/x0)p); for Kv2.1 x0 = 11.7 ± 2.7 mm, p = 0.92 ± 0.19; for MiRP2-Kv2.1 x0 = 6.7 ± 0.79 mm, p = 0.92 ± 0.08; n = 5 cells per point. I, 4-AP block of Kv2.1 (solid) versus MiRP2-Kv2.1 (open) currents evaluated using protocol 3 (inset) in the absence and presence of 0-10 mm 4-AP and peak currents recorded at equilibrium. Dose-response curves were fit with a logistic dose-response function: y = A2 + (A1-A2/1 + (x/x0)p); for Kv2.1 x0 = 3.9 ± 0.79 mm, p = 0.68 ± 0.09; for MiRP2-Kv2.1 x0 = 4.2 ± 1.4 mm, p = 0.66 ± 0.14; n = 5 cells per point.
MiRP2 slows activation of heterologously expressed Kv3.1 in CHO cells Effects of MiRP2 on Kv3.1 currents were assessed in similar manner using heterologous expression in CHO cells. Kv3.1 passes ultra-rapidly activating and deactivating delayed rectifier outward potassium currents in physiological potassium solutions on membrane depolarization. Kv3.1 currents also exhibit a small, but significant, degree of decay at more positive voltages that probably represents inactivation of a subset of the channel population, but could equally arise from a voltage- and time-dependent change in the open probability of all channels present. Either way, this inactivation is distinct from the effects of potassium depletion observed for Kv3.1 in restricted compartments such as neuronal spine-like structures (Wang et al., 1998; Macica et al., 2003). Kv3.1 inactivation manifests as a current “spike” at the onset of current activation, both in electrophysiological recordings of cloned Kv3.1 currents and also in computer simulations of Kv3.1 current; after this spike, little inactivation is observed (Wang et al., 1998; Macica et al., 2003). MiRP2 reduced Kv3.1 current density by 30% and, more significantly, slowed Kv3.1 activation rate at all activating potentials (Fig. 4A,B). At more depolarized potentials, this was apparent as a loss of the partial inactivation spike (Fig. 4C). MiRP2 had no significant effects on the voltage dependence of Kv3.1 activation; fitting G/V curves (data not shown) with a Boltzmann function, 1/{1 + exp[(V1/2 - V)/Vs]}, gave V1/2 = 10.3 ± 0.8 mV, Vs = 15.7 ± 0.7 mV (Kv3.1); V1/2 = 13.4 ± 1.0 mV, Vs = 15.6 ± 0.9 mV (MiRP2-Kv3.1). Fitting of activation rate to a single exponential function indicated a 50-100% increase in τ of activation depending on voltage (Fig. 4D). Time to peak was greatly increased by MiRP2, partly because of loss of the initial inactivation spike, from 3.1 ± 0.9 msec (Kv3.1) to 61.6 ± 15.1 msec (MiRP2-Kv3.1) at + 60 mV (Fig. 4E). This loss of inactivation was quantified by comparing peak current within the first 100 msec after activation to current recorded 100 msec after activation. This showed a roughly twofold decrease in inactivation over the first 100 msec (Fig. 4F). Fitting of activation kinetics at 0 mV with a double exponential function showed a doubling of the τ of both the fast and slow time components and a fourfold increase in the relative amplitude of the slow component of activation, again reflecting, in particular, the loss of the Kv3.1 early inactivation at more positive potentials (Fig. 4G). In contrast, MiRP2 caused no significant changes inτ or amplitude of either component of deactivation (Fig. 4H). MiRP2 increased the TEA affinity of Kv3.1 twofold (Fig. 4I) but had no statistically significant effect on 4-AP affinity (Fig. 4J). As observed for Kv2.1, coexpression of R83HMiRP2 and Kv3.1 gave currents with a mean activation rate and current density not significantly different from wild-type MiRP2-Kv3.1 currents, indicating no significant aberrant effects of the R83H mutation in MiRP2-Kv3.1 channels (data not shown).
Figure 4.

MiRP2 downregulates and reduces inactivation of Kv3.1 currents. A, Bottom, Exemplar traces showing currents recorded using protocol 2 (inset) in CHO cells cotransfected with GFP and MiRP2, Kv3.1 (filled square), or MiRP2 plus Kv3.1 (open square), as indicated. Top, Expanded view of first 40 msec of Kv3.1 and MiRP2-Kv3.1 traces as indicated by dashed lines. B, Mean peak current density for CHO cells expressing Kv3.1 alone (filled squares; n = 31) or MiRP2 plus Kv3.1 (open squares; n = 32); protocol as in A. The error bars indicate SEM. The double asterisk indicates significant difference between current densities at all voltages between -10 and +60 mV (unpaired t test; p < 0.01). C, Current density-normalized early portion of exemplar Kv3.1 and MiRP2-Kv3.1 traces at 0 mV illustrating slowing of Kv3.1 activation largely by removal of the current inactivation spike by MiRP2. D, Activation rates of Kv3.1 and MiRP2-Kv3.1 currents at different voltages as in B, fitted with a single exponential function, expressed as τact. Error bars indicate SEM. The double asterisk indicates significant difference between τact at all voltages between -20 and +60 mV (unpaired t test; p < 0.01).E, Time to peak current of Kv3.1 and MiRP2-Kv3.1 currents as in B. Error bars indicate SEM. The asterisk indicates significant difference between times to reach peak at all voltages between -20 and +60 mV (unpaired t test; p < 0.05). F, Effects of MiRP2 on early inactivation of Kv3.1 currents, assessed by comparing peak current in first 100 msec of activation to current at exactly 100 msec after activation. The asterisk indicates significant difference between respective values at voltages between 30 and 60 mV (unpaired t test; p < 0.05). G, Mean activation rates of Kv3.1 and MiRP2-Kv3.1 currents at 0 mV as in B, fitted with a double exponential function. Error bars indicate SEM. Left, Mean slow and fast τact components. The double asterisk indicates significant difference between the corresponding components of τact depending on the presence of MiRP2 (unpaired t test; p < 0.01). Right, Mean relative amplitudes of the slow component of τact. The double asterisk indicates significant difference (unpaired t test; p < 0.01). H, Mean deactivation rates of Kv3.1 and MiRP2-Kv3.1 currents at -30 mV as in B, fitted with a double exponential function. Error bars indicate SEM. Left, Mean slow and fast τdeact components. Right, Mean relative amplitudes of the slow component of τdeact. No significant differences were observed between Kv3.1 and MiRP2-Kv3.1 deactivation rates. I, TEA block of Kv3.1 (solid) versus MiRP2-Kv3.1 (open) currents evaluated using protocol 3 (inset) in the absence and presence of 0-10 mm TEA bath and peak currents recorded at equilibrium. Dose-response curves were fit with a logistic dose-response function: y = A2 + (A1-A2/1 + (x/x0)p); for Kv3.1 x0 = 471 ± 98 μm, p = 0.76 ± 0.08; for MiRP2-Kv3.1 x0 = 254 ± 42 μm, p = 0.86 ± 0.09; n = 4-6 cells per point. J, 4-AP block of Kv3.1 (solid) versus MiRP2-Kv3.1 (open) currents evaluated using protocol 3 (inset) in the absence and presence of 0-1 mm 4-AP and peak currents recorded at equilibrium. Dose-response curves were fit with a logistic dose-response function: y = A2 + (A1-A2/1 + (x/x0)p); for Kv3.1 x0 = 58 ± 0.9 μm, p = 0.8 ± 0.01; for MiRP2-Kv3.1 x0 = 43 ± 6 μm, p = 0.8 ± 0.06; n = 4-6 cells per point.
MiRP2 colocalizes with native Kv2.1 and Kv3.1 subunits in PC12 cell plasma membranes
The PC12 pheochromocytoma cell line, established from a rat adrenal tumor, is considered a suitable model system for some aspects of neuronal physiology (Tischler, 2002), and previous reports indicate that Kv2.1 and Kv3.1 contribute in large part to endogenous PC12 delayed rectifier potassium current, although contributions from Kv1.2, Kv1.3 and Kv3.2 channels have also been reported (Conforti and Millhorn, 1997). To initially validate the PC12 cell as a system for studying MiRP2-α subunit interactions, we performed immunocytochemistry and fluorescence microscopy on untransfected and HA-MiRP2-transfected PC12 cells (Fig. 5). Endogenous Kv2.1 exhibited punctate staining in untransfected PC12 cell plasma membranes (Fig. 5A, arrowhead and inset). Transfected HA-MiRP2 colocalized with plasma membrane Kv2.1, indicating that MiRP2-Kv2.1 complexes can form in PC12 cells (Fig. 5B, arrowhead and inset). Kv3.1 was also natively expressed in PC12 cell membranes, showing both punctate and diffuse staining (Fig. 5C, arrowhead and inset), and also colocalized extensively with transfected HA-MiRP2 in some cells (Fig. 5D). The data indicate that MiRP2 can coassemble with both Kv3.1 and Kv2.1 in the plasma membrane of PC12 cells.
Figure 5.
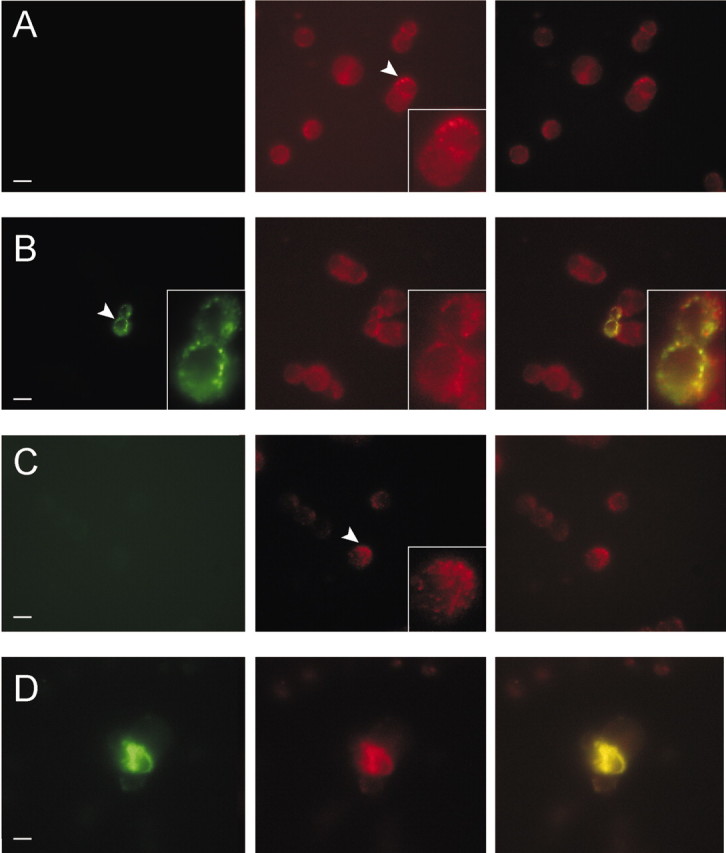
MiRP2 colocalizes with native Kv2.1 and Kv3.1 subunits in PC12 cell plasma membranes. Fluorescence microscopy of fixed and permeabilized PC12 cells, either nontransfected or transiently transfected with a plasmid encoding HA-tagged MiRP2. Cells were stained with monoclonal anti-HA, polyclonal anti-Kv2.1, or polyclonal anti-Kv3.1 primary antibodies, Alexa Fluor 594-labeled (red) goat anti-rabbit IgG and FITC-labeled (green) goat anti-mouse IgG secondary antibodies. Scale bars, 10 μm. A, Nontransfected PC12 cells stained with anti-HA and anti-Kv2.1 antibodies showing: left, green channel, no HA staining; center, red channel, punctate native Kv2.1 staining; right, red-green overlay. B, HA-MiRP2-transfected PC12 cells stained with anti-HA and anti-Kv2.1 antibodies showing: left, green channel, punctate HA-MiRP2 staining; center, red channel, punctate native Kv2.1 staining; right, red-green overlay showing HA-MiRP2/native Kv2.1 colocalization (yellow). C, Nontransfected PC12 cells stained with anti-HA and anti-Kv3.1 antibodies showing: left, green channel, no HA staining; center, red channel, punctate native Kv3.1 staining; right, red-green overlay. D, HA-MiRP2-transfected PC12 cells stained with anti-HA and anti-Kv3.1 antibodies showing: left, green channel, HA-MiRP2 staining; center, red channel, native Kv3.1 staining; right, red-green overlay showing HA-MiRP2/native Kv3.1 colocalization (yellow).
Native MiRP2 slows and downregulates native delayed rectifier K+current in PC12 cells
The presence of Kv2.1 and Kv3.1 in PC12 cells was further confirmed by RT-PCR from PC12 cell lysate mRNA (Fig. 6A). Native expression of rat MiRP2 in PC12 cells was also demonstrated using RT-PCR (Fig. 6B). To assess the role of native MiRP2 in generating delayed rectifier current diversity, endogenous MiRP2 expression levels were reduced by RNA interference (RNAi) post-transcriptional gene silencing, or increased by transfection with rat MiRP2 cDNA. RT-PCR from mRNA extracted from transfected and nontransfected PC12 cells produced cDNA that was first normalized to β-actin levels using β-actin-specific primers (Fig. 6B, top). Normalized samples were next amplified using MiRP2-specific primers, demonstrating an increase in MiRP2 transcript levels by MiRP2 cDNA transfection and efficient gene silencing of native MiRP2 by RNAi (Fig. 6B, bottom). Optical densities of MiRP2 bands indicated a 10-fold higher signal in MiRP2 cDNA transfected cell lysates compared with nontransfected cells, and the MiRP2 band was completely absent from MiRP2 siRNA-transfected PC12 cells, demonstrating efficient transfection, RNAi gene silencing, and cDNA expression. Functional effects of manipulating native MiRP2 expression levels were assessed using whole-cell voltage clamp. Nontransfected PC12 cells exhibited robust outward potassium currents as described previously, dominated by delayed rectifiers rather than by A-type currents. Transfection with a scrambled control siRNA oligo had no functional effects (Fig. 6C,D), whereas gene silencing of native MiRP2 by transfection with MiRP2 siRNA increased native delayed rectifier current (by ∼50%). Conversely, transfection with MiRP2 cDNA downregulated native delayed rectifier current (by ∼40%). The extent of delayed rectifier current inactivation at +60 mV was increased by MiRP2 gene silencing and decreased by an increase in MiRP2 expression (Fig. 6E). Figure 6F shows a difference current trace produced by subtraction of averaged MiRP2 cDNA PC12 traces from averaged MiRP2 RNAi PC12 traces. Activation kinetics at 0 mV were fit with a double exponential function, revealing that although transfection of scrambled control siRNA or rMiRP2 cDNA had no significant effects, rMiRP2 gene silencing accelerated both components of activation twofold (Fig. 6G). Similarly, whereas neither scrambled control siRNA or MiRP2 cDNA affected deactivation kinetics of PC12 delayed rectifier current, rMiRP2 gene silencing accelerated the slow component of deactivation twofold (Fig. 6H). Thus, overall effects of manipulating the expression level of native MiRP2 on PC12 current density and kinetics were consistent with a role for MiRP2 in modulating native Kv2.1 and Kv3.1 currents in this cell line.
Figure 6.

Native MiRP2 slows and downregulates native delayed rectifier currents in PC12 cells. A, RT-PCR of Kv2.1 (top) and Kv3.1 (bottom) from mRNA isolated from PC12 cells. Lanes indicate amplification by PCR from: lane 1, water control; lane 2, mRNA from PC12 cells after RT-PCR; lane 3, mRNA from PC12 cells before RT-PCR; lane 4, plasmid DNA containing Kv2.1 (top) or Kv3.1 (bottom); lane 5, marker. Expected product sizes for gene fragments, indicated by labeled lines, were 557 bp for Kv2.1 and 522 bp for Kv3.1. B, RNAi gene silencing of endogenous MiRP2 assessed by semiquantitative PCR of products from RT-PCR of PC12 cell mRNA. Top gel, Normalization of RT-PCR products by titration of amplified β-actin; lanes show approximately equal β-actin band intensities. Bottom gel, RT-PCR for rMiRP2 using normalized samples. Top and bottom gels, Lane 1, Marker; lane 2, water control; lane 3, nontransfected PC12 cell RT-PCR product; lane 4, MiRP2 siRNA-transfected PC12 cell RT-PCR product; lane 5, MiRP2 cDNA-transfected PC12 cell RT-PCR product. Expected product sizes for gene fragments, indicated by labeled lines, were 450 bp for actin, and 596 bp for MiRP2. C, Exemplar traces showing potassium currents recorded using protocol 4 (inset) in nontransfected PC12 cells (black circle, untrans) or PC12 cells transfected with MiRP2 cDNA (open circle, M2 cDNA), MiRP2 siRNA (gray square, M2 siRNA), or scrambled control siRNA (black square, con siRNA). Cotransfection with blank plasmid was used to keep total transfected nucleic acid concentration equal. D, Mean peak current for nontransfected PC12 cells (black circle; n = 39) or PC12 cells transfected with MiRP2 cDNA (open circle; n = 16), MiRP2 siRNA (gray square; n = 14), or scrambled control siRNA (black square; n = 16); protocol as in C. Error bars indicate SEM. The double asterisks indicate significant differences between current densities of MiRP2 cDNA transfected versus MiRP2 siRNA or nontransfected cells at all positive voltages (Mann-Whitney rank sum test; p < 0.001). The single asterisk indicates significant difference between current densities of MiRP2 siRNA transfected versus nontransfected cells at voltages between +30 and +60 mV (Mann-Whitney rank sum test; p < 0.05). E, Mean inactivation of PC12 cell outward potassium currents at +60 mV expressed as percentage inactivation over 1 sec, in nontransfected (untrans) and transfected PC12 cells as indicated, calculated from the same traces as in D. The double asterisk indicates significant difference between mean inactivation of MiRP2 cDNA transfected versus MiRP2 siRNA-transfected cells (unpaired t test; p < 0.001). F, Trace resulting from subtraction of averaged +60 mV trace for MiRP2 cDNA-transfected PC12 cells from averaged +60 mV trace for MiRP2 siRNA-transfected PC12 cells; protocol (inset) as in C. G, Mean activation rates of nontransfected (untrans) and transfected PC12 cells as indicated, calculated from the same recordings as in D. Activation traces at 0 mV were fitted with a double exponential function yielding fast and slow τact components. Error bars indicate SEM. A single asterisk indicates a significant difference between the slow components of τact of PC12 cells transfected with control siRNA and those transfected with MiRP2 siRNA (unpaired t test; p < 0.05). Relative amplitudes of the slow components of activation were not significantly different and were 0.63 ± 0.05 (nontransfected), 0.54 ± 0.1 (MiRP2 cDNA), 0.58 ± 0.08 (MiRP2 siRNA), and 0.55 ± 0.1 (scrambled control siRNA). H, Mean deactivation rates of nontransfected (untrans) and transfected PC12 cells as indicated, calculated from the same recordings as in D. Deactivation traces at -30 mV were fitted with a double exponential function yielding fast and slow τdeact components. Error bars indicate SEM. Relative amplitudes of the slow components of deactivation were not significantly different and were 0.31 ± 0.03 (nontransfected), 0.25 ± 0.09 (MiRP2 cDNA), 0.25 ± 0.09 (MiRP2 siRNA), and 0.38 ± 0.06 (scrambled control siRNA).
Native MiRP2 governs the effects of potassium channel blockers in PC12 cells
Outward potassium currents at positive voltages and deactivating tail currents at -30 mV (arrow) in PC12 cells exhibited both TEA- and 4-AP-mediated blockade (Fig. 7A-C), in the sensitivity range shown for Kv2.1 and Kv3.1 currents with or without MiRP2 (Figs. 3, 4). Sensitivity to 4-AP of outward potassium currents was not significantly altered either by MiRP2 RNAi or by introduction of MiRP2 cDNA to PC12 cells (Fig. 7B). Sensitivity of outward potassium currents to inhibition by TEA was decreased twofold by RNAi post-transcriptional gene silencing of native MiRP2 in PC12 cells (Fig. 7C). These effects are consistent with those observed in the CHO cell system for Kv2.1 and Kv3.1 channels, depending on coexpression with MiRP2, again supporting a role for native MiRP2 in modulating these channels in PC12 cells.
Figure 7.

Relationship between TEA and 4-AP sensitivities, activation kinetics, and MiRP2 expression in PC12 cells. A, Exemplar outward potassium current traces recorded using protocol 6 (inset) during bath application of 0-10 mm 4-AP block (as indicated) of whole-cell outward potassium currents at 0 mV in nontransfected PC12 cells and PC12 cells transfected with MiRP2 cDNA or MiRP2 siRNA, as indicated; 0 mV portion of trace only is shown here. Arrows highlight block of tail current in all cases. Calibration represents current (50 pA, nontransfected; 15 pA, MiRP2 cDNA; 25 pA, MiRP2 siRNA) and time (200 msec). B, 4-AP inhibition of outward potassium currents in untransfected PC12 cells (black circles; n = 12) and PC12 cells transfected with MiRP2 siRNA (white squares; n = 9) or MiRP2 cDNA (white circles; n = 10). PC12 cells were repetitively pulsed using protocol 6 in the absence and presence of 0-10 mm 4-AP and isochronal (450 msec after activation) currents recorded at equilibrium. Dose-response curves were fit with a Boltzmann function. IC50 values were: 440 ± 71 μm, slope of 0.43 ± 0.03 (nontransfected); 291 ± 97μm, slope of 0.42 ± 0.05 (MiRP2 siRNA transfected); 307 ± 115 μm, slope of 0.36 ± 0.06 (MiRP2 cDNA transfected). Sensitivity of PC12 currents to inhibition by 4-AP was not significantly altered by transfections, as assessed by repeated measures ANOVA; p > 0.05. C, TEA inhibition of outward potassium currents in untransfected PC12 cells (black circles; n = 22) or PC12 cells transfected with MiRP2 siRNA (white squares; n = 18). PC12 cells were repetitively pulsed using protocol 6 in the absence and presence of 0-10 mm TEA bath and isochronal (450 msec after activation) currents recorded at equilibrium. Dose-response curves were fit with a Boltzmann function. IC50 values were: 420 ± 54 μm, slope of 0.52 ± 0.03 (nontransfected); 765 ± 109 μm, slope of 0.55 ± 0.04 (MiRP2 siRNA transfected). The asterisks indicate that a significant shift in the sensitivity of PC12 currents to inhibition by TEA was significantly affected by transfection of MiRP2 siRNA, as assessed by repeated measures ANOVA; p < 0.05. D, Mean activation rates of potassium currents in nontransfected (Con; n = 8-11) and MiRP2 siRNA-transfected (M2-siRNA; n = 10-18) PC12 cells equilibrated with bath concentrations of 10 mm 4-AP or TEA as indicated, calculated from recordings similar to those in A. Activation traces at 0 mV were fitted with a single exponential function yielding a τact value. Error bars indicate SEM. The asterisks indicate significant differences between the τact values of nontransfected or MiRP2 siRNA-transfected PC12 cells in the presence of either drug and between the τact values of similarly transfected cells, depending on the drug applied (unpaired t test; p < 0.05).
PC12 cells express MiRP2, Kv2.1, and Kv3.1 subunits, but also Kv1.2, Kv1.3, and Kv3.2 delayed rectifier α subunits (Conforti and Millhorn, 1997). To further investigate specific roles for MiRP2 in PC12 cells, kinetics of activation were also measured in TEA- and 4-AP-exposed PC12 cells, either nontransfected or MiRP2 siRNA transfected (Fig. 7D). First, control and siRNA-transfected cells were equilibrated in 10 mm 4-AP, a concentration sufficient to efficiently suppress Kv1.2, Kv1.3, Kv3.1, and Kv3.2 channels, while leaving ∼ 40% of Kv2.1-containing current (Baranauskas et al., 1999; Coetzee et al., 1999). Under these conditions, the activation rate of native Kv current in MiRP2 siRNA-transfected PC12 cells (fitted with a single exponential function and expressed as τact) was twofold faster than in untransfected PC12 cells, consistent with a large proportion of the effects of MiRP2 on activation kinetics being attributable to modulation of Kv2.1 channels. Other batches of control and MiRP2 siRNA-transfected PC12 cells were equilibrated in 10 mm bath TEA. This concentration of TEA leaves >40% of Kv1.2, Kv1.3, and Kv2.1 current intact but very efficiently blocks Kv3.1 and Kv3.2 channels (Baranauskas et al., 1999; Coetzee et al., 1999). In these conditions, the twofold higher activation rate in MiRP2 siRNA-transfected PC12 cell currents compared with nontransfected PC12 cell currents was preserved, but now current activation rates were twofold faster than those of their corresponding cell type bathed in 10 mm 4-AP (Fig. 7D). This argues for effects of MiRP2 on activation kinetics being caused, in large part, by modulation of Kv2.1 and against effects on Kv1.2 and Kv1.3 (and, interestingly, Kv3 channels; see Discussion), because the twofold acceleration with MiRP2 siRNA was preserved but not increased. Overall, mean currents were faster activating in TEA compared with in 4-AP regardless of transfection, probably because of the contribution of fast, relatively TEA-insensitive Kv1.2 and Kv1.3 in TEA-bathed cells, regardless of MiRP2.
MiRP2 colocalizes with Kv2.1 but not Kv3.1 subunits in hippocampal neurons
HA-MiRP2 was introduced into E18, 12-14 d in vitro (DIV) primary rat hippocampal neurons by transfection, to investigate colocalization of MiRP2 with endogenous α subunits in a neuronal environment. After fixing and staining with specific monoclonal antibodies against HA or dendritic marker MAP2 (Peng et al., 1986; Kleiman et al., 1990) in combination with polyclonal antibodies against Kv2.1 or Kv3.1, cells were stained with appropriate fluorescent secondary antibodies and visualized using fluorescence microscopy (Fig. 8). In nontransfected neurons, endogenous Kv2.1 exhibited typical clustering around neuronal soma and proximal dendritic areas, and MAP2 strongly stained dendrites (Fig. 8A). Endogenous Kv3.1 showed finer punctate or generalized somatic staining (Fig. 8B, arrowheads). In nontransfected neurons double-labeled with anti-HA and anti-Kv2.1 antibodies, anti-Kv2.1 again showed distinct punctate somatic Kv2.1 staining (red), with no anti-HA staining (green), indicating the suitability of the anti-HA antibody for tracking transfected HA-MiRP2 (Fig. 8C). After transfection of neurons with HA-MiRP2, anti-HA antibody revealed specific staining of transfected HA-MiRP2 in both somatic membrane and dendrites (Fig. 8D, bottom inset). The HA-MiRP2 colocalized extensively with endogenous Kv2.1, predominantly in somatic membrane (Fig. 8D, arrowhead) but also in some dendrites (Fig. 8D, arrow). In contrast, HA-MiRP2 staining did not overlap significantly with that of endogenous Kv3.1 despite efficient transfection (Fig. 8E). HA-MiRP2 often adopted a widespread punctate distribution pattern that did not show significant colocalization with endogenous Kv3.1, and in the rare cases where this distribution overlapped with that of Kv3.1, it appeared coincidental (Fig. 8F, arrowhead). The data indicate that MiRP2 colocalizes with endogenous Kv2.1, but probably not Kv3.1, in hippocampal neuronal somatic membranes.
Figure 8.

MiRP2 colocalizes with Kv2.1 but not Kv3.1 subunits in rat primary hippocampal neurons. Fluorescence microscopy of fixed and permeabilized E18, 12-14 DIV rat primary hippocampal neurons cells, either nontransfected or transiently transfected with a plasmid encoding HA-tagged MiRP2. Cells were stained with monoclonal anti-HA, monoclonal anti-MAP2, polyclonal anti-Kv2.1, or polyclonal anti-Kv3.1 primary antibodies, Alexa Fluor 594-labeled (red) goat anti-rabbit IgG and FITC-labeled (green) goat anti-mouse IgG secondary antibodies. Scale bars, 10 μm. A, Immunostaining of native Kv2.1 (red; arrowhead) and native MAP2 (green) in nontransfected E18, 14 DIV rat primary hippocampal neurons. Left, Green-red overlay; top inset, red only; bottom inset, green only. B, Immunostaining of diffusely (left arrowhead) and punctately (right arrowhead) distributed native Kv3.1 (red) and native MAP2 (green) in nontransfected E18, 14 DIV rat primary hippocampal neurons. Left, Green-red overlay; top inset, red only; bottom inset, green only. C, Immunostaining with anti-Kv2.1 (red) and anti-HA antibodies (green) in the soma of a representative nontransfected E18, 14 DIV rat primary hippocampal neuron, showing lack of any anti-HA signal but punctate staining of endogenous Kv2.1 (arrowhead). Left, Green-red overlay; top inset, red only; bottom inset, green only. D, Immunostaining with anti-Kv2.1 (red) and anti-HA antibodies (green) in the soma of a representative HA-MiRP2-transfected E18, 14 DIV rat primary hippocampal neuron, showing colocalization (yellow) of HA-MiRP2 and endogenous Kv2.1 (arrowhead) in somatic plasma membrane and dendrites (arrow). Left, Green-red overlay; top inset, red only; bottom inset, green only. E, Immunostaining with anti-Kv3.1 (red) and anti-HA antibodies (green) in the soma of a representative HA-MiRP2-transfected E18, 14 DIV rat primary hippocampal neuron, showing efficient transfection but lack of colocalization (yellow) of HA-MiRP2 and endogenous neuronal Kv3.1. Left, Green-red overlay; top inset, red only; bottom inset, green only. F, Close-up showing immunostaining with anti-Kv3.1 (red) and anti-HA antibodies (green) in the soma of a representative HA-MiRP2-transfected E18, 14 DIV rat primary hippocampal neuron. The panel illustrates efficient transfection and punctate distribution of HA-MiRP2 and native Kv3.1 but lack of colocalization (yellow) of HA-MiRP2 and endogenous neuronal Kv3.1. Occasional spots of yellow (arrowhead) appear to be rare and possibly coincidental overlap. Left, Green-red overlay; top inset, red only; bottom inset, green only.
MiRP2 slows and downregulates native delayed rectifier K+ currents in hippocampal neurons
Because transfection of HA-MiRP2 into rat primary hippocampal neurons was readily demonstrable (Fig. 8), neurons were transfected with rat MiRP2 for electrophysiological analysis. As observed for PC12 cells, transfection with rat MiRP2 downregulated native delayed rectifier potassium current, by ∼ 35% (Fig. 9A,B). A close-up of deactivation from averaged traces of each group clearly shows significant slowing in deactivation rate in the MiRP2-transfected neurons, and subtraction of averaged transfected traces from averaged nontransfected traces produces a rapid-deactivating difference current (Fig. 9C). Although interference from A-type currents was evident, particularly at more negative voltages, an approximation of activation rates across the voltage range was acquired by plotting time to peak. MiRP2 transfection did not significantly alter time to peak at any voltages tested (Fig. 9D). This contrasts with results obtained using CHO cells, and potential reasons for this difference are addressed below (see Discussion). A deactivation rate at -30 mV was measured because it was likely to contain the least contamination from A-type (fast-inactivating) potassium currents known to be expressed in hippocampal neurons. Fitting of deactivation rates with a double exponential function revealed that the τ of the slow component of deactivation doubled, the τ of the fast component increased by 50%, and the relative amplitude of the slow component of deactivation roughly doubled (Fig. 9E). Effects on deactivation were, thus, quantitatively similar to those observed for MiRP2 and Kv2.1 in CHO cells.
Figure 9.

MiRP2 slows and downregulates native delayed rectifier currents in primary hippocampal neurons. A, Exemplar traces showing currents recorded using protocol 5 (inset) in nontransfected (untrans) or MiRP2-transfected (+M2) E18, 13 DIV rat primary hippocampal neurons. B, Mean peak current density for nontransfected (solid squares; n = 14) or MiRP2-transfected (open squares; n = 15) neurons; protocol as in A. Error bars indicate SEM. The asterisks denote significant difference between raw current magnitudes at voltages indicated (unpaired t test; *p < 0.05; **p < 0.01). C, Top trace, Trace resulting from subtraction of averaged +60 mV trace for MiRP2-transfected neurons from averaged +60 mV trace from nontransfected neurons; protocol as in A. The inset with dashed lines indicates corresponding points on current trace. Bottom trace, Current-normalized first 300 msec of -30 mV tail pulse from representative nontransfected (untrans) and MiRP2-transfected (+M2) neurons, showing slowing of deactivation by MiRP2. D, Time to peak current for nontransfected (solid squares; n = 14) or MiRP2-transfected (open squares; n = 15) neurons; protocol as in A. Error bars indicate SEM. Differences were not statistically significant (p > 0.05; unpaired t test). E, Mean deactivation rates at -30 mV for nontransfected (n = 14) or MiRP2-transfected (n = 15) neurons as indicated; protocol as in A. Error bars indicate SEM. Deactivation was fitted with a double exponential function. Left, Mean slow and fast τdeact components. The single asterisk indicates a significant difference between the slow components of τdeact, depending on transfection with MiRP2 (unpaired t test; p < 0.05). Inset, Mean relative amplitudes of the slow component of τdeact. The single asterisk indicates significant difference (unpaired t test; p < 0.05).
MiRP2 broadens action potentials and lowers firing frequency in computer simulations
Previously, Macica et al. (2003) used computer simulations to model the effects of a PKC phosphorylation-induced 33% reduction of Kv3.1 conductance on the firing properties of fast-spiking neurons of the MNTB. Taking a similar approach to simulate the effects of MiRP2 interaction on the ability of Kv3.1 to sustain rapid neuronal firing, we first adapted the model of Macica et al. (2003) to fit our own experimental data for currents recorded from Kv3.1 alone in CHO cells. Iterative alteration of gating parameters from our model for Kv3.1 yielded a second model that recapitulated the properties of MiRP2-Kv3.1 currents recorded in CHO cells. The responses to a single-step current injection, or to high-frequency stimulation, were simulated in model neurons incorporating Kv3.1 or MiRP2-Kv3.1 currents. MiRP2-Kv3.1 currents were simulated with or without the conductance drop to isolate the effects of the slower gating of MiRP2-Kv3.1 current. In response to a step current injection of 0.5 nA for 250 msec, 150 nS Kv3.1 alone currents sustained rapid firing whereas MiRP2-Kv3.1 currents did not, either at 150 nS or 100 nS, failure being defined as inability to reach 0 mV. Effects of the 100 nS MiRP2-Kv3.1 model were particularly marked (Fig. 10A). During stimulation at 100 Hz with 1.4 nA, 0.25 msec current injections, two morphological changes were apparent on incorporation of MiRP2 gating changes without a drop in conductance: action potentials were broader and showed less of an undershoot than those in model neurons with Kv3.1 alone (Fig. 10B). Additional incorporation of a conductance drop into the simulation had no further effects. As stimulation frequency was increased, 150 nS MiRP2-Kv3.1 neurons became incapable of sustaining firing above 200 Hz, whereas 150 nS Kv3.1 alone neurons sustained 300 Hz firing but failed at 350 Hz (Fig. 10B). Again, incorporation of lower conductance to the slower gating of MiRP2-Kv3.1 currents had no additional effects.
Figure 10.

MiRP2 broadens action potentials and lowers firing frequency in computer simulations. A, Membrane potentials in model neurons expressing 150 nS conductance Kv3.1, 150 nS conductance MiRP2/Kv3.1, or 100 nS MiRP2/Kv3.1 as indicated, during a simulated current injection of 0.05 nA for 250 msec. To the right of each train is an expanded picture of the final spike of the train. Failure to reach 0 mV is indicated by a line labeled “failure.” B, Membrane potentials in model neurons expressing 150 nS conductance Kv3.1, 150 nS conductance MiRP2/Kv3.1, or 100 nS MiRP2/Kv3.1 as indicated, during simulated current injections of 1.4 nA for 0.25 msec at frequencies or 100, 200, 300, and 350 Hz, as indicated. To the right of each train is an expanded picture of the final one to two spikes of the train. Failure to reach 0 mV is indicated by a line labeled “failure.” The asterisk indicates one example of undershoot in a model neuron expressing Kv3.1 alone.
Discussion
Research into MiRP physiology has, largely for historical reasons, focused primarily on mammalian heart and, more recently, gastrointestinal tract and skeletal muscle (Takumi et al., 1988; Abbott et al., 1999, 2001b; Schroeder et al., 2000; Sesti et al., 2000; Yu et al., 2001; Zhang et al., 2001; Warth et al., 2002). Earlier this year, Bianchi et al. (2003) discovered a MiRP ortholog that contributes to neurosensory function in C. elegans. Here, we provide molecular biological, biochemical, and electrophysiological evidence supporting a role for MiRPs in mammalian brain.
MiRPs: substrates for global K+ current diversity
Since the finding that MinK-KCNQ1 complexes form cardiac IKs (Barhanin et al., 1996; Sanguinetti et al., 1996), the concept that a small subset of currents is formed by rigid, monogamous MiRP-α subunit marriages has been gradually eroded. MinK also modulates HERG, the α subunit behind cardiac IKr (McDonald et al., 1997); HERG is also modulated by MiRP1 and MiRP2 (Abbott et al., 1999; Schroeder et al., 2000). KCNQ1 can be modulated by MiRPs 1-4 (Schroeder et al., 2000; Tinel et al., 2000; Angelo et al., 2002; Grunnet et al., 2002). MiRP1 has also been shown to modulate Kv4.2 and HCN1, cardiac Ito and pacemaker channels, respectively (Yu et al., 2001; Zhang et al., 2001). What is clear is that MiRPS are pluripotent modulators of Kv channel activity, not adhering to traditional intra-subfamily boundaries as is thought the case for other known β subunits, Kvβ subfamilies, KChIPs, and DPPX (England et al., 1995; Yu et al., 2001; Nadal et al., 2003). In vivo, this MiRP promiscuity potentially provides an energetically favorable mechanism for generating a broad spectrum of current phenotypes that can be readily modified in response to developmental factors, cell status, and incoming electrical signals. The debate continues, however, on whether these partnerships are physiologically significant, or alternatively that many of these interactions are simply artifacts of heterologous systems (Abbott et al., 1999, 2001a; Tinel et al., 2000; Franco et al., 2001; Mazhari et al., 2001; Yu et al., 2001; Zhang et al., 2001; Anantharam et al., 2003). Here, examining a potential neuronal role for mammalian MiRPs, we stressed physiological relevance rather than heterologous screening by beginning with native coimmunoprecipitation, as was used recently in identification of the heteromultimeric basis of neuronal IA channels (Nadal et al., 2003) and by Finley et al. (2002) in demonstrating for the first time native formation of cardiac MinK-KCNQ1 and MinK-HERG complexes, using equine heart tissue. This approach has the advantage that not only can novel interactions be discovered, but physiological relevance is implied by their purification from native tissue. Our data suggest that neurons, like myocytes, use MiRPs to amplify current diversity; the crucial questions now for both cell types are when and where these interactions occur and what factors dictate the decision to interact with a particular MiRP, or to not interact with any.
Cell-specific MiRP2-α subunit interaction
Because MiRP2, Kv2.1, and perhaps Kv3.1 are expressed in cardiac tissue at least in some species (Dixon and McKinnon, 1994; Yue et al., 2000; Franco et al., 2001), discovery of these new interactions may lead to a reexamination of cardiac currents correlated to these α subunits, albeit with the stance that co-assembly in brain does not necessarily suggest co-assembly in the heart. Indeed, our data suggest that interaction within the brain is specific to region or cell type. Both MiRP2-Kv2.1 and MiRP2-Kv3.1 complexes seemed to exist in rat brain membranes, yet whereas MiRP2-Kv2.1 channels could form in E18 hippocampal neurons from rat, MiRP2-Kv3.1 channels could not, even when MiRP2 was artificially introduced. In contrast, both complexes formed in CHO cells and in PC12 cells, when MiRP2 was added artificially; but again, pharmacological evidence suggested that native MiRP2 did not co-assemble with Kv3.1 in the PC12 system. The molecular correlates that control spatial and temporal assembly of particular MiRP-α subunit complexes have yet to be determined. In murine heart, differentiation of expression of MiRPs against a stable α subunit expression background has been hypothesized as a mechanism for dynamic regulation of current properties (Franco et al., 2001). Here, we clearly show that even when two “able” interactors are expressed in the same cell (MiRP2 and Kv3.1 in some hippocampal neurons), functional co-assembly is not guaranteed, offering yet another mechanism for diversity and dynamic regulation.
Potential roles for MiRP2-α subunit complexes in brain
The lack of MiRP2-Kv3.1 colocalization in hippocampal neurons is perhaps not surprising. Kv3 subfamily delayed rectifier α subunits are uniquely specialized to facilitate fast spiking in neurons, by virtue of an extremely positive voltage dependence of activation, high current density within fast-spiking neurons, and ultra-rapid activation and deactivation kinetics. In fact, the properties of Kv3 currents are reportedly highly specifically optimized for high-frequency repetitive activity in the hippocampus (Lien and Jonas, 2003). Thus, baseline association with MiRP2, which slows Kv3.1 activation, might be counterproductive in hippocampus. Because of the recognized role of Kv3.1 channels, we simulated the effects of MiRP2 modulation of Kv3.1 on rapid firing. Our simulations predicted that MiRP2-Kv3.1 complexes would be less able to sustain rapid firing frequencies than homomeric Kv3.1 channels. Interestingly, the effects of MiRP2 on Kv3.1 gating rate alone were sufficient to produce a reduction in sustainable firing frequency, and a reduction in conductance to mirror the effects of MiRP2 on Kv3.1 current density produced no further changes in spike frequency response. The shift in frequency response we observed, from 300 Hz to 200 Hz before failure, could be significant in cells such as auditory neurons, in which fine-tuning of ability to respond to different stimulus frequencies is used to garner spatial information from intensity and frequency of auditory inputs (Macica et al., 2003). Formation of MiRP2-Kv3.1 complexes may be temporally regulated, occurring when very specific reduction of spike frequency or interruption of trains of impulses is required in select neuronal circuits or populations. Alternatively, specialized regions of the brain may constantly require the distinct kinetics of MiRP2-Kv3.1 channels. In support of this latter hypothesis, some populations of cells, such as certain somatastain- and calbindin-containing neocortical interneurons, express Kv3 subunits but are not fast-spiking (Chow et al., 1999), suggesting that Kv3 α subunits form a slower-gating channel type in some cells, possibly by association with MiRP2. Our simulations predicted that, at lower spike frequencies, MiRP2-Kv3.1 complexes produce morphologically different action potentials that are broader, display less undershoot, and generally do not allow the neuron to occupy hyperpolarized potentials, compared with homomeric Kv3.1 channels. These properties may be important in regulating the activity of other voltage-gated channels within certain neurons, or could be a feature for specifically timed responses to particular stimuli.
The use of MiRP2 in Kv2.1 channel complexes is perhaps more intuitive. Kv2.1 α subunits dominate delayed rectifier currents in many mammalian neurons, providing a mid-voltage range current, IK, responsible for action potential repolarization and regulation of tonic firing (Malin and Nerbonne, 2002). The subspecialization of this current by interaction with modifying subunits such as MiRP2 could constitute an economic mechanism for IK diversity, or a pathway for dynamic regulation of repolarization characteristics against a stable α subunit backdrop, such as is observed in the developing heart (Franco et al., 2001). Overexpression of MiRP2 in hippocampal neurons down-regulated delayed rectifier current and slowed deactivation, but did not slow potassium current activation. We suggest that slowing of mean activation kinetics in hippocampal neurons when MiRP2 was overexpressed was not apparent for two reasons: (1) MiRP2-Kv3.1 interaction did not occur in this cell type; and (2) Kv2.1 current density is lowered by MiRP2, thus increasing the relative contribution of faster-activating currents such as Kv3 and A-type currents, which are also expressed in these cells (Rudy and McBain, 2001; Nadal et al., 2003). The deactivation rate in hippocampal neurons, however, was altered by MiRP2 transfection in a similar manner to that observed for Kv2.1 in CHO cells. This is consistent with Kv2.1 dominating the postdepolarization potassium current in hippocampal neurons because of its relatively slow deactivation compared with other currents (including Kv3 and A-type channels), despite concomitant reduction of Kv2.1 tail current density by MiRP2. This could point to a specialized physiological role for MiRP2: delay of subsequent depolarizations by extending the life of tail currents in neurons. Native-cloned current discrepancies reported in rat globus pallidus may give a first clue to a specific physiological role for MiRP2-Kv2.1 complexes: in this region, Kv2.1-attributed currents exhibit double the deactivation time and increased TEA sensitivity compared with heterologously expressed Kv2.1, suggested by the authors to arise from an undetermined β subunit interaction (Frech et al., 1989; Baranauskas et al., 1999).
In summary, we have purified two novel potassium channel complexes from rat brain, identifying a role for MiRP2 in mammalian neurons. It is highly likely that additional studies will identify a role for MiRP2-Kv2.1 and MiRP2-Kv3.1 in other tissues in which these subunits coincide. Most significantly, the potential for a myriad of neuronal MiRP-α subunit interactions lies ahead, and exciting questions remain regarding how formation of these complexes is regulated and how they may contribute to neuronal potassium current diversity and versatility, factors essential for the processing and integration of nervous signaling in mammalian brain.
Footnotes
This work was supported by a Greenberg Atrial Fibrillation grant and Scientist Development Grant 0235069N from the American Heart Association to G.W.A. P.N.J. is a Howard Hughes Medical Institute Predoctoral Fellow. We are indebted to Dr. Samie Jaffrey for provision of rat primary hippocampal neurons and culturing protocols, Dr. Kwok-Keung Tai for provision of PC12 cells, Dr. Sandra Chaplan for advice and assistance with antibody development, and Arun Anantharam and Karen Wu for expert technical assistance.
Correspondence should be addressed to Dr. Geoffrey W. Abbott, Division of Cardiology, Department of Medicine, Weill Medical College of Cornell University, Starr 463, 520 East 70th Street, New York, NY 10021. E-mail:gwa2001@med.cornell.edu.
Copyright © 2003 Society for Neuroscience 0270-6474/03/238077-15$15.00/0
References
- Abbott GW, Goldstein SA ( 1998) A superfamily of small potassium channel subunits: form and function of the MinK-related peptides (MiRPs). Q Rev Biophys 31: 357-398. [DOI] [PubMed] [Google Scholar]
- Abbott GW, Goldstein SA ( 2002) Disease-associated mutations in KCNE potassium channel subunits (MiRPs) reveal promiscuous disruption of multiple currents and conservation of mechanism. FASEB J 16: 390-400. [DOI] [PubMed] [Google Scholar]
- Abbott GW, Sesti F, Splawski I, Buck ME, Lehmann MH, Timothy KW, Keating MT, Goldstein SA ( 1999) MiRP1 forms IKr potassium channels with HERG and is associated with cardiac arrhythmia. Cell 97: 175-187. [DOI] [PubMed] [Google Scholar]
- Abbott GW, Goldstein SA, Sesti F ( 2001a) Do all voltage-gated potassium channels use MiRPs? Circ Res 88: 981-983. [DOI] [PubMed] [Google Scholar]
- Abbott GW, Butler MH, Bendahhou S, Dalakas MC, Ptacek LJ, Goldstein SA ( 2001b) MiRP2 forms potassium channels in skeletal muscle with Kv3.4 and is associated with periodic paralysis. Cell 104: 217-231. [DOI] [PubMed] [Google Scholar]
- Anantharam A, Lewis A, Panaghie G, Gordon E, McCrossan ZA, Lerner DJ, Abbott GW ( 22003) RNA interference reveals that endogenous Xenopus MinK-related peptides govern mammalian K+ channel function in oocyte expression studies. J Biol Chem 278: 11739-11745. [DOI] [PubMed] [Google Scholar]
- Angelo K, Jespersen T, Grunnet M, Nielsen MS, Klaerke DA, Olesen SP ( 2002) KCNE5 induces time- and voltage-dependent modulation of the KCNQ1 current. Biophys J 83: 1997-2006. [DOI] [PMC free article] [PubMed] [Google Scholar]
- Baranauskas G, Tkatch T, Surmeier DJ ( 1999) Delayed rectifier currents in rat globus pallidus neurons are attributable to Kv2.1 and Kv3.1/3.2 K(+) channels. J Neurosci 19: 6394-6404. [DOI] [PMC free article] [PubMed] [Google Scholar]
- Barhanin J, Lesage F, Guillemare E, Fink M, Lazdunski M, Romey G ( 1996) K(V)LQT1 and lsK (minK) proteins associate to form the I(Ks) cardiac potassium current. Nature 384: 78-80. [DOI] [PubMed] [Google Scholar]
- Bianchi L, Kwok SM, Driscoll M, Sesti F ( 2003) A potassium channel-MiRP complex controls neurosensory function in Caenorhabditis elegans J Biol Chem 278: 12415-12424. [DOI] [PubMed] [Google Scholar]
- Chow A, Erisir A, Farb C, Nadal MS, Ozaita A, Lau D, Welker E, Rudy B ( 1999) K(+) channel expression distinguishes subpopulations of parvalbumin- and somatostatin-containing neocortical interneurons. J Neurosci 19: 9332-9345. [DOI] [PMC free article] [PubMed] [Google Scholar]
- Coetzee WA, Amarillo Y, Chiu J, Chow A, Lau D, McCormack T, Moreno H, Nadal MS, Ozaita A, Pountney D, Saganich M, Vega-Saenz de Miera E, Rudy B ( 1999) Molecular diversity of K+ channels. Ann N Y Acad Sci 868: 233-285. [DOI] [PubMed] [Google Scholar]
- Conforti L, Millhorn DE ( 1997) Selective inhibition of a slow-inactivating voltage-dependent K+ channel in rat PC12 cells by hypoxia. J Physiol 502: 293-305. [DOI] [PMC free article] [PubMed] [Google Scholar]
- Deutsch C ( 2002) Potassium channel ontogeny. Annu Rev Physiol 64: 19-46. [DOI] [PubMed] [Google Scholar]
- Dixon JE, McKinnon D ( 1994) Quantitative analysis of potassium channel mRNA expression in atrial and ventricular muscle of rats. Circ Res 75: 252-260. [DOI] [PubMed] [Google Scholar]
- England SK, Uebele VN, Kodali J, Bennett PB, Tamkun MM ( 1995) A novel K+ channel β-subunit (hKv β 1.3) is produced via alternative mRNA splicing. J Biol Chem 270: 28531-28534. [DOI] [PubMed] [Google Scholar]
- Erisir A, Lau D, Rudy B, Leonard CS ( 1999) Function of specific K(+) channels in sustained high-frequency firing of fast-spiking neocortical interneurons. J Neurophysiol 82: 2476-2489. [DOI] [PubMed] [Google Scholar]
- Finley MR, Li Y, Hua F, Lillich J, Mitchell KE, Ganta S, Gilmour Jr RF, Freeman LC ( 2002) Expression and coassociation of ERG1, KCNQ1, and KCNE1 potassium channel proteins in horse heart. Am J Physiol 283: H126-H138. [DOI] [PubMed] [Google Scholar]
- Franco D, Demolombe S, Kupershmidt S, Dumaine R, Dominguez JN, Roden D, Antzelevitch C, Escande D, Moorman AF ( 2001) Divergent expression of delayed rectifier K(+) channel subunits during mouse heart development. Cardiovasc Res 52: 65-75. [DOI] [PubMed] [Google Scholar]
- Frech GC, VanDongen AM, Schuster G, Brown AM, Joho RH ( 1989) A novel potassium channel with delayed rectifier properties isolated from rat brain by expression cloning. Nature 340: 642-645. [DOI] [PubMed] [Google Scholar]
- Gan L, Kaczmarek LK ( 1998) When, where, and how much? Expression of the Kv3.1 potassium channel in high-frequency firing neurons. J Neurobiol 37: 69-79. [DOI] [PubMed] [Google Scholar]
- Grunnet M, Jespersen T, Rasmussen HB, Ljungstrom T, Jorgensen NK, Olesen SP, Klaerke DA ( 2002) KCNE4 is an inhibitory subunit to the KCNQ1 channel. J Physiol (Lond) 542: 119-130. [DOI] [PMC free article] [PubMed] [Google Scholar]
- Joho RH, Ho CS, Marks GA ( 1999) Increased gamma- and decreased delta-oscillations in a mouse deficient for a potassium channel expressed in fast-spiking interneurons. J Neurophysiol 82: 1855-1864. [DOI] [PubMed] [Google Scholar]
- Kleiman R, Banker G, Steward O ( 1990) Differential subcellular localization of particular mRNAs in hippocampal neurons in culture. Neuron 5: 821-830. [DOI] [PubMed] [Google Scholar]
- Lau D, Vega-Saenz de Miera EC, Contreras D, Ozaita A, Harvey M, Chow A, Noebels JL, Paylor R, Morgan JI, Leonard CS, Rudy B ( 2000) Impaired fast-spiking, suppressed cortical inhibition, and increased susceptibility to seizures in mice lacking Kv3.2 K+ channel proteins. J Neurosci 20: 9071-9085. [DOI] [PMC free article] [PubMed] [Google Scholar]
- Lien CC, Jonas P ( 2003) Kv3 Potassium conductance is necessary and kinetically optimized for high-frequency action potential generation in hippocampal interneurons. J Neurosci 23: 2058-2068. [DOI] [PMC free article] [PubMed] [Google Scholar]
- Macica CM, von Hehn CA, Wang LY, Ho CS, Yokoyama S, Joho RH, Kaczmarek LK ( 2003) Modulation of the kv3.1b potassium channel isoform adjusts the fidelity of the firing pattern of auditory neurons. J Neurosci 23: 1133-1141. [DOI] [PMC free article] [PubMed] [Google Scholar]
- Malin SA, Nerbonne JM ( 2002) Delayed rectifier K+ currents, IK, are encoded by Kv2 α-subunits and regulate tonic firing in mammalian sympathetic neurons. J Neurosci 22: 10094-10105. [DOI] [PMC free article] [PubMed] [Google Scholar]
- Mazhari R, Greenstein JL, Winslow RL, Marban E, Nuss HB ( 2001) Molecular interactions between two long-QT syndrome gene products, HERG and KCNE2, rationalized by in vitro and in silico analysis. Circ Res 89: 33-38. [DOI] [PubMed] [Google Scholar]
- McDonald TV, Yu Z, Ming Z, Palma E, Meyers MB, Wang KW, Goldstein SA, Fishman GI ( 1997) A minK-HERG complex regulates the cardiac potassium current I(Kr). Nature 388: 289-292. [DOI] [PubMed] [Google Scholar]
- Murakoshi H, Trimmer JS ( 1999) Identification of the Kv2.1 K+ channel as a major component of the delayed rectifier K+ current in rat hippocampal neurons. J Neurosci 19: 1728-1735. [DOI] [PMC free article] [PubMed] [Google Scholar]
- Nadal MS, Ozaita A, Amarillo Y, de Miera EV, Ma Y, Mo W, Goldberg EM, Misumi Y, Ikehara Y, Neubert TA, Rudy B ( 2003) The CD26-related dipeptidyl aminopeptidase-like protein DPPX is a critical component of neuronal A-type K+ channels. Neuron 37: 449-461. [DOI] [PubMed] [Google Scholar]
- Peng I, Binder LI, Black MM ( 1986) Biochemical and immunological analyses of cytoskeletal domains of neurons. J Cell Biol 102: 252-262. [DOI] [PMC free article] [PubMed] [Google Scholar]
- Perney TM, Marshall J, Martin KA, Hockfield S, Kaczmarek LK ( 1992) Expression of the mRNAs for the Kv3.1 potassium channel gene in the adult and developing rat brain. J Neurophysiol 68: 756-766. [DOI] [PubMed] [Google Scholar]
- Rudy B, McBain CJ ( 2001) Kv3 channels: voltage-gated K+ channels designed for high-frequency repetitive firing. Trends Neurosci 24: 517-526. [DOI] [PubMed] [Google Scholar]
- Sanguinetti MC, Curran ME, Zou A, Shen J, Spector PS, Atkinson DL, Keating MT ( 1996) Coassembly of K(V)LQT1 and minK (IsK) proteins to form cardiac I(Ks) potassium channel. Nature 384: 80-83. [DOI] [PubMed] [Google Scholar]
- Schroeder BC, Waldegger S, Fehr S, Bleich M, Warth R, Greger R, Jentsch TJ ( 2000) A constitutively open potassium channel formed by KCNQ1 and KCNE3. Nature 403: 196-199. [DOI] [PubMed] [Google Scholar]
- Sesti F, Abbott GW, Wei J, Murray KT, Saksena S, Schwartz PJ, Priori SG, Roden DM, George Jr AL, Goldstein SA ( 2000) A common polymorphism associated with antibiotic-induced cardiac arrhythmia. Proc Natl Acad Sci USA 97: 10613-10618. [DOI] [PMC free article] [PubMed] [Google Scholar]
- Splawski I, Tristani-Firouzi M, Lehmann MH, Sanguinetti MC, Keating MT ( 1997) Mutations in the hminK gene cause long QT syndrome and suppress IKs function. Nat Genet 17: 338-340. [DOI] [PubMed] [Google Scholar]
- Tai KK, McCrossan ZA, Abbott GW ( 2003) Activation of mitochondrial ATP-sensitive potassium channels increases cell viability against rotenone-induced cell death. J Neurochem 84: 1193-1200. [DOI] [PubMed] [Google Scholar]
- Takumi T, Ohkubo H, Nakanishi S ( 1988) Cloning of a membrane protein that induces a slow voltage-gated potassium current. Science 242: 1042-1045. [DOI] [PubMed] [Google Scholar]
- Tinel N, Diochot S, Borsotto M, Lazdunski M, Barhanin J ( 2000) KCNE2 confers background current characteristics to the cardiac KCNQ1 potassium channel. EMBO J 19: 6326-6330. [DOI] [PMC free article] [PubMed] [Google Scholar]
- Tischler AS ( 2002) Chromaffin cells as models of endocrine cells and neurons. Ann N Y Acad Sci 971: 366-370. [DOI] [PubMed] [Google Scholar]
- Trimmer JS ( 1991) Immunological identification and characterization of a delayed rectifier K+ channel polypeptide in rat brain. Proc Natl Acad Sci USA 88: 10764-10768. [DOI] [PMC free article] [PubMed] [Google Scholar]
- Trimmer JS ( 1993) Expression of Kv2.1 delayed rectifier K+ channel isoforms in the developing rat brain. FEBS Lett 324: 205-210. [DOI] [PubMed] [Google Scholar]
- Tyson J, Tranebjaerg L, Bellman S, Wren C, Taylor JF, Bathen J, Aslaksen B, Sorland SJ, Lund O, Malcolm S, Pembrey M, Bhattacharya S, Bitner-Glindzicz M ( 1997) IsK and KvLQT1: mutation in either of the two subunits of the slow component of the delayed rectifier potassium channel can cause Jervell and Lange-Nielsen syndrome. Hum Mol Genet 6: 2179-2185. [DOI] [PubMed] [Google Scholar]
- Wang LY, Gan L, Perney TM, Schwartz I, Kaczmarek LK ( 1998) Activation of Kv3.1 channels in neuronal spine-like structures may induce local potassium ion depletion. Proc Natl Acad Sci USA 95: 1882-1887. [DOI] [PMC free article] [PubMed] [Google Scholar]
- Warth R, Garcia Alzamora M, Kim JK, Zdebik A, Nitschke R, Bleich M, Gerlach U, Barhanin J, Kim SJ ( 2002) The role of KCNQ1/KCNE1 K(+) channels in intestine and pancreas: lessons from the KCNE1 knockout mouse. Pflugers Arch 443: 822-828. [DOI] [PubMed] [Google Scholar]
- Yu H, Wu J, Potapova I, Wymore RT, Holmes B, Zuckerman J, Pan Z, Wang H, Shi W, Robinson RB, El-Maghrabi MR, Benjamin W, Dixon J, McK-innon D, Cohen IS, Wymore R ( 2001) MinK-related peptide 1: a β subunit for the HCN ion channel subunit family enhances expression and speeds activation. Circ Res 88: E84-E87. [DOI] [PubMed] [Google Scholar]
- Yue L, Wang Z, Rindt H, Nattel S ( 2000) Molecular evidence for a role of Shaw (Kv3) potassium channel subunits in potassium currents of dog atrium. J Physiol 527: 467-478. [DOI] [PMC free article] [PubMed] [Google Scholar]
- Zhang M, Jiang M, Tseng GN ( 2001) minK-related peptide 1 associates with Kv4.2 and modulates its gating function: potential role as beta subunit of cardiac transient outward channel? Circ Res 88: 1012-1019. [DOI] [PubMed] [Google Scholar]