

Abstract
The role of corticogeniculate feedback in the organization, function, and state dependence of visual responses and receptive fields (RFs) is not well understood. We investigated the contribution of the corticogeniculate loop to state-dependent changes of characteristics of the primary visual cortex response by using a novel approach of eliminating corticogeniculate projection neurons with targeted neuronal apoptosis. Experiments were performed in anesthetized cats (N2O plus halothane) with parallel recordings of single units from experimental (right) and control (left) hemispheres ∼2 weeks after induction of apoptosis. Within the experimental hemispheres, neurons of area 17 and of the dorsal lateral geniculate nucleus (dLGN) showed an unusually enhanced and prolonged tonic visual response during episodes of synchronized (syn) EEG activity, whereas response levels during less synchronized states were almost normal. In addition, dLGN cells showed a reduced tendency for burst firing and a less regular spike interval distribution compared with those of controls. These changes are likely attributable to a tonic depolarization of dLGN relay neurons or, more likely, to a decreased responsiveness of thalamic inhibitory processes to cortical feedback. Cortical neurons also displayed an activity-dependent increase in RF size, in contrast to an almost activity-invariant RF size of controls, a phenomenon likely related to the elimination of collateral, intracortical projections of layer 6 neurons. Together, these results demonstrate that selective chronic elimination of corticogeniculate feedback results in the loss of EEG-correlated differences of visual processing in the remaining thalamocortical network, accompanied by a significant increase in excitability during syn EEG, at the expense of noticeably reduced spatial receptive-field specificity in the remaining cortical neurons.
Keywords: visual cortex, corticogeniculate loop, photoactivation of chlorin e6, neuronal apoptosis, state dependence, receptive-field characteristics
Introduction
The spectral composition of the electroencephalogram (EEG), a signal averaging the activity of large populations of cortical neurons, strongly covaries with behavioral states of an animal, primarily as a result of the activity of modulatory brainstem nuclei (Foote et al., 1991; Munk et al., 1996) (for review, see Steriade, 1991). One of their prominent targets is the thalamus (for review, see Sherman and Guillery, 2001), in which they influence its neuronal responses. As a consequence, during globally synchronized (δ-wave-dominated) EEG states, neurons in the visual thalamus [dorsal lateral geniculate nucleus (dLGN)] are preferentially in a burst mode. This mode is characterized by brief, transient, high-frequency (phasic) responses of only a few tens of milliseconds in duration, even to prolonged visual stimuli. The same neurons respond to the same stimuli with long-lasting tonic responses during activated (previously termed desynchronized, β-wave-dominated) EEG states. During this so-called tonic transmission mode, dLGN neurons can transfer additional information about the nature of the stimulus (e.g., its local contrast or duration) (Sawai et al., 1988; Funke and Eysel, 1992; McClurkin et al., 1994; Wörgötter et al., 1998a; Przybyszewski et al., 2000). A similar pattern of activity—although less pronounced—is also reflected in the visual cortex (Ikeda and Wright, 1974; Singer et al., 1976; Livingstone and Hubel, 1981).
It has been suggested that corticogeniculate feedback plays an important role in the perpetuation of the tonic component of dLGN relay neurons during activated episodes (Kalil and Chase, 1970; Funke and Eysel, 1992; Wörgötter et al., 1998a). This feedback originates in layer 6 of the visual cortex and contributes up to 40% of the total synaptic input to dLGN relay neurons, compared with 10 -20% from the retina (for review, see Sherman and Koch, 1986; Montero, 1991). A considerable effect of corticogeniculate feedback on dLGN tonic responses was shown by reversibly cooling (Baker and Malpeli, 1977; Funke and Eysel, 1992; Wörgötter et al., 1998a) or irreversibly aspirating (Kalil and Chase, 1970; Sillito et al., 1993, 1994) the visual cortex. The temporal structure of the tonic component is also sharpened by corticogeniculate feedback (Wörgötter et al., 1998a).
Previously, it has not been possible to record visual cortical activity while inactivating the corticogeniculate feedback projection because of the global effect of all of the previously available inactivation procedures on the entire cortical network, also including neurons other than the layer 6 projection neurons. In this study, we applied a novel experimental approach of biophysical induction of neuron type-specific targeted apoptosis (Macklis, 1993; Sheen and Macklis, 1995; Magavi et al., 2000; Scharff et al., 2000; Shin et al., 2000; Fricker-Gates et al., 2002). This leads to specific elimination of a large portion of the corticogeniculate projection neurons, while leaving the remaining network undisturbed. We combined this approach with electrophysiological recordings in dLGN and visual cortex. We report here that this experimental elimination of corticogeniculate feedback leads to a striking reduction of EEG-related cortical response differences and a reduction of the spatial specificity of cortical receptive fields (RFs) because of a substantial increase of thalamic and cortical visual activity during synchronized EEG states.
Materials and Methods
Induction of apoptosis of corticogeniculate neurons in cortical layer 6. Apoptotic death of corticogeniculate feedback neurons in layer 6 of cortical areas 17-18 was induced using methods previously described by one of our laboratories (Macklis, 1993; Sheen and Macklis, 1994; Magavi et al., 2000; Scharff et al., 2000; Shin et al., 2000; Fricker-Gates et al., 2002). We directly adapted methods developed in the mouse (Magavi et al., 2000) for use in the cat.
Stereotaxic injection of photoactive nanospheres. Under deep anesthesia with a combination of ketamine (20 mg/kg) and xylazine (2 mg/kg), cats [n = 9; five with cortical recordings; two with geniculate recordings after apoptosis; one control experiment with cortical and geniculate recordings but no final apoptosis (sham control); and one control experiment with apoptosis and multisite EEG recording instead of multiunit recording] were stabilized using standard stereotaxic methods, and craniotomies were performed unilaterally to allow access to the dLGN. All of the incisions were also locally anesthetized by xylocaine. Nanospheres carrying the targeting chromophore chlorin e6 [covalently bound to the 20 - 60 nm subfraction of rhodamine latex microspheres (Lumafluor, New York, NY)] were stereotaxically pressure microinjected under electrophysiological control into both dorsal layers (A and A1) of the dLGN of one hemisphere at three to four sites (20 nl in each site; ∼10 injections along each micropipette track). Positions of both the RFs and the optic disc were recorded on a tangent screen to determine the visual-field positions of the injection sites (Fig. 1a).
Figure 1.

Schematic illustration of the experimental approach (for details, see Materials and Methods). a, Injection of fluorescent nanospheres carrying chlorin e6 (depicted in gray here) into both layers A and A1 of cat dLGN under electrophysiological control. b, The region of cortex with retrogradely labeled neurons in layer 6 was illuminated with deeply penetrating 674 nm light after electrophysiological verification of the correct topographic region. c, After completion of targeted corticogeniculate neuron apoptosis, electrophysiological recordings were conducted in both cortex and dLGN.
Induction of targeted apoptosis of corticogeniculate projection neurons. After 2-3 weeks, allowing sufficient time for retrograde transport of the photoactive targeting nanospheres, apoptosis of corticogeniculate neurons was induced in cortical layer 6 of primary visual cortex areas 17 and 18. The same basic surgical procedures were used as mentioned above. Neuronal apoptosis was induced via the noninvasive, transdural activation of chlorin e6 with 674 nm light (region diameter, 1.9 mm; 2.7 kJ/cm2; 2.2 W/cm2) delivered by a continuous-wave laser (Schaefter und Kirchhoff, Hamburg, Germany) coupled to custom beam-controlling optics via a quartz fiber. Light was applied after exposing the appropriate cortical surface representing the same visual field position as the injection sites, as reverified by RF mapping. After light exposure, neuronal apoptosis progressively developed over 10 -14 d (Fig. 1b).
Electrophysiology and receptive-field mapping (Fig. 1c). We applied conventional approaches for semiacute extracellular recording to allow RF mapping (Wörgötter et al., 1998b). Initial anesthesia was provided by ketamine-xylazine, as described above. Craniotomy provided access to the areas 17 of both hemispheres. An additional craniotomy was performed overlying area 18 of the control hemisphere, to allow insertion of a 0.5 mm silver-ball electrode epidurally for EEG recording. Femoral artery cannulization enabled infusion of alcuronium chloride (0.15 mg · kg-1 · h-1; Alloferin 10; Hoffmann-La Roche, Basel, Switzerland), glucose, minerals, and amino acids through the femoral artery. Endotracheal intubation enabled artificial respiration with 70% N2O-30% O2 and 0.6% halothane for ongoing anesthesia (halothane was increased to 2.0% during any potentially painful preparation procedure; additional local anesthetic xylocaine was used at pressure and incision points). Data were obtained by single-unit recordings, using glass micropipettes in cortical areas 17-18 (n = 76 experimental neurons). Recordings in experimental and control hemispheres were performed simultaneously in both areas 17. Visual stimuli were presented monocularly as bright and dark bars (size, 0.2-0.8° × 3-6°; contrast [100(I - I0)/(I + I0)], 33 and -33%, respectively, displayed on a computer screen, controlled by standard software [Leonardo system; Lohmann Research Equipment, Castrop-Rauxel, Germany]). Optimally sized and oriented bars were presented at 16 evenly spaced positions along a line cross-sectioning the RF center, in a pseudorandom sequence. The two extreme presentation positions extended beyond the RF borders. Each stimulus was shown with a duty cycle of 350 msec presentation time and 150 msec pause. Neurons from the control and the experimental hemispheres were stimulated in an interleaved manner, for a total duration of 20 - 60 min, depending on the general responsiveness of the neurons. This resulted in >75 complete stimulus sweeps for all of the positions. We categorized the neurons into simple and complex cells on the basis of their neuronal responses and the spatial overlap of RF subfields responding to bright and dark stimuli. Spatial subfield separation or the presence of only one response type was interpreted as simple, versus spatial overlap, which was interpreted as complex. Because we investigated a trait that affects all of the neurons [at the level of the dLGN (Funke and Eysel, 1992) as well as the visual cortex (Ikeda and Wright, 1974)], we pooled all of the data, irrespective of neuron type (simple or complex).
Information about the cortical layer of the neurons is based on recording depth, because we avoided interference with the process of targeted neuronal apoptosis by not marking the electrode tracks.
For the control recordings in the dLGN, an optimally sized dot stimulus was flashed at a fixed position in the center of the RF (50% contrast; duty cycle, 0.8:1.2 sec), to obtain a standard peristimulus-time histogram (PSTH).
EEG analysis. The state of the EEG was determined by a sliding-window fast Fourier transformation (time base, 5 sec; step size, 1 sec) of the EEG trace, and the calculation of the δ-power ratio (power of 1-4 Hz band/all of the bands). Previous studies have shown that changes in the dynamics of thalamic and cortical visual responses were predominantly correlated with changes in the spectral power of the δ frequency band (Wörgötter et al., 1998b; Li et al., 1999). Changes in the power of the α band were less effective, probably because α activity and sleep spindles overlap in frequency. The proportion of δ-wave power was used to differentiate between synchronized (syn) (high δ-wave power ratio, >0.7), intermediate (moderate δ-wave power ratio, 0.3-0.7), and less synchronized (less syn) (lowest δ-wave power ratio, <0.3) EEG (Wörgötter et al., 1998b). Finally, the states of less syn (power ratio, <0.3) and syn (power ratio, >0.7) were taken to sort visual response data by EEG, and data from the intermediate state were omitted. The state of less synchronized in the anesthetized animal is the state that most closely resembles an activated (desynchronized) EEG in awake animals.
Analysis of cortical and geniculate single unit activity. Because of the RF-mapping procedure, cortical responses to visual stimuli can be represented as a three-dimensional (3D) plot, as shown in Figure 2a, with space and time as the x- and y-axes and the level of activity as the z-axis.
Figure 2.

Schematic illustration of the response analysis. a, 3D representation of a cortical response with time and space on the x- and y-axes, respectively, and neuronal activity on the z-axis. The phasic maximum is the reference of the activity measure and—for graphical reasons—evenly divided into 10 vertical bins. The time axis has a resolution of 10 msec. Raw data maps were then smoothed with a 2D Gaussian profile with a σ of five bins along space and time. b, PSTH (top) obtained from the central cross-section of the 3D plot and a contour map (bottom; 2D map) viewed along the z-axis of the 3D plot. The calculation of the absolute width, the normalized WHH, and DHH of the tonic response is illustrated. Reference for the latter two is the tonic maximum (of 100 Hz in this schematic example). The lower bound for absolute width is twice the SD (2SD) of the spontaneous activity (gray shaded area). Activity levels above half-height of tonic maximum are shown in black, and those below are shown with white shading.
These raw 3D maps (bin width, 10 msec) were convoluted with an optimally suited two-dimensional (2D) Gaussian profile for smoothing in time and space. The Gauss had a σ of 50 msec on the temporal axis and of five stimulus positions on the space axis, thus leading to a weighted sliding average of the map over five bins in each direction. To emphasize the temporal aspects of the response, we calculated a PSTH from the central cross-section of the RF including the highest activity (Fig. 2b, top). Because of the smoothing process applied to the 3D map, each bin of the PSTH includes the weighted average from a 5 × 5 matrix of the contour map. The spatial aspects of cortical responses are shown as 2D contour maps by coding different levels of spike rate with black, white, and gray shading as described below (Fig. 2b, bottom).
From the smoothed 3D maps, we determined the maximum of the phasic response component, and for the tonic component, the duration as well as two measures of the width and the mean amplitude. Two times the SD of the spontaneous activity level (shown in gray shading in Fig. 2b) was taken as the minimum response level, a conventional threshold for separation of background activity. The phasic response is the transient, high-frequency response first after stimulus onset, whereas the tonic response is the sustained response component afterward. The maximum of the phasic response is the firing rate of the highest bin. To determine the parameters of the tonic response, we first defined its temporal outline approximately by visual inspection. This is straightforward, because the shape of the responses was almost always very distinct (Fig. 2b, top). Within the tonic response, we determined the tonic response maximum from the smoothed profile. The tonic maximum was then used to more accurately define the duration of the tonic response as the difference between those two points at which the firing rate of the neuron crosses the half-height of the tonic maximum [duration at half-height (DHH)] (Fig. 2b). The normalized tonic RF width was determined as the maximal width of the tonic response portion (again, with the temporal limits given by the duration) at half-height of the tonic maximum [width at half-height (WHH)] (Fig. 2b, bottom).
It has been shown that acute silencing of the corticogeniculate feedback leads to a general depression of geniculate activity (Kalil and Chase, 1970; Baker and Malpeli, 1977; Funke and Eysel, 1992; Wörgötter et al., 1998a). We suspected that this could also lead to a rather nonspecific depression of cortical activity, resulting in difficulty in interpreting absolute changes in cortical responses (e.g., attributable to an iceberg effect, in which RFs appear narrower simply because of the downscaled peak). To control against this, duration and normalized RF width measures were defined in this normalized way, such that mere amplitude scaling does not affect them. In addition, to quantify this scaling effect, the absolute tonic RF width was determined as the maximum extension of the tonic component above 2 SDs of the spontaneous activity (Fig. 2b, bottom). The mean amplitude is the mean firing rate at the central cross-section of the tonic component within the limits of its duration. In a few cases, the tonic response maximum could not be determined because of strong adaptation of the tonic response, so we defined the tonic duration by visual inspection.
Geniculate visual responses were analyzed with the aid of peristimulus-time histograms and interspike interval histograms. Receptive fields of pairs of dLGN units were stimulated in an interleaved manner with spots of light of 33-50% contrast to background and 0.3-1.0° in diameter, flashed for 800 msec within the center of the RF (total sweep length, 2 sec).
Histology. After electrophysiological data collection, cats were perfused with heparinized Ringer's solution, followed by 4% paraformaldehyde in PBS at pH 7.4. After fixation, brains were removed and cryoprotected in 30% sucrose. Coronal frozen sections (30 μm) of area 17, area 18, and the dLGN were prepared. Sections were alternately prepared for fluorescence microscopy and cresyl violet staining (Nissl stain). Sections from the regions of targeted neuronal apoptosis and the homologous regions of the control hemispheres were processed for immunocytochemistry using primary antibodies directed against the mature neuronal marker NeuN (Chemicon, Temecula, CA). Labeling for NeuN was detected both histochemically and by fluorescence, in alternate sections: (1) to allow for quantitative neuronal counting, we used peroxidase anti-peroxidase (Dako, Glostrup, Denmark) and Ni-enhanced diaminobenzidine (DAB-Ni), and (2) to determine the ratio of retrogradely labeled neurons via fluorescence of the targeting chlorin e6 nanospheres (label ratio), we used secondary antibodies coupled to the green fluorochrome carbocyanine (Cy2) (Jackson ImmunoResearch, West Grove, PA).
Quantification of neuronal density in area 17-18. Quantitative analysis was performed using modified stereological methods (Guillery and Herrup, 1997). First, the baseline density of NeuN-labeled neurons was determined by manually counting Cy2-labeled NeuN sections at high magnification in control regions outside the regions of laser exposure. Second, we applied semiautomated modified stereological analysis to quantify neuronal population density in experimental versus control regions of cortical areas 17-18. We used DAB-Ni staining for NeuN, with images acquired using a high-resolution CCD camera (Visitron Systems, Puchheim, Germany). DAB-Ni staining provides excellent contrast, well suited for semiautomated quantitative analysis. Regions of interest (ROI) were defined as rectangular regions along the medial or lateral banks of the lateral gyrus. At the sharply curved tip of the gyrus, wedge-shaped sectors were defined with the radius of the curvature of the gyrus. Blood vessels and other atypical structural elements were excluded from the ROI. Matched, homologous ROIs were analyzed in control and experimental hemispheres. Minor size differences between the matched ROIs, typically within ±5%, were corrected to the size of the ROI in the experimental hemisphere. Neurons in the ROI were counted with a sliding-window technique. The depth of each window (i.e., its dimension perpendicular to the cortical surface) was 25% of the depth of the ROI; window overlap was 50%. To obtain optimal quantification, analysis was performed starting in layer 4. We chose the border between layers 5A and 5B as the zero reference point (ZP) for analysis, because it is optimally identified in the cat, better than any other layer boundary (Lund et al., 1979). Thus, ZP-relative depth in Figure 3 refers to depth from layer 5B-6 to the white matter. For semiautomatic quantitative analysis, we applied luminance thresholds to the images. Neurons were identified as closed contours and counted. Correction for potentially overlapping or attached neurons was achieved by defining a standard neuronal area for neurons within each ROI window—an assumption valid for layers 5B and 6, because these layers are primarily composed of equally sized neurons. Objects with areas that were an integer multiple of the standard area range were counted multiply, and areas <50% of the standard neuronal area were excluded (MetaMorph software; Universal Imaging Corporation, West Chester, PA). Neuronal densities were normalized to compensate for nonspecific differences between cortices, defining the density of the ZP window as 100%.
Figure 3.
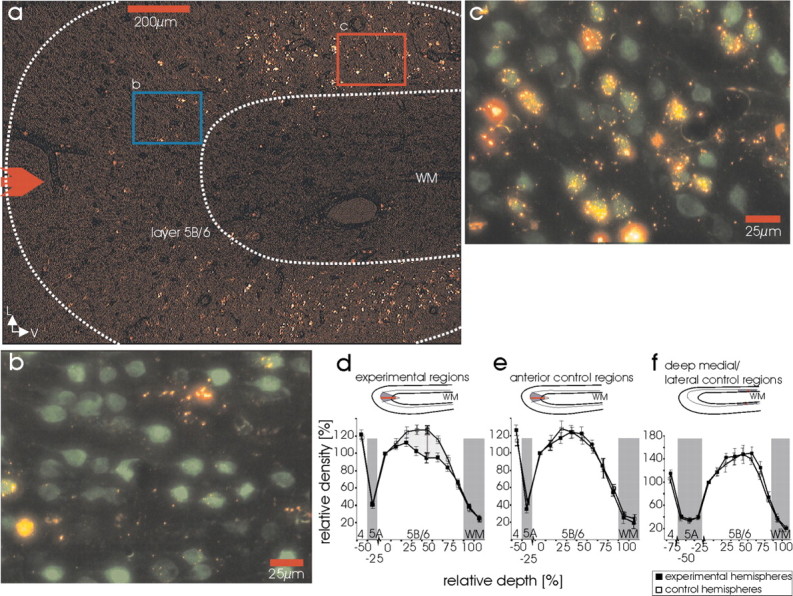
Highly selective elimination of corticogeniculate neurons in areas 17-18 of experimental cortex. a, Gyrus lateralis of an experimental cat 14 d after induction of apoptosis. The red arrow indicates the center and direction of photoactivation by incident light (1.9 mm diameter region of photoactivation); L, lateral; V, ventral; WM, white matter. b, c, Merged overlay of images for the rhodamine fluorochrome carried by the targeting nanospheres (red) and immunocytochemical labeling for the mature neuronal marker NeuN with Cy2 (green). b, High magnification image of the blue-boxed region in a, demonstrating the highly efficient elimination of corticogeniculate projection neurons in the experimentally targeted region. c, High magnification image of the red-boxed region in a, demonstrating the normal appearance of corticogeniculate neurons in control primary visual cortex. d-f, Quantification of corticogeniculate neuron loss by relative cell density profiles. Regions denoted by gray and white shading represent assignment to specific cortical layers (noted above the abscissa). d, Density profile in regions of corticogeniculate neuron apoptosis at the tip of the gyrus and in the homologous regions in the control hemisphere (see insets above). e, Control region at the tip of the gyrus 3-6 mm anterior to the affected region, within the same experimental hemisphere (see inset). f, Control regions deep in the medial or lateral banks of the experimental hemisphere. Note that layer 5A is relatively thicker than layers 5B-6 in these deep regions compared with that at the tip of the gyrus, as indicated by three sampling windows and thicker area of gray shading. Error bars in d-f indicate SDs from the means.
Histological and physiological control procedures. One sham control experiment was performed, specifically to test our procedures for inducing targeted neuronal apoptosis, in which all of the experimental steps were completed except for initiation of targeted neuronal death. We found no changes in cortical histology and no change in any electrophysiological parameter, compared with intact controls. In two more cats, we performed control measurements in the dLGN (n = 36 neurons) after induction of apoptosis, to compare the effects of chronic silencing of the corticogeniculate pathway with the previously published acute effects on phasic and tonic response components (Funke and Eysel, 1992) and temporal precision of spike intervals of dLGN light response (Wörgötter et al., 1998a).
Results
Quantification of neuron loss in layer 6
After inducing the death of the targeted corticogeniculate neurons (Fig. 1a,b), histological analysis after the final recording session (c) revealed a substantial reduction of corticogeniculate projection neurons in the experimental regions of cortical layer 6. Because the targeting nanospheres also contain rhodamine as a fluorescent label, we could visualize the loss of previously labeled neurons. The substantial reduction in layer 6 neurons was visible by routine light-microscopic inspection of individual sections, which showed many fewer rhodamine-fluorescent corticogeniculate neurons in the experimental regions of layer 6, compared with the control regions (Fig. 3a-c).
To determine quantitatively the loss of the labeled neurons, we first determined the percentage of total neurons in layer 6 that were initially labeled by the geniculate injections, without photoactivation and initiation of targeted neuronal death (label ratio). We then counted the total number of neurons in layer 6 of the experimental and the appropriate control cortices to quantify the total neuron loss (total loss ratio). From these two ratios, we calculated how many of the labeled neurons underwent apoptosis.
The label ratio of corticogeniculate neurons, compared with all of the NeuN-labeled neurons in control regions of experimental animals, was 45 ± 3% in the densest sublayers, in agreement with previous studies (McCourt et al., 1986; Katz, 1987). Thus, it is reasonable to assume that almost every LGN projecting neuron was actually labeled within the cortical region corresponding to the injection site. As shown in Figure 3d, the quantitative evaluation of the total loss of neurons in experimental regions was 27 ± 4% in the bin with the highest loss. This bin anatomically matched the sublayers with the densest label. Thus, 60 ± 9% (0.27/0.45) of labeled corticogeniculate neurons were eliminated in the targeted regions. ANOVA demonstrated highly significant effects of hemisphere (p < 0.001) and depth (p < 0.001), and no interaction between depth and hemisphere (p = 0.15).
In both of the control regions immediately adjacent to the experimental regions (Fig. 3e), and in deep control regions (f), quantification of the density of layer 6 neurons was uniform with complete overlap of the density profiles, demonstrating no loss of neurons in the controls. Together, these results indicate that targeted induction of corticogeniculate neuron death was quite efficient and occurred only in the appropriate highly localized region of layer 6 in visual cortex. (See Discussion for additional details.)
We will now first discuss the effect of targeted apoptosis on the cortical network and later compare it with responses from dLGN neurons recorded after having applied the same experimental protocol.
Consequences of layer 6 neuron loss on cortical responses
We recorded the responses of 76 individual cortical neurons. It is known from previous studies that the spatial-response (Wörgötter et al., 1998b) and—to an even greater extent—the temporal-response (Ikeda and Wright, 1974; Livingstone and Hubel, 1981) properties of cortical neurons are significantly different during different EEG states, and there is evidence that corticogeniculate influences are involved in this (Funke and Eysel, 1992; Wörgötter et al., 1998a). Our approach took advantage of this predictable dependence of cortical response properties on EEG states. In the following, we will base our analysis on the direct comparison of the responses from simultaneous recordings in the control and experimental cortex during different EEG states.
We found that elimination of corticogeniculate neurons had striking effects on cortical response properties, abolishing the normal dependence on EEG state. In control cortex with intact corticogeniculate feedback circuitry, longer and more pronounced tonic responses occurred during less synchronized EEG states, compared with shorter, more phasic responses during synchronized EEG (δ-wave-dominated EEG). No significant differences were found between simple (experimental hemisphere, 25; control, 22 subfields) and complex (experimental, 52; control, 27 subfields) cells, neither regarding the EEG-dependent differences in the control hemispheres nor its abolishment in the experimental hemispheres, respectively. Therefore, the results will be pooled for these two populations throughout the paper. This highly reproducible variation in responses between less synchronized and synchronized EEG states is represented graphically for four cortical neurons in control cortex (Fig. 4a-d). The diagrams show PSTHs of the activity of the control neurons at the central cross-section of their receptive fields, as described in Materials and Methods. The right side (Fig. 4e-h) shows four simultaneously recorded neurons from the experimental cortex with targeted elimination of corticogeniculate neurons (each row shows pairs of simultaneously recorded neurons). In contrast to responses of neurons in control cortex, tonic responses in experimental cortex during synchronized EEG were significantly increased; in some cases, they even exceeded responses observed during less synchronized EEG, in duration and/or amplitude (Fig 4e,f,h). Bins within the tonic response exceeding half-height of the tonic response maximum are labeled by the white area, which delineates half-height of the tonic response and its duration according to the half-height amplitude threshold.
Figure 4.

State dependence of tonic visual responses in control and experimental hemispheres. Four representative neurons are depicted from control (a-d) and experimental (e-h) hemispheres. The PSTHs show the activity of each cortical neuron along the central cross-section of its receptive fields as demonstrated in Figure 2. a-d, As expected, responses in control hemispheres are longer and more pronounced during less synchronized EEG. e-h, The situation is reversed in the experimental hemispheres, in which responses are stronger and have a longer duration during synchronized EEG. White boxes label the part of the tonic response that exceeds half-height of maximum. Twenty second-long EEG traces above the PSTHs show the typical EEG pattern during those episodes of spike activity collected in the corresponding PSTHs. To the left of e-h, coordinates are indicating the visuotopic location of the RF of the respective neuron (box), in relation to the RF location of the original nanosphere injection sites (gray dots) and the center of the region of targeted corticogeniculate neuron apoptosis (X), within the visual field (axes in degrees of visual angle; HM, horizontal meridian; VM, vertical meridian). Cell types: complex (a), complex (b), simple (c), simple (d), simple (e), simple (f), complex (g), and complex (h).
Not only the amplitude and duration of the tonic visual response but also the spatial distribution of the activity differed between the experimental and control hemispheres during the different states of the system. RF widths in the experimental cortex appeared to covary with the amplitude of the response and were often wider with a high-amplitude response during syn episode than during a lower amplitude response in the less syn state. In contrast, in control cortex, no such covariation between amplitude and RF width could be observed. The RFs appeared to be equally wide or even narrower during the less syn episodes, despite the higher amplitudes. To more clearly demonstrate this effect, we replotted in Figure 5 the same data that are shown in Figure 4 (except for Fig. 4d because of missing tonic response) by showing 2D RF plots with normalized RF widths, which reflect WHH (areas filled in black) of the tonic response amplitude maximum (Fig. 2). This measure was chosen, because it is insensitive to mere scaling (iceberg) effects and was therefore also used for statistical quantification (Fig. 6). This representation shows that tonic RFs in control cortex were typically substantially narrower (early part) during less synchronized EEG than during synchronized EEG (a-c), in spite of the fact that the tonic amplitude was typically higher during the less syn state. In contrast, the normalized tonic RF widths in the experimental cortex showed a similar width during both EEG states (d and f), even wider RFs during less syn episodes (e), or, because of a very large amplitude difference, still wider RFs during syn episodes (g). In summary, these results suggest that, in normal cortex, there exists a normalizing mechanism that keeps the size of the receptive fields relatively constant. This mechanism appears to be impaired during chronic elimination of the dLGN projecting layer 6 neurons, most likely because of their collateral projection to layer 4.
Figure 5.

Examples of cortical receptive-field maps with activity scaling normalized to the activity level at width at half-height of tonic response. Those examples of Figure 4 with sufficiently strong tonic responses are shown as 2D contour plots (only d is omitted). Shown in black is the area that had higher activity than one-half of the tonic maximum, which is depicted in absolute firing rate below the plots. WHH and DHH can be directly seen in this representation. max, Maximum of tonic response.
Figure 6.

Quantitative analysis of response properties of experimental and control primary visual cortex. Responses of experimental (open squares) and control (filled squares) neuron samples are depicted during both synchronized and less synchronized EEG states, with regard to their duration (a), phasic-response (b) and tonic-response (c) amplitude (ampl.), tonic receptive-field width (e), and normalized (norm.) tonic receptive-field width (f). Logarithmic scatter plots show values obtained during less synchronized EEG, plotted against those observed during synchronized EEG. Enlarged dots depict the mean values for experimental (open) and control (filled) data. Histograms in the top right corners show the distributions of the data points (open bars, experimental; filled bars, control) with respect to the diagonal. This indicates the relative deviation (Δ) from an EEG-independent behavior. The inset histograms at the bottom right of each panel show mean values and SEs of the distributions; large values are indicative of strongly EEG-dependent behavior; significance was evaluated by a one-sample Student's t test (mean against Δ= 0) and U test between hemispheres. One hundred twenty-six receptive-field on and off subfields were analyzed; tonic receptive-field width could be reliably measured in 61 of these subfields. The differences in a, c, and f are highly significant; p < 0.001. In d, the ratio (value of less syn episodes divided by values of syn episodes) of absolute (abs.) tonic RF width is plotted against the corresponding amplitude ratio, to compare the covariation of RF width and amplitude. Regression lines for the samples of data from experimental (solid line) and control (dotted line) hemisphere are added.
Statistical analysis
Quantitative statistical analysis confirmed the qualitative observations (Fig. 6, Tables 1 and 2). The previous qualitative analysis suggested that responses in experimental cortex increased in both tonic amplitude and duration, particularly during synchronized EEG, and that tonic receptive fields scaled with amplitude. Figure 6 presents this quantitative analysis graphically, first with scatter plots of the raw data and their mean values (large dots). Histograms in the top right corner of each panel and their means (small insets) demonstrate the elimination of EEG-dependent behavior of cortical responses in the experimental hemisphere (Fig. 6a,c, open bars). Responses were only of 7 ± 7% longer (Fig. 6a) and 6 ± 5% higher (c) amplitude during less syn than during syn. This elimination of EEG-dependent behavior was primarily attributable to a significantly increased response duration (Fig. 6a) and amplitude (c) during synchronized EEG, compared with the control cortex (right shift of the large white dot only along the x-axis compared with the black dot). Because the change during less syn episodes appeared negligible, we calculated the shift only along the x-axis, which corresponds to an increase in duration of 64 ± 10% and an increase in amplitude of 77 ± 14% during syn episodes in the experimental hemispheres compared with the control cortices.
Table 1.
Statistical summary of state-dependent visual activity in control and experimental cortex
|
|
Absolute values |
||||||
|---|---|---|---|---|---|---|---|
| Control hemisphere
|
Experimental hemisphere
|
||||||
|
|
Synchronized EEG
|
Less synchronized EEG
|
Synchronized EEG
|
Less synchronized EEG
|
|||
| Duration tonic response (msec ± SEM) | 97.6 ± 9.2 n = 49 | 140.1 ± 9.5 n = 49 | 160.1 ± 10.0 n = 77 | 158.8 ± 8.9 n = 77 | |||
| Phasic amplitude (Hz ± SEM) | 73.5 ± 6.5 n = 49 | 76.1 ± 6.7 n = 49 | 89.8 ± 8.3 n = 77 | 88.8 ± 7.8 n = 77 | |||
| Tonic amplitude (Hz ± SEM) | 22.5 ± 2.6 n = 49 | 29.5 ± 3.4 n = 49 | 39.7 ± 3.1 n = 77 | 40.6 ± 2.9 n = 77 | |||
| Absolute tonic RF width (deg ± SEM) | 4.14 ± 0.36 n = 23 | 4.04 ± 0.43 n = 23 | 3.66 ± 0.37 n = 38 | 3.67 ± 0.32 n = 38 | |||
| Normalized RF width (deg ± SEM)
|
3.02 ± 0.41 n = 23
|
2.33 ± 0.37 n = 23
|
1.94 ± 0.30 n = 38
|
2.02 ± 0.25 n = 38
|
|||
Means and SEMs for the duration and amplitude of the tonic visual response, the amplitude of the phasic response, and the absolute and normalized RF width during the tonic response for different EEG states in control and experimental hemispheres. Bold type indicates samples with significant differences for EEG state (p < 0.001; one-sample Student's t test). The remaining samples did not differ significantly (p > 0.05). Shown are the same data that are included in Figure 6, a-c, e, and f.
Table 2.
Tonic responses of simple and complex cells
|
|
Absolute values |
||||||||||||||
|---|---|---|---|---|---|---|---|---|---|---|---|---|---|---|---|
| Control hemisphere
|
Experimental hemisphere
|
||||||||||||||
| Synchronized EEG
|
Less synchronized EEG
|
Synchronized EEG
|
Less synchronized EEG
|
||||||||||||
|
|
Simple
|
Complex
|
Simple
|
Complex
|
Simple
|
Complex
|
Simple
|
Complex
|
|||||||
| Duration tonic response (msec ± SEM) | 95.9 ± 15.9 n = 22 | 98.9 ± 1.8 n = 27 | 142.0 ± 15.4 n = 22 | 138.5 ± 12.1 n = 27 | 173.8 ± 16.5 n = 25 | 153.6 ± 12.4 n = 52 | 161.2 ± 17.6 n = 25 | 157.7 ± 10.3 n = 52 | |||||||
| Tonic amplitude (Hz ± SEM)
|
19.3 ± 2.3
|
25.1 ± 4.3
|
24.1 ± 2.0
|
33.9 ± 5.9
|
46.4 ± 6.0
|
36.5 ± 3.4
|
46.0 ± 5.5
|
38.0 ± 3.3
|
|||||||
Means and SEMs for the tonic-response duration and amplitude of simple and complex cells during different EEG states in control and experimental hemispheres. Bold type indicates samples with significant differences for EEG state (p < 0.001; one-sample Student's t test). The remaining samples did not differ significantly (p > 0.05). Differences between means for simple and complex cells during the same experimental situation did not reach significance level [p > 0.05; one-sample Student's t test (mean against Δ = 0) and U test]. Columns with bold type and columns shaded gray show significantly different samples (both with the same p level).
This was in sharp contrast to control cortices, in which the duration and amplitude of tonic responses were typically enhanced during the less synchronized EEG state [Fig. 6a,c, black bars, corresponding to 62 ± 12% longer duration (a) and 34 ± 8% higher amplitude (c)], consistent with previous reports (Ikeda and Wright, 1974; Livingstone and Hubel, 1981). Phasic responses were similar under both synchronized and less synchronized conditions (Fig. 6b).
From the examples above, we expected a change in the relation between response amplitude and RF width in the experimental cortices. Statistical analysis demonstrated that covariation of receptive-field width and amplitude occurred only in experimental hemispheres, whereas RF width remained independent of the response amplitude in controls. This overall result is depicted more completely and with more detail in the next figure panels. For statistical analysis, we measured receptive-field widths (absolute and normalized; see Materials and Methods) during the tonic responses. This was possible only for a subset of neurons, in which the receptive fields were sufficiently smooth. The covariation of absolute RF width and response amplitude was analyzed in Figure 6d by plotting the less syn/syn ratio of the absolute RF widths against the ratio of the corresponding response amplitudes. In cases of a covariation, one would expect most data points to lie in the concordant quadrants (both ratios below or above 1 of the plot). We found exactly this result in the experimental cortex. Significantly more of the data points in Fig. 6d are in the concordant quadrants (31/38; χ2 = 15.1; p < 0.001), demonstrating that RF widths scaled directly with amplitude. In control cortex, however, the observed amplitude increase during less synchronized EEG (Fig. 6c) was not typically accompanied by an increase in receptive field width; receptive fields in control cortex typically remained narrow. Therefore, the majority of data points in the controls lie in the discordant quadrant at the bottom right (15/23), although not significantly (χ2 = 2.1; p < 0.2). Only for much higher amplitudes during less syn compared with syn episodes (large values on the x-axis) did RF width tend to increase as well. In spite of these few cases, the linear regression still had a much lower slope in the control hemisphere (0.31 ± 0.15; stippled line) than in experimental cortices (0.60 ± 0.13). Moreover, only for the experimental hemispheres, there is a significant correlation (nonparametric according to Spearman, r = 0.65; p < 0.001), which is not found in the control cortices (r = 0.35; p = 0.10). Such exceptions were rare (as shown in Fig. 6e), and they did not affect the mean of the absolute tonic RF widths, which did not differ between the different states in either experimental (-5 ± 5%) or control hemispheres (+4 ± 9%). As expected, the normalized tonic RF widths differed strongly only in the control hemispheres; during less syn episodes, they were clearly narrower than during syn episodes (-27 ± 4%). This difference was completely absent in the experimental hemispheres (+3 ± 5%) (Fig. 6f).
The insets in Figure 6, a-c and e-f, summarize the findings: the normally observed EEG-dependent changes in cortical-response characteristics were eliminated in experimental cortices because of an increase in the duration (a) and amplitude (c) of neuronal responses during synchronized EEG, whereas their spatial selectivity was diminished simultaneously (f).
Table 1 summarizes the means and SEM for the samples shown in Figure 6 (except for d). For tonic-response duration and amplitude, Table 2 shows that simple and complex cells were affected almost in the same manner, but the increase of tonic visual activity in the lesioned hemisphere is on average somewhat stronger in simple cells. The differences in tonic-response amplitude and duration, however, do not differ significantly between simple and complex cells, both in control and experimental hemispheres.
dLGN data
As a control, we also performed recordings from 36 neurons in the dLGNs of two cats (18 pairs in experimental/control hemispheres), at or close to the injection sites as verified by stereotaxic coordinates and visual field positions. Similar to what was found for cortical responses, the geniculate visual responses also showed an increase in the tonic response component during syn episodes, leading to a loss of its normal EEG dependence (Sawai et al., 1988; Funke and Eysel, 1992) (Fig. 7). dLGN neurons of the control hemispheres showed the typical reduction in the tonic visual response component when the EEG changed from a less syn (Fig. 7c) to a more syn (a) pattern. In contrast, dLGN neurons recorded simultaneously from the experimental hemisphere did not show this strong reduction of the sustained light response (Fig. 7, compare g with e). Responses during less syn episodes appeared similar to those observed in the intact system with respect to duration and amplitude (Fig. 7, compare g with c). In addition, we observed a changed spike interval structure, predominantly a loss of the temporal precision of distinct spike interval modes normally observed in the tonic response during less syn episodes (Funke and Wörgötter, 1995; Funke et al., 1996). The inset diagram of Figure 7d shows two modes (arrows) in the interval distribution obtained from the tonic light response during the less syn state. These modes disappear during the syn state (Fig. 7b, inset). In a similar manner, we found that the modes became broader or merged to a single mode in the experimental hemispheres (Fig. 7f,h, insets). The broadening of these interval modes was more pronounced than after an acute silencing of the corticogeniculate feedback (Funke et al., 1996; Wörgötter et al., 1998a); in many cases, a complete loss of distinct modes was evident, preventing quantification of interval mode width in some cases (see below). In addition, we found a lower ratio of burst spikes versus single spikes in the experimental hemispheres (Fig. 7, compare large diagrams of f and h with those of b and d; short intraburst spike intervals are left of the vertical bar). Even during syn episodes, the ratio of short versus longer spike intervals was low in the experimental hemispheres, contrary to the normal situation in less activated states and after acute disruption of the corticogeniculate feedback (Wörgötter et al., 1998a). Mean spontaneous activity levels were somewhat higher in the experimental hemisphere for a few cells, but on average, the difference was not significant and cannot be the reason for the reduced ratio of burst spikes to single spikes.
Figure 7.

Effect of chronic elimination of corticogeniculate feedback on thalamic visual activity. Peristimulus-time histograms (top rows; a, c, e, g) and spike interval histograms (bottom rows; b, d, f, h) showing the temporal properties of light responses evoked in two dLGN relay cells during different states of the system (top set, syn state; bottom set, less syn state), one recorded from the control hemisphere (a-d) and one simultaneously recorded from the experimental hemisphere (e-h). A spot of light slightly larger than the receptive-field center of the dLGN cells was flashed for the time indicated by the horizontal bar below histogram (a). The spike interval histograms composed of bars were calculated for the entire activity during the recording episode for spike intervals between 1 and 30 msec. The four bins to the left of the vertical line dissecting the diagram correspond to spike intervals usually composing a burst (1-4 msec). The smaller inset diagrams (solid lines) show the spike interval distribution during the tonic part of the visual response, for intervals between 1 and 50 msec. Arrows in histogram d indicate two interval modes, as described by Funke and Wörgötter (1995). T, Time (length of interval). i, Shown are the positions of the tracer injections (gray dots), the center of laser application (black dot), and the area of the receptive field of the dLGN relay cell in the experimental hemisphere (rectangle) (the cell of the control hemisphere had an RF at a topographically corresponding position within the contralateral visual hemifield). Visual stimulation of the two RFs was performed in an interleaved manner. Scale in degrees of visual angle; VM, vertical meridian; HM, horizontal meridian.
Figure 8 summarizes the statistical analysis of the dLGN data. The mean ratio of tonic- to phasic-response amplitudes during the syn state clearly increases in the experimental hemispheres and approaches values usually obtained during less syn episodes in the control hemisphere (Fig. 8a). The ratio between less syn and syn states for this index is almost 1 in the experimental hemisphere and significantly smaller than the normal ratio obtained for the control hemispheres (Fig. 8b). For a subset of cells (n = 12 pairs in experimental and control hemisphere) that showed at least one clear mode in the spike interval distribution of the tonic response (Fig. 7d, inset diagram), we calculated the WHH of these modes. For the remaining cell pairs, either one or both cells of a pair did not show a clear mode in the interval distribution. In most cases, it was the cell of the experimental hemisphere that had a broad distribution without a distinct interval mode. Figure 8c demonstrates that mean WHH of modes calculated for the neurons of the experimental hemisphere is significantly broader than that of the neurons recorded from the control hemisphere during the less syn state. The WHH for the hemisphere with chronic elimination of corticogeniculate feedback is ∼50% larger than that of the control hemisphere. For comparison, the increase in WHH of interval modes was ∼25% after acute silencing of the corticogeniculate feedback (Funke and Wörgötter, 1995; Funke et al., 1996). To quantify the probability of high-frequency burst firing, we calculated the ratio of the number of interspike intervals of <5 msec to the number of spike intervals of ≥5 msec. Figure 8d shows two major findings: (1) the typically higher incidence for burst firing (higher ratio) during the syn state compared with that of the less syn state as seen in the control hemisphere is abolished in the experimental hemisphere, and (2) the likelihood of burst firing is generally reduced in the experimental hemisphere, with a reduction of 80% in the syn state and 65% in the less syn state, indicating that the thalamic neurons may be tonically depolarized and thus are not able anymore to achieve a state suitable for generating low-threshold calcium spike-carried bursts.
Figure 8.

Statistical analysis of the temporal structure of dLGN activity. a, Tonic/phasic ratio of light responses in control and experimental hemispheres in relation to the two system states of syn and less syn. b, The change of the tonic (ton.)/phasic (phas.) index with respect to EEG state. c, The mean WHH of spike interval modes during the tonic light response in control and experimental hemispheres. d, The ratio of spikes included in a burst (1-4 msec spike intervals) to single spikes (>5 msec spike intervals) in control and experimental hemispheres. For each cell pair (number of pairs analyzed is indicated at the bottom of histograms), one neuron was recorded from the unaffected hemisphere (control) while the other neuron was simultaneously recorded (with interleaved visual stimulation in the contralateral hemifield) from the experimental hemisphere. Asterisks indicate statistically significant differences between samples (*p < 0.05; **p < 0.01; Student's t test). Error bars indicate SEM.
Control experiments
Controls (sham controls) in which all of the experimental steps were performed except for initiation of targeted neuronal death showed the following: (1) no changes in cortical histology, compared with intact controls, (2) specifically, no change in the number of corticogeniculate neurons, and (3) no change in any electrophysiological parameter, compared with intact controls in dLGN and cortex.
In one experiment with induced apoptosis of corticogeniculate projection neurons, we made no single-unit recordings but local EEG recordings directly above the lesioned cortex, 4 mm anterior to the lesion within the same hemisphere (still area 17) and at a position opposite to the lesion within the control hemisphere. The EEG was recorded via small (<0.5 mm) silver-ball electrodes attached to the cortical surface. We made long-lasting recordings with the cat either in the dark or a dimmed room, or during full-field flicker stimulation. Neither the spectral power of the EEG nor the coherence of EEG waves were found to differ for the three recording sites (data not shown). For additional details, see Discussion.
Discussion
The combination of targeted neuronal apoptosis of corticogeniculate projection neurons with electrophysiological recording in visual cortex and thalamus made it possible for the first time to investigate directly whether elimination of a large proportion of the corticogeniculate projections would result in a loss of EEG-dependent response properties in the visual cortex itself. The approach of inducing targeted apoptotic neuronal death was established in mice (Macklis, 1993; Sheen and Macklis, 1994) but adaptation to cat neocortex was successful with regard to labeling efficiency (McCourt et al., 1986; Katz, 1987; Sheen and Macklis, 1995) and efficiency of induced neuronal apoptosis (Macklis, 1993; Sheen and Macklis, 1995; Scharff et al., 2000) when compared with rodent studies.
So far, the contribution of corticogeniculate feedback to state-dependent differences at the level of the dLGN has been documented only in acute experiments (Funke and Eysel, 1992; Wörgötter et al., 1998a). It has been found that acute elimination of the corticogeniculate feedback usually causes a decrease in geniculate visual responsiveness during less syn episodes, whereas its effects are less pronounced during syn states when responsiveness is already low. In strong contrast to these previous studies, the current report demonstrates that the chronic and highly selective elimination of this feedback circuitry leads to an increase in neuronal activity in the visual cortex (and the dLGN), evident primarily during states of synchronized EEG.
These results raise three major questions: (1) Why does elimination of corticogeniculate feedback lead to the abolition of state-dependent variations in visual responsiveness? (2) Why is there a response increase, despite the elimination of excitatory feedback? (3) What is the reason for the activity-dependent increase in receptive-field size in the experimental cortex?
First, it is likely that the observed loss of state dependence is the result of equally strong retinogeniculate signal transmission during syn and less syn episodes, attributable to either upregulated retinal input or other influences. The high retinogeniculate transfer ratio (Coenen and Vendrik, 1972) indicates that the efficiency of the retinal synapse is already high under normal conditions and cannot be substantially increased. This leads to tight coupling of the relatively sharp spike interval modes in retina and dLGN (Funke and Wörgötter, 1995). The broadening of the interval histograms observed here (Fig. 7) likely results from spurious additional action potentials of nonretinal origin, assuming that the membrane of dLGN neurons is tonically depolarized. Additional support for this idea arises from the substantially reduced number of high-frequency bursts in the dLGN. Normally, one finds many high-frequency bursts in dLGN responses to visual stimuli during syn EEG (Lu et al., 1992) (for review, see Sherman, 1996). This indicates prolonged hyperpolarization of the cell membrane, which is required to elicit low-threshold calcium spikes (LTS) as a result of deinactivating the responsible IT current (Suzuki and Rogawski, 1989; Lu et al., 1992). When analyzing dLGN responses in the treated cats, we found very few bursts even during the syn state. This suggests that the membrane potential was hardly ever hyperpolarized long enough to enable LTS-mediated spike bursts.
Second, previous studies investigating the effects of retinal deprivation demonstrated that the removal of excitatory input from the retina (deafferentation) leads to increased excitability of target neurons in dLGN and cortex (Eysel, 1979; Hendry and Jones, 1988; Kaas et al., 1990; Gilbert and Wiesel, 1992; Hendry and Miller, 1996; Gilbert, 1998; Eysel et al., 1999). This result has been interpreted as a compensatory reaction of the remaining network in response to the loss of its main excitatory input (Eysel, 1979). Evidence exists that this might be attributable to homeostatic mechanisms that influence the global postsynaptic sensitivity to maintain a constant spiking output (Frégnac, 1998; Turrigiano et al., 1998). Loss of numerous corticogeniculate synapses may elicit a compensatory overexpression of metabotropic glutamate receptors found at the corticogeniculate synapse (McCormick and von Krosigk, 1992; Rivadulla et al., 2002). Activation of these receptors reduces a potassium leak current, thereby causing depolarization of the cell membrane. Corticogeniculate inputs also target inhibitory neurons of dLGN and thalamic reticular nucleus (TRN) (Weber et al., 1989; Montero, 1991). Interestingly, both synaptic density (Weber et al., 1989) and synaptic strength (Golshani et al., 2001) seem to be higher for cortical synapses on inhibitory interneurons compared with dLGN relay cells. Removal of the corticogeniculate projection would, thus, more strongly weaken the inhibitory impact on dLGN relay cells than the facilitation by direct cortical inputs. The finding that thalamic relay cells in the lesioned hemisphere show a strongly reduced likelihood of generating bursts is a strong indication for failure of inhibitory interactions between the TRN and thalamic projection neurons. As discussed by Steriade (2000), this corticogeniculate loop is essential for the synchronization of slow thalamocortical rhythms, like δ waves. Elimination of the cortical input to TRN will disrupt this resonance loop but may also affect the state-dependent transmission of retinal signals.
Finally, modulatory inputs from the brainstem arousal centers might also come into play; however, this scenario is less likely, because these systems are not directly affected by our experimental procedures.
It is by now widely accepted that the interactions between thalamus, brainstem, and cortex are primarily responsible for the generation of the different EEG states, in part by influencing the response modes of thalamic cells. Intracortical mechanisms seem to be less important in this respect. This view is also supported here. The consistency of our results with the different mechanisms discussed above strongly suggests that effects occurring at the geniculate cells themselves are primarily responsible for the enhanced visual responsiveness during the syn state in cortex and dLGN. Intracortical plasticity reported by others (Kaas et al., 1990; Eysel et al., 1999) is expected to also occur under the experimental conditions reported here, but the increased excitability of dLGN neurons favors a thalamic process. Intracortical plasticity, however, may underlie the changed relationship between activity and receptive-field size of cortical neurons, as discussed below.
The change in EEG-dependent activity in thalamus and cortex implies that also the spectral composition and coherence of the EEG within the lesioned cortex may have changed. This, however, was actually not the case. The diameter of the EEG electrode above the lesioned cortex (<0.5 mm) should have been small enough compared with the diameter of the lesioned area of layer 6(∼1.9 mm) to detect local changes in activity. One explanation could be that the huge number of synapses that originate from lateral cortical projections and that are not affected by the lesion compensate for the loss of state-dependent oscillatory activity within the much smaller number of thalamic inputs to layers 4 and 6 of the lesioned site. Thus, the local cortical processing of visual activity in individual neurons seems to be affected, whereas the global generation of rhythmic activity patterns is not.
Third, why does RF size scale with tonic activity in experimental cortex, but not in control hemispheres, which operate essentially in an RF size-invariant condition? Here, it is more likely that cortical rather than thalamic mechanisms are involved, because dLGN neurons show little if any state-dependent changes in RF size (Hartveit et al., 1993; Suder et al., 2002). Furthermore, lateral inhibition in the dLGN itself (Tsumoto et al., 1978) is spatially too limited to cause the observed changes in cortical RF size. Thus, it seems that changes in the strength and/or spatial convergence of excitatory and inhibitory cortical inputs are likely to be the source of the reduced size invariance.
Layer 4 neurons have been shown to receive direct excitatory input from layer 6, which is less efficient than the input from other layer 4 neurons, but with a tendency for facilitation with repetitive input (Stratford et al., 1996; Tarczy-Hornoch et al., 1999). Using reversible inactivation of layer 6 with GABA injection, Bolz and Gilbert (Bolz and Gilbert, 1986; Bolz et al., 1989) demonstrated an inhibitory action of layer 6 on layer 4 and superficial layers to be responsible for the length tuning of the layer 4 neurons. It seems likely that the balance between intracortical excitation and inhibition has been disturbed by our experimental procedures, possibly with the final result of a reduced lateral inhibition in the cortical network. This is supported by findings showing that spatial RF properties in the intact cortex are independent of the level of activity (Sclar and Freeman, 1982; Skottun et al., 1986). Similar normalizing mechanisms may be involved in other RF properties like orientation tuning and local contrast adaptation (Heeger, 1992; Carandini and Ferster, 1997; Troyer et al., 1998; Sanchez-Vives et al., 2000). Lateral inhibition is one possible mechanism to achieve a narrow cortical RF width, even under high-activity conditions of a less synchronized EEG state.
Together, the experiments reported here demonstrate that selective chronic elimination of corticogeniculate feedback results in a loss of EEG-correlated differences in the remaining thalamocortical network, leading to a significant increase in excitability during syn EEG, at the expense of reduced spatial RF specificity in cortical neurons. Our results indicate that corticogeniculate feedback is critical for the establishment of differences in sensory processing, and that the observed changes are most likely related to a weakening of cortically driven inhibitory thalamic networks.
Footnotes
This work was supported by a collaborative grant from the Human Frontiers Science Program (F.W. and J.D.M.) and by a National Institute of Child Health and Human Development Mental Retardation Research Center grant (J.D.M.). Additional support was provided by grants from the National Institutes of Health (J.D.M.) and Deutsche Forschungsgemeinschaft (F.W. and K.F.). We thank Cindy C. Tai and Max Christian for excellent technical assistance, Nicolas Kerscher for experimental assistance, Ulf Eysel for helpful discussions, and Sanjay S. P. Magavi for helpful input from parallel mouse work.
Correspondence should be addressed to Dr. Klaus Funke, Department of Neurophysiology, Medical Faculty, Ruhr University Bochum, D-44780 Bochum, Germany. E-mail: funke@neurop.ruhr-uni-bochum.de.
D. Eyding's present address: PAION GmbH, Martinstrasse 10-12, D-52062 Aachen, Germany.
Copyright © 2003 Society for Neuroscience 0270-6474/03/237021-13$15.00/0
J.D.M., K.F., and F.W. contributed equally to this work.
References
- Baker FH, Malpeli JG ( 1977) Effects of cryogenic blockade of visual cortex on the responses of lateral geniculate neurons in the monkey. Exp Brain Res 29: 433-444. [DOI] [PubMed] [Google Scholar]
- Bolz J, Gilbert CD ( 1986) Generation of end-inhibition in the visual cortex via interlaminar connections. Nature 320: 362-365. [DOI] [PubMed] [Google Scholar]
- Bolz J, Gilbert CD, Wiesel TN ( 1989) Pharmacological analysis of cortical circuitry. Trends Neurosci 12: 292-296. [DOI] [PubMed] [Google Scholar]
- Carandini M, Ferster D ( 1997) A tonic hyperpolarization underlying contrast adaptation in cat visual cortex. Science 276: 949-952. [DOI] [PubMed] [Google Scholar]
- Coenen AML, Vendrik AJH ( 1972) Determination of the transfer ratio of cat's geniculate neurons through quasi-intracellular recordings and the relation with the level of alertness. Exp Brain Res 14: 227-242. [DOI] [PubMed] [Google Scholar]
- Eysel UT ( 1979) Maintained activity, excitation and inhibition of lateral geniculate neurons after monocular deafferentation in the adult cat. Brain Res 166: 259-271. [DOI] [PubMed] [Google Scholar]
- Eysel UT, Schweigart G, Mittmann T, Eyding D, Qu Y, Vandesande F, Orban G, Arckens L ( 1999) Reorganization in the visual cortex after retinal and cortical damage. Restor Neurol Neurosci 15: 153-164. [PubMed] [Google Scholar]
- Foote SL, Berridge CW, Adams LM, Pineda JA ( 1991) Electrophysiological evidence for the involvement of the locus coeruleus in alerting, orienting, and attending. Prog Brain Res 88: 521-532. [DOI] [PubMed] [Google Scholar]
- Frégnac Y ( 1998) Homeostasis or synaptic plasticity. Nature 391: 845-846. [DOI] [PubMed] [Google Scholar]
- Fricker-Gates RA, Shin JJ, Tai CC, Catapano LA, Macklis JD ( 2002) Late stage immature neocortical neurons reconstruct interhemispheric connections and form synaptic contacts with increased efficiency in adult mouse cortex undergoing targeted neurodegeneration. J Neurosci 22: 4045-4056. [DOI] [PMC free article] [PubMed] [Google Scholar]
- Funke K, Eysel UT ( 1992) EEG-dependent modulation of response dynamics of cat dLGN relay cells and the contribution of corticogeniculate feedback. Brain Res 573: 217-227. [DOI] [PubMed] [Google Scholar]
- Funke K, Wörgötter F ( 1995) Temporal structure in the light response of relay cells in the dorsal lateral geniculate nucleus of the cat. J Physiol (Lond) 485: 715-737. [DOI] [PMC free article] [PubMed] [Google Scholar]
- Funke K, Nelle E, Li B, Wörgötter F ( 1996) Corticofugal feedback improves the timing of retino-geniculate signal transmission. NeuroReport 7: 2130-2134. [DOI] [PubMed] [Google Scholar]
- Gilbert CD ( 1998) Adult cortical dynamics. Physiol Rev 78: 467-485. [DOI] [PubMed] [Google Scholar]
- Gilbert CD, Wiesel TN ( 1992) Receptive field dynamics in adult primary visual cortex. Nature 356: 150-152. [DOI] [PubMed] [Google Scholar]
- Golshani P, Liu XB, Jones EG ( 2001) Differences in quantal amplitude reflect GluR4-subunit number at corticothalamic synapses on two populations of thalamic neurons. Proc Natl Acad Sci USA 98: 4172-4177. [DOI] [PMC free article] [PubMed] [Google Scholar]
- Guillery RW, Herrup K ( 1997) Quantification without pontification: choosing a method for counting objects in sectioned tissues. J Comp Neurol 386: 2-7. [DOI] [PubMed] [Google Scholar]
- Hartveit E, Ramberg SI, Heggelund P ( 1993) Brain stem modulation of spatial receptive field properties of single cells in the dorsal lateral geniculate nucleus of the cat. J Neurophysiol 70: 1644-1655. [DOI] [PubMed] [Google Scholar]
- Heeger D ( 1992) Normalization of cell responses in cat striate cortex. Vis Neurosci 9: 181-198. [DOI] [PubMed] [Google Scholar]
- Hendry SH, Jones EG ( 1988) Activity-dependent regulation of GABA expression in the visual cortex of adult monkeys. Neuron 1: 701-712. [DOI] [PubMed] [Google Scholar]
- Hendry SH, Miller KL ( 1996) Selective expression and rapid regulation of GABAA receptor subunits in geniculocortical neurons of macaque dorsal lateral geniculate nucleus. Vis Neurosci 13: 223-235. [DOI] [PubMed] [Google Scholar]
- Ikeda H, Wright MJ ( 1974) Sensitivity of neurons in visual cortex (area 17) under different levels of anaesthesia. Exp Brain Res 20: 471-484. [DOI] [PubMed] [Google Scholar]
- Kaas JH, Krubitzer LA, Chino YM, Langston AL, Polley EH, Blair N ( 1990) Reorganization of retinotopic cortical maps in adult mammals after lesions of the retina. Science 248: 229-231. [DOI] [PubMed] [Google Scholar]
- Kalil RE, Chase R ( 1970) Corticofugal influence on activity of lateral geniculate neurons in the cat. J Neurophysiol 33: 459-474. [DOI] [PubMed] [Google Scholar]
- Katz LC ( 1987) Local circuitry of identified projection neurons in cat visual cortex brain slices. J Neurosci 7: 1223-1249. [DOI] [PMC free article] [PubMed] [Google Scholar]
- Li B, Funke K, Wörgötter F, Eysel UT ( 1999) Correlated variations in EEG pattern and visual responsiveness of cat lateral geniculate relay cells. J Physiol (Lond) 514: 857-874. [DOI] [PMC free article] [PubMed] [Google Scholar]
- Livingstone MS, Hubel DH ( 1981) Effects of sleep and arousal on the processing of visual information in the cat. Nature 291: 554-561. [DOI] [PubMed] [Google Scholar]
- Lu SM, Guido W, Sherman SM ( 1992) Effects of membrane voltage on receptive field properties of lateral geniculate neurons in the cat: contributions of the low-threshold Ca2+ conductance. J Neurophysiol 68: 2185-2198. [DOI] [PubMed] [Google Scholar]
- Lund JS, Henry GH, MacQueen CL, Harvey AR ( 1979) Anatomical organization of the primary visual cortex (area 17) of the cat. A comparison with area 17 of the macaque monkey. J Comp Neurol 184: 599-618. [DOI] [PubMed] [Google Scholar]
- Macklis JD ( 1993) Transplanted neocortical neurons migrate selectively into regions of neuronal degeneration produced by chromophore-targeted laser photolysis. J Neurosci 13: 3848-3863. [DOI] [PMC free article] [PubMed] [Google Scholar]
- Magavi SS, Leavitt BR, Macklis JD ( 2000) Induction of neurogenesis in the neocortex of adult mice. Nature 405: 951-955. [DOI] [PubMed] [Google Scholar]
- McClurkin JW, Optican LM, Richmond BJ ( 1994) Cortical feedback increases visual information transmitted by monkey parvocellular lateral geniculate nucleus neurons. Vis Neurosci 11: 601-617. [DOI] [PubMed] [Google Scholar]
- McCormick DA, von Krosigk M ( 1992) Corticothalamic activation modulates thalamic firing through glutamate “metabotropic” receptors. Proc Natl Acad Sci USA 89: 2774-2778. [DOI] [PMC free article] [PubMed] [Google Scholar]
- McCourt ME, Boyapati J, Henry GH ( 1986) Layering in lamina 6 of cat striate cortex. Brain Res 364: 181-185. [DOI] [PubMed] [Google Scholar]
- Montero VM ( 1991) A quantitative study of synaptic contacts on interneurons and relay cells of the cat lateral geniculate nucleus. Exp Brain Res 86: 257-270. [DOI] [PubMed] [Google Scholar]
- Munk MHJ, Roelfsema PR, Koenig P, Engel AK, Singer W ( 1996) Role of reticular activation in the modulation of intracortical synchronization. Science 272: 271-274. [DOI] [PubMed] [Google Scholar]
- Przybyszewski AW, Gaska JP, Foote W, Pollen DA ( 2000) Striate cortex increases contrast gain of macaque dLGN neurons. Vis Neurosci 17: 485-494. [DOI] [PubMed] [Google Scholar]
- Rivadulla C, Martinez LM, Varela C, Cudeiro J ( 2002) Completing the corticofugal loop: a visual role for the corticogeniculate type 1 metabotropic glutamate receptor. J Neurosci 22: 2956-2962. [DOI] [PMC free article] [PubMed] [Google Scholar]
- Sanchez-Vives MV, Nowak LG, McCormick DA ( 2000) Membrane mechanisms underlying contrast adaptation in cat area 17 in vivo. J Neurosci 20: 4267-4285. [DOI] [PMC free article] [PubMed] [Google Scholar]
- Sawai H, Morigiwa K, Fukuda Y ( 1988) Effects of EEG synchronization on visual responses of the cat's geniculate relay cells: a comparison among Y, X and W cells. Brain Res 455: 394-400. [DOI] [PubMed] [Google Scholar]
- Scharff C, Kirn J, Grossman M, Macklis JD, Nottebohm F ( 2000) Targeted neuronal death affects neuronal replacement and vocal behavior in adult songbirds. Neuron 25: 481-492. [DOI] [PubMed] [Google Scholar]
- Sclar G, Freeman RD ( 1982) Orientation selectivity in the cat's striate cortex is invariant with stimulus contrast. Exp Brain Res 46: 457-461. [DOI] [PubMed] [Google Scholar]
- Sheen VL, Macklis JD ( 1994) Apoptotic mechanisms in targeted neuronal cell death by chromophore-activated photolysis. Exp Neurol 130: 67-81. [DOI] [PubMed] [Google Scholar]
- Sheen VL, Macklis JD ( 1995) Targeted neocortical neuron cell death in adult mice guides migration and differentiation of transplanted embryonic neurons. J Neurosci 15: 8378-8392. [DOI] [PMC free article] [PubMed] [Google Scholar]
- Sherman SM ( 1996) Dual response modes in lateral geniculate neurons: mechanisms and functions. Vis Neurosci 13: 205-213. [DOI] [PubMed] [Google Scholar]
- Sherman SM, Guillery RW ( 2001) Exploring the thalamus. San Diego: Academic.
- Sherman SM, Koch C ( 1986) The control of retinogeniculate transmission in the mammalian lateral geniculate nucleus. Exp Brain Res 63: 1-20. [DOI] [PubMed] [Google Scholar]
- Shin JJ, Fricker-Gates RA, Perez FA, Leavitt BR, Zurakowski D, Macklis JD ( 2000) Transplanted neuroblasts differentiate appropriately into projection neurons with the correct neurotransmitter and receptor phenotype in neocortex undergoing targeted projection neuron neurodegeneration. J Neurosci 20: 7404-7416. [DOI] [PMC free article] [PubMed] [Google Scholar]
- Sillito AM, Cudeiro J, Murphy PC ( 1993) Orientation sensitive elements in the corticofugal influence on centre-surround interactions in the dorsal lateral geniculate nucleus. Exp Brain Res 93: 6-16. [DOI] [PubMed] [Google Scholar]
- Sillito AM, Jones HE, Gerstein GL, West DC ( 1994) Feature-linked synchronisation of thalamic relay cell firing induced by feedback from the visual cortex. Nature 369: 479-482. [DOI] [PubMed] [Google Scholar]
- Singer W, Tretter F, Cynader M ( 1976) The effect of reticular stimulation on spontaneous and evoked activity in the cat visual cortex. Brain Res 102: 71-90. [DOI] [PubMed] [Google Scholar]
- Skottun BC, Bradley A, Ramoa AS ( 1986) Effect of contrast on spatial frequency tuning of neurones in area 17 of cat's visual cortex. Exp Brain Res 63: 431-435. [DOI] [PubMed] [Google Scholar]
- Steriade M ( 1991) Alertness, quiet sleep, dreaming. In: Cerebral cortex 9 (Peters A, Jones EG, eds), pp. 279-357. New York, London: Plenum.
- Steriade M ( 2000) Corticothalamic resonance, states of vigilance and mentation. Neuroscience 101: 243-276. [DOI] [PubMed] [Google Scholar]
- Stratford KJ, Tarczy-Hornoch K, Martin KAC, Bannister NJ, Jack JJB ( 1996) Excitatory synaptic inputs to spiny stellate cells in cat visual cortex. Nature 382: 258-261. [DOI] [PubMed] [Google Scholar]
- Suder K, Funke K, Zhao Y, Kerscher NJ, Wenneckers T, Wörgötter F ( 2002) Spatial dynamics of receptive fields in cat primary visual cortex related to the temporal structure of thalamocortical feedforward activity. Experiments and models. Exp Brain Res 144: 430-444. [DOI] [PubMed] [Google Scholar]
- Suzuki S, Rogawski MA ( 1989) T-type calcium channels mediate the transition between tonic and phasic firing in thalamic neurons. Proc Natl Acad Sci USA 86: 7228-7232. [DOI] [PMC free article] [PubMed] [Google Scholar]
- Tarczy-Hornoch K, Martin KAC, Stratford KJ, Jack JJB ( 1999) Intracortical excitation of spiny neurons in layer 4 of cat striate cortex. Cereb Cortex 9: 833-843. [DOI] [PubMed] [Google Scholar]
- Troyer TW, Krukowski AE, Priebe NJ, Miller KD ( 1998) Contrast-invariant orientation tuning in cat visual cortex: thalamocortical input tuning and correlation-based intracortical connectivity. J Neurosci 18: 5908-5927. [DOI] [PMC free article] [PubMed] [Google Scholar]
- Tsumoto T, Creutzfeldt OD, Legendy CR ( 1978) Functional organization of the corticofugal system from visual cortex to lateral geniculate nucleus in the cat (with an appendix on geniculo-cortical mono-synaptic connections). Exp Brain Res 32: 345-364. [DOI] [PubMed] [Google Scholar]
- Turrigiano GG, Leslie KR, Desai NS, Rutherford LC, Nelson SB ( 1998) Activity-dependent scaling of quantal amplitude in neocortical neurons. Nature 391: 892-896. [DOI] [PubMed] [Google Scholar]
- Weber AJ, Kalil RE, Behan M ( 1989) Synaptic connections between corticogeniculate axons and interneurons in the dorsal lateral geniculate nucleus of the cat. J Comp Neurol 289: 156-164. [DOI] [PubMed] [Google Scholar]
- Wörgötter F, Nelle E, Li B, Funke K ( 1998a) The influence of corticofugal feedback on the temporal structure of visual responses of cat thalamic relay cells. J Physiol (Lond) 509: 797-815. [DOI] [PMC free article] [PubMed] [Google Scholar]
- Wörgötter F, Suder K, Zhao Y, Kerscher N, Eysel UT, Funke K ( 1998b) State-dependent receptive-field restructuring in the visual cortex. Nature 396: 165-168. [DOI] [PubMed] [Google Scholar]