

Introduction
It has been only a decade since functional magnetic resonance imaging (fMRI) was introduced, but approximately four fMRI papers are now published every working day. Here we review this progress in a well studied system: primate visual cortex.
From pseudocolor to action potentials, and back
One of the most pressing questions now is what does fMRI “activity” indicate, in terms of (electrical) neural activity (Logothetis et al., 2001). Current conclusions about the fMRI—electrophysiology relationship may change as data are acquired from brain areas beyond primary visual cortex, after testing additional stimuli and using different experimental designs and different species (Toth et al., 2001; Devor et al., 2002). Current evidence (Logothetis et al., 2001) suggests that hemodynamic (e.g., fMRI) responses are driven significantly by synaptic activity, rather than only spiking activity. To the extent that this is true, it will be difficult to directly translate fMRI activity into single unit predictions.
This is not a new issue: possible mismatches between single unit and functional mapping results have complicated the interpretation of previous data based on EEG, magneto-encephalography (MEG), deoxyglucose, and optical recording activity. However vexing such issues are, remember that any complete understanding of the brain will explain not only the spiking activity, but also the associated synaptic activity and the hemodynamic (fMRI) responses. Until then, a judicious choice of fMRI timing parameters may minimize spiking-synaptic discrepancies (Logothetis et al., 2001).
How can we interpret current fMRI results in visual cortex?
In some cases this spiking-synaptic distinction is moot, because no discrepancy is predicted. For instance, motion and direction selectivity are found in both single units and metabolic/hemodynamic maps (Zeki et al., 1991; Malonek et al., 1994; Tootell et al., 1995b; Geesaman et al., 1997; Vanduffel et al., 2001) within area MT. In general, any property that is calculated at previous neural levels (here, ascending direction-selective inputs from V1 and elsewhere) should be reflected in both synaptic and spiking measures.
In other cases, the predictions are more complex. For instance, maps of the averaged receptive field center at each sampled cortical location (i.e., cortical retinotopy) should be equivalent to each other, regardless of whether they are based on spiking activity (e.g., single units) or synaptic activity (e.g., hemodynamic maps). However, a related measure, receptive field size, may well differ in the two measures. The (presynaptic) measures of receptive field size could be smaller than the size revealed by (postsynaptic) single units in each area, because receptive field size generally expands at progressively higher-tier areas in the cortical visual hierarchy (Felleman and Van Essen, 1991). Alternatively, the metabolic measures could instead be larger than the single unit measures, because the metabolic maps reflect both excitation and inhibition plus hemodynamic or metabolic spread (Grinvald et al., 1994).
Which “primate” visual cortex?
Ten years ago, visual cortex was already well mapped in macaque monkeys. More than 25 areas had been differentiated, each with its own distinct connections and functional properties (Felleman and Van Essen, 1991). At the same time, human visual cortex was essentially terra incognita.
This information gap originated mostly from differing technical constraints. In macaques, visual cortex can be studied using highly informative (but invasive) techniques such as single unit recordings, neural tracers, lesions, microstimulation, histology, deoxyglucose, and optical recording. However, none of these techniques can be used routinely in humans. Instead, human studies relied on noninvasive techniques such as psychophysics, EEG, MEG, positron emission tomography (PET), and transcranial magnetic stimulation (TMS).
Because human results were based on quite different techniques than macaque results, a given mismatch between human and macaque data might arise from either evolutionary or technical differences; such comparisons were ultimately unresolvable. fMRI data has begun to resolve this ambiguity, because fMRI can be acquired from both humans and macaques, using identical experimental procedures. Follow-up experiments in macaque can clarify the single unit activity and the anatomical connections in each fMRI-activated region. Recent studies illustrate this approach (Tsao et al., 2000; Dubowitz et al., 2001; Vanduffel et al., 2001, 2002; Nakahara et al., 2002).
Mapping human visual areas
MRI has now revealed more than a dozen distinct areas in human visual cortex (Fig. 1). Considerable historical “baggage” (controversy) sometimes accompanies these naming and mapping efforts, especially when the data are murky and when the new human data reopen lingering questions in the macaque maps.
Figure 1.

Maps of reported areas in primate visual cortex. Maps are shown on the flattened cortical surface from right hemisphere (light gray, gyri; dark gray, sulci). A shows areas in macaque reported by Van Essen and colleagues, and B shows the macaque areas reported by Ungerleider and collaborators (adapted from Van Essen et al., 2001). C shows areas in human visual cortex, as described in the text. Consensus is highest in lower-tier (generally, left-most) areas; such areas tend to be evolutionarily more conserved, and the retinotopy is more easily resolved.
In macaques, visual cortical areas are distinguished by four main criteria (Felleman and Van Essen, 1991): (1) retinotopy, (2) global functional properties, (3) histology, and (4) intercortical connections. In humans, most visual cortical areas have been revealed by functional MRI, using retinotopic and global functional criteria. Recently, anatomical MRI has begun to reveal histological and connection distinctions between areas as well.
Retinotopy
V1 and V2
Lower-tier human areas revealed by the fMRI retinotopy have proven similar to those in macaque, especially V1 and V2 (Fig. 1). These lower-tier areas are evolutionarily conserved in most mammals (Rosa and Krubitzer, 1999; Vanduffel et al., 2002).
V3
An interesting evolutionary divergence occurs in area V3 (also known as V3 + VP). The retinotopy in macaque V3 is essentially equivalent to that in human V3, except for one feature. In human V3, the polar angle magnification matches that in adjacent V2. In macaque V3, however, this dimension is extremely compressed, distorting the area into a uniquely elongated topography (Fig. 1) (Tootell et al., 1997). It has been proposed that new retinotopic areas evolve by “budding” along the vertical or horizontal meridians; the dimensions of macaque V3 could reflect a middle stage in this evolutionary progression.
An old controversy in macaque is whether “V3” and “VP” are independent cortical areas (Burkhalter et al., 1986; Felleman and Van Essen, 1987) or two parts of a common area V3 (Gattass et al., 1988; Lyon and Kaas, 2001). Thus far, these two regions are functionally indistinguishable in the human fMRI, supporting the latter model.
V3A
The next most anterior area was given a misleadingly diminutive name (“V3a” for “V3 accessory”) because it was discovered between two neighbors (V3 and V4) that were already named (Zeki, 1978; Van Essen and Zeki, 1978). Nevertheless, V3a is an independent cortical area including a complete map of the contralateral hemifield (Gattass et al., 1988; Tootell et al., 1997), the functional importance of which is increasingly recognized.
In both macaque and humans, V3a has large receptive fields (Gattass et al., 1988; Tootell et al., 1997), which are involved in wide-field visual computations. Such calculations include processing of binocular disparity (Tsao et al., 2000; Backus et al., 2001), illusory contours (Mendola et al., 1999), and sideinhibition (Gaska et al., 1987).
In macaque, V3 is moderately motion and direction selective (Felleman and Van Essen, 1987; Vanduffel et al., 2001), but V3A is not (Gaska et al., 1987; Vanduffel et al., 2001). In humans, however, this relationship is reversed: V3A is moderately motion selective, whereas V3 is not (Tootell et al., 1997). Thus the retinotopy defining a region is not absolutely linked to the functional properties of that same region. When such properties differ, do we assume homology based on the retinotopic criteria or the functional criteria? Here the retinotopy appears more fundamental (conserved).
V4
Area “V4” is one of the most controversial areas in primate visual cortex. It was named originally in the macaque, for a paired representation of the contralateral upper and lower visual fields, in ventral and dorsal V4 (V4v and V4d), respectively (Van Essen and Zeki, 1978; Gattass et al., 1988). However, almost all studies of macaque V4 were actually done in V4d, because V4d is easily accessible, whereas V4v is not. Such ventral/dorsal distinctions would normally be moot; however, recent evidence suggests that “V4d” and “V4v” may actually be independent cortical areas, mistakenly considered together (Van Oostende et al., 1997; Nelissen et al., 2000; Tootell and Hadjikhani, 2001).
One investigator reported high color selectivity in single units from V4(d) (Zeki, 1973, 1980, 1983a,b), but more quantitative studies revealed no special color bias (Schein et al., 1982; Van Essen et al., 1981; Schein and Desimone, 1990). Moreover, lesions of macaque V4d do not compromise color vision (Walsh et al., 1992; Schiller, 1993; Walsh et al., 1993). Despite the marginal nature of this evidence, color selectivity was often attributed to V4. It was attractive to think of a color “center,” in the way that visual motion is selectively processed in area MT.
Independently, evidence was accumulating for a real color center in human visual cortex. The initial evidence came from clinical reports of color vision loss attributable to damage in ventral occipitotemporal cortex (“achromatopsia”) (Pearlman et al., 1979; Damasio et al., 1980; Zeki, 1990). Subsequent neuroimaging studies revealed high color selectivity and retinotopy in the same location, which was named V4 (Lueck et al., 1989; McKeefry and Zeki, 1997; Bartels and Zeki, 2000), “V8” (Hadjikhani et al., 1998; Tootell and Hadjikhani, 2001), or VO (Wandell, 1999). Additional satellite areas were activated by attention to color differences (Fig. 1) (Beauchamp et al., 1999; Bartels and Zeki, 2000).
The retinotopy of human “V8/V4/VO” (Hadjikhani et al., 1998; Bartels and Zeki, 2000), however, is completely unlike that reported in macaque V4. Furthermore, the human color areas are not located where V4 should be, on the basis of macaque maps (Fig. 1) (Hadjikhani et al., 1998). Instead, the human color areas correspond to the location of anterior areas TEO/TE in macaque maps (Fig. 1) (Hadjikhani et al., 1998; Tootell and Hadjikhani, 2001). Furthermore, lesions including macaque TEO/TE do produce significant deficits of color vision (macaque achromatopsia) (Heywood and Cowey, 1987; Heywood et al., 1988, 1992, 1995). Neuroimaging (Takechi et al., 1997; Vanduffel et al., 1997; Nelissen et al., 2003) and single unit (Komatsu et al., 1992; Komatsu and Ideura, 1993; Missal et al., 1997) studies also reveal colorrelated activity in these same macaque regions.
This evidence produced a new model in which color is selectively processed not in V4 but instead in or near TEO/TE. This model is topographically consistent across both humans and macaques (Fig. 1), and it matches the existing experimental data quite well.
Candidate retinotopic areas
An additional representation has been reported immediately anterior to V3A, named either “V7” (Tootell et al., 1998a) or “V3B” (Press et al., 2001). Retinotopic details of this area remain unclear, partly because this retinotopic representation is statistically noisy, and it has no certain counterpart in macaque (Fig. 1).
Single unit studies reported a consistent retinotopic organization in area MT in several primate species (Allman et al., 1973; Van Essen et al., 1981); however, it has been difficult to reveal retinotopy in human MT+. Instead, fMRI studies distinguished between presumptive areas MT versus MST in human MT+, on the basis of properties related to the classical contralateral retinotopy (Huk et al., 2002).
To reveal retinotopy in a given area, the stimuli must first activate the cells in that area. For example, Malach's group (Hasson et al., 2002) revealed gross retinotopic activation in lateral occipital (object-selective) cortex by using visual objects arranged as retinotopic stimuli. Earlier retinotopic stimuli (using simple geometrical stimuli) had apparently not activated the cells there. In retrospect, it may be oversimplistic to subdivide cortex into areas that are “retinotopic” versus “nonretinotopic.” This distinction now appears to be a continuum, not a dichotomy.
Sometimes, both cognitive and sensory factors need to be considered. After optimizing both the spatial attention and the sensory stimuli, Sereno et al. (2001) unveiled a new retinotopic area in parietal cortex, well beyond conventionally defined “visual” cortex. Conceptually, this is consistent with previous fMRI in occipital (visual) cortex. Typical maps of cortical retinotopy have been produced by manipulating sensory stimuli, without deliberately varying spatial attention (Engel et al., 1994; Sereno et al., 1995; Tootell et al., 1995b, 1997). However such “sensory” stimuli may also include exogenous attention cues. In fact, maps indistinguishable from cortical “retinotopy” were recently demonstrated in the reverse way, by instead manipulating spatial attention, without changing the sensory stimuli (Tootell et al., 1998a; Brefczynski and DeYoe, 1999; Gandhi et al., 1999; Martinez et al., 1999; Somers et al., 1999). Faced with this seeming equivalence in the sensory and spatial attention maps (“attentiontopy”), some investigators deliberately combined both factors to increase the signal strength of the resulting maps (DeYoe et al., 1996).
Global functional maps
MT/MST
Some visual cortical areas have been defined by differences in global functional properties (criteria 2, above). One example is human MT(+), which responds better to moving stimuli compared with stationary stimuli (Zeki et al., 1991; Dupont et al., 1994; Tootell et al., 1995b; Goebel et al., 1998; Sunaert et al., 1999). Several studies since distinguished between presumptive “MT” and “MST” in human “MT+,” on the basis of differences in higher-order motion processing (Neri et al., 1998; Dukelow et al., 2001). However, it is difficult to specify the exact size of areas revealed by global functional maps, because this depends on the experimental sensitivity and the threshold chosen, above an accepted minimum. This has been called the “iceberg” problem. Both icebergs and functional activity are visible only above a certain threshold, yet both reflect substantial subthreshold effects.
Lateral occipital complex
“LOc” is a “complex” of multiple areas in “lateral occipital” cortex that share a greater fMRI response to images of objects, compared with non-object controls (Malach et al., 1995; Grill-Spector et al., 2001). Results in LOc are consistent with earlier electrophysiology in comparable regions of the macaque (Vogels, 1999) and human PET studies (Sergent and Signoret, 1992; Kanwisher et al., 1996). Elegant fMRI refinements confirmed that parts of LOc are deeply involved in object recognition (Grill-Spector et al., 2000; James et al., 2000; Bar et al., 2001; Kourtzi and Kanwisher, 2001; Lerner et al., 2002). Such refinements also localized regions that generalize across lower-order visual cues including size, shape, and perhaps viewpoint (Grill-Spector et al., 1999; Vuilleumier et al., 2002) as one might expect in a truly “object-selective” computation. Figure 2 shows the correspondence of LOc in both human cortex and macaque cortex, using equivalent fMRI techniques in both species of awake, behaving primates.
Figure 2.
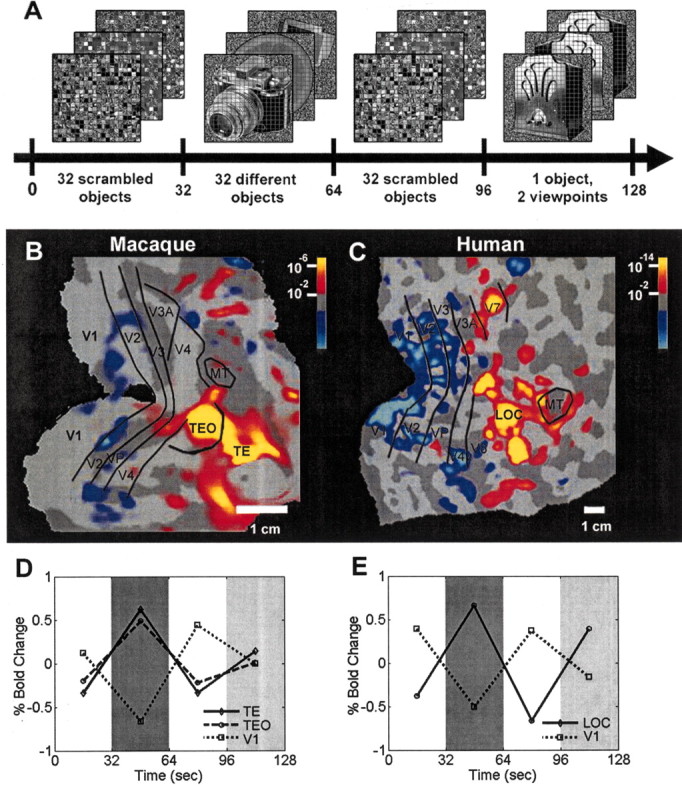
Object-selective (LOc) activation in visual cortex of macaques and humans. In both species, fMRI (BOLD) data were acquired from awake subjects, who fixated the center of a common stimulus set. A shows those stimuli, presented in block design in an a–b–a–c sequence (a, 32 grid-scrambled objects; b, 32 different objects; c, one object, presented in two different views). B (macaque) and C (human) reveal regions activated more by objects than scrambled objects (red-orange) and the reverse (blue-cyan). D (macaque) and E (human) show corresponding fMRI levels in selected visual areas. The human region activated more by objects (C) has been named LOc; it corresponds primarily to higher-tier cortical areas TEO and TE in macaque (B). In both species, lower-tier retinotopic areas (e.g., V1, V2, V3) responded better to the control images (scrambled objects), making the reversal in higher-tier areas even more significant. In human LOc and macaque TEO/TE, there was a reduced response to presentations of the single object (condition c, dark gray) compared with the multiple objects (condition b, light gray). Thus macaque shows fMRI-based adaptation in inferotemporal cortex, similar to that in humans. Bold, Blood oxygen level dependent.
One refinement exploited in LO studies was “fMR-A” (fMRI adaptation) (Grill-Spector and Malach, 2001). FMR-A assumes that brain regions will adapt (decrease fMRI response) to repeated presentations of stimuli that are neurally indistinguishable. Conversely, the fMRI signal will remain at higher levels when stimuli are neurally differentiable. Contemporary fMR-A approaches are rooted in earlier experiments showing adaptation to stimulus direction (Tootell et al., 1995a; Culham et al., 1999; He and MacLeod, 2001), color (Sakai et al., 1995; Hadjikhani et al., 1998), and orientation (Tootell et al., 1998b). Such adaptation techniques can even furnish quantitative (bandwidth) measurements of orientation selectivity (Tootell et al., 1998b).
Fusiform face area
Neuropsychology, direct electrical recordings (Allison et al., 1999; Bentin et al., 2002), and neuroimaging (Sergent and Signoret, 1992; Haxby et al., 1996; Puce et al., 1996) all suggest that a specific region in the fusiform gyrus responds selectively to images of faces. In a comprehensive study, Kanwisher et al. (1997) confirmed this face selectivity relative to a wide range of controls and named the region fusiform face area (FFA). This basic face/non-face distinction has been replicated consistently in many laboratories (Puce et al., 1996; Allison et al., 1999; Halgren et al., 1999; Haxby et al., 1999; Tong and Nakayama, 1999; Hoffman and Haxby, 2000; Hasson et al., 2001), a significant accomplishment in itself. Control experiments ruled out many competing interpretations of the “face-selective” activation, including attention, animate—inanimate distinctions, lower-level visual features (Kanwisher et al., 1997), and eye gaze (Hoffman and Haxby, 2000).
Recently, FFA has become the focus of a renewed nature—nurture debate (Kanwisher, 2000). Do the FFA responses reflect an innate predisposition to discriminate face stimuli because facial recognition has clear survival value in the social life of primates? This possibility is supported by “preferential looking” experiments in newborns (Johnson et al., 1991), and by neuropsychology (Le Grand et al., 2001).
Alternatively, perhaps the FFA is an “expertise” center, responding better to any overtrained visual stimuli, including (but not limited to) faces (Tarr and Gauthier, 2000). One notable study tested car stimuli versus bird stimuli in car experts versus bird experts: the overlearned stimuli did produce relatively more fMRI activity in FFA in observers of the matched category (Gauthier et al., 1999). This evidence for a learned component led Tarr and Gautier (2000) to reinterpret the name FFA as the “flexible fusiform area.”
Face selectivity has been reported in single units from macaque inferotemporal cortex (Gross et al., 1972; Perrett et al., 1982, 1984; Hietanen et al., 1992; Oram and Perrett, 1992; Rolls, 2000). It is tempting to conclude that these neurons were sampled from a hypothetical macaque FFA. In fact, functional imaging studies suggest that concentrated patches of face-selective cells do exist in macaque inferotemporal cortex (Fujita et al., 1992; Logothetis et al., 1999; Tsao et al., 2001). When not guided by functional anatomy, however, face-selective cells are found only rarely and not in a well defined cortical region (Perrett et al., 1982, 1984; Rolls, 2000). Moreover, such studies can be statistically misleading. If one face stimulus and nine control stimuli are tested, then on average, 1 in every 10 responsive cells will respond most to the face stimulus (be a “face-selective” cell), even in the absence of real face selectivity.
Parahippocampal place area
Several fMRI studies described stronger responses to images of places in human parahippocampal cortex (Epstein and Kanwisher, 1998; Maguire et al., 1998; Aguirre et al., 1999). This parahippocampal place area (PPA) activity appears to reflect the encoding of places in memory, not to place-related percepts per se (for review, see Kanwisher, 2000). The evidence for PPA is supported by reports of “place cells” in adjacent hippocampus (O'Keefe, 1979; Georges-Francois et al., 1999) and by neuropsychological patients with “topographic disorientation” associated with damage in parahippocampal cortex (Habib and Sirigu, 1987; Epstein and Kanwisher, 1998; Aguirre et al., 1999).
Extrastriate body area
Quite recently, Downing et al. (2001) described an area activated by images of non-face body parts. Although faces are also body parts, physically connected to adjacent body parts, the face-selective area (FFA) and the body-selective area [extrastriate body area (EBA)] are not adjacent in cortex (Fig. 1). Interestingly, EBA is instead located adjacent to motion-selective MT/MST, in or near region(s) reportedly activated by the perception of biological motion (Grossman et al., 2000).
Alternative perspectives
Presumably further “functional dissection” will clarify these and related issues. In functional mapping, first it is crucial to be able to activate a given area consistently, by any stimulus. After that, one can easily expand the range of stimuli to more accurately define what the target area “does.”
The notion of object- or category-specific areas is appealing but ultimately problematic. For instance, there are far more potential objects and categories than available cortex. Analogous issues have long dogged the interpretation of single unit data from macaque inferotemporal cortex (Barlow, 1972). Recently, Haxby et al. (2001) challenged the entire notion of “category-specific” areas in human object-selective cortex [but see Spiridon and Kanwisher (2002)G. On the basis of correlations, they found that the distributed pattern of response in LOc/FFA was sufficient to distinguish not only between faces and other objects, but between non-face objects as well. This distributed-activity model obviates some problems, but it does not yet unveil the fundamental selectivity of inferotemporal cortical neurons.
On the other hand, the evidence for some sort of object selectivity architecture here is overwhelming, even if we do not yet know what it is. In addition to the above categories, fMRI studies have reported inferotemporal regions selective for images of cars (Halgren et al., 1999), animals (Chao et al., 1999; Maguire et al., 2001), tools (Grill-Spector et al., 1999; Beauchamp et al., 2002), and letter-based stimuli (Puce et al., 1996; Fiez and Petersen, 1998; Hasson et al., 2002).
MRI mapping of cortical connections
To understand brain information processing, it is crucial to know which areas are connected to which. Such maps of anatomical connections can also distinguish between cortical visual areas (criteria 3, above); this is especially important when such areas cannot be functionally distinguished. In macaque, maps of connections are quite detailed (Felleman and Van Essen, 1991; Young, 1992). However, these classical tract-tracing experiments require extensive histology and sampling from many animals.
MR-visible tracer injections
An alternative MR-based approach may reduce these problems. By injecting MR-visualizable compounds, it is possible to trace neural connections without histology (Saleem et al., 2002). Such MR tracing allows multiple deliberate injections, at sites of interesting function or anatomy. This approach can also reveal the route taken by fibers between interconnected areas. Such route information is not furnished by conventional tracers, and it is crucial for interpreting MR diffusion “tracing” data (see below). Unfortunately, this promising approach is no help in human brain, because tracer injections are invasive.
Diffusion tensor imaging
Perhaps human brain connections can be resolved by measuring the diffusion signal in MR images (for review, see Le Bihan et al., 2001). Basically, axons constrain the flow of fluids around and inside them, producing freer diffusion parallel with long axis of the axon. MR imaging can resolve such diffusion anisotropies, but the underlying biophysics is complicated (Norris, 2001).
Diffusion imaging has labeled large and expected connections in human visual cortex (Conturo et al., 1999). Although impressive, such solutions can be unstable: seeding an adjacent voxel can yield very different solutions. It is now crucial to test for unknown neural connections, including error bars or other measures of variability, and to validate diffusion data using classical tracing techniques in the same brains. Moreover, most diffusion approaches (diffusion tensor imaging) cannot disentangle fiber pathways crossing within a voxel (Tuch et al., 2001), and fibers cross often in human brain.
The ultimate question is whether maps of gross diffusion anisotropy can reveal specific (labeled line) connections. Diffusion tracing is like mapping the flow of traffic on major highways: can this ever reveal exactly where a specific car began and ended its trip (J. Culham, personal communication)? Despite these limitations (or because of them), improvements in diffusion mapping have been rapid and significant.
TMS/electrocortical stimulation and PET/fMRI
Another approach to mapping human connections is to combine functional mapping with localized neural stimulation. For instance, Paus et al. (1997) stimulated frontal eye fields using TMS, and PET mapping exposed the resultant activation in parietal cortex. Such approaches might clarify connections to and from lateral and superior visual cortex, but several technical problems (localizing stimulated cortex, stimulating deeply buried regions) must first be resolved. It is more difficult to combine electromagnetic stimulation with fMRI [but see Brandt et al. (2001)].
“Functional” connections
Human neural connections might also be inferred from generalized patterns of functional activity (for review, see Buchel et al., 1999; McIntosh, 1999). This approach is appealingly straightforward, but it requires validation in animal models before the human results can be evaluated.
MRI mapping of histological differences
Cortical areas can also be distinguished by histological differences (criteria 4, above), and MR may reveal some of these noninvasively. For example, the obvious laminar differences in myelination in V1 are now imaged almost routinely (Barbier et al., 2002). On the basis of histological studies, myelin-sensitive imaging could eventually distinguish subtler differences in areas V2 (Tootell et al., 1983; Rosa and Krubitzer, 1999), V3 (Burkhalter et al., 1986), V3A (Lewis and Van Essen, 2000), MT (Allman et al., 1973; Van Essen et al., 1981; Tootell et al., 1985), and LIP/VIP (Blatt et al., 1990) and specific parietal areas (Lewis and Van Essen, 2000). Sophisticated analysis of MR images can also reveal quantitative differences in cortical thickness (Fischl et al., 2002); some areas (e.g., V1) are thinner than surrounding areas.
Conclusions
The macaque brain is often described as a “model” for the human brain, but this is somewhat misleading. The macaque belongs to a completely different zoological family (Cercopithecidae) than humans (Hominidae), reflecting independent evolution over several million generations. The macaque model brain is not just a miniaturized version of the human brain, like a toy car or a doll. Thus studying human brain function is not just an exercise in confirming what is already known from animal studies.
Generally, macaque and human brains differ most in higher-order cortical regions and remain more similar in lowest-tier areas. In terms of cortical surface area, higher-order parietal, temporal, and frontal regions are disproportionately expanded in human cortex, compared with corresponding cortical regions in macaque (Eidelberg and Galaburda, 1984; Van Essen et al., 2001; Simon et al., 2002). In lower-tier areas, this relationship is correspondingly reversed: the percentage of demonstrably visual cortex is ∼ 55% in macaques (Van Essen et al., 2001) but only ∼ 30% in humans.
Within visual cortex, all known mammals have a primary (V1) area, and primates also have a presumptive V2 homolog (Rosa and Krubitzer, 1999). However after that (i.e., in most visual areas), this one-to-one correspondence breaks down. For instance, third- and fourth-tier cortical visual areas in Aotus and Macaque monkeys are so dissimilar that their relative homology is uncertain (Baker et al., 1981; Kaas and Lyon, 2001). However, this evolutionary divergence is not always related to cortical hierarchical level: the fifth-tier area MT/V5 seems essentially conserved across all known primates, including humans and macaques.
The level of accepted evolutionary similarity between possibly homologous cortical regions is likely to decrease (not increase) as we learn more. It is easy to assume that macaque area X is equivalent to human region Y, if almost nothing is known about region Y. However, further study will (by definition) reveal more detailed features, any of which may differ across species.
When biological regions and mechanisms do correspond in both macaques and humans, it becomes possible to test all of the transitive links to understand the system at a very deep level (i.e., human psychophysics <> human fMRI <> macaque fMRI <> macaque single units/connections). This is a very exciting approach, which should yield real advances in the near future.
But what about those regions that do not correspond in humans and macaques? For example, recent evidence indicates that motion selectivity differs significantly in area V3A of macaques versus humans (Tootell et al., 1997; Vanduffel et al., 2001). Ironically, this makes it more difficult to study motion selectivity in V3A, at least as a common mechanism in primate cortex. This problem becomes even worse (although more widely recognized) in higher-order cortical regions concerned with language and other “uniquely human” functions. When confronted with such frank discrepancies, our best hope is that (1) insights from “basic” lower-tier mechanisms will generalize to higher-tier mechanisms and (2) new noninvasive techniques will be developed to close the gap further.
Footnotes
Correspondence should be addressed to Dr. Roger Tootell, MGH NMR Center, 149 13th Street, Charlestown, MA 02129. E-mail: tootell@nmr.mgh.harvard.edu.
Copyright © 2003 Society for Neuroscience 0270-6474/03/233981-09$15.00/0
References
- Aguirre GK, Singh R, D'Esposito M ( 1999) Stimulus inversion and the responses of face and object-sensitive cortical areas. NeuroReport 10: 189–194. [DOI] [PubMed] [Google Scholar]
- Allison T, Puce A, Spencer DD, McCarthy G ( 1999) Electrophysiological studies of human face perception. I: Potentials generated in occipitotemporal cortex by face and non-face stimuli. Cereb Cortex 9: 415–430. [DOI] [PubMed] [Google Scholar]
- Allman JM, Kaas JH, Lane RH ( 1973) The middle temporal visual area (MT) in the bushbaby, Galago senegalensis Brain Res 57: 197–202. [DOI] [PubMed] [Google Scholar]
- Backus BT, Fleet DJ, Parker AJ, Heeger DJ ( 2001) Human cortical activity correlates with stereoscopic depth perception. J Neurophysiol 86: 2054–2068. [DOI] [PubMed] [Google Scholar]
- Baker JF, Petersen SE, Newsome WT, Allman JM ( 1981) Visual response properties of neurons in four extrastriate visual areas of the owl monkey (Aotus trivirgatus): a quantitative comparison of medial, dorsomedial, dorsolateral, and middle temporal areas. J Neurophysiol 45: 397–416. [DOI] [PubMed] [Google Scholar]
- Bar M, Tootell RB, Schacter DL, Greve DN, Fischl B, Mendola JD, Rosen BR, Dale AM ( 2001) Cortical mechanisms specific to explicit visual object recognition. Neuron 29: 529–535. [DOI] [PubMed] [Google Scholar]
- Barbier EL, Marrett S, Danek A, Vortmeyer A, van Gelderen P, Duyn J, Bandettini P, Grafman J, Koretsky AP ( 2002) Imaging cortical anatomy by high-resolution MR at 3.0 T: detection of the stripe of Gennari in visual area 17. Magn Reson Med 48: 735–738. [DOI] [PubMed] [Google Scholar]
- Barlow HB ( 1972) Single units and sensation: a neuron doctrine for perceptual psychology? Perception 1: 371–394. [DOI] [PubMed] [Google Scholar]
- Bartels A, Zeki S ( 2000) The architecture of the colour centre in the human visual brain: new results and a review. Eur J Neurosci 12: 172–193. [DOI] [PubMed] [Google Scholar]
- Beauchamp MS, Haxby JV, Jennings JE, DeYoe EA ( 1999) An fMRI version of the Farnsworth-Munsell 100-Hue test reveals multiple color-selective areas in human ventral occipitotemporal cortex. Cereb Cortex 9: 257–263. [DOI] [PubMed] [Google Scholar]
- Beauchamp MS, Lee KE, Haxby JV, Martin A ( 2002) Parallel visual motion processing streams for manipulable objects and human movements. Neuron 34: 149–159. [DOI] [PubMed] [Google Scholar]
- Bentin S, Sagiv N, Mecklinger A, Friederici A, von CY ( 2002) Priming visual face-processing mechanisms: electrophysiological evidence. Psychol Sci 13: 190–193. [DOI] [PubMed] [Google Scholar]
- Blatt GJ, Andersen RA, Stoner GR ( 1990) Visual receptive field organization and cortico-cortical connections of the lateral intraparietal area (area LIP) in the macaque. J Comp Neurol 299: 421–445. [DOI] [PubMed] [Google Scholar]
- Brandt SA, Brocke J, Roricht S, Ploner CJ, Villringer A, Meyer BU ( 2001) In vivo assessment of human visual system connectivity with transcranial electrical stimulation during functional magnetic resonance imaging. NeuroImage 14: 366–375. [DOI] [PubMed] [Google Scholar]
- Brefczynski JA, DeYoe EA ( 1999) A physiological correlate of the “spotlight” of visual attention. Nat Neurosci 2: 370–374. [DOI] [PubMed] [Google Scholar]
- Buchel C, Coull JT, Friston KJ ( 1999) The predictive value of changes in effective connectivity for human learning. Science 283: 1538–1541. [DOI] [PubMed] [Google Scholar]
- Burkhalter A, Felleman DJ, Newsome WT, Van Essen DC ( 1986) Anatomical and physiological asymmetries related to visual areas V3 and VP in macaque extrastriate cortex. Vision Res 26: 63–80. [DOI] [PubMed] [Google Scholar]
- Chao LL, Haxby JV, Martin A ( 1999) Attribute-based neural substrates in temporal cortex for perceiving and knowing about objects. Nat Neurosci 2: 913–919. [DOI] [PubMed] [Google Scholar]
- Conturo TE, Lori NF, Cull TS, Akbudak E, Snyder AZ, Shimony JS, McKinstry RC, Burton H, Raichle ME ( 1999) Tracking neuronal fiber pathways in the living human brain. Proc Natl Acad Sci USA 96: 10422–10427. [DOI] [PMC free article] [PubMed] [Google Scholar]
- Culham JC, Dukelow SP, Vilis T, Hassard FA, Gati JS, Menon RS, Goodale MA ( 1999) Recovery of fMRI activation in motion area MT following storage of the motion aftereffect. J Neurophysiol 81: 388–393. [DOI] [PubMed] [Google Scholar]
- Damasio A, Yamada T, Damasio H, Corbett J, McKee J ( 1980) Central achromatopsia: behavioral, anatomic, and physiologic aspects. Neurology 30: 1064–1071. [DOI] [PubMed] [Google Scholar]
- Devor A, Andermann ML, Dunn AK, Ulbert I, Boas DA, Dale AM ( 2002) Coupling of hemodynamic and neuronal activity in rat somatosensory cortex. Soc Neurosci Abstr 32: 651.4. [Google Scholar]
- DeYoe EA, Carman GJ, Bandettini P, Glickman S, Wieser J, Cox R, Miller D, Neitz J ( 1996) Mapping striate and extrastriate visual areas in human cerebral cortex. Proc Natl Acad Sci USA 93: 2382–2386. [DOI] [PMC free article] [PubMed] [Google Scholar]
- Downing PE, Jiang Y, Shuman M, Kanwisher N ( 2001) A cortical area selective for visual processing of the human body. Science 293: 2470–2473. [DOI] [PubMed] [Google Scholar]
- Dubowitz DJ, Chen DY, Atkinson DJ, Scadeng M, Martinez A, Andersen MB, Andersen RA, Bradley WG Jr ( 2001) Direct comparison of visual cortex activation in human and non-human primates using functional magnetic resonance imaging. J Neurosci Methods 107: 71–80. [DOI] [PubMed] [Google Scholar]
- Dukelow SP, DeSouza JF, Culham JC, van den Berg AV, Menon RS, Vilis T ( 2001) Distinguishing subregions of the human MT+ complex using visual fields and pursuit eye movements. J Neurophysiol 86: 1991–2000. [DOI] [PubMed] [Google Scholar]
- Dupont P, Orban GA, De Bruyn B, Verbruggen A, Mortelmans L ( 1994) Many areas in the human brain respond to visual motion. J Neurophysiol 72: 1420–1424. [DOI] [PubMed] [Google Scholar]
- Eidelberg D, Galaburda AM ( 1984) Inferior parietal lobule. Divergent architectonic asymmetries in the human brain. Arch Neurol 41: 843–852. [DOI] [PubMed] [Google Scholar]
- Engel SA, Rumelhart DE, Wandell BA, Lee AT, Glover GH, Chichilnisky EJ, Shadlen MN ( 1994) fMRI of human visual cortex. Nature 369: 525. [DOI] [PubMed] [Google Scholar]
- Epstein R, Kanwisher N ( 1998) A cortical representation of the local visual environment. Nature 392: 598–601. [DOI] [PubMed] [Google Scholar]
- Felleman DJ, Van Essen DC ( 1987) Receptive field properties of neurons in area V3 of macaque monkey extrastriate cortex. J Neurophysiol 57: 889–920. [DOI] [PubMed] [Google Scholar]
- Felleman DJ, Van Essen DC ( 1991) Distributed hierarchical processing in the primate cerebral cortex. Cereb Cortex 1: 1–47. [DOI] [PubMed] [Google Scholar]
- Fiez JA, Petersen SE ( 1998) Neuroimaging studies of word reading. Proc Natl Acad Sci USA 95: 914–921. [DOI] [PMC free article] [PubMed] [Google Scholar]
- Fischl B, Salat DH, Busa E, Albert M, Dieterich M, Haselgrove C, van der KA, Killiany R, Kennedy D, Klaveness S, Montillo A, Makris N, Rosen B, Dale AM ( 2002) Whole brain segmentation: automated labeling of neuroanatomical structures in the human brain. Neuron 33: 341–355. [DOI] [PubMed] [Google Scholar]
- Fujita I, Tanaka K, Ito M, Cheng K ( 1992) Columns for visual features of objects in monkey inferotemporal cortex. Nature 360: 343–346. [DOI] [PubMed] [Google Scholar]
- Gandhi SP, Heeger DJ, Boynton GM ( 1999) Spatial attention affects brain activity in human primary visual cortex. Proc Natl Acad Sci USA 96: 3314–3319. [DOI] [PMC free article] [PubMed] [Google Scholar]
- Gaska JP, Jacobson LD, Pollen DA ( 1987) Response suppression by extending sine-wave gratings within the receptive fields of neurons in visual cortical area V3A of the macaque monkey. Vision Res 27: 1687–1692. [DOI] [PubMed] [Google Scholar]
- Gattass R, Sousa AP, Gross CG ( 1988) Visuotopic organization and extent of V3 and V4 of the macaque. J Neurosci 8: 1831–1845. [DOI] [PMC free article] [PubMed] [Google Scholar]
- Gauthier I, Tarr MJ, Anderson AW, Skudlarski P, Gore JC ( 1999) Activation of the middle fusiform “face area” increases with expertise in recognizing novel objects. Nat Neurosci 2: 568–573. [DOI] [PubMed] [Google Scholar]
- Geesaman BJ, Born RT, Andersen RA, Tootell RB ( 1997) Maps of complex motion selectivity in the superior temporal cortex of the alert macaque monkey: a double-label 2-deoxyglucose study. Cereb Cortex 7: 749–757. [DOI] [PubMed] [Google Scholar]
- Georges-Francois P, Rolls ET, Robertson RG ( 1999) Spatial view cells in the primate hippocampus: allocentric view not head direction or eye position or place. Cereb Cortex 9: 197–212. [DOI] [PubMed] [Google Scholar]
- Goebel R, Khorram-Sefat D, Muckli L, Hacker H, Singer W ( 1998) The constructive nature of vision: direct evidence from functional magnetic resonance imaging studies of apparent motion and motion imagery. Eur J Neurosci 10: 1563–1573. [DOI] [PubMed] [Google Scholar]
- Grill-Spector K, Malach R ( 2001) fMR-adaptation: a tool for studying the functional properties of human cortical neurons. Acta Psychol 107: 293–321. [DOI] [PubMed] [Google Scholar]
- Grill-Spector K, Kushnir T, Edelman S, Avidan G, Itzchak Y, Malach R ( 1999) Differential processing of objects under various viewing conditions in the human lateral occipital complex. Neuron 24: 187–203. [DOI] [PubMed] [Google Scholar]
- Grill-Spector K, Kushnir T, Hendler T, Malach R ( 2000) The dynamics of object-selective activation correlate with recognition performance in humans. Nat Neurosci 3: 837–843. [DOI] [PubMed] [Google Scholar]
- Grill-Spector K, Kourtzi Z, Kanwisher N ( 2001) The lateral occipital complex and its role in object recognition. Vision Res 41: 1409–1422. [DOI] [PubMed] [Google Scholar]
- Grinvald A, Lieke EE, Frostig RD, Hildesheim R ( 1994) Cortical pointspread function and long-range lateral interactions revealed by real-time optical imaging of macaque monkey primary visual cortex. J Neurosci 14: 2545–2568. [DOI] [PMC free article] [PubMed] [Google Scholar]
- Gross CG, Rocha-Miranda CE, Bender DB ( 1972) Visual properties of neurons in inferotemporal cortex of the macaque. J Neurophysiol 35: 96–111. [DOI] [PubMed] [Google Scholar]
- Grossman E, Donnelly M, Price R, Pickens D, Morgan V, Neighbor G, Blake R ( 2000) Brain areas involved in perception of biological motion. J Cognit Neurosci 12: 711–720. [DOI] [PubMed] [Google Scholar]
- Habib M, Sirigu A ( 1987) Pure topographical disorientation: a definition and anatomical basis. Cortex 23: 73–85. [DOI] [PubMed] [Google Scholar]
- Hadjikhani N, Liu AK, Dale AM, Cavanagh P, Tootell RB ( 1998) Retinotopy and color sensitivity in human visual cortical area V8. Nat Neurosci 1: 235–241. [DOI] [PubMed] [Google Scholar]
- Halgren E, Dale AM, Sereno MI, Tootell RB, Marinkovic K, Rosen BR ( 1999) Location of human face-selective cortex with respect to retinotopic areas. Hum Brain Mapp 7: 29–37. [DOI] [PMC free article] [PubMed] [Google Scholar]
- Hasson U, Hendler T, Ben Bashat D, Malach R ( 2001) Vase or face? A neural correlate of shape-selective grouping processes in the human brain. J Cognit Neurosci 13: 744–753. [DOI] [PubMed] [Google Scholar]
- Hasson U, Levy I, Behrmann M, Hendler T, Malach R ( 2002) Eccentricity bias as an organizing principle for human high-order object areas. Neuron 34: 479–490. [DOI] [PubMed] [Google Scholar]
- Haxby JV, Ungerleider LG, Horwitz B, Maisog JM, Rapoport SI, Grady CL ( 1996) Face encoding and recognition in the human brain. Proc Natl Acad Sci USA 93: 922–927. [DOI] [PMC free article] [PubMed] [Google Scholar]
- Haxby JV, Ungerleider LG, Clark VP, Schouten JL, Hoffman EA, Martin A ( 1999) The effect of face inversion on activity in human neural systems for face and object perception. Neuron 22: 189–199. [DOI] [PubMed] [Google Scholar]
- Haxby JV, Gobbini MI, Furey ML, Ishai A, Schouten JL, Pietrini P ( 2001) Distributed and overlapping representations of faces and objects in ventral temporal cortex. Science 293: 2425–2430. [DOI] [PubMed] [Google Scholar]
- He S, MacLeod DI ( 2001) Orientation-selective adaptation and tilt aftereffect from invisible patterns. Nature 411: 473–476. [DOI] [PubMed] [Google Scholar]
- Heywood CA, Cowey A ( 1987) On the role of cortical area V4 in the discrimination of hue and pattern in macaque monkeys. J Neurosci 7: 2601–2617. [DOI] [PMC free article] [PubMed] [Google Scholar]
- Heywood CA, Shields C, Cowey A ( 1988) The involvement of the temporal lobes in colour discrimination. Exp Brain Res 71: 437–441. [DOI] [PubMed] [Google Scholar]
- Heywood CA, Gadotti A, Cowey A ( 1992) Cortical area V4 and its role in the perception of color. J Neurosci 12: 4056–4065. [DOI] [PMC free article] [PubMed] [Google Scholar]
- Heywood CA, Gaffan D, Cowey A ( 1995) Cerebral achromatopsia in monkeys. Eur J Neurosci 7: 1064–1073. [DOI] [PubMed] [Google Scholar]
- Hietanen JK, Perrett DI, Oram MW, Benson PJ, Dittrich WH ( 1992) The effects of lighting conditions on responses of cells selective for face views in the macaque temporal cortex. Exp Brain Res 89: 157–171. [DOI] [PubMed] [Google Scholar]
- Hoffman EA, Haxby JV ( 2000) Distinct representations of eye gaze and identity in the distributed human neural system for face perception. Nat Neurosci 3: 80–84. [DOI] [PubMed] [Google Scholar]
- Huk AC, Dougherty RF, Heeger DJ ( 2002) Retinotopy and functional subdivision of human areas MT and MST. J Neurosci 22: 7195–7205. [DOI] [PMC free article] [PubMed] [Google Scholar]
- James TW, Humphrey GK, Gati JS, Menon RS, Goodale MA ( 2000) The effects of visual object priming on brain activation before and after recognition. Curr Biol 10: 1017–1024. [DOI] [PubMed] [Google Scholar]
- Johnson MH, Dziurawiec S, Ellis H, Morton J ( 1991) Newborns' preferential tracking of face-like stimuli and its subsequent decline. Cognition 40: 1–19. [DOI] [PubMed] [Google Scholar]
- Kaas JH, Lyon DC ( 2001) Visual cortex organization in primates: theories of V3 and adjoining visual areas. Prog Brain Res 134: 285–295. [DOI] [PubMed] [Google Scholar]
- Kanwisher N ( 2000) Domain specificity in face perception. Nat Neurosci 3: 759–763. [DOI] [PubMed] [Google Scholar]
- Kanwisher N, Chun MM, McDermott J, Ledden PJ ( 1996) Functional imaging of human visual recognition. Brain Res Cogn Brain Res 5: 55–67. [DOI] [PubMed] [Google Scholar]
- Kanwisher N, McDermott J, Chun MM ( 1997) The fusiform face area: a module in human extrastriate cortex specialized for face perception. J Neurosci 17: 4302–4311. [DOI] [PMC free article] [PubMed] [Google Scholar]
- Komatsu H, Ideura Y ( 1993) Relationships between color, shape, and pattern selectivities of neurons in the inferior temporal cortex of the monkey. J Neurophysiol 70: 677–694. [DOI] [PubMed] [Google Scholar]
- Komatsu H, Ideura Y, Kaji S, Yamane S ( 1992) Color selectivity of neurons in the inferior temporal cortex of the awake macaque monkey. J Neurosci 12: 408–424. [DOI] [PMC free article] [PubMed] [Google Scholar]
- Kourtzi Z, Kanwisher N ( 2001) Representation of perceived object shape by the human lateral occipital complex. Science 293: 1506–1509. [DOI] [PubMed] [Google Scholar]
- Le Bihan D, Mangin JF, Poupon C, Clark CA, Pappata S, Molko N, Chabriat H ( 2001) Diffusion tensor imaging: concepts and applications. J Magn Reson Imaging 13: 534–546. [DOI] [PubMed] [Google Scholar]
- Le Grand R, Mondloch CJ, Maurer D, Brent HP ( 2001) Neuroperception. Early visual experience and face processing. Nature 410: 890. [DOI] [PubMed] [Google Scholar]
- Lerner Y, Hendler T, Malach R ( 2002) Object-completion effects in the human lateral occipital complex. Cereb Cortex 12: 163–177. [DOI] [PubMed] [Google Scholar]
- Lewis JW, Van Essen DC ( 2000) Mapping of architectonic subdivisions in the macaque monkey, with emphasis on parieto-occipital cortex. J Comp Neurol 428: 79–111. [DOI] [PubMed] [Google Scholar]
- Logothetis NK, Guggenberger H, Peled S, Pauls J ( 1999) Functional imaging of the monkey brain. Nat Neurosci 2: 555–562. [DOI] [PubMed] [Google Scholar]
- Logothetis NK, Pauls J, Augath M, Trinath T, Oeltermann A ( 2001) Neurophysiological investigation of the basis of the fMRI signal. Nature 412: 150–157. [DOI] [PubMed] [Google Scholar]
- Lueck CJ, Zeki S, Friston KJ, Deiber MP, Cope P, Cunningham VJ, Lammertsma AA, Kennard C, Frackowiak RS ( 1989) The colour centre in the cerebral cortex of man. Nature 340: 386–389. [DOI] [PubMed] [Google Scholar]
- Lyon DC, Kaas JH ( 2001) Connectional and architectonic evidence for dorsal and ventral V3, and dorsomedial area in marmoset monkeys. J Neurosci 21: 249–261. [DOI] [PMC free article] [PubMed] [Google Scholar]
- Maguire EA, Burgess N, Donnett JG, Frackowiak RS, Frith CD, O'Keefe J ( 1998) Knowing where and getting there: a human navigation network. Science 280: 921–924. [DOI] [PubMed] [Google Scholar]
- Maguire EA, Frith CD, Cipolotti L ( 2001) Distinct neural systems for the encoding and recognition of topography and faces. NeuroImage 13: 743–750. [DOI] [PubMed] [Google Scholar]
- Malach R, Reppas JB, Benson RR, Kwong KK, Jiang H, Kennedy WA, Ledden PJ, Brady TJ, Rosen BR, Tootell RB ( 1995) Object-related activity revealed by functional magnetic resonance imaging in human occipital cortex. Proc Natl Acad Sci USA 92: 8135–8139. [DOI] [PMC free article] [PubMed] [Google Scholar]
- Malonek D, Tootell RB, Grinvald A ( 1994) Optical imaging reveals the functional architecture of neurons processing shape and motion in owl monkey area MT. Proc R Soc Lond B Biol Sci 258: 109–119. [DOI] [PubMed] [Google Scholar]
- Martinez A, Anllo-Vento L, Sereno MI, Frank LR, Buxton RB, Dubowitz DJ, Wong EC, Hinrichs H, Heinze HJ, Hillyard SA ( 1999) Involvement of striate and extrastriate visual cortical areas in spatial attention. Nat Neurosci 2: 364–369. [DOI] [PubMed] [Google Scholar]
- McIntosh AR ( 1999) Mapping cognition to the brain through neural interactions. Memory 7: 523–548. [DOI] [PubMed] [Google Scholar]
- McKeefry DJ, Zeki S ( 1997) The position and topography of the human colour centre as revealed by functional magnetic resonance imaging. Brain 120: 2229–2242. [DOI] [PubMed] [Google Scholar]
- Mendola JD, Dale AM, Fischl B, Liu AK, Tootell RB ( 1999) The representation of illusory and real contours in human cortical visual areas revealed by functional magnetic resonance imaging. J Neurosci 19: 8560–8572. [DOI] [PMC free article] [PubMed] [Google Scholar]
- Missal M, Vogels R, Orban GA ( 1997) Responses of macaque inferior temporal neurons to overlapping shapes. Cereb Cortex 7: 758–767. [DOI] [PubMed] [Google Scholar]
- Nakahara K, Hayashi T, Konishi S, Miyashita Y ( 2002) Functional MRI of macaque monkeys performing a cognitive set-shifting task. Science 295: 1532–1536. [DOI] [PubMed] [Google Scholar]
- Nelissen K, Vanduffel W, Sunaert S, Janssen P, Tootell RB, Orban GA ( 2000) Processing of kinetic boundaries investigated using fMRI and the double-label deoxyglucose technique in awake monkeys. Soc Neurosci Abstr 26: 304. [Google Scholar]
- Nelissen K, Vanduffel W, Tootell RBH, Orban GA ( 2003) Color selectivity in macaque inferior temporal cortex. 32nd Society for Neuroscience Meeting, Orlando, FL, November. Abstract 260.10.
- Neri P, Morrone MC, Burr DC ( 1998) Seeing biological motion. Nature 395: 894–896. [DOI] [PubMed] [Google Scholar]
- Norris DG ( 2001) The effects of microscopic tissue parameters on the diffusion weighted magnetic resonance imaging experiment. NMR Biomed 14: 77–93. [DOI] [PubMed] [Google Scholar]
- O'Keefe J ( 1979) A review of the hippocampal place cells. Prog Neurobiol 13: 419–439. [DOI] [PubMed] [Google Scholar]
- Oram MW, Perrett DI ( 1992) Time course of neural responses discriminating different views of the face and head. J Neurophysiol 68: 70–84. [DOI] [PubMed] [Google Scholar]
- Paus T, Jech R, Thompson CJ, Comeau R, Peters T, Evans AC ( 1997) Transcranial magnetic stimulation during positron emission tomography: a new method for studying connectivity of the human cerebral cortex. J Neurosci 17: 3178–3184. [DOI] [PMC free article] [PubMed] [Google Scholar]
- Pearlman AL, Birch J, Meadows JC ( 1979) Cerebral color blindness: an acquired defect in hue discrimination. Ann Neurol 5: 253–261. [DOI] [PubMed] [Google Scholar]
- Perrett DI, Rolls ET, Caan W ( 1982) Visual neurones responsive to faces in the monkey temporal cortex. Exp Brain Res 47: 329–342. [DOI] [PubMed] [Google Scholar]
- Perrett DI, Smith PA, Potter DD, Mistlin AJ, Head AS, Milner AD, Jeeves MA ( 1984) Neurones responsive to faces in the temporal cortex: studies of functional organization, sensitivity to identity and relation to perception. Hum Neurobiol 3: 197–208. [PubMed] [Google Scholar]
- Press WA, Brewer AA, Dougherty RF, Wade AR, Wandell BA ( 2001) Visual areas and spatial summation in human visual cortex. Vision Res 41: 1321–1332. [DOI] [PubMed] [Google Scholar]
- Puce A, Allison T, Asgari M, Gore JC, McCarthy G ( 1996) Differential sensitivity of human visual cortex to faces, letter strings, and textures: a functional magnetic resonance imaging study. J Neurosci 16: 5205–5215. [DOI] [PMC free article] [PubMed] [Google Scholar]
- Rolls ET ( 2000) Functions of the primate temporal lobe cortical visual areas in invariant visual object and face recognition. Neuron 27: 205–218. [DOI] [PubMed] [Google Scholar]
- Rosa MG, Krubitzer LA ( 1999) The evolution of visual cortex: where is V2? Trends Neurosci 22: 242–248. [DOI] [PubMed] [Google Scholar]
- Sakai K, Watanabe E, Onodera Y, Uchida I, Kato H, Yamamoto E, Koizumi H, Miyashita Y ( 1995) Functional mapping of the human colour centre with echo-planar magnetic resonance imaging. Proc R Soc Lond B Biol Sci 261: 89–98. [DOI] [PubMed] [Google Scholar]
- Saleem KS, Pauls JM, Augath M, Trinath T, Prause BA, Hashikawa T, Logothetis NK ( 2002) Magnetic resonance imaging of neuronal connections in the macaque monkey. Neuron 34: 685–700. [DOI] [PubMed] [Google Scholar]
- Schein SJ, Desimone R ( 1990) Spectral properties of V4 neurons in the macaque. J Neurosci 10: 3369–3389. [DOI] [PMC free article] [PubMed] [Google Scholar]
- Schein SJ, Marrocco RT, de Monasterio FM ( 1982) Is there a high concentration of color-selective cells in area V4 of monkey visual cortex? J Neurophysiol 47: 193–213. [DOI] [PubMed] [Google Scholar]
- Schiller PH ( 1993) The effects of V4 and middle temporal (MT) area lesions on visual performance in the rhesus monkey. Vis Neurosci 10: 717–746. [DOI] [PubMed] [Google Scholar]
- Sereno MI, Dale AM, Reppas JB, Kwong KK, Belliveau JW, Brady TJ, Rosen BR, Tootell RB ( 1995) Borders of multiple visual areas in humans revealed by functional magnetic resonance imaging. Science 268: 889–893. [DOI] [PubMed] [Google Scholar]
- Sereno MI, Pitzalis S, Martinez A ( 2001) Mapping of contralateral space in retinotopic coordinates by a parietal cortical area in humans. Science 294: 1350–1354. [DOI] [PubMed] [Google Scholar]
- Sergent J, Signoret JL ( 1992) Functional and anatomical decomposition of face processing: evidence from prosopagnosia and PET study of normal subjects. Philos Trans R Soc Lond B Biol Sci 335: 55–61. [DOI] [PubMed] [Google Scholar]
- Simon O, Mangin JF, Cohen L, Le Bihan D, Dehaene S ( 2002) Topographical layout of hand, eye, calculation, and language-related areas in the human parietal lobe. Neuron 33: 475–487. [DOI] [PubMed] [Google Scholar]
- Somers DC, Dale AM, Seiffert AE, Tootell RB ( 1999) Functional MRI reveals spatially specific attentional modulation in human primary visual cortex. Proc Natl Acad Sci USA 96: 1663–1668. [DOI] [PMC free article] [PubMed] [Google Scholar]
- Spiridon M, Kanwisher N ( 2002) How distributed is visual category information in human occipitotemporal cortex? An fMRI study. Neuron 35: 1–20. [DOI] [PubMed] [Google Scholar]
- Sunaert S, Van Hecke P, Marchal G, Orban GA ( 1999) Motion-responsive regions of the human brain. Exp Brain Res 127: 355–370. [DOI] [PubMed] [Google Scholar]
- Takechi H, Onoe H, Shizuno H, Yoshikawa E, Sadato N, Tsukada H, Watanabe Y ( 1997) Mapping of cortical areas involved in color vision in non-human primates. Neurosci Lett 230: 17–20. [DOI] [PubMed] [Google Scholar]
- Tarr MJ, Gauthier I ( 2000) FFA: a flexible fusiform area for subordinatelevel visual processing automatized by expertise. Nat Neurosci 3: 764–769. [DOI] [PubMed] [Google Scholar]
- Tong F, Nakayama K ( 1999) Robust representations for faces: evidence from visual search. J Exp Psychol Hum Percept Perform 25: 1016–1035. [DOI] [PubMed] [Google Scholar]
- Tootell RB, Hadjikhani N ( 2001) Where is “dorsal V4” in human visual cortex? Retinotopic, topographic and functional evidence. Cereb Cortex 11: 298–311. [DOI] [PubMed] [Google Scholar]
- Tootell RB, Silverman MS, De Valois RL, Jacobs GH ( 1983) Functional organization of the second cortical visual area in primates. Science 220: 737–739. [DOI] [PubMed] [Google Scholar]
- Tootell RB, Hamilton SL, Silverman MS ( 1985) Topography of cytochrome oxidase activity in owl monkey cortex. J Neurosci 5: 2786–2800. [DOI] [PMC free article] [PubMed] [Google Scholar]
- Tootell RB, Reppas JB, Dale AM, Look RB, Sereno MI, Malach R, Brady TJ, Rosen BR ( 1995a) Visual motion aftereffect in human cortical area MT revealed by functional magnetic resonance imaging. Nature 375: 139–141. [DOI] [PubMed] [Google Scholar]
- Tootell RB, Reppas JB, Kwong KK, Malach R, Born RT, Brady TJ, Rosen BR, Belliveau JW ( 1995b) Functional analysis of human MT and related visual cortical areas using magnetic resonance imaging. J Neurosci 15: 3215–3230. [DOI] [PMC free article] [PubMed] [Google Scholar]
- Tootell RB, Mendola JD, Hadjikhani NK, Ledden PJ, Liu AK, Reppas JB, Sereno MI, Dale AM ( 1997) Functional analysis of V3A and related areas in human visual cortex. J Neurosci 17: 7060–7078. [DOI] [PMC free article] [PubMed] [Google Scholar]
- Tootell RB, Hadjikhani N, Hall EK, Marrett S, Vanduffel W, Vaughan JT, Dale AM ( 1998a) The retinotopy of visual spatial attention. Neuron 21: 1409–1422. [DOI] [PubMed] [Google Scholar]
- Tootell RB, Hadjikhani NK, Vanduffel W, Liu AK, Mendola JD, Sereno MI, Dale AM ( 1998b) Functional analysis of primary visual cortex (V1) in humans. Proc Natl Acad Sci USA 95: 811–817. [DOI] [PMC free article] [PubMed] [Google Scholar]
- Toth LJ, Ronen I, Olman C, Ugurbil K, Kim D-S ( 2001) Spatial correlation of BOLD activity with neuronal responses. Soc Neurosci Abstr 27: 783.1. [Google Scholar]
- Tsao DY, Vanduffel W, Fize D, Sasaky Y, Fischl B, Van Hecke P, Nelissen K, Orban GA, Tootell RB ( 2000) fMRI of stereopsis in humans and awake behaving monkeys. Soc Neurosci Abstr 26: 304. [Google Scholar]
- Tsao DY, Freiwald D, Knutsen T, Sasaky Y, Mandeville JB, Leite F, Dale AM, Rosen BR, Vanduffel W, Orban GA, Tootell RB ( 2001) fMRI reveals face selective activity in awake behaving macaque. Soc Neurosci Abstr 27: 122.2. [Google Scholar]
- Tuch DS, Wedeen VJ, Dale AM, George JS, Belliveau JW ( 2001) Conductivity tensor mapping of the human brain using diffusion tensor MRI. Proc Natl Acad Sci USA 98: 11697–11701. [DOI] [PMC free article] [PubMed] [Google Scholar]
- Vanduffel W, Tootell RB, Orban GA ( 1997) Macaque visual cortical area involved in color processing: a double-label deoxyglucose study. Soc Neurosci Abstr 23: 845. [Google Scholar]
- Vanduffel W, Fize D, Mandeville JB, Nelissen K, Van Hecke P, Rosen BR, Tootell RB, Orban GA ( 2001) Visual motion processing investigated using contrast agent-enhanced fMRI in awake behaving monkeys. Neuron 32: 565–577. [DOI] [PubMed] [Google Scholar]
- Vanduffel W, Fize D, Peuskens H, Denys K, Sunaert S, Todd JT, Orban GA ( 2002) Extracting the third dimension from motion: differences in human and monkey intraparietal cortex. Science 298: 413–415. [DOI] [PubMed] [Google Scholar]
- Van Essen DC, Zeki SM ( 1978) The topographic organization of rhesus monkey prestriate cortex. J Physiol (Lond) 277: 193–226. [DOI] [PMC free article] [PubMed] [Google Scholar]
- Van Essen DC, Maunsell JH, Bixby JL ( 1981) The middle temporal visual area in the macaque: myeloarchitecture, connections, functional properties and topographic organization. J Comp Neurol 199: 293–326. [DOI] [PubMed] [Google Scholar]
- Van Essen DC, Lewis JW, Drury HA, Hadjikhani N, Tootell RB, Bakircioglu M, Miller MI ( 2001) Mapping visual cortex in monkeys and humans using surface-based atlases. Vision Res 41: 1359–1378. [DOI] [PubMed] [Google Scholar]
- Van Oostende S, Sunaert S, Van Hecke P, Marchal G, Orban GA ( 1997) The kinetic occipital (KO) region in man: an fMRI study. Cereb Cortex 7: 690–701. [DOI] [PubMed] [Google Scholar]
- Vogels R ( 1999) Effect of image scrambling on inferior temporal cortical responses. NeuroReport 10: 1811–1816. [DOI] [PubMed] [Google Scholar]
- Vuilleumier P, Henson RN, Driver J, Dolan RJ ( 2002) Multiple levels of visual object constancy revealed by event-related fMRI of repetition priming. Nat Neurosci 5: 491–499. [DOI] [PubMed] [Google Scholar]
- Walsh V, Kulikowski JJ, Butler SR, Carden D ( 1992) The effects of lesions of area V4 on the visual abilities of macaques: colour categorization. Behav Brain Res 52: 81–89. [DOI] [PubMed] [Google Scholar]
- Walsh V, Carden D, Butler SR, Kulikowski JJ ( 1993) The effects of V4 lesions on the visual abilities of macaques: hue discrimination and colour constancy. Behav Brain Res 53: 51–62. [DOI] [PubMed] [Google Scholar]
- Wandell BA ( 1999) Computational neuroimaging of human visual cortex. Annu Rev Neurosci 22: 145–173. [DOI] [PubMed] [Google Scholar]
- Young MP ( 1992) Objective analysis of the topological organization of the primate cortical visual system. Nature 358: 152–155. [DOI] [PubMed] [Google Scholar]
- Zeki S ( 1980) The representation of colours in the cerebral cortex. Nature 284: 412–418. [DOI] [PubMed] [Google Scholar]
- Zeki S ( 1983a) Colour coding in the cerebral cortex: the responses of wavelength-selective and colour-coded cells in monkey visual cortex to changes in wavelength composition. Neuroscience 9: 767–781. [DOI] [PubMed] [Google Scholar]
- Zeki S ( 1983b) The distribution of wavelength and orientation selective cells in different areas of monkey visual cortex. Proc R Soc Lond B Biol Sci 217: 449–470. [DOI] [PubMed] [Google Scholar]
- Zeki S ( 1990) A century of cerebral achromatopsia. Brain 113: 1721–1777. [DOI] [PubMed] [Google Scholar]
- Zeki S, Watson JD, Lueck CJ, Friston KJ, Kennard C, Frackowiak RS ( 1991) A direct demonstration of functional specialization in human visual cortex. J Neurosci 11: 641–649. [DOI] [PMC free article] [PubMed] [Google Scholar]
- Zeki SM ( 1973) Colour coding in rhesus monkey prestriate cortex. Brain Res 53: 422–427. [DOI] [PubMed] [Google Scholar]
- Zeki SM ( 1978) The third visual complex of rhesus monkey prestriate cortex. J Physiol (Lond) 277: 245–272. [DOI] [PMC free article] [PubMed] [Google Scholar]