

Abstract
The present study sought to determine the downstream consequences of V1a vasopressin receptor (V1aR) activation of Ca2+ signaling in cortical astrocytes. Results of these analyses demonstrated that V1aR activation led to a marked increase in both cytoplasmic and nuclear Ca2+. We also investigated V1aR activation of Ca2+-activated signaling kinases, protein kinase C (PKC), Ca2+/calmodulin-dependent protein kinase II (CaMKII), and the mitogen-activated protein (MAP) kinases [MAPK and extracellular signal-regulated kinases 1 and 2 (ERK1/2)], their localization within cytoplasmic and nuclear compartments, and activation of their downstream nuclear target, the transcription factor cAMP response element-binding protein (CREB). Results of these analyses demonstrated that V1aR activation led to a significant rise in PKC, CaMKII, and ERK1/2 activation, with CaMKII and ERK1/2 demonstrating dynamic transport between cytoplasmic and nuclear compartments. Although no evidence of PKC translocation was apparent, PKC and CaMKs were required for activation and nuclear translocation of ERK1/2. Subsequent to CaMKII and ERK1/2 translocation to the nucleus, CREB activation occurred and was found to be dependent on upstream activation of ERK1/2 and CaMKs. These data provide the first systematic analysis of the V1aR-induced Ca2+ signaling cascade in cortical astrocytes. In addition, results of this study introduce a heretofore unknown effect of vasopressin, dynamic Ca2+ signaling between the cytoplasm and nucleus that leads to comparable dynamics of kinase activation and shuttling between cytoplasmic and nuclear compartments. Implications for development and regeneration induced by V1aR activation of CREB-regulated gene expression in cortical astrocytes are discussed.
Keywords: vasopressin, V1avasopressin receptor, mitogen-activated protein kinase, protein kinase C, Ca2+/calmodulin-dependent protein kinase II, cAMP response element-binding protein, cortical astrocytes
Introduction
Arginine vasopressin (AVP), the endogenous ligand for the V1a vasopressin receptor (V1aR), is a neuropeptide synthesized in paraventricular, supraoptic, and suprachiasmatic nuclei of the hypothalamus, the bed nucleus of the stria terminalis, and the medial amygdala (Sofroniew, 1985; Buijs, 1987; Caffe et al., 1987). The V1aR and its cognate ligand, AVP, are present in the brain during embryogenesis and can regulate several aspects of brain development (Boer, 1985; Chen et al., 2000). In the mature brain, AVP regulates a broad spectrum of behavioral and cognitive functions, including homeostasis (Kasting et al., 1982), and an array of complex behaviors, including learning and memory (de Wied, 1971; Ferris et al., 1984; Everts et al., 1997; Brinton, 1998).
Previous studies from our laboratory detected AVP recognition sites in the cerebral cortex of the mammalian brain (Brinton et al., 1984; Chen et al., 1993; Brinton, 1998). Both radiolabeled AVP and a selective antagonist binding to the V1aR revealed that recognition sites for AVP were distributed uniformly throughout the cortical subregions. Subsequent in situ hybridization localization of mRNA for the V1aR in the adult rat brain revealed V1aR mRNA expression in the cerebral cortex of adult male and female rats (Ostrowski et al., 1994; Szot et al., 1994). Analysis of the cellular localization of V1aR mRNA indicated the presence of V1aR mRNA in neurons, astrocytes, oligodendrocytes, and microglia of the cerebral cortex (Yamazaki et al., 1997).
In pursuit of the functionality of V1a receptors in cortical astrocytes, we investigated V1aR regulation of Ca2+ signaling in cortical astrocytes (Zhao and Brinton, 2002a). Using quantitative fura-2 AM intracellular Ca2+ imaging, we found that V1 agonist induced a rapid and significant increase in intracellular Ca2+ concentration ([Ca2+]i). Results of these studies also demonstrated that Ca2+ influx-dependent Ca2+ release from endoplasmic reticulum is the source for the [Ca2+]i rise in response to V1 agonist (Zhao and Brinton, 2002a). Surprisingly, we discovered that V1 agonist-induced Ca2+ led to a rise in both cytoplasmic ([Ca2+]c) and nuclear ([Ca2+]n) Ca2+.
In the present study, we sought to determine the downstream consequences of V1 agonist-induced Ca2+ signaling in both the cytoplasm and the nucleus of cortical astrocytes. Using laser scanning confocal microscopy with the Ca2+-sensitive dye fluo-3, we confirmed that V1 agonist induced a rapid dynamic [Ca2+]c and [Ca2+]n rise. [Ca2+]c and [Ca2+]n obtained with fura-2 indicated that V1 agonist induced an initial Ca2+ increase in both the cytoplasm and nucleus of cortical astrocytes, followed by an accumulation of the Ca2+ signal in the nucleus, which suggests translocation of cytoplasmic Ca2+ into the nucleus. To investigate the signaling pathway activated by AVP-induced Ca2+ signaling, we pursued activation of the Ca2+-activated protein kinases protein kinase C (PKC) and Ca2+/calmodulin-dependent protein kinase II (CaMKII). Furthermore, because both PKC and CaMKII can activate the mitogen-activated protein (MAP) extracellular signal-regulated kinases 1 and 2 (ERK1/2), we investigated the impact of V1 agonist on MAP kinases and their nuclear translocation. Because V1aR activation led to [Ca2+]n rise, we sought to determine whether the nuclear Ca2+ was paralleled by nuclear compartmentalization of Ca2+-activated kinases and subsequent activation of the transcription factor cAMP response element-binding protein (CREB).
Materials and Methods
Cell-culture preparation. Cultures of cortical astrocytes were prepared according to the method described previously (Zhao and Brinton, 2002a). Cortices were dissected from the brains of embryonic day 18 (E18) Sprague Dawley rat fetuses. The tissue was treated with 0.05% trypsin in HBSS (in mm: 5.4 KCl, 0.4 KH2PO4, 137 NaCl, 0.34 Na2HPO4·7H2O, 10.0 glucose, and 10.0 HEPES) for 5 min at 37°C. After incubation, trypsin was inactivated with cold phenol red-free 10% serum-containing medium containing DMEM (Invitrogen, Carlsbad, CA) supplemented with 10 mm NaHCO3, 10% fetal bovine serum (FBS; Invitrogen), 5 U/ml penicillin, 5 μg/ml streptomycin, and 10% F12 nutrient medium for 3 min at 37°C. Tissue was then washed with HBSS twice and dissociated by repeated passage through a series of fire-polished constricted Pasteur pipettes. Cells were plated at a concentration of 1 × 10⁶ cells/ml in 25 mm flasks. Cultures were maintained in 10% serum-containing medium at 37°C with 5% CO2. After 3–7 d in culture, glial cells were shaken at 220 rpm for 16 hr to remove oligodendrocytes and microglia. The attached astrocytes were then plated onto poly-d-lysine-coated coverslips for laser scanning confocal microscopy and fura-2 intracellular Ca2+ imaging experiments, onto poly-d-lysine-coated eight well chamber slides for immunocytochemical fluorescent microscopy experiments, and onto poly-d-lysine-coated 60 mm Petri dishes for PKC activity assay and Western blot experiments. Cortical astrocytes were cultured in the same FBS serum-containing medium at 37°C with 5% CO2 for 2–5 d before the experiments.
Laser scanning confocal microscopy. Two- to 5-d-old cortical astrocytes grown on poly-d-lysine-coated coverslips were briefly washed with Krebs' buffer (in mm: 137 NaCl, 5.3 KCl, 1.0 MgCl2·6H2O, 1.2 KH2PO4, 10 HEPES, 25 dextrose, and 1.5 CaCl2) and then loaded with fluo-3 AM (5.0 μmol/l) in the dark at room temperature for 45 min. Excess fluo-3 dye was removed by washing with Krebs' buffer, and astrocytes were incubated in Krebs' buffer for 30 min at room temperature to equilibrate. Coverslips were then placed onto a coverslip clamp chamber MS-502S (ALA Scientific Instruments, Westbury, NY) and examined with a Nikon (Tokyo, Japan) PCM Quantitative Measuring High-Performance Confocal System equipped with argon and green HeNe lasers attached to a Nikon TE300 Quantum inverted microscope. Fluo-3-loaded astrocytes were excited at 488 nm with an argon-ion laser, and the fluorescence emission was observed at 515 nm. Pinhole size was set at 20 μm. All observations were conducted at room temperature. The frame-scanning mode was used to monitor changes in [Ca2+]i. In the frame-scanning mode, the entire field of view is scanned. This mode provides high spatial resolution and is ideally suited for studying the location of subcellular changes in [Ca2+]i. Images were acquired with Simple PCI C-Imaging Hardware and Quantitative Measuring Software (ComPix, Cranberry Township, PA), and the acquired image size was 640 × 480 pixels. One frame was obtained every 2 sec to generate a time course of [Ca2+]i change. After 30 sec of basal image acquisition, stock V1 agonist solution was added to the chamber, which yielded a final V1 agonist concentration of 100 nm. The scanning settings were kept constant throughout the experimental procedures to ensure comparability between groups. To exclude any effect of mechanical stimulation, 300 μl of Krebs' buffer was added, and the Ca2+ response was observed for 3 min. A second addition of 300 μl of Krebs' buffer was conducted, followed by another 3 min of observation. This procedure was conducted on five coverslips containing a total of 35 astrocytes. Results of these experiments showed that neither the first nor the second addition of 300 μl of Krebs' buffer induced a rise in Ca2+ in either the cytoplasm or the nucleus of cortical astrocytes (data not shown). After fluo-3 confocal images were acquired, montages were made with Metamorph 4.5 software (Universal Imaging, Downingtown, PA). Color transformation of gray scale was added to the fluo-3 confocal images with the InCyt2 fluorescence imaging system (Intracellular Imaging, Inc., Cincinnati, OH).
Fura-2 intracellular calcium imaging. Cortical astrocytes grown on coverslips were washed briefly with Krebs' buffer and then loaded with fura-2 AM (1.5 μmol/l) in the dark at room temperature with gentle shaking (30–40 rpm) for 45 min. Excess fura-2 dye was removed by washing with Krebs' buffer, and then the astrocytes were incubated in Krebs' buffer for 30 min at 37°C to equilibrate. Coverslips were then placed on the coverslip clamp chamber MS-502S (ALA Scientific Instruments, Westbury, NY) for the Ca2+ imaging analysis. Fluorescence measurements of [Ca2+]i were performed with the InCyt2 fluorescence imaging system (Intracellular Imaging, Cincinnati, OH). Astrocytes were placed on the stage of an inverted microscope (MT-2; Olympus Optical, Tokyo, Japan) equipped with epifluorescence optics (20×; Nikon). Fluorescence was excited at wavelengths of 340 and 380 nm alternatively with a rotating four wheel filter changer. To minimize the background noise of the fura-2 signal, successive values (16 sample images, 8 background images) were averaged (∼13 images/min). After 30 sec of basal image acquisition, 100 nm V1 agonist solution was perfused into the chamber throughout the remaining observation time. At the end of each experiment, 5 μm glutamate was used as a positive control. To exclude any effect of mechanical stimulation, 300 μl of Krebs' buffer was added, and the Ca2+ response was observed for 3 min. A second addition of 300 μl of Krebs' buffer was conducted, followed by another 3 min of observation, and no [Ca2+]i rise was observed after either the first or second addition of Krebs' buffer. After Ca2+ ratiometric images were obtained, window apertures were used to obtain [Ca2+]c and [Ca2+]n in individual cortical astrocytes in the InCyt2 fluorescence imaging system (Intracellular Imaging).
PKC activity assay. Cortical astrocytes were serum deprived for 12 hr and then treated with 100 nm V1 agonist for 5, 10, 20, 30, and 60 min. After the media were discarded, they were washed with cold PBS solution, and then 1 ml of PKC extraction buffer (20 mm Tris-HCl, pH 7.4, 2 mm EDTA, 0.5 mm EGTA, 0.25 m sucrose, and 50 mg/ml PMSF) was added. Cells were scraped and transferred to centrifuge tubes and then centrifuged at 14,000 × g for 30 min. The pellet was dissolved with 1 ml of lysis buffer and 0.2% Triton X-100, and protein concentration was determined by the bicinchoninic acid (Sigma, St. Louis, MO) method. PepTag assay for nonradioactive detection of PKC (Promega, Madison, WI) was conducted. PKC was diluted to 2.5 μg/ml in PKC buffer. Reaction mixtures were prepared that contained 5 μl of PepTag PKC reaction 5× buffer, 2 μg of PepTag C1 peptide, 1 μl of peptide protection solution, 5 μl of protein sample, and 4 μl of deionized water. Four microliters of 2.5 μg/ml PKC were substituted for the sample proteins for the PKC-positive control. For the PKC-negative control, sample protein was replaced with deionized water. At time zero, reaction mixtures were removed from the ice and incubated in a 30°C water bath for 2 min. The samples or PKC were added and incubated at 30°C for 30 min. Reaction was stopped by placing the tubes in a boiling water bath or a 95°C heating block for 10 min. Samples were then loaded onto 0.8% agarose gel in 50 mm Tris-HCl, pH 8.0, and then run at 100 V for 15–20 min to separate the phosphorylated and unphosphorylated PepTag peptides. To visualize the separation, ultraviolet light was used to view the bands, and a photograph was taken. Un-Scan-It gel image software (Silk Scientific, Inc., Orem, UT) was used for the quantitative analyses.
Whole-cell lysate preparation. Two- to 5-d-old cortical astrocytes were serum deprived overnight and treated with V1 agonist and various pharmacological chemicals for appropriate periods. Treated astrocytes were washed with cold PBS once and scraped off the dish in 1 ml of PBS. Cells were then centrifuged at 5000 × g for 5 min, and the pellets were dissolved in the RIPA lysis buffer (PBS, 1% Triton X-100, 0.2% SDS, and a protease and phosphatase inhibitor mixture containing 1 μg/ml anti-pain, 1 μg/ml leupeptin, 1 μg/ml pepstatin, 10 μg/ml soybean trypsin inhibitor, 1 mm sodium orthovanadate, and 1 mm PMSF) and suspended by passage through a 200 μl pipette tip. After incubation at 4°C for 30–60 min, the samples were centrifuged at 12,000 × g for 10 min, and the supernatants were the whole-cell protein extracts.
Cytoplasmic and nuclear lysate preparation. Cytoplasmic and nuclear lysates were prepared according to the method described previously (Chen et al., 1992) with minor modifications. Treated astrocytes were washed with cold PBS once and scraped into 1 ml of PBS. Cells were then centrifuged at 5000 × g for 5 min, and the pellet was dissolved in cytoplasm extraction buffer (10 mm HEPES, 1 mm EDTA, 60 mm KCl, 0.075% Igepal, and a protease and phosphatase inhibitor mixture) and suspended by passage through a 200 μl pipette tip. After 30–45 min of incubation at 4°C, the samples were centrifuged at 5000 × g for 5 min to generate the cytoplasmic extract in the supernatant. The supernatant was then removed, and the cytoplasmic extract was centrifuged again at 12,000 × g for 10 min to yield a supernatant containing the final cytoplasmic extract. Nuclear extraction buffer (20 mm Tris-HCl, 1.5 mm MgCl2, 420 mm NaCl, 0.2 mm EDTA, 25% glycerol, 0.5% Igepal, and a protease and phosphatase inhibitor mixture) was added to the pellet followed by 5 m NaCl to break the nuclear membrane. After 30–45 min of incubation at 4°C, the samples were centrifuged at 12,000 × g for 10 min to generate a supernatant containing the final nuclear extract. Purity of cytoplasmic and nuclear lysates was confirmed by the absence of β-actin immunoreactivity in the nuclear lysate and the absence of histone H1 immunoreactivity in the cytoplasmic lysate in Western immunoblotting.
Western immunoblotting. Protein concentration was determined by the bicinchoninic acid method. An appropriate volume of 4× sample buffer was added to the protein samples, and samples were boiled at 95°C for 5 min. Samples (25 μg of protein per well) were loaded on a 10% SDS-PAGE gel and resolved by standard electrophoresis at 90 V. Proteins were then transferred electrophoretically to Immobilon-P polyvinylidene difluoride membranes overnight at 32 V at 4°C. Membranes were blocked for 1 hr at room temperature in 10% nonfat dry milk in PBS containing 0.05% Tween 20 (PBS-T), incubated with appropriate primary antibodies against β-actin (mouse monoclonal, 1:200; Santa Cruz Biotechnology, Santa Cruz, CA), phospho-CaMKII (pT286, rabbit polyclonal, 1:5000; Promega), total CaMKII (mouse monoclonal, 1:200; Santa Cruz Biotechnology), phospho-CREB (pSer133, mouse monoclonal, 1:2000; Cell Signaling Technology, Beverly, MA), histone H1 (mouse monoclonal, 1:200; Santa Cruz Biotechnology), and phospho-ERK1/2 (pTpY185/187, rabbit polyclonal, 1:760; Biosource International, Camarillo, CA) at temperatures and times specified by the antibody providers. All primary antibodies were dissolved in PBS-T with 1% horse serum for mouse monoclonal antibodies or 1% goat serum for rabbit polyclonal antibodies. After they were washed in PBS-T, the membranes were incubated with horseradish peroxidase-conjugated anti-mouse IgG (1:5000; Vector Laboratories, Burlingame, CA) in PBS-T with 1% horse serum or anti-rabbit IgG (1:5000; Vector Laboratories) in PBS-T with 1% goat serum for 1 hr. Immunoreactive bands were visualized by a TMB detection kit (Vector Laboratories) and quantified with Un-Scan-It gel image software (Silk Scientific). After transfer, gels were stained with Coomassie blue (Bio-Rad Laboratories, Hercules, CA) to double-check equal protein loading.
Immunocytochemical staining. Cortical astrocytes were cultured on poly-d-lysine-coated eight well chamber slides for 2–3 d before serum deprivation for 12 hr and treated with V1 agonist for specified periods described in Results. The slides were washed briefly with PBS and then fixed with 95% methanol at 4°C. Nonspecific antibody binding was blocked by incubation in universal blocking buffer (provided by Dr. Zhiqun Tan of the University of Southern California) for 30 min at room temperature. The slides were then incubated with primary antibodies against GFAP (mouse monoclonal, 1:200; Santa Cruz Biotechnology), phospho-CaMKII (pT286, rabbit polyclonal, 1:5000; Promega), phospho-ERK1/2 (pTpY185/187, rabbit polyclonal, 1:760; Biosource, Camarillo, CA), or total ERK1/2 (rabbit polyclonal, 1:5000; Santa Cruz Biotechnology) for 2 hr. All primary antibodies were dissolved in PBS. After being washed with PBS, the slides were incubated in a mixture of secondary antibodies containing anti-mouse IgG conjugated with Texas Red (1:50; Vector Laboratories) and anti-rabbit IgG conjugated with FITC (1:150; Vector Laboratories) for 30 min. The secondary antibodies were also dissolved in PBS. The slides were washed extensively with PBS, mounted under coverslips with 4′,6′-diamidino-2-phenylindole (DAPI)-containing mounting medium (Vector Laboratories), and viewed under a fluorescent microscope. Images of immunocytochemically stained cortical astrocytes were assembled into montages with Adobe Photoshop (Adobe Systems, Mountain View, CA).
Inhibitors of kinases. Nonspecific effects of these inhibitors were prevented by use of two different inhibitors for each kinase plus one structurally similar but inactive compound. For MAP kinase (MAPK)/ERK kinase (MEK), two structurally different compounds, 1,4-diamino-2,3-dicyano-1,4-bis(2-aminophenylthio)butadiene (U0126) and 2′-amino-3′-methoxyflavone (PD98059), and a compound structurally similar to U0126 but inactive as a MEK inhibitor, 1,4-diamino-2,3-dicyano-1,4-bis(methylthio)butadiene (U0124), were used. For PKC inhibition, we used bisindolylmaleimide I (BIS I) and calphostin C (Cal C), as well as a control compound that is chemically similar to BIS I but not active as a PKC inhibitor, bisindolylmaleimide V (BIS V). For CaMKs, KN-93 and KN-62 were used as inhibitors, and KN-92 was used as the control compound to rule out a nonspecific effect of KN-93, because KN-92 is structurally similar to KN-93 but inactive as a CaMK inhibitor. The selection of doses for the MEK, PKC, and CaMK inhibitors was based on the recommended doses from the manufacturer and from literature. The inhibitors at the chosen doses are effective as inhibitors for these kinases but do not cause nonspecific effects in the cells.
Chemicals. Fura-2 AM and fluo-3 AM were purchased from Molecular Probes (Eugene, OR). V1 agonist ([Phe2,Orn8]-oxytocin) was purchased from Bachem Bioscience, Inc. (King of Prussia, PA). PD98059, U0126, U0124, BIS I, Cal C, BIS V, KN-93, KN-62, and KN-92 were purchased from Calbiochem (San Diego, CA).
Data analysis. Data are presented as group means ± SEM. Immunoblot data are expressed as the percentage relative to unstimulated controls run in the same experiment. Statistical analysis was performed by Student's t test or by one-way ANOVA followed by Newman–Keuls post hoc analysis.
Results
To define the specificity of the receptor involved in the responses to AVP, a specific V1 vasopressin receptor agonist, [Phe2,Orn8]-oxytocin, was used as a substitute for the endogenous AVP. Our preliminary Ca2+ imaging experiments showed that both the endogenous AVP and the V1 agonist exerted comparable effects in raising the intracellular Ca2+ level; therefore, we used this V1 agonist in subsequent studies. This V1 agonist is not protected metabolically and thus has the same half-life in vitro as AVP.
The dose of V1 agonist used in the present study was 100 nm, which was chosen based on our previous study on V1 agonist-induced intracellular Ca2+ signaling (Ca2+ uptake and IP3 accumulation) (Zhao and Brinton, 2002a). In those studies, extensive dose–response studies were conducted, and the dose–response curve was found to be an inverted U shape. The optimal concentration to induce the maximal response was found to be 100 nm. Therefore, we used the same dose of agonist in the present study to determine the downstream biochemical signaling induced by V1 agonist after Ca2+ uptake and IP3 accumulation.
Cytoplasmic and nuclear calcium rise in cortical astrocytes after exposure to V1 agonist
To investigate the dynamics of [Ca2+]c and [Ca2+]n in cortical astrocytes in response to V1 agonist, laser scanning confocal microscopy was conducted with the Ca2+-sensitive dye fluo-3 AM (Fig. 1). In the resting state, fluorescence signals were low but sufficient to localize the cells and to define an optimal optical plane through the cells. During the basal Ca2+ assessment, fluo-3 fluorescence in the nucleus was slightly higher than in the cytoplasm of cortical astrocytes (Fig. 1A). The apparently higher resting [Ca2+]n is very likely attributable to a preferential localization of fluo-3 to the nuclear compartment (Thomas et al., 2000). After the addition of V1 agonist for 50 sec, fluorescence intensity increased in both cytoplasmic and nuclear compartments, with a much higher Ca2+ signal in the nucleus (Fig. 1A). After exposure to V1 agonist for 100 sec, fluorescence intensity was slightly lower in the cytoplasmic compartment but was more concentrated in the nucleus. At 200 sec, both [Ca2+]c and [Ca2+]n were decreased, although [Ca2+]n was still slightly higher than [Ca2+]c (Fig. 1A). Control experiments indicated that addition of an equal volume of Krebs' buffer did not induce a rise in either [Ca2+]c or [Ca2+]n of cortical astrocytes (data not shown), which indicates that the response to V1 agonist was not an artifact of mechanical stimulation. Confocal images were processed with an InCyt2 fluorescence imaging system to transform fluo-3 images into color images of [Ca2+]c and [Ca2+]n rise (Fig. 1B).
Figure 1.

Laser scanning confocal fluo-3 Ca2+ images of V1 agonist-induced [Ca2+]c and [Ca2+]n rise in cortical astrocytes. A, Cortical astrocytes were loaded with fluo-3, and confocal images were captured at 0, 50, 100, and 200 sec after V1 agonist was added to the cells. After addition of V1 agonist for 50 sec, the fluorescence intensity was increased in both cytoplasmic and nuclear compartments, with a much higher Ca2+ signal in the nucleus. The fluorescence intensity decreased slightly in the cytoplasm but became more concentrated in the nucleus at 100 sec. At 200 sec, both cytoplasmic and nuclear fluorescence intensity were decreased. B, Confocal images were processed with the InCyt2 fluorescence imaging system to transform gray-scale images into color for better visualization of [Ca2+]c and [Ca2+]n rise, especially nuclear Ca2+ localization. Scale bar, 20 μm.
To further investigate the temporal profile of [Ca2+]c and [Ca2+]n rise and to quantify the Ca2+ increase, intracellular Ca2+ imaging with fura-2 was conducted in individual cortical astrocytes, and then window apertures were set to obtain separate [Ca2+]c and [Ca2+]n values (Fig. 2). Figure 2A shows fura-2-generated Ca2+ images under basal conditions and after addition of V1 agonist for 100 sec; V1 agonist induced a marked nuclear Ca2+ compartmentalization, which confirms our fluo-3 confocal Ca2+ imaging results. Quantitative studies indicate that 73% of all tested astrocytes responded to V1 agonist with a nuclear Ca2+ localization. Figure 2B documents the temporal profile of [Ca2+]c and [Ca2+]n rise in a single cortical astrocyte that was typical of the responsive astrocytes. The time course data demonstrate that the Ca2+ signal was increased simultaneously in both the cytoplasm and nuclei of cortical astrocytes, followed by a rapid and transient Ca2+ translocation from the cytoplasm to the nucleus. Translocation of the Ca2+ signal was accompanied by a decline in Ca2+ signal in the cytoplasm. After the [Ca2+]n rise, translocation of nuclear Ca2+ back to the cytoplasm occurred before diminution of the total [Ca2+]i (Fig. 2B).
Figure 2.
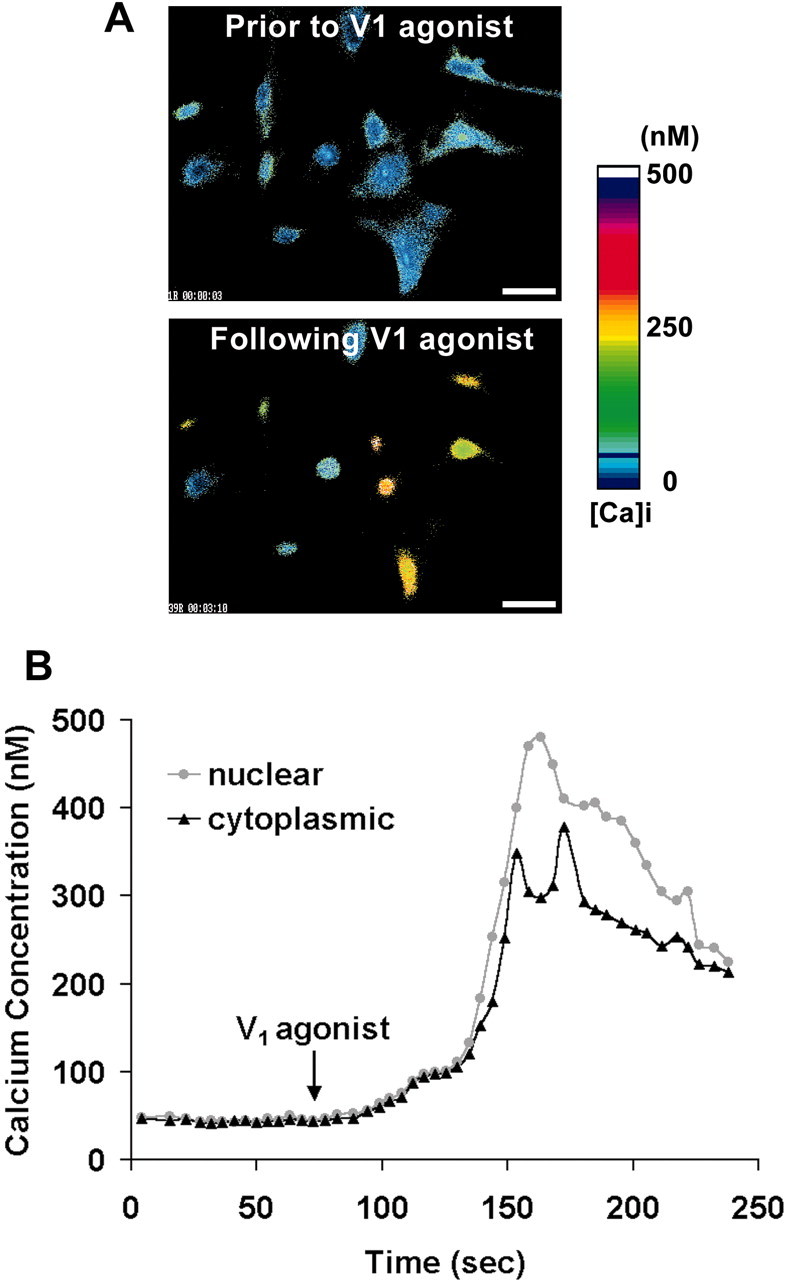
Cytoplasmic [Ca2+]c and nuclear [Ca2+]n rise in response to V1 agonist in cortical astrocytes. Cortical astrocytes were loaded with fura-2, and Ca2+ images were recorded with the InCyt2 fluorescence imaging system. A, Fura-2-generated Ca2+ images under basal conditions and after addition of V1 agonist for 100 sec. V1 agonist induced a marked nuclear Ca2+ compartmentalization. Scale bar, 30 μm. B, Window apertures were used to locate the cytoplasm and nucleus of one representative astrocyte, and [Ca2+]c and [Ca2+]n were plotted against time. V1 agonist was added where indicated and was present throughout the entire observation period. Note that Ca2+ was increased initially in both the cytoplasm and nucleus, followed by a rapid and transient Ca2+ localization into the nucleus. After the rise in [Ca2+]n, translocation of nuclear Ca2+ back to the cytoplasm occur red before there turn to baseline total [Ca2+]i.
Activation of PKC in cortical astrocytes in response to V1 agonist
It is well known that activation of the phosphatidylinositol–Ca2+ signaling pathway leads to activation of PKC (Berridge, 1993; Son and Brinton, 1998). To confirm V1 agonist-induced activation of PKC, we used a nonradioactive fluorescent peptide substrate as an indicator of PKC activation. When the peptide substrate is phosphorylated, its net charge is converted from +1 to −1, thus migrating toward the positive electrode, allowing the phosphorylated and nonphosphorylated versions of the substrate to be separated rapidly on an agarose gel. PKC activity was assessed after exposure to V1 agonist for 5, 10, 20, 30, and 60 min. As shown in Figure 3A, phosphorylated substrate was increased dramatically in cortical astrocytes in response to V1 agonist. Statistical analysis of optical density from four independent experiments is shown in Figure 3B and indicates that after exposure to V1 agonist, PKC activity was transiently but significantly increased. The maximal increase occurred at 10 min (148.89 ± 14.77%; p < 0.01), which was diminished by 20 min (131.46 ± 13.02%; p < 0.05), followed by a return to basal level by 30 min.
Figure 3.

PKC activation in cortical astrocytes in response to V1 agonist. A, Primary cortical astrocytes were treated with V1 agonist (100 nmol) for 5, 10, 20, 30, and 60 min, and protein samples were collected in the PKC extraction buffer, which ensured integrity of PKC structure and activity. PKC activity was assayed with fluorescent PKC peptide substrate. Samples were then loaded onto 0.8% agarose gel to separate phosphorylated and unphosphorylated substrate peptides. PKC activity peaked at 10 min after exposure, whereas levels ofβ-actin protein were unchanged. B, The percentage increase in PKC activity is presented in the bar graph, in which each bar represents the mean ± SEM (n = 4 for each exposure period). *p < 0.05; **p < 0.01 versus control (CTRL).
Activation of CaMKII in cytoplasm and nuclei of cortical astrocytes in response to V1 agonist
Because V1aR activation led to a significant rise in [Ca2+]i, we investigated V1 agonist activation of the Ca2+-activated kinase CaMKII. With an antibody against active phosphorylated CaMKII, Western blot analyses were performed to determine the temporal profile of CaMKII activation in whole-cell lysates of cortical astrocytes after exposure to V1 agonist for 5, 10, 20, 30, 60, and 120 min. As shown in Figure 4A, phospho-CaMKII levels increased dramatically after 5 min of exposure to V1 agonist and were sustained throughout the observation time of 120 min. Total CaMKII levels were unchanged in cortical astrocytes in response to V1 agonist. Statistical analysis of optical density from six independent experiments is shown in Figure 4B. Results of this analysis indicate that within 5 min of exposure, V1 agonist induced a significant increase in CaMKII activation relative to control (184.27 ± 16.01%; p < 0.01), which was sustained and remained significantly increased throughout the 120 min of analysis (ranging from 173.88 to 186.52%; p < 0.01).
Figure 4.

CaMKII activation in response to V1 agonist in whole-cell extracts of cortical astrocytes. A, Western immunoblots showing activation of CaMKII. Primary cortical astrocytes were treated with V1 agonist for indicated periods. Whole-cell lysates were subjected to SDS-PAGE and probed with anti-phospho-CaMKII and anti-total CaMKII. Although levels of total CaMKII protein were unchanged, the level of phospho-CaMKII increased dramatically after 5 min of exposure, and the activation persisted throughout the experiment. B, The percentage increase in CaMKII activation is presented in the bar graph, in which each bar represents the mean ± SEM (n = 6 for each exposure period). **p < 0.01 versus control (CTRL).
Because we had observed that V1 agonist induced a rise in [Ca2+]i and [Ca2+]n, we determined the cytoplasmic/nuclear localization of the phospho-CaMKII signal in cortical astrocytes. Cytoplasmic and nuclear lysate fractions of cortical astrocytes were isolated, and Western blot analyses with anti-phospho-CaMKII antibody were performed. Figure 5A contains a representative Western blot, and Figure 5B shows the statistical analysis of optical density from four independent experiments. Surprisingly, the compartmentalization of the CaMKII signal was highly dynamic over the 120 min of observation. In control untreated astrocytes, both cytoplasmic and nuclear phospho-CaMKII levels were low. In V1 agonist-treated astrocytes, activated CaMKII was elevated in parallel in both cytoplasmic and nuclear compartments within 5 min (cytoplasmic, 172.33 ± 12.79%, p < 0.001 relative to control; nuclear, 200.00 ± 15.88%, p < 0.001 relative to control). By 10 min, nuclear compartmentalization of CaMKII was significantly higher than cytoplasmic (cytoplasmic, 169.81 ± 13.25%, p < 0.01 relative to control; nuclear, 240.18 ± 17.74%, p < 0.001 relative to control; cytoplasmic vs nuclear, p < 0.05). A rapid reversal was apparent by 20 min, with the nuclear compartment significantly lower than the cytoplasmic (cytoplasmic, 241.20 ± 18.06%, p < 0.001 relative to control; nuclear, 129.80 ± 9.26%, p < 0.05 relative to control; cytoplasmic vs nuclear, p < 0.01). The reversal was sustained for an additional 10 min (cytoplasmic, 249.06 ± 18.39%, p < 0.001 relative to control; nuclear, 126.79 ± 10.14%, p < 0.05 relative to control; cytoplasmic vs nuclear, p < 0.01). By 60 and 120 min, compartmentalization of CaMKII was distributed equally between the cytoplasm and nucleus (at 60 min, cytoplasmic, 179.87 ± 14.39%, p < 0.001 relative to control, vs nuclear, 210.62 ± 15.65%, p < 0.001 relative to control; at 120 min, cytoplasmic, 172.33 ± 13.79%, p < 0.01 relative to control, vs nuclear, 210.39 ± 16.83%, p < 0.001 relative to control). Importantly, the same pattern of cytoplasmic and nuclear phospho-CaMKII rise was not observed in cortical astrocytes exposed to only serum-free medium for the same time periods, which indicates that the cytoplasmic and nuclear localization of phospho-CaMKII was induced specifically by V1 agonist.
Figure 5.

CaMKII activation and dynamic translocation in cytoplasmic and nuclear compartments of cortical astrocytes. A, Western immunoblots showing activation of CaMKII and translocation of activated CaMKII between cytoplasmic and nuclear compartments of cortical astrocytes. Primary cortical astrocytes were treated with V1 agonist (V1a) for indicated periods. Cytoplasmic and nuclear lysates were subjected to SDS-PAGE and probed with anti-phospho-CaMKII. The cytoplasmic protein levels were normalized against β-actin levels and nuclear protein levels against histone H1 protein levels. B, The percentage increase in CaMKII activation in cytoplasmic and nuclear lysates is presented in the linegraph, in which each point represents the mean±SEM (n = 4 for each exposure period). *p < 0.05, **p < 0.01, ***p < 0.001 versus control; ap < 0.05, bp < 0.01 for comparison between cytoplasmic and nuclear percentage increases. C, Immunofluorescence of active CaMKII in cortical astrocytes after exposure to V1 agonist for indicated periods. The immunocytochemical data are consistent with the Western immunoblot data shown in Figures 4 and 5, A and B. Scale bar, 25 μm. CTRL, Control; SFM, Serum-free medium.
To confirm the cytoplasmic and nuclear Western blot observation, we performed immunocytochemical analysis using phospho-CaMKII antibody (Fig. 5C). Consistent with the Western blot analyses, control untreated astrocytes exhibited low phospho-CaMKII levels in both cytoplasmic and nuclear compartments. Within 10 min of exposure to V1 agonist, nuclear phospho-CaMKII was dramatically higher than cytoplasmic phospho-CaMKII staining. At 20 and 30 min, cytoplasmic phospho-CaMKII staining was markedly higher than the nuclear signal. At 60 min, the higher phospho-CaMKII immunocytochemical signal returned to the nuclei of cortical astrocytes, and finally at 120 min, the fluorescence intensity was distributed evenly in cytoplasm and nuclei of cortical astrocytes.
ERK1/2 activation and translocation in cytoplasm and nuclei of cortical astrocytes in response to V1 agonist
ERK1/2 is part of a family of serine/threonine protein kinases that are activated rapidly after the binding of extracellular signals to cell-surface receptor tyrosine kinases or heterotrimeric G-protein-coupled receptors or by a variety of upstream kinases. To explore whether V1aR-induced Ca2+ signaling led to activation of the ERK signaling pathway, we investigated ERK1 (molecular mass, 44 kDa) and ERK2 (molecular mass, 42 kDa) activation after V1 agonist treatment using Western blot analyses with a phospho-specific antibody against active ERK1/2 (Fig. 6A,B). Results of these analyses indicated that ERK1/2 activities were increased significantly in response to V1 agonist in both cytoplasmic and nuclear compartments of cortical astrocytes. The time course for cytoplasmic localization was coincident with that of nuclear ERK1/2 activation, with maximal activation at 20 min in both compartments (Fig. 6A). Statistical analyses of optical density from six independent cytoplasmic experiments indicated that cytoplasmic phosphorylated ERK1 (pERK1) (160.63 ± 15.54%; p < 0.01) and pERK2 (163.61 ± 18.19%; p < 0.01) were increased significantly at 10 min and peaked at 20 min [173.46 ± 20.12% (p < 0.01) and 180.84 ± 23.00% (p < 0.01), respectively], followed by a gradual decline in activation, but remained significantly higher than control at 120 min [122.03 ± 5.63% (p < 0.01) and 117.84 ± 7.05% (p < 0.05), respectively]. Statistical analyses of optical density from six independent determinations of nuclear pERK1 and pERK2 indicated that both were increased significantly after only 5 min of exposure to V1 agonist [135.81 ± 8.56% (p < 0.01) and 162.56 ± 10.73% (p < 0.01), respectively], which peaked at 20 min [200.44 ± 26.91% (p < 0.01) and 282.90 ± 50.85% (p < 0.01), respectively] and decreased by 120 min [114.33 ± 4.75% (p < 0.05) and 104.50 ± 6.44%, respectively] (Fig. 6B).
Figure 6.
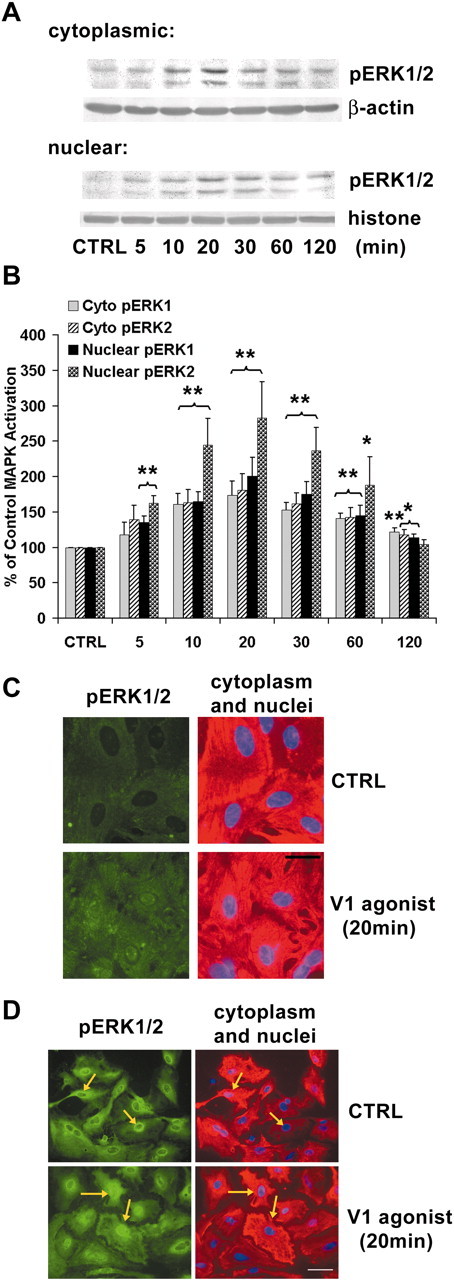
Activation and translocation of ERK1 and ERK2 in response to V1 agonist in cytoplasmic and nuclear compartments of cortical astrocytes.A, Western immunoblots showing activation of ERK1/2 in cytoplasmic and nuclear extracts of cortical astrocytes. Primary cortical astrocytes were treated with V1 agonist for indicated periods. Cytoplasmic and nuclear lysates were subjected to SDS-PAGE and probed with anti-pERK1/2. Both ERK1 and ERK2 were activated in a time-dependent manner in both cytoplasmic and nuclear compartments.B, The percentage increase in ERK1 and ERK2 activation is presented in the bar graphs. Each bar represents the mean±SEM (n = 6 for each exposure period). *p < 0.05; **p < 0.01 versus control. C, Immunofluorescence of active ERK1/2 (green) in cortical astrocytes before and after exposure to V1 agonist for 20 min. The corresponding cytoplasmic GFAP (red) and nuclear DAPI (blue) are shown on the right. Scale bar, 20 μm. D, Immunofluorescence of total ERK1/2 (green) in cortical astrocytes before and after exposure to V1 agonist for 20 min. Corresponding cytoplasmic GFAP (red) and nuclear DAPI (blue) are shown on the right. Arrows point to the astrocytes that exhibited cytoplasm-to-nucleus ERK translocation. Scale bar, 30 μm. CTRL, Control.
V1 agonist activation of cytoplasmic and nuclear ERK1/2 in cortical astrocytes was confirmed by immunocytochemical staining with the same antibody against phospho-ERK1/2 (Fig. 6C). In control untreated cortical astrocytes, cytoplasmic and nuclear ERK1/2 were very low, with nuclei of cortical astrocytes evident as dark centers. After exposure to V1 agonist for 20 min, both cytoplasmic and nuclear pERK1/2 immunofluorescence were considerably higher than that of control cells, which indicated activation of ERK1/2 in both cytoplasmic and nuclear compartments. To confirm the nuclear localization in cortical astrocytes, immunocytochemical staining was conducted with anti-GFAP primary antibody and Texas Red-conjugated secondary antibody to stain cytoplasm and DAPI in the mounting media to stain the nucleus (Fig. 6C). Because activated ERK1/2 was detected in both cytoplasmic and nuclear compartments, we investigated whether ERK1/2 was activated in the cytoplasm and subsequently translocated into the nucleus (the classic pathway) or whether ERK1/2 was activated directly within the nucleus. To address this issue, we assessed the immunofluorescence of total ERK1/2 in cytoplasmic and nuclear compartments. Immunocytochemical analysis with a polyclonal antibody against total ERK1/2 (both phosphorylated and unphosphorylated proteins) showed an increase in nuclear staining of total ERK1/2 after 20 min of V1 agonist exposure (Fig. 6D). Because unphosphorylated ERK1/2 does not readily translocate into nuclei (Lenormand et al., 1998), the increased nuclear immunoreactivity of total ERK1/2 is consistent with translocation of activated phosphorylated ERK1/2 from the cytoplasmic compartment to the nuclear compartment.
Upstream activators of ERK1/2 in cortical astrocytes
The classic signal transduction pathway for ERK1/2 activation is phosphorylation on tyrosine and threonine residues by a dual-specificity protein kinase termed ERK1/2 kinase (MEK). MEK in turn is activated by phosphorylation on serine/threonine residues, which can be catalyzed either by the Raf family of protein kinase, the protooncogene product Mos, or MEK kinases. To determine whether ERK1/2 activation in response to V1 agonist was through the MEK pathway, MEK inhibitors were used to block V1 agonist activation of ERK1/2 (Fig. 7A). Because of potential nonspecific properties of inhibitors, we used two chemically quite different inhibitors and a control compound structurally similar to one of the inhibitors but inactive as an inhibitor to rule out nonspecific effects. Two MEK inhibitors, U0126 and PD98059, were used to block V1 agonist-induced activation of ERK1/2. U0124, which is chemically similar to U0126 but inactive as a MEK inhibitor, was also used as a control compound. Figure 7A shows representative cytoplasmic and nuclear Western blots and the statistical analyses of three independent cytoplasmic and nuclear Western blot experiments. The MEK inhibitors U0126 and PD98059 completely blocked V1 agonist-induced ERK1 and ERK2 activation in both cytoplasmic (101.49 ± 6.37 and 112.15 ± 7.99%, respectively, for U0126 and 101.41 ± 5.69 and 97.85 ± 4.55%, respectively, for PD98059 relative to control) and nuclear (107.69 ± 7.73 and 98.02 ± 8.04%, respectively, for U0126 and 99.62 ± 7.21 and 100.54 ± 5.03%, respectively, for PD98059 relative to control) compartments of cortical astrocytes. V1 agonist-induced ERK1/2 activation was not affected by U0124, which indicates that blockade of ERK1/2 by U0126 was not caused by a nonspecific effect. These data indicate that V1 agonist activation of ERK is via the MEK pathway.
Figure 7.
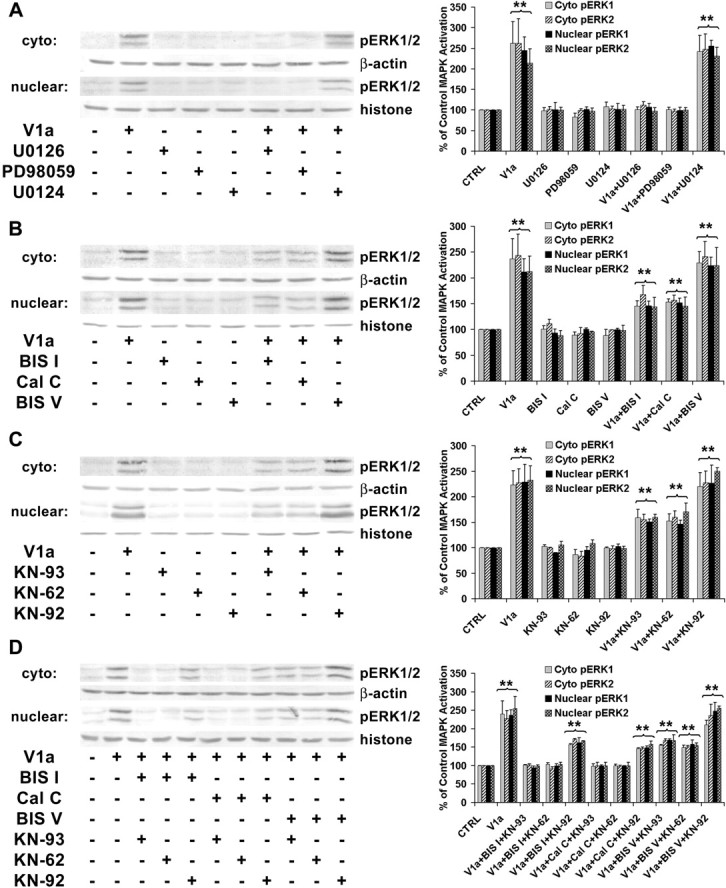
Activation of ERK1/2 required upstream MEK, PKC, and CaMKs. A, Western immunoblotting data showing abolishment of ERK1/2 activation in cytoplasmic and nuclear extracts of cortical astrocytes by MEK inhibitors U0126 and PD98059. ERK1/2 activation was not affected by U0124, a compound structurally similar to U0126 but inactive as a MEK inhibitor. Primary cortical astrocytes were treated with or without V1 agonist (V1a) in the presence or absence of U0126 (10 μm), PD98059 (25 μm), or U0124 (20 μm) for 20 min. Cytoplasmic and nuclear lysates were subjected to SDS-PAGE and probed with anti-pERK1/2. The cytoplasmic protein levels were normalized against β-actin levels and nuclear protein levels against histone H1 protein levels. The percentage increase in ERK1 and ERK2 activation relative to control is presented in the bar graphs. Each bar represents the mean±SEM(n = 3 for each condition). **p < 0.01 versus control. B, Partial inhibition of ERK1/2 activation in astrocytes by PKC inhibitors BISI and CalC. ERK1/2 activation was not affected by BISV, a compound structurally similar to BISI but inactive as a PKC inhibitor. Astrocytes were treated with or without V1 agonist in the presence or absence of BISI (5 μm), CalC(500 nm), or BISV (5 μm) for 20 min. Each bar in the graph represents the mean±SEM (n = 4 for each condition). **p < 0.01 versus control. C, Partial inhibition of ERK1/2 activation by CaMK inhibitors KN-93 and KN-62. ERK1/2 activation was not affected by KN-92, a compound structurally similar to KN-93 but inactive as a CaMK inhibitor. Astrocytes were treated with or without V1 agonist in the presence or absence of KN-93 (10 μm), KN-62 (10 μm), or KN-92 (10 μm) for 20 min. Each bar in the graph represents the mean±SEM (n = 5 for each condition). **p < 0.01 versus control. D, Complete abolishment of ERK1/2 activation by a combination of PKC inhibitors and CaMK inhibitors in cytoplasmic and nuclear extracts of cortical astrocytes. Astrocytes were treated with or without V1 agonist in the presence or absence of various combinations of inhibitors for 20 min. Each bar in the graph represents the mean±SEM (n = 4 for each condition). **p < 0.01 versus control. CTRL, Control; cyto, cytoplasmic.
To determine whether V1 agonist activation of PKC was an upstream regulator of ERK1/2 activation, analyses with two chemically different inhibitors of PKC were conducted. Two broad-spectrum PKC inhibitors, BIS I and Cal C, were used to investigate their effect on ERK1/2 activation (Fig. 7B). BIS V, chemically similar to BIS I but inactive as a PKC inhibitor, was also used as a control compound. Figure 7B shows representative cytoplasmic and nuclear Western blots and the statistical analyses of four independent cytoplasmic and nuclear Western blot experiments. Both BIS I and Cal C partially blocked V1 agonist-induced ERK1 and ERK2 activation in both cytoplasm (145.78 ± 9.69 and 167.85 ± 17.18%, respectively, for BIS I and 153.29 ± 5.98 and 156.92 ± 9.55%, respectively, for Cal C relative to control; p < 0.01) and nucleus (146.42 ± 8.77 and 143.94 ± 18.32%, respectively, for BIS I and 152.02 ± 8.78 and 146.01 ± 17.08%, respectively, for Cal C relative to control; p < 0.01) of cortical astrocytes. The inactive compound BIS V had no effect on V1 agonist-induced ERK1/2 activation. These data indicate that PKC contributes to but is not solely responsible for V1 agonist activation of ERK1/2.
Because ERK1/2 activation was only partially blocked by inhibitors of PKC, we pursued the role of CaMKII in ERK1/2 activation, because CaMKII can lead indirectly to activation of ERK1/2 in other systems, such as in vascular smooth muscle cells (Muthalif et al., 1998). Because a selective inhibitor of CaMKII does not yet exist, we used two broad-spectrum CaMK family inhibitors, KN-93 and KN-62. To control for nonspecific effects of the inhibitors, KN-92, which is chemically similar to KN-93 but inactive as a CaMK inhibitor, was used. Figure 7C shows representative cytoplasmic and nuclear Western blots and the statistical analyses of five independent cytoplasmic and nuclear Western blot experiments. Both KN-93 and KN-62 partially blocked V1 agonist-induced ERK1 and ERK2 activation in both cytoplasmic (159.33 ± 15.84 and 155.60 ± 10.38%, respectively, for KN-93 and 152.48 ± 13.99 and 159.59 ± 13.03%, respectively, for KN-62 relative to control) and nuclear (151.06 ± 5.22 and 160.15 ± 5.58%, respectively, for KN-93 and 146.67 ± 7.29 and 170.66 ± 16.66%, respectively, for KN-62 relative to control; p < 0.01) compartments of cortical astrocytes. The inactive compound KN-92 had no effect on V1 agonist-induced ERK1/2 activation. These data indicate that like PKC, CaMKs contribute to but are not solely responsible for V1 agonist-induced ERK1/2 activation.
To determine whether a combination of PKC and CaMKs was sufficient and necessary to activate ERK1/2, we combined the PKC inhibitors and CaMK inhibitors (Fig. 7D). When combined, ERK1 and ERK2 activation were blocked completely in both cytoplasmic (101.51 ± 1.49 and 101.67 ± 3.07%, respectively, for BIS I plus KN-93; 103.92 ± 3.74 and 91.97 ± 4.93%, respectively, for BIS I plus KN-62; 98.56 ± 6.33 and 99.91 ± 8.92%, respectively, for Cal C plus KN-93; and 99.61 ± 3.81 and 99.01 ± 1.73%, respectively, for Cal C plus KN-62 relative to control) and nuclear (94.74 ± 3.87 and 98.69 ± 3.45%, respectively, for BIS I plus KN-93; 99.79 ± 4.61 and 103.70 ± 5.15%, respectively, for BIS I plus KN-62; 99.82 ± 1.57 and 99.81 ± 9.29%, respectively, for Cal C plus KN-93; and 99.37 ± 0.98 and 99.49 ± 9.36%, respectively, for Cal C plus KN-62 relative to control) compartments of cortical astrocytes in response to V1 agonist. These data indicate that activation of both PKC and CaMKs is required for the full activation of ERK1/2 by V1 agonist.
CREB activation in nuclei of cortical astrocytes in response to V1 agonist
Because both CaMKII and ERK1/2 are translocated to the nucleus in response to V1 agonist, we sought to determine whether translocation of these kinases led to phosphorylation of the Ca2+/cAMP-activated transcription factor CREB. To determine whether CREB was activated after V1 agonist treatment, cytoplasmic and nuclear fractions of cortical astrocytes were obtained, and CREB activation was assayed by Western immunoblotting with an antibody against active CREB (phospho-specific anti-CREB antibody) phosphorylated CREB (pCREB) was increased significantly in the nuclear fraction of cortical astrocytes in response to V1 agonist in a time-dependent manner (Fig. 8) but was not detected in the cytoplasmic fraction (data not shown). Statistical analysis of optical density from eight independent experiments is shown in Figure 8. Results of this analysis indicated that within 10 min of exposure, V1 agonist induced a significant increase in CREB activation relative to control (149.59 ± 28.78%; p < 0.01), which was sustained and remained significantly increased throughout the 120 min of analysis (ranging from 149.59 to 308.60%; p < 0.01).
Figure 8.

Activation of CREB in nuclei of cortical astrocytes in response to V1 agonist. A, Western immunoblots showing activation of CREB in nuclear extracts of cortical astrocytes. Primary cortical astrocytes were treated with V1 agonist for indicated periods. Nuclear lysates were subjected to SDS-PAGE and probed with anti-pCREB. Levels of pCREB increased at 10 min and persisted until 120 min. Nuclear protein levels were normalized against histone H1 protein levels. B, The percentage increase in CREB activation relative to control is presented in a bar graph. Each bar represents the mean ± SEM (n = 8 for each exposure period). **p < 0.01 versus control (CTRL).
To determine whether ERK1/2, CaMKs, or both are required for CREB activation in response to V1 agonist, the MEK inhibitors and CaMK inhibitors were used to determine their effect on V1 agonist-induced CREB activation (Fig. 9). In cortical astrocytes exposed to the MEK inhibitors U0126 and PD98059, CREB activation was partially blocked (169.52 ± 11.44% for U0126 and 175.31 ± 10.30% for PD98059 relative to control; p < 0.01) (Fig. 9A). In cortical astrocytes exposed to the CaMK inhibitors KN-93 and KN-62, CREB activation was also partially blocked (165.28 ± 26.07% for U0126 and 182.62 ± 23.22% for PD98059 relative to control; p < 0.01) (Fig. 9B). The combination of MEK inhibitors and CaMK inhibitors completely abolished V1 agonist-induced CREB activation (101.39 ± 7.30% for U0126 plus KN-93, 99.24 ± 3.81% for U0126 plus KN-62, 100.50 ± 7.45% for PD98059 plus KN-93, and 91.82 ± 9.91% for PD98059 plus KN-62 relative to control) (Fig. 9C), which indicates that both ERK1/2 and CaMK signaling cascades are required for V1 agonist activation of CREB in cortical astrocytes.
Figure 9.

Activation of CREB is dependent on both MAPK and CaMK activation. A, Western immunoblotting data showing partial inhibition of CREB activation by the MEK inhibitors U0126 and PD98059. CREB activation was not affected by U0124, a compound structurally similar to U0126 but inactive as a MEK inhibitor. Primary cortical astrocytes were treated with or without V1 agonist (V1a) in the presence or absence of U0126 (10μm), PD98059 (25μm), or U0124 (20μm) for 30 min. Each bar in the graph represents the mean ± SEM (n = 4 for each condition). **p < 0.01 versus control. B, Partial inhibition of CREB activation by the CaMK inhibitors KN-93 and KN-62. CREB activation was not affected by KN-92, a compound structurally similar to KN-93 but inactive as a CaMK inhibitor. Astrocytes were treated with or without V1 agonist in the presence or absence of KN-93 (10 μm), KN-62 (10μm), or KN-92 (10μm) for 30 min. n = 4 for each condition. **p < 0.01 versus control. C, Complete inhibition of CREB activation by a combination of MEK inhibitors and CaMK inhibitors. Each bar in the graph represents the mean ± SEM (n = 4 for each condition). **p < 0.01 versus control (CTRL).
Discussion
In the present study, we have elucidated the complex signaling cascade induced by V1 agonist in cytoplasmic and nuclear compartments of cortical astrocytes. By conducting fluo-3 and fura-2 Ca2+ imaging, we have demonstrated that this cascade is initiated by a rise in [Ca2+]i with Ca2+ compartmentalization into the nucleus. PKC and CaMKII are activated in response to the V1 agonist-induced [Ca2+]c rise. The MEK-dependent ERK1/2 signaling cascade is activated by PKC and CaMKs. Activated CaMKII and ERK1/2 dynamically translocate in and out of nuclei of cortical astrocytes. Subsequent to CaMKII and ERK1/2 translocation to the nucleus, CREB activation occurs in cortical astrocyte nuclei. V1 agonist-induced CREB activation is dependent on upstream ERK1/2 and CaMKs. Furthermore, the complex signaling cascade initiated by V1aR indicates that activation of each crucial point of divergence in the cascade is dually regulated. In the case of initiation of the signaling cascade, both an influx of extracellular Ca2+ and generation of second-messenger IP3 are required for the increase in cytoplasmic and nuclear Ca2+ (Zhao and Brinton, 2002a). Activation of ERK1/2 is dependent on both PKC and CaMKs. Phosphorylation and activation of the transcription factor CREB are dually regulated by both CaMKs and ERK1/2. The requirement of dual regulatory factors throughout the V1 agonist-induced signaling cascade is indicative of a highly controlled and conditional signaling pathway. These data are the first to demonstrate that V1a receptor activation leads to a complex cascade of Ca2+ and kinase signaling that is evident within both the cytoplasmic and nuclear compartments.
It is of interest to mention the kinetics of kinase activation in response to V1 agonist. The [Ca2+]i rise occurred within 50 sec of exposure to V1 agonist. PKC and CaMKII were activated within 10 and 5 min, respectively. ERK1/2 activation occurred within 10 min after V1 agonist treatment and reached its peak at 20 min. The transcription factor CREB was activated at 10 min and reached its peak at 30 min. This temporal pattern of kinase activation fits well with our proposed model of a V1 agonist-induced kinase signaling cascade.
The expected normal concentration of AVP in the CSF ranges between 0.5 and 2.0 pm (Sorensen, 1986). It might be expected, therefore, that the dose of V1 agonist used in the present study, 100 nm, is too high to have physiological relevance. However, after stimulation, brain AVP level can be increased up to a nanomolar concentration. Furthermore, at synapses at which AVP is released, AVP concentration is much higher than the actual CSF concentration. Therefore, true to all in vitro experiments, their relevance to actual in vivo conditions has to be confirmed by the performance of in vivo experiments, but at least these in vitro studies could serve as a basis for the in vivo analyses.
Potential relevance of nuclear calcium localization
Our results indicated a dynamic Ca2+ translocation between cytoplasm and nucleus. This translocation observation, of course, is based on the assumption that there are no intranuclear Ca2+ stores that release or take up Ca2+ in the nucleus, because no intranuclear Ca2+ stores have been identified to date. Nuclear Ca2+ has received considerable attention in recent years; however, the function of nuclear Ca2+ remains largely uncharted. One group has suggested that gene expression is differentially regulated by cytoplasmic and nuclear Ca2+, which enables a single second messenger to generate diverse transcriptional responses (Hardingham et al., 1997). These investigators found that nuclear Ca2+ mediates cAMP response element-mediated transcription, whereas serum response element-mediated transcription is triggered by a rise in [Ca2+]c (Hardingham et al., 1997).
One of the inducers of nuclear Ca2+-mediated transcription may be CaMKs. The presence of calmodulin in the nucleus has been demonstrated (Vendrell et al., 1991; Bachs et al., 1994), and together with nuclear Ca2+, calmodulin may activate CaMKII and CaMKIV in the nucleus (Ohta et al., 1990; Chawla et al., 1998). Both CaMKII and CaMKIV play a pivotal role in regulating activation of CREB (Sheng et al., 1991) and its coactivator, CREB binding protein (Chawla et al., 1998).
Activation of kinases in the cytoplasmic and nuclear compartments of cortical astrocytes
Calcium is a pivotal second messenger that controls multiple cellular processes. To explore the downstream signaling cascades of [Ca2+]i rise, we investigated the activation of several candidate Ca2+-activated kinases, including PKC, CaMKII, and ERK1/2. That PKC was activated in response to V1 agonist was anticipated because of our previous demonstration that phospholipase C was activated in response to V1aR activation in cortical astrocytes (Zhao and Brinton, 2002a). PKC plays a pivotal role in controlling numerous cellular functions, including cell proliferation (Buchner, 2000), long-term potentiation (Colley and Routtenberg, 1993), and potentiation of NMDA-induced current (Urushihara et al., 1992). Among the classic isoforms, PKC-α, PKC-βI, and PKC-βII are expressed in astrocytes. The novel isoforms PKC-δ, PKC-ϵ, PKC-Θ, and PKC-η and atypical isoforms PKC-ζ and PKC-ι are also expressed in astrocytes (Slepko et al., 1999). Our ongoing studies are investigating which PKC isoforms are activated in astrocytes by AVP and their respective roles in the signaling cascade.
CaMKII was activated persistently in response to V1 agonist throughout the observation time of 2 hr. Our results are consistent with other studies that reported sustained CaMKII activation (Makhinson et al., 1999). Two distinct mechanisms may mediate the early phase and late-phase CaMKII activation. The initial CaMKII activation may be dependent on intracellular Ca2+ and calmodulin (Colbran, 1992), whereas the delayed CaMKII activation may be attributable to autophosphorylation of CaMKII. Accumulating evidence indicates that activated CaMKII can maintain its activity by autophosphorylation, rendering the kinase partially Ca2+-calmodulin independent (Miller and Kennedy, 1986; Miller et al., 1988). Furthermore, both the Western blot data and the immunocytochemical data in the present study revealed dynamic translocation of active CaMKII between cytoplasmic and nuclear compartments of astrocytes. In the cytoplasmic compartment, CaMKII is involved in regulation of ERK1/2, whereas in the nuclear compartment, CaMKII is involved in regulation of the transcription factor CREB.
The MAP kinases ERK1/2 represent a point of convergence for cell surface signals regulating cell growth, division, differentiation, and protection (Chang and Karin, 2001). Our observation of PKC dependence of ERK1/2 activation is consistent with other reports demonstrating that PKC activation by the phorbol esters PMA or 12-O-tetradecanoylphorbol-13-acetate leads to ERK1/2 activation (Stadheim and Kucera, 1998; Lee et al., 1999; Abe and Saito, 2000). PKC has been suggested to phosphorylate Raf, the most common MAPK kinase (Cai et al., 1997).
In addition to PKC as an activator of ERK1/2, CaMKs can also lead to ERK1/2 activation, as has been demonstrated in other systems, such as in vascular smooth muscle cells (Muthalif et al., 1998). CaMKII activates ERK1/2 via an indirect pathway that involves activation of cytosolic phospholipase A2, followed by generation of a fatty acid that induces activation of the Ras signaling cascade, which leads to activation of ERK1/2 (Muthalif et al., 1998). It has also been demonstrated that CaMKII can activate Pyk2 or Fak tyrosine kinases, which can lead to ERK activation (Chen et al., 1998).
Convergence of cytoplasmic signals into nuclei
One of the intriguing aspects of V1aR-induced signaling is the convergence of the cascade into the nuclei of astrocytes. Interestingly, both CaMKII and ERK1/2 translocate to nuclei of astrocytes after activation, where they then activate CREB. CREB activation by CaMKs and ERK1/2 is consistent with reports from a number of other laboratories (Wu et al., 2001; Kornhauser et al., 2002). CREB, a multipurpose transcription factor, is involved in the synaptic plasticity that underlies refinement of neuronal connections during development and in processes such as long-term potentiation and learning and memory (De Luca and Giuditta, 1997; Lamprecht et al., 1997; Silva et al., 1998). In addition, CREB is involved in cell division and proliferation (Tokunou et al., 2001). Activation of CREB in astrocytes fits well with previous data indicating that V1 agonist promotes proliferation of cortical astrocytes (Lucas and Salm, 1995).
Potential functional role of V1 agonist-induced signaling in astrocytes
Astrocytes play a key role in CNS development and regeneration by secreting neurotrophic factors, guiding neuronal development, contributing to the metabolism of neurotransmitters, and regulating extracellular pH and K+ levels (Bezzi et al., 2001). Furthermore, astrocytes can contribute to neural circuit development and maintenance by increasing the number of mature functional synapses on neurons and maintaining synaptic contacts in vitro (Ullian, 1999). Astrocytes also contribute to both structural and functional integrity of the blood–brain barrier (Prat et al., 2001). An emerging role of astrocytes within the CNS is regulation of the immune response via secretion of cytokines and chemokines (Dong, 2001). We are currently pursuing the relationship between V1aR activation of nuclear signaling cascades reported in the present study and regulation of immune signaling by astrocytes (Zhao and Brinton, 2002b). The presence of V1a Rin astrocytes during CNS development and throughout the lifespan, coupled with activation of a pivotal cytoplasmic to nuclear signaling, suggests that AVP could regulate key aspects of development and circuit remodeling during regeneration or the development of the immune response in brain through its regulation of astrocyte function.
Footnotes
This work was supported by the Kenneth T. and Eileen L. Norris Foundation (R.D.B.). Laser scanning confocal microscopy was conducted in the Confocal Microscopy Subcore of the University of Southern California Center for Liver Diseases supported by National Institutes of Health Grant 1 P30 DK48522. We thank Drs. Steven S. Schreiber and Zhiqun Tan for their contribution of technical resources.
Correspondence should be addressed to Dr. Roberta Diaz Brinton, Department of Molecular Pharmacology and Toxicology, Norris Foundation Laboratory for Neuroscience Research, Pharmaceutical Sciences Center, University of Southern California, 1985 Zonal Avenue, Los Angeles, CA 90089-9121. E-mail: rbrinton@hsc.usc.edu.
Copyright © 2003 Society for Neuroscience 0270-6474/03/234228-12$15.00/0
References
- Abe K, Saito H ( 2000) The p44/42 mitogen-activated protein kinase cascade is involved in the induction and maintenance of astrocyte stellation mediated by protein kinase C. Neurosci Res 36: 251–257. [DOI] [PubMed] [Google Scholar]
- Bachs O, Agell N, Carafoli E ( 1994) Calmodulin and calmodulin-binding proteins in the nucleus. Cell Calcium 16: 289–296. [DOI] [PubMed] [Google Scholar]
- Berridge MJ ( 1993) Inositol trisphosphate and calcium signalling. Nature 361: 315–325. [DOI] [PubMed] [Google Scholar]
- Bezzi P, Domercq M, Vesce S, Volterra A ( 2001) Neuron-astrocyte cross-talk during synaptic transmission: physiological and neuropathological implications. Prog Brain Res 132: 255–265. [DOI] [PubMed] [Google Scholar]
- Boer GJ ( 1985) Vasopressin and brain development: studies using the Brattleboro rat. Peptides 6: 49–62. [DOI] [PubMed] [Google Scholar]
- Brinton RD ( 1998) Vasopressin in the mammalian brain: the neurobiology of a mnemonic peptide. In: Progress in brain research (Urban IJA, Burbach JP, de Wied D, eds), pp 177–199. Dublin: Elsevier. [DOI] [PubMed]
- Brinton RE, Gee KW, Wamsley JK, Davis TP, Yamamura HI ( 1984) Regional distribution of putative vasopressin receptors in rat brain and pituitary by quantitative autoradiography. Proc Natl Acad Sci USA 81: 7248–7252. [DOI] [PMC free article] [PubMed] [Google Scholar]
- Buchner K ( 2000) The role of protein kinase C in the regulation of cell growth and in signalling to the cell nucleus. J Cancer Res Clin Oncol 126: 1–11. [DOI] [PubMed] [Google Scholar]
- Buijs RM ( 1987) Vasopressin localization and putative function in the brain. In: Vasopressin: principles and properties (Gash DM, Boer GJ, eds), pp 91–115. New York: Plenum.
- Caffe AR, Van Leeuwen FW, Luiten PG ( 1987) Vasopressin cells in the medial amygdala of the rat project to the lateral septum and ventral hippocampus. J Comp Neurol 261: 237–252. [DOI] [PubMed] [Google Scholar]
- Cai H, Smola U, Wixler V, Eisenmann-Tappe I, Diaz-Meco MT, Moscat J, Rapp U, Cooper GM ( 1997) Role of diacylglycerol-regulated protein kinase C isotypes in growth factor activation of the Raf-1 protein kinase. Mol Cell Biol 17: 732–741. [DOI] [PMC free article] [PubMed] [Google Scholar]
- Chang L, Karin M ( 2001) Mammalian MAP kinase signalling cascades. Nature 410: 37–40. [DOI] [PubMed] [Google Scholar]
- Chawla S, Hardingham GE, Quinn DR, Bading H ( 1998) CBP: a signal-regulated transcriptional coactivator controlled by nuclear calcium and CaM kinase IV. Science 281: 1505–1509. [DOI] [PubMed] [Google Scholar]
- Chen C, Brinton RD, Shors TJ, Thompson RF ( 1993) Vasopressin induction of long-lasting potentiation of synaptic transmission in the dentate gyrus. Hippocampus 3: 193–203. [DOI] [PubMed] [Google Scholar]
- Chen HJ, Rojas-Soto M, Oguni A, Kennedy MB ( 1998) A synaptic Ras-GTPase activating protein (p135 SynGAP) inhibited by CaM kinase II. Neuron 20: 895–904. [DOI] [PubMed] [Google Scholar]
- Chen Q, Schreiber SS, Brinton RD ( 2000) Vasopressin and oxytocin receptor mRNA expression during rat telencephalon development. Neuropeptides 34: 173–180. [DOI] [PubMed] [Google Scholar]
- Chen RH, Sarnecki C, Blenis J ( 1992) Nuclear localization and regulation of erk-and rsk-encoded protein kinases. Mol Cell Biol 12: 915–927. [DOI] [PMC free article] [PubMed] [Google Scholar]
- Colbran RJ ( 1992) Regulation and role of brain calcium/calmodulin-dependent protein kinase II. Neurochem Int 21: 469–497. [DOI] [PubMed] [Google Scholar]
- Colley PA, Routtenberg A ( 1993) Long-term potentiation as synaptic dialogue. Brain Res Brain Res Rev 18: 115–122. [DOI] [PubMed] [Google Scholar]
- De Luca A, Giuditta A ( 1997) Role of a transcription factor (CREB) in memory processes. Riv Biol 90: 371–384. [PubMed] [Google Scholar]
- de Wied D ( 1971) Long-term effect of vasopressin on the maintenance of a conditioned avoidance response in rats. Nature 232: 58–60. [DOI] [PubMed] [Google Scholar]
- Dong Y ( 2001) Immune function of astrocytes. Glia 36: 180–190. [DOI] [PubMed] [Google Scholar]
- Everts HG, De Ruiter AJ, Koolhaas JM ( 1997) Differential lateral septal vasopressin in wild-type rats: correlation with aggression. Horm Behav 31: 136–144. [DOI] [PubMed] [Google Scholar]
- Ferris CF, Albers HE, Wesolowski SM, Goldman BD, Luman SE ( 1984) Vasopressin injected into the hypothalamus triggers a stereotypic behavior in golden hamsters. Science 224: 521–523. [DOI] [PubMed] [Google Scholar]
- Hardingham GE, Chawla S, Johnson CM, Bading H ( 1997) Distinct functions of nuclear and cytoplasmic calcium in the control of gene expression. Nature 385: 260–265. [DOI] [PubMed] [Google Scholar]
- Kasting NW, Veale WL, Cooper KE ( 1982) Vasopressin: a homeostatic effector in the febrile process. Neurosci Biobehav Rev 6: 215–222. [DOI] [PubMed] [Google Scholar]
- Kornhauser JM, Cowan CW, Shaywitz AJ, Dolmetsch RE, Griffith EC, Hu LS, Haddad C, Xia Z, Greenberg ME ( 2002) CREB transcriptional activity in neurons is regulated by multiple, calcium-specific phosphorylation events. Neuron 34: 221–233. [DOI] [PubMed] [Google Scholar]
- Lamprecht R, Hazvi S, Dudai Y ( 1997) cAMP response element-binding protein in the amygdala is required for long-but not short-term conditioned taste aversion memory. J Neurosci 17: 8443–8450. [DOI] [PMC free article] [PubMed] [Google Scholar]
- Lee CH, Yun HJ, Kang HS, Kim HD ( 1999) ERK/MAPK pathway is required for changes of cyclin D1 and B1 during phorbol 12-myristate 13-acetate-induced differentiation of K562 cells. IUBMB Life 48: 585–591. [DOI] [PubMed] [Google Scholar]
- Lenormand P, Brondello JM, Brunet A, Pouyssegur J ( 1998) Growth factor-induced p42/p44 MAPK nuclear translocation and retention requires both MAPK activation and neosynthesis of nuclear anchoring proteins. J Cell Biol 142: 625–633. [DOI] [PMC free article] [PubMed] [Google Scholar]
- Lucas RL, Salm AK ( 1995) Astroglia proliferate in response to oxytocin and vasopressin. Brain Res 681: 218–222. [DOI] [PubMed] [Google Scholar]
- Makhinson M, Chotiner JK, Watson JB, O'Dell TJ ( 1999) Adenylyl cyclase activation modulates activity-dependent changes in synaptic strength and Ca2+/calmodulin-dependent kinase II autophosphorylation. J Neurosci 19: 2500–2510. [DOI] [PMC free article] [PubMed] [Google Scholar]
- Miller SG, Kennedy MB ( 1986) Regulation of brain type II Ca2+/calmodulin-dependent protein kinase by autophosphorylation: a Ca2+-triggered molecular switch. Cell 44: 861–870. [DOI] [PubMed] [Google Scholar]
- Miller SG, Patton BL, Kennedy MB ( 1988) Sequences of autophosphorylation sites in neuronal type II CaM kinase that control Ca2+-independent activity. Neuron 1: 593–604. [DOI] [PubMed] [Google Scholar]
- Muthalif MM, Benter IF, Karzoun N, Fatima S, Harper J, Uddin MR, Malik KU ( 1998) 20-Hydroxyeicosatetraenoic acid mediates calcium/calmodulin-dependent protein kinase II-induced mitogen-activated protein kinase activation in vascular smooth muscle cells. Proc Natl Acad Sci USA 95: 12701–12706. [DOI] [PMC free article] [PubMed] [Google Scholar]
- Ohta Y, Ohba T, Miyamoto E ( 1990) Ca2+/calmodulin-dependent protein kinase II: localization in the interphase nucleus and the mitotic apparatus of mammalian cells. Proc Natl Acad Sci USA 87: 5341–5345. [DOI] [PMC free article] [PubMed] [Google Scholar]
- Ostrowski NL, Lolait SJ, Young WS ( 1994) Cellular localization of vasopressin V1a receptor messenger ribonucleic acid in adult male rat brain, pineal, and brain vasculature. Endocrinology 135: 1511–1528. [DOI] [PubMed] [Google Scholar]
- Prat A, Biernacki K, Wosik K, Antel JP ( 2001) Glial cell influence on the human blood-brain barrier. Glia 36: 145–155. [DOI] [PubMed] [Google Scholar]
- Sheng M, Thompson MA, Greenberg ME ( 1991) CREB: a Ca2+-regulated transcription factor phosphorylated by calmodulin-dependent kinases. Science 252: 1427–1430. [DOI] [PubMed] [Google Scholar]
- Silva AJ, Kogan JH, Frankland PW, Kida S ( 1998) CREB and memory. Annu Rev Neurosci 21: 127–148. [DOI] [PubMed] [Google Scholar]
- Slepko N, Patrizio M, Levi G ( 1999) Expression and translocation of protein kinase C isoforms in rat microglial and astroglial cultures. J Neurosci Res 57: 33–38. [DOI] [PubMed] [Google Scholar]
- Sofroniew MV ( 1985) Vasopressin- and neurophysin-immunoreactive neurons in the septal region, medial amygdala and locus coeruleus in colchicine-treated rats. Neuroscience 15: 347–358. [DOI] [PubMed] [Google Scholar]
- Son MC, Brinton RD ( 1998) Vasopressin-induced calcium signaling in cultured cortical neurons. Brain Res 793: 244–254. [DOI] [PubMed] [Google Scholar]
- Sorensen PS ( 1986) Studies of vasopressin in the human cerebrospinal fluid. Acta Neurol Scand 74: 81–102. [DOI] [PubMed] [Google Scholar]
- Stadheim TA, Kucera GL ( 1998) Extracellular signal-regulated kinase (ERK) activity is required for TPA-mediated inhibition of drug-induced apoptosis. Biochem Biophys Res Commun 245: 266–271. [DOI] [PubMed] [Google Scholar]
- Szot P, Bale TL, Dorsa DM ( 1994) Distribution of messenger RNA for the vasopressin V1a receptor in the CNS of male and female rats. Brain Res Mol Brain Res 24: 1–10. [DOI] [PubMed] [Google Scholar]
- Thomas D, Tovey SC, Collins TJ, Bootman MD, Berridge MJ, Lipp P ( 2000) A comparison of fluorescent Ca2+ indicator properties and their use in measuring elementary and global Ca2+ signals. Cell Calcium 28: 213–223. [DOI] [PubMed] [Google Scholar]
- Tokunou T, Ichiki T, Takeda K, Funakoshi Y, Iino N, Takeshita A ( 2001) cAMP response element-binding protein mediates thrombin-induced proliferation of vascular smooth muscle cells. Arterioscler Thromb Vasc Biol 21: 1764–1769. [DOI] [PubMed] [Google Scholar]
- Ullian EM ( 1999) Control of synapse number by glia. Science 283: 36–37. [DOI] [PubMed] [Google Scholar]
- Urushihara H, Tohda M, Nomura Y ( 1992) Selective potentiation of N-methyl-d-aspartate-induced current by protein kinase C in Xenopus oocytes injected with rat brain RNA. J Biol Chem 267: 11697–11700. [PubMed] [Google Scholar]
- Vendrell M, Aligue R, Bachs O, Seratosa J ( 1991) Presence of calmodulin and calmodulin-binding proteins in the nuclei of brain cells. J Neurochem 57: 622–628. [DOI] [PubMed] [Google Scholar]
- Wu GY, Deisseroth K, Tsien RW ( 2001) Activity-dependent CREB phosphorylation: convergence of a fast, sensitive calmodulin kinase pathway and a slow, less sensitive mitogen-activated protein kinase pathway. Proc Natl Acad Sci USA 98: 2808–2813. [DOI] [PMC free article] [PubMed] [Google Scholar]
- Yamazaki RS, Chen Q, Schreiber SS, Brinton RD ( 1997) Localization of V1a vasopressin receptor mRNA expression in cultured neurons, astroglia, and oligodendroglia of rat cerebral cortex. Brain Res Mol Brain Res 45: 138–140. [DOI] [PubMed] [Google Scholar]
- Zhao L, Brinton RD ( 2002a) Vasopressin-induced cytoplasmic and nuclear calcium signaling in cultured cortical astrocytes. Brain Res 943: 117–131. [DOI] [PubMed] [Google Scholar]
- Zhao L, Brinton RD ( 2002b) Vasopressin-induced changes in cytokine expression in cultured cortical astrocytes. Soc Neurosci Abstr 28: 544.18. [Google Scholar]