Abstract
Voltage-gated Na+ currents play critical roles in shaping electrogenesis in neurons. Here, we have identified a TTX-resistant Na+ current (TTX-RINa) in duodenum myenteric neurons of guinea pig and rat and have sought evidence regarding the molecular identity of the channel producing this current from the expression of Na+ channel α subunits and the biophysical and pharmacological properties of TTX-R INa. Whole-cell patch-clamp recording from in situ neurons revealed the presence of a voltage-gated Na+ current that was highly resistant to TTX (IC50, ∼200 μm) and selectively distributed in myenteric sensory neurons but not in interneurons and motor neurons. TTX-RINa activated slowly in response to depolarization and exhibited a threshold for activation at –50 mV. V1/2 values of activation and steady-state inactivation were –32 and –31 mV in the absence of fluoride, respectively, which, as predicted from the window current, generated persistent currents. TTX-R INa also had prominent ultraslow inactivation, which turns off 50% of the conductance at rest (–60 mV). Substituting CsF for CsCl in the intracellular solution shifted the voltage-dependent parameters of TTX-RINa leftward by ∼20 mV. Under these conditions, TTX-R INa had voltage-dependent properties similar to those reported previously for NaN/NaV1.9 in dorsal root ganglion neurons. Consistent with this, reverse transcription-PCR, single-cell profiling, and immunostaining experiments indicated that NaV1.9 transcripts and subunits, but not NaV1.8, were expressed in the enteric nervous system and restricted to myenteric sensory neurons. TTX-R INa may play an important role in regulating subthreshold electrogenesis and boosting synaptic stimuli, thereby conferring distinct integrative properties to myenteric sensory neurons.
Keywords: myenteric sensory neurons, sodium channel, TTX, patch clamp, RT-PCR, immunohistochemistry
Introduction
The enteric nervous system (ENS) plays a strategic role in programming and regulating intestinal motility, secretion, and blood flow (Furness et al., 1999), because enteric reflexes occur independently of a central command. In the intestine, the ENS comprises submucosal and myenteric plexuses embedded in the wall of the gut. Intestinal enteric neurons are morphologically and functionally heterogeneous. Electrophysiologically, enteric neurons are classified as AH and S neurons. AH neurons express a prominent slow afterhyperpolarization (sAHP) after an action potential exhibiting a large shoulder on the repolarizing phase. S neurons are fast synaptic input-receiving neurons (S for synaptic) that fire brief action potentials and do not express a long-lasting AHP. AH neurons have a multiaxonal Dogiel type II morphology, whereas S neurons include three different morphological types, all uniaxonal.
Recently, this neurophysiological and neuroanatomical classification has gained more functional relevance by the demonstration that AH neurons are intrinsic sensory neurons, able to detect both chemical and mechanical sensory stimuli (Kunze et al., 1995, 2000; Bertrand et al., 1997; Liu et al., 1999), whereas S neurons are functionally classified as interneurons and motor neurons (Furness et al., 1999).
There has been increasing acceptance that AH sensory neurons and S neurons express different mixes of voltage-gated channels, which produce pharmacologically and electrophysiologically distinct subtypes of inwardly rectifying currents, Ca2+ and Ca2+-activated K+ currents (Galligan et al., 1990;Vogalis et al., 2000; Rugiero et al., 2002a). On the other hand, there is limited information about the contribution of individual types of Na+ channels that regulate excitability and electrogenesis of enteric neurons. Previous studies (Franklin and Willard, 1993; Zholos et al., 2002) were interpreted as indicating that cultured enteric neurons from neonatal and adult animals display only one type of Na+ current, which was further identified in AH neurons as the “classical” voltage-gated TTX-sensitive Na+ current (Zholos et al., 2002), similar to those observed in a variety of peripheral and central neurons (Goldin, 2001). However, in a recent study on myenteric neuronsin situ, we presented evidence for the presence of a Na+ current that is resistant to TTX (Rugiero et al., 2002a). These apparent discrepancies might be explained by differences in cell and tissue preparations, because TTX-resistant Na+ currents, and Na+ currents in general, exhibit neuron-specific and developmentally regulated patterns of expression and are known to be downregulated by loss of neurotrophic support (Waxman, 2001).
In the present study, we have used a combination of in situwhole-cell patch-clamp recording, single-cell reverse transcription (RT)-PCR, and immunohistochemistry to study the properties and to define the molecular basis of the TTX-resistant Na+ current of enteric neurons. This work has led to the identification of a previously unreported TTX-resistant Na+ current (TTX-RINa) in guinea pig and rat enteric neurons that is characterized by a relatively hyperpolarized voltage dependence and a broad area of overlap between activation and steady-state inactivation that promotes a persistent activation at potentials close to rest. This current is expressed selectively in myenteric sensory neurons but not in motor neurons and interneurons, and its presence is strictly correlated with the expression of the NaV1.9 (Scn11a) gene (Dib-Hajj et al., 1999b). Thus, along with sensory neurons in cranial and spinal ganglia (Dib-Hajj et al., 1998, 2002), myenteric sensory neurons are unique in expressing a voltage-dependent TTX-resistant Na+ current and NaV1.9 subunits. In light of the recent developments, which suggest that NaV1.9 channel opening in the CNS is mediated by the stimulation of TrkB, a receptor for neurotrophins, rather than by voltage (Blum et al., 2002), our data may be of primary relevance for understanding the gating mechanism(s) and regulation of the NaV1.9 channel subunit in peripheral neurons (cf. Delmas and Coste, 2003).
Parts of this paper have been published previously in abstract form (Rugiero et al., 2002b).
Materials and Methods
Experiments were performed on Hartley strain guinea pigs (200–400 gm) and Wistar rats (200–300 gm) from our inbred colonies. Samples of myenteric plexus were obtained from animals killed by being stunned and by severing the carotid arteries and the spinal cord. Dorsal root ganglia (DRGs) were removed from guinea pigs and rats, which were anesthetized with ketamine (100 mg/kg, i.m.) and xylazine (15 mg/kg, i.m.) and then perfused with 4% paraformaldehyde in PBS (0.1 m). All procedures were in accordance with the directives of the French Ministry of Agriculture and Fisheries and the European Communities Council (86/609/EEC).
Whole-cell patch-clamp recording
Experiments were performed on nondissociated myenteric neurons of the guinea pig or rat duodenum. Duodenum segments 2–3 cm long, opened along the mesentery line, were pinned mucosal side-up on the silicone elastomer basis (SYLGARD; Dow Corning, Midland, MI) of a recording dish containing oxygenated standard Krebs' solution (see below). The myenteric plexus was exposed by dissecting away the mucosa, the submucosal plexus, and the circular muscle layer. The recording dish was then placed on an inverted microscope stage, and the longitudinal muscle and myenteric plexus (LMMP) preparation was continuously superfused with the oxygenated Krebs' solution at 32–33°C. The upper surface of a ganglion was exposed to 0.01% protease type XIV (Sigma, St. Louis, MO) for 3–5 min, and the surface of neurons was cleaned by sweeping over the ganglion with a hair fixed at the tip of a microelectrode.
Currents and voltages were recorded in the whole-cell patch-clamp configuration using either a List Heka (Lambrecht Pfalz, Germany) EPC-7 or an Axopatch 200B amplifier. Pipettes were pulled from borosilicate glass capillaries with a Sutter P-97 puller (Sutter Instruments, Novato, CA) and had resistances of 2–3 MΩ. The experiments were controlled and data were recorded using CLAMPEX 8.1 and in-house software. Currents were low-pass-filtered at 2–5 kHz and sampled at 10–44 kHz. Capacity transients were canceled, and series resistance was compensated (70–85%) as necessary. Access resistance (Ra) ranged from 3 to 8 MΩ. Seventy percent compensation of Ra would give a potential error of 0.9–2.5 mV for a 1 nA current, as typically observed for the TTX-RINa in this study. Data were leak-subtracted using either the P/6 subtraction procedure of pCLAMP 8 or scaled current sweeps derived from small hyperpolarizing voltage commands. The pipette potential was zeroed before seal formation, and voltages were not corrected for liquid junction potentials (5–6 mV). Recordings were performed at 32–33°C except those performed with CsF in the pipette solution (23°C). Values are expressed as means ± SEM.
The standard Krebs' solution used to bath the LMMP preparation consisted of (mm): 118 NaCl, 4.8 KCl, 1 NaH2PO4, 1.2 MgSO4, 2.5 CaCl2, 25 NaHCO3, and 11.1 d-glucose and was equilibrated with 95% O2 and 5% CO2, pH 7.4. Atropine (1 μm) and nicardipine (3 μm) were present throughout the experiments to prevent spontaneous muscle movement. Isolation of TTX-RINa was achieved by adding CdCl2 (0.5 mm), 4-AP (1 mm), TEA-Cl (5 mm), and TTX (300 nm) to the following extracellular solution (mm): 145 NaCl, 4.8 KCl, 1 MgSO4, 2.5 CaCl2, 10 HEPES, and 2 CsCl. CsCl was used to block the cationic h current present in myenteric sensory neurons. This blockade greatly improved the space constant and voltage-clamp control. Iso-osmotic substitution of Na+ was achieved in this solution with choline, sucrose, N-methyld-glucamine, or lithium. Pipette solutions contained (mm): 140 KCl, 140 CsCl, or 140 CsF (when specifically indicated), 4 NaCl, 1 CaCl2, 2 MgCl2, 10 HEPES, 2 EGTA, and 0.2 GTP, pH 7.3. In some experiments, biocytin (5 mm) or Lucifer yellow (0.2%) was added to the pipette solution to label the recorded cell. ATP was not added to the internal milieu to avoid muscle contractions that result from pipette leakage during seal formation.
Cloning of guinea pig TTX-resistant Na+ channel α subunits
LMMP preparations of the duodenum and ileum of guinea pigs or rats were prepared as above. DRGs were quickly removed and immediately processed. Total RNA was extracted from guinea pig and rat myenteric plexuses and from guinea pig and rat DRGs using RNAzol B (Biogenesis, Sandown, NH) and reverse-transcribed using oligo-dT and mouse murine leukemia virus reverse transcriptase (Promega, Madison, WI). The degenerate primers designed to amplify guinea pig TTX-resistant Na+channel α subunits were based on highly conserved regions lying on either side of the critical TTX-binding residues in domain I of mouse, rat, canine, and human Scn11a and Scn10a genes. The forward primer was 5′-CTGAAGGTCATGGTGGGDGCC, and the reverse primer was 5′-CAGGTAGAASGAKCCCAGGAA (D = G, A, or T; S = C or G; and K = G or T). These primers amplified both Scn10a and Scn11a cDNAs from rat DRGs. Single-stranded cDNAs isolated from guinea pig LMMP preparations (duodenum and ileum) were used as templates. Cycling conditions were 94°C for 3 min and then 35 cycles at 94°C for 30 sec, 55°C for 45 sec, and 72°C for 1 min, followed by a final step of 72°C for 10 min. PCR products were cloned using the pGEM-T easy vector (Promega) and recombinant plasmids sequenced from 12 independent clones using Taq polymerase, fluoresceinated dye terminators, and an Applied Biosystems (Foster City, CA) 377 automated DNA sequencer. Sequence analysis was performed using the BLAST/FASTA program (National Library of Medicine, Bethesda, MD). The partial guinea pig Scn11a (NaV1.9) sequence has been deposited with the European Molecular Biology Laboratory and GenBank data libraries under the accession number AF521647.
RT-PCR and single-cell RT-PCR
RT-PCR. The RT-PCR procedure was performed on isolated rat and guinea pig myenteric ganglia and on rat and guinea pig DRGs. Isolated guinea pig myenteric ganglia were obtained from the LMMP preparations, cut in several pieces, and enzymatically digested with collagenase type IA (1 mg/ml; Sigma) for 20–25 min at 37°C. This treatment was followed by a gentle trituration using a Pasteur pipette. The dissociated ganglia were then aspirated under visual control for subsequent RT-PCR.
Single-cell RT-PCR. The single-cell RT-PCR procedure was performed after achieving whole-cell recording of guinea pig myenteric neurons. The intracellular cell content was aspirated via the recording pipette into 5 μl of an RNase-free intracellular solution consisting of 40 mm Tris-HCl, pH 8, 70 mm KCl, 8 mmMgCl2, and 100 U of RNAsin (Roche Products, Hertfordshire, UK). For rat DRG neurons, single neurons were aspirated after being dissociated as described above and collected in a an RNase-free intracellular solution containing 0.5% Nonidet P-40. Pipette solutions were then ejected into a 0.5 ml Eppendorf tube containing 4 μl of DEPC-treated water and 1 μl of oligo-dT15 (0.5 μg/μl; Promega). The mixture was heated to 65°C for 10 min to linearize mRNA and then placed on ice for 2 min. Single-stranded cDNA was synthesized by the addition of 100 U of Moloney murine leukemia virus (M-MLV) reverse transcriptase, RNase H (−) point mutant, and mixed dNTPs (1 μl, 10 mm) followed by incubation at 37°C for 20 min (adapted from Shah et al., 2002). The reaction was terminated by heating at 65°C for 15 min. For gene-specific PCR amplification, 2 μl of cDNA template was added to a PCR tube containing 4 μl of PCR buffer, 4 μl of MgCl2 (25 mm), 0.8 μl of dNTPs (25 mm), 1–2 μl of upstream and downstream primers (10–20 μm), 21 μl of water, and 0.5 μl ofTaq polymerase (5000 U/ml). The thermal cycling program was 94°C for 1 min, 60°C for 1 min, and 72°C for 1.5 min for 40–45 cycles.
The gene-specific oligonucleotides used to amplify the guinea pig Scn11a were gpScn11a-sense (5′-TTACTGCGCTCCGTGAAG) and gpScn11a-antisense (5′-CCCAGGAGTCTTGAGTCATAA) (AF521647), which give a PCR product of 348 bp. These primers were able to amplify both guinea pig and rat NaV1.9. Specific rat NaV1.8 (SNS) primers were rScn10a-sense (5′-CAGCTTCGCTCAGAAGTATCT) and rScn10a-antisense (5′-TTCTCGCCGTTCCACACGGAGA) (Akopian et al., 1996). The primers for Gαo subunits were Gαo-sense (5′-ACTCTGGGCGTGGAGTATGGTG) and Gαo-antisense (5′-GTATTCAGGAAAGCAGATGGTCA), which give a PCR product of 606 bp. Aliquots of the reaction mixture were visualized on 1.5–2% (w/v) Metaphor agarose (FMC BioProducts, Rockland, ME).
Immunohistochemistry
Duodenum and ileum samples were isolated from guinea pigs and rats killed as described above. Duodenum and ileum segments opened along the mesentery line were pinned mucosal side-up on the silicone elastomer basis of a Petri dish containing oxygenated Krebs' solution and then fixed with 4% paraformaldehyde, pH 7.4, for 3 hr at 4°C. LMMP preparations were then made by removing the mucosa and the circular muscle. They were cleared of fixative by successive washing in DMSO and PBS. After being removed from fixed animals, DRGs were postfixed overnight and cryoprotected with 20% sucrose for 3 hr. Twenty-micrometer-thick sections cut on a cryostat were collected on slides coated with gelatin, air-dried, and kept at −20°C.
LMMP preparations of duodenum and ileum as well as DRG sections were permeabilized using 0.3% Triton X-100, 1% bovine serum albumin, and 10% goat normal serum for 1 hr at room temperature. The tissues were then incubated overnight at 4°C with rabbit polyclonal antibodies raised against rat Scn10a (SNS/NaV1.8) or rat Scn11a (NaN/NaV1.9) sodium channel α subunits. Two anti-SNS and two anti-NaN antibodies were used. Anti-NaV1.8 antibodies were raised against the 1041–1062 amino acid sequence [10169#2 (Black et al., 1999)] or the C-terminal 15 amino acid peptide [K107 (Coward et al., 2000)] of the rat NaV1.8 and used at 4.5 and 1 μg/ml, respectively. Both anti-NaV1.9 antibodies were raised against the C-terminal 18 amino acid peptide of rat NaV1.9 [K186 (Coward et al., 2000) and 6464#2 (Fjell et al., 2000)] and used at 10 and 0.6 μg/ml, respectively. Rabbit polyclonal primary antibodies were visualized by incubation at room temperature for 2 hr with Alexa 488-conjugated goat anti-rabbit IgG (1:200; Molecular Probes, Leiden, the Netherlands). Tissues were dried, mounted onto glass slides, and coverslipped with fluorescence mounting medium (Dako, Carpinteria, CA). Confocal images were obtained on a Leica (Nussloch, Germany) confocal laser-scanning microscope equipped with an argon-krypton laser. Confocal micrographs show optical sections of 1 μm thickness.
Morphology of neurons was examined by intracellular injection of biocytin (5 mm) or Lucifer yellow (0.2%). After overnight fixation in Zamboni's fixative (2% paraformaldehyde and 0.2% picric acid in 0.1 m PBS, pH 7.0), the fixative was washed out, and the tissue was cleared by three washes with DMSO followed by three changes of PBS. Visualization of biocytin was performed with streptavidin-Texas Red (1:400; Amersham Biosciences, Little Chalfont, Buckinghamshire, UK) for 90 min at room temperature. Confocal micrographs were obtained with a helium-neon or an argon-krypton laser and were digital composites of 13 series scans of optical sections through a depth of 12–13 μm.
Results
Overshooting TTX-resistant regenerative responses in myenteric sensory neurons
The effects of TTX on action potential firing were examined using whole-cell current-clamp recording of in situ guinea pig myenteric neurons. AH neurons were typically identified by their long-lasting (half-duration, 2.8 ± 0.2 msec) action potentials, attributable to the influx of Ca2+ mainly through N-type Ca2+ channels (Rugiero et al., 2002a), and the following sAHP (Fig.1A). S neurons, on the contrary, have neither sAHP nor inflection in action potentials (Fig.1B). In the absence of TTX, AH neurons produced all-or-none action potentials, the electrogenesis of which resulted from mixed Na+ and Ca2+ influxes (Fig. 1A). On addition of TTX (300 nm) and in the presence of the Ca2+ channel blocker Cd2+, all AH neurons encountered were still able to produce slowly developing regenerative responses with minimal overshoot and time to peak of >10 msec (Fig.1A). S neurons, recorded under the same conditions, were unable to produce such active depolarizations and only evoked graded electrotonic responses on injection of depolarizing currents (Fig. 1B).
Fig. 1.
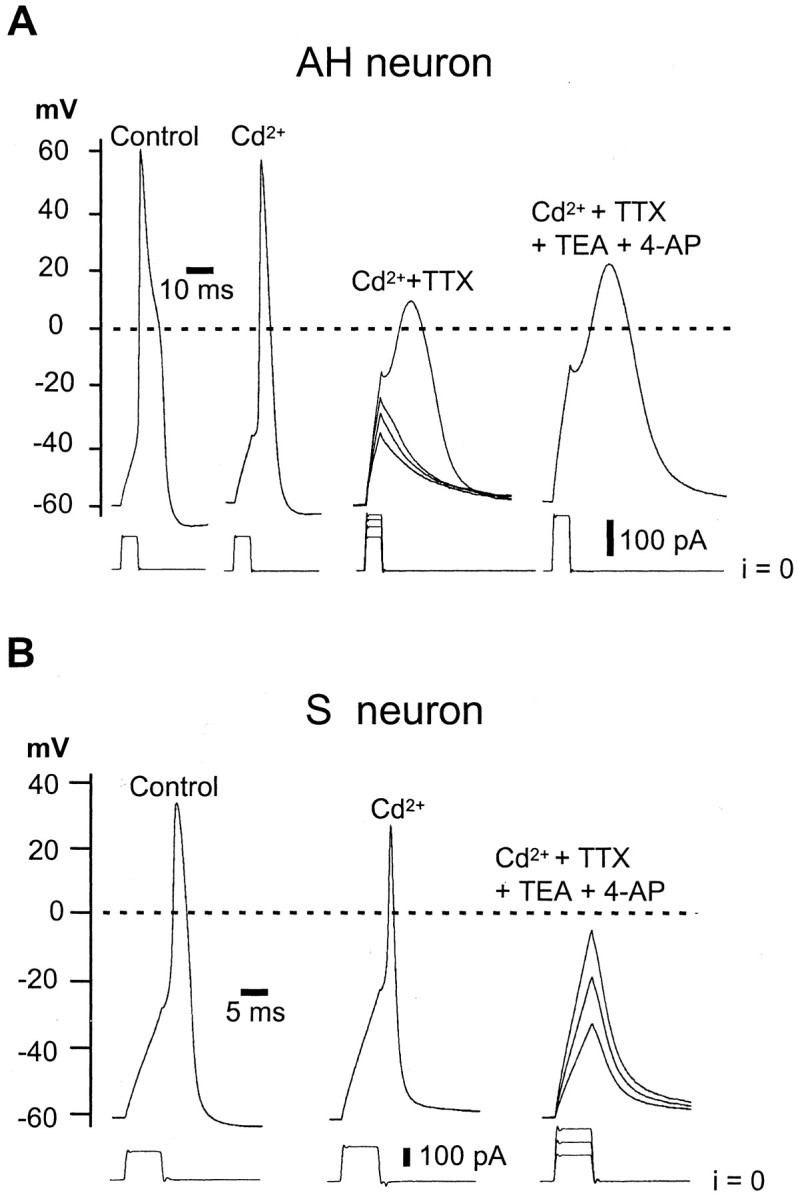
TTX resistant regenerative responses in AH neurons. A, AH neuron recorded using normal extracellular (Krebs') solution (Control) and on the cumulative application of Cd2+ (0.5 mm), TTX (300 nm), and 4-AP (1 mm) plus TEA (5 mm) in TTX-R INaisolation extracellular solution. B, Same experiment as in A in an S neuron. Note that the AH neuron but not the S neuron exhibits TTX-resistant regenerative responses. Experiments were performed using a KCl-based (140 mm) intracellular solution. i, Current.
Detection of a TTX-resistant Na+ current in AH sensory neurons
These observations prompted us to examine the current(s) underlying the TTX-resistant regenerative responses. Whole-cell currents were first studied in myenteric neurons using a high-K+ pipette solution. This allowed the immediate identification of the neuron under study by probing the sIAHP and the cationIh currents, two trademark currents of AH neurons (Galligan et al., 1990; Vogalis et al., 2000; Rugiero et al., 2002a). Figure 2 shows representative examples of currents evoked on ramp or step depolarizations in AH and S neurons. In the presence of Cd2+ (500 μm), and the Na+ channel blocker TTX (300 nm), AH neurons (n = 36) typically displayed mixed voltage-dependent currents, with prominent inward and outward currents (Fig. 2A), whereas S cells (n = 27) only exhibited outward currents. Substituting external Na+ with choline chloride (n = 12), sucrose (n = 4), orN-methyl d-glucamine (n = 10) indicated that the TTX-resistant inward current in AH neurons was carried solely by Na+ (Fig. 2A,B). This is in agreement with the persistence of the current when Na+ was substituted with Li+ (n = 5; data not shown). Difference currents obtained by subtracting current traces with and without external Na+ gave preliminary evidence that the TTX-resistant Na+current has slow activation and inactivation kinetics and a relatively negative activation threshold (see below for further details). Hereafter, we will refer to this current as TTX-RINa.
Fig. 2.
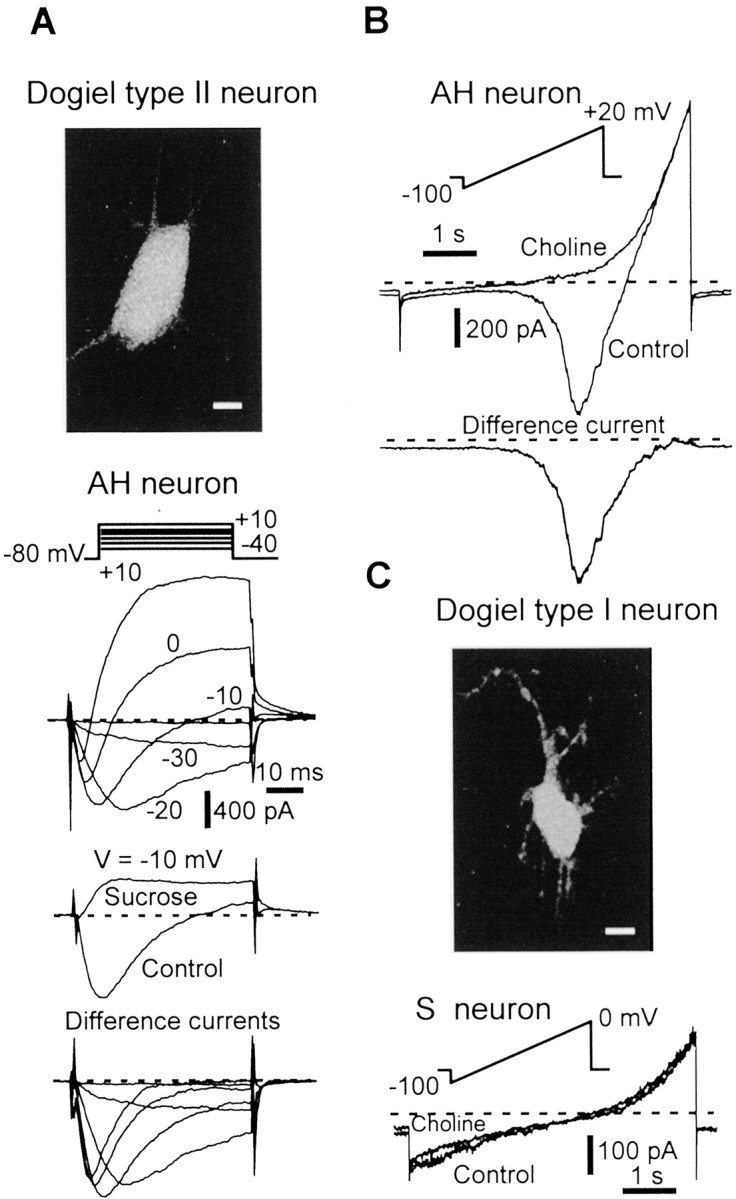
Detection of a TTX-resistant Na+ current in myenteric sensory neurons.A, Top, Photomicrograph showing the typical morphology of a Dogiel type II sensory neuron (AH neuron) as revealed by intracellular biocytin. Scale bar, 10 μm.Bottom, Representative family of currents evoked in an AH Dogiel type II neuron in response to 50 msec depolarizing voltage steps in the normal TTX-R INa isolation extracellular solution (top panel) and after substituting sucrose for Na+ (middle panel). Bottom panel, Difference currents obtained by subtracting current traces in the presence or absence of external Na+. B, Top, AH neuron subjected to a slowly rising voltage ramp (24 mV/sec) in normal TTX-R INa isolation extracellular solution and in the absence of external Na+ (choline iso-osmotically substituted for Na+).Bottom, Difference current isolating the TTX-R Na+ current. C, Top, Photomicrograph of a Dogiel type I nonsensory neuron (S neuron) injected with biocytin. Scale bar, 10 μm. Bottom, S nonsensory neuron subjected to a slowly rising voltage ramp in normal TTX-R INa isolation extracellular solution and in the absence of external Na+. Note the absence of the TTX-R Na+ current. Experiments were performed using a KCl-based (140 mm) intracellular solution and 300 nm extracellular TTX.
Further evidence that only AH neurons but not S neurons do express TTX-R INa was gained from intracellular dialysis of recorded cells with biocytin and a posteriori identification of their morphotypes. All neurons expressing TTX-R INa, in which cell morphology was revealed by biocytin, had smooth cell bodies with two or more long axonal processes (n = 18; Fig.2A) classically defined as Dogiel type II neurons and corresponding to the sensory morphotype (Furness et al., 1998). In marked contrast, excitable cells in which TTX-RINa was not detected were uniaxonal with multiple and short dendrites (Fig. 2C), typical of Dogiel type I neurons and corresponding to a population of nonsensory neurons (Furness et al., 1998). Thus, all neurons expressing TTX-RINa were identified as AH sensory neurons as defined electrophysiologically and morphologically.
Properties of the TTX-R INa
Resistance to TTX and cadmium
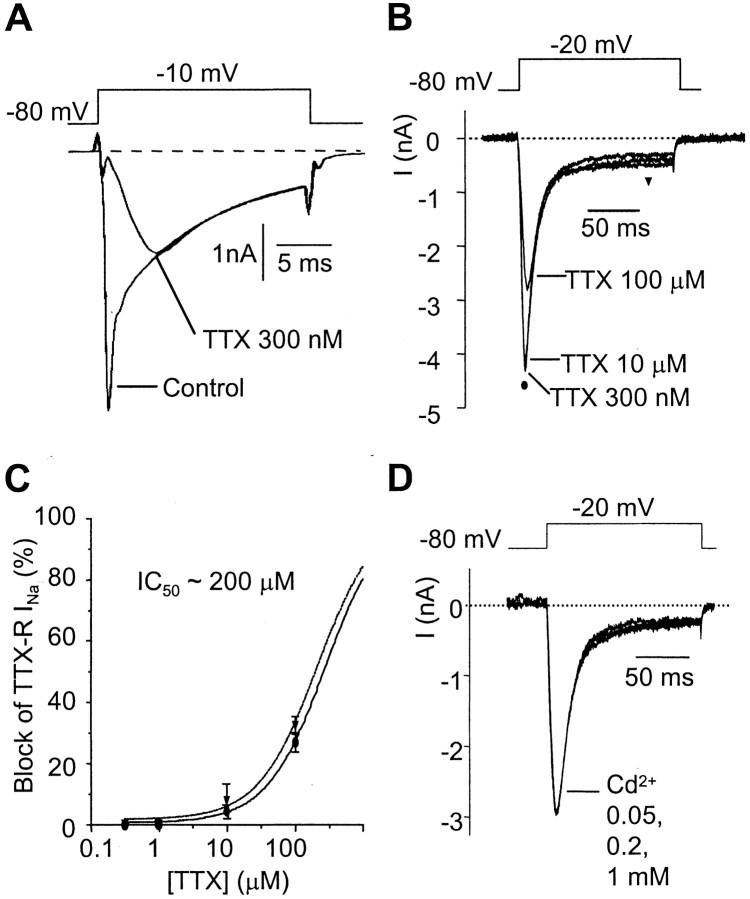
The TTX-R INa was studied in isolation from K+ and Ca2+ currents by substituting Cs+ for K+ in the patch pipettes and by adding TEA, 4-AP, and Cd2+ in the bathing solution. Its sensitivity to TTX was tested by cumulatively increasing the concentration of TTX from 300 nm up to 100 μm. In the absence of TTX, Na+ currents evoked by stepping from –80 to –10 mV had two rising phases, fast and slow. The fast-activating component was fully blocked by 300 nm TTX, unmasking the presence of the second, slowly rising component (Fig. 3A). Raising the TTX concentration to 1 μm had no significant effect on the slow TTX-RINa, whereas concentrations up to 100 μm blocked TTX-RINa only by 28% (Fig. 3B). Dose–inhibition curves were then determined as the fractional reduction in the amplitude of TTX-RINa measured either at the peak or on the persistent phase of the current (measured isochronally 140 msec after the current onset; Fig. 3C). For both procedures, the data points could be fitted by Hill equations giving IC50 values for TTX of ∼200 μm. TTX-R INawas found to be fully resistant to Cd2+ up to 1 mm (n = 7; Fig.3D).
Fig. 3.
Pharmacology of TTX-RINa. A, Na+ currents evoked by a 15 msec depolarizing pulse to –10 mV in the absence (Control) and presence of 300 nm TTX. Adding TTX unveils the presence of TTX-RINa. The experiment was performed in the presence of 0.5 mm Cd2+ to block the calcium currents. B, Effect of 0.3, 10, and 100 μm TTX on the TTX-R INa evoked by a 150 msec depolarizing pulse to –20 mV. C, Concentration dependence for TTX block determined as the percentage inhibition in either the peak (circles) or the persistent (triangles) component of TTX-RINa measured as described inB. Points are mean ± SEM for five AH neurons. Estimated IC50 for both curves was ∼200 μm. D, Lack of effect of 0.05, 0.2, and 1 mm Cd2+ on the TTX-RINa evoked by a 150 msec depolarizing pulse to –20 mV in the presence of 300 nm TTX. Experiments were performed using a CsCl-based (140 mm) intracellular solution.
Current–voltage relationship and activation process
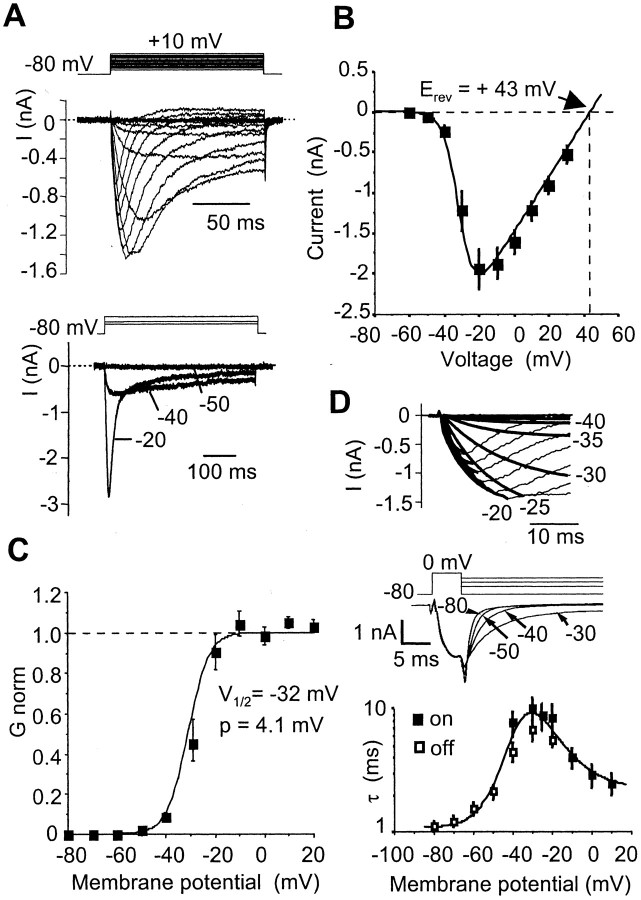
The biophysical properties of the TTX-RINa were determined in the presence of 300 nm TTX to block the fast TTX-sensitive Na+ current. Figure4A shows a representative leak-subtracted family of TTX-RINa produced by graded step depolarization from a holding potential of –80 mV. At –40 mV, TTX-RINa activated slowly and persisted for >1 sec (Fig. 4A, 500 msec voltage step). The corresponding I–V curve constructed using normalized data from 33 AH neurons had a reversal potential of +43 ± 3 mV, as expected for a pure Na+ current, and a mean peak current at –20 mV of –1900 ± 240 pA (Fig.4B). The total capacity of AH neurons being 46 ± 3 pF (n = 14), this gives a current density of 41.3 ± 7 pA/pF, which is nearly four times smaller than the density of the TTX-sensitive Na+ current in AH neurons (143.5 ± 10 pA/pF). The peak conductance–voltage relationship of TTX-R INa was well fitted by a single Boltzmann function of the formg/gmax = [1 + exp (–(V – V1/2)/p)]−1, with a half-activation voltage V1/2 of –32 ± 1 mV and a slope factor p of 4.15 ± 0.15 mV (Fig.4C) in the absence of fluoride (as noted below, the V1/2 was shifted to the left with fluoride in the pipette solution).
Fig. 4.
Activation and deactivation properties of TTX-RINa. A, Top, Representative TTX-R INa traces recorded in response to depolarizing voltage steps from a holding potential of –80 mV to +10 mV in 5 mV increments. Bottom, TTX-RINa evoked by long voltage steps to –50, –40, and –20 mV showing the persistent behavior of the current in this voltage range. B, Peak TTX-RINa–V relationship.Points are mean ± SEM for 33 AH neurons.C, Activation curve of TTX-RINa determined from the I–Vplot shown in B. Data points were fitted to a Boltzmann function giving a V1/2 of –32 mV and a p of 4.1 mV. D, Top, The rising phase of TTX-RINa evoked by depolarizing steps (–40 to +5 mV; same traces as in A) was fitted to single exponential functions. Middle, Monoexponential tail TTX-R INa deactivation, produced by stepping back the voltage at peak TTX-R INa, from which we derived the deactivation time constants.Bottom, Voltage dependence of the activation (filled squares) and deactivation (open squares) time constants. Each point is the mean ± SEM of 6–15 AH neurons. Experiments were performed using a CsCl-based (140 mm) intracellular solution and 300 nm extracellular TTX. Erev, Reversal potential.
The kinetics of activation were assessed by fitting the rising phase of currents evoked by 150 msec steps from –80 to +10 mV. They were best fit to single exponential functions in the –40 to +5 mV voltage range (Fig. 4D, top panel). The kinetics of the current at potentials more hyperpolarized than –40 mV were examined by measuring the deactivation tail currents evoked by various deactivating test potentials and fitting those to single exponentials (Fig.4D, middle panel). Examination of the entire activation–deactivation time constant profile showed that it was bell-shaped, with time constants being moderately rapid (∼2 msec) at membrane potentials corresponding to the resting potential of AH neurons (approximately –60 mV), becoming slower at –30 mV (10 msec) and decreasing to a new minimum at overshooting potentials (Fig.4D, bottom panel).
Fast inactivation process
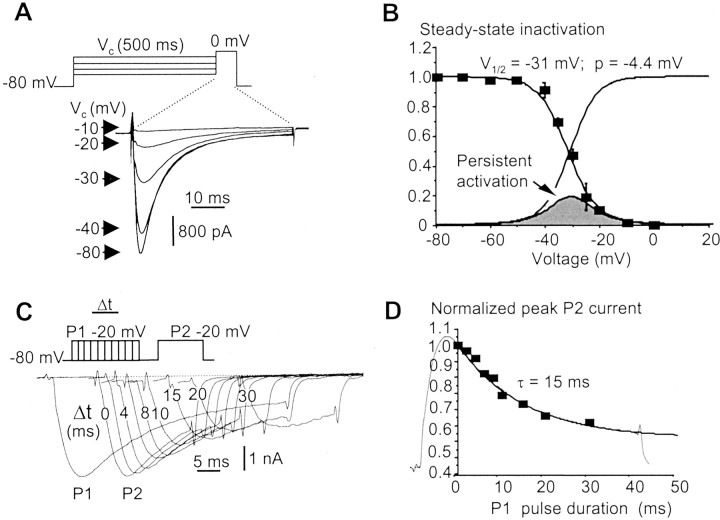
Steady-state inactivating curves were obtained by measuring the peak current in response to a test pulse to 0 mV that was preceded by 500 msec conditioning voltage steps to various potentials between –80 and 0 mV (Fig. 5A). These conditioning voltage steps were chosen to allow fast inactivation but not ultraslow inactivation (see below) to be fully developed. The peak currents were normalized and plotted versus the conditioning potential in Figure 5B. The resulting current–voltage relationship of the steady-state inactivation was well fitted to a Boltzmann function having a half-inactivation voltage of –31 ± 1 mV and a slope factor of –4.4 ± 0.2 mV. Superimposing the activation curve to the steady-state inactivation one in Figure 5B gave a bell-shaped curve ranging from –50 to –10 mV, indicating that a persistent TTX-R INa should be produced in this window and should amount to up to 20% of the peak current.
Fig. 5.
Properties of TTX-R INafast inactivation. A, Voltage-dependent inactivation of TTX-R INa evoked at 0 mV in response to 500 msec conditioning voltage steps at various potentials (indicated on the current traces). B, Normalized TTX-RINa peak plotted against the conditioning potential. Each point is the mean ± SEM of eight AH neurons. Data points were fitted to a Boltzmann function giving a V1/2 of –31 mV and a p of –4.4 mV. Right curve, Activation curve from Figure 4. The product of the two functions is the bell-shaped curve, which defines a window current in the –50 to –10 mV voltage region. C, Time-dependent inactivation of TTX-RINa produced by a conditioning voltage pulse (P1) of increasing duration applied 10 msec before a test pulse (P2). The long-lasting current trace is the last P1 pulse (30 msec duration). D, Normalized peak TTX-R INa(P2) was plotted against the conditioning pulse (P1) duration. The 30 msec P1 current (inverted and scaled) is superimposed. Experiments were performed using a CsCl-based (140 mm) intracellular solution and 300 nm extracellular TTX.
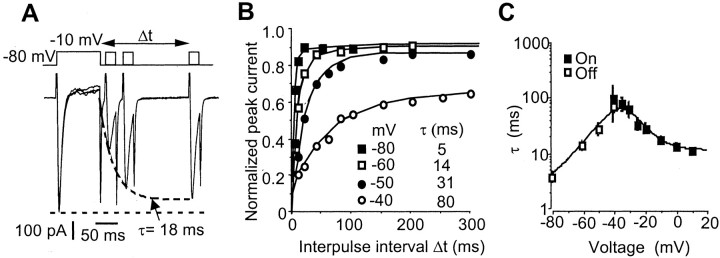
The kinetics of inactivation were determined by fitting a single exponential function to the falling phase of TTX-RINa evoked at various potentials. This yielded time constants of the inactivation process that were strongly voltage-dependent. A command potential at –20 mV induced a current with an inactivation time constant of 12 ± 1 msec (n = 6), whereas at –40 mV, the inactivation time constant was 101 ± 9 msec (n = 6). Inactivation kinetics were also derived from the effects of a conditioning voltage step of increasing duration [pulse 1 (P1)] on the peak current evoked at –20 mV (P2). Both procedures led to similar results (Figs.5C,D). The second procedure, however, revealed that the inactivation was a voltage- but not a current-dependent process. In effect, the falling phase of the current evoked by the P1 voltage step matched perfectly the decay in the P2 current, meaning that the time course of inactivation is constant for a given voltage whatever the current activation state (Fig. 5D). Kinetics of the inactivating “on” process have been collected in the –40 to +20 mV voltage range (Fig. 6C).
Fig. 6.
Kinetics of TTX-R INafast inactivation. A, Time course of recovery from fast inactivation in an AH neuron. A short pulse (25 msec duration) was applied at increasing delay (Δt) after a 100 msec voltage step at –10 mV. The test current recovered 90% of its initial amplitude with an 18 msec time constant. B, Voltage dependence of the recovery from fast inactivation at various potentials. Plotted are the peak inward currents versus interpulse interval for the indicated holding potentials. C, Time constants of inactivation (filled squares, “on” process) and recovery from inactivation (open squares, “off” process) were plotted against membrane potential. Experiments were performed using a CsCl-based (140 mm) intracellular solution and 300 nmextracellular TTX.
To investigate the kinetics of recovery from inactivation, we determined the time constants by the use of a double-pulse protocol (Fig. 6A). A short test pulse at –10 mV was applied at an increasing delay after a 100 msec inactivating pulse at the same potential, and the ratio of the peak current amplitudes was used to calculate the extent of recovery at a given time interval. Recovery from inactivation occurred exponentially (Fig.6B). It was very fast (τ < 10 msec) at voltages more negative than –70 mV and slower near and above the resting potential of AH neurons. An asymptotic level of 100% of recovery from inactivation was never reached within 300 msec at an interpulse potential of –80 mV (Fig. 6B). We therefore used a double-exponential function yielding two time constants indicative of the contribution of an additional slow recovery phase. At an interpulse potential of –80 mV, the fast time constant was 5 msec, and the slow time constant was ≥250 msec (Fig.6C). This slow recovery phase accounted for <10% of the full recovery time course at voltages more negative than –60 mV. At more positive levels, however, the ratio of the slow and the fast recovery phases slightly increased.
Ultraslow inactivation
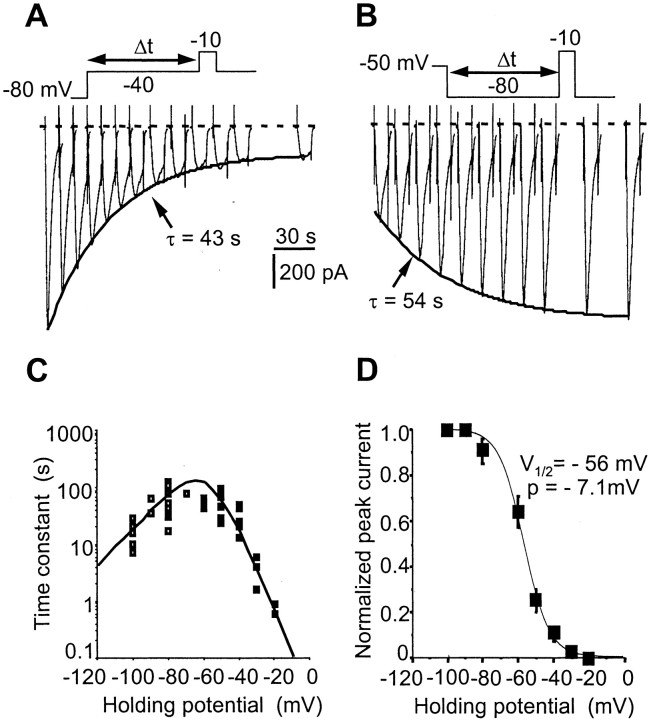
Peak amplitude of TTX-R INaevoked by a voltage step to –10 mV became progressively smaller after a transition of holding potential from –80 to more positive voltages (Fig. 7A). This phenomenon was bidirectional; i.e., TTX-R INa slowly recovered its initial amplitude when the holding potential was set back to –80 mV (Fig. 7B). Long periods, over minutes, were required for the current to reach a new steady-state level at a given potential. This slowly developing inactivation is therefore kinetically distinct from the fast inactivation described above.
Fig. 7.
TTX-R INa ultraslow inactivation. A, Slow exponential decrease of TTX-RINa when the holding potential was stepped from –80 to –40 mV. The time scale refers to duration Δt at –40 mV. Test pulse duration, 50 msec.B, Same experiment as in A but with the holding potential stepped back from –50 to –80 mV. The TTX-RINa recovered its control amplitude exponentially with the indicated time constant. Test pulse duration, 50 msec. C, Voltage dependence of the on (filled squares) and off (open squares) processes of the ultraslow inactivation. Experiments were performed using a CsCl-based (140 mm) intracellular solution and 300 nm extracellular TTX. D, Steady-state ultraslow inactivation curve. Each point is the mean ± SEM for 12 AH neurons in which the holding potential was applied for 4 min. Data points were fitted to a Boltzmann function giving an ultraslow V1/2 of –56 mV and a p of –7.1 mV.
The transition in current amplitude in response to changes in holding potential was best described by a single exponential function at all potentials examined. At the resting membrane potential, the time constant of the slow inactivation amounted to 90 sec and became progressively faster (<10 sec) as the level was set to more hyperpolarized or depolarized levels (Fig. 7C). The steady-state slow inactivation was measured using long conditioning prepulses to various potentials and plotting the normalized TTX-RINa amplitude against the conditioning potential (Fig. 7D). The resulting data points could be well described by the Boltzmann equation with a V1/2of –56 ± 2 mV and a slope factor of –7.1 ± 0.8 mV, indicating that TTX-R INa is reduced by ∼50% at potentials close to rest.
Shift in the TTX-R INa voltage-dependent properties by using intracellular CsF
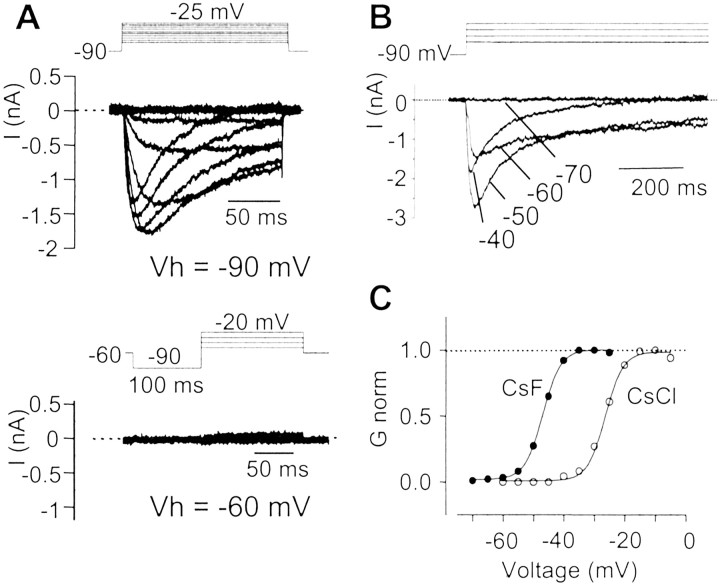
Many studies on TTX-resistant Na+currents have been performed using CsF instead of CsCl in the pipette solution (Cummins et al., 1999; Renganathan et al., 2000). To permit comparison with these studies, we performed whole-cell recording using F− (Cs+) as the principal internal anion. CsF produced a negative shift in the activation curve (V1/2, –54 ± 2 mV;n = 8) by ∼20 mV (Fig.8A,C). This voltage-dependent shift promoted a current that persisted for hundreds of milliseconds at potentials between –70 and –50 mV (Fig.8B); holding the cell for at least 1.5 sec at –60 mV fully inactivated TTX-R INa (Fig.8A, bottom panel), consistent with earlier reports (Cummins et al., 1999; Dib-Hajj et al., 1999a) on the current produced by Nav1.9.
Fig. 8.
Properties of TTX-RINa using F− as the major intracellular anion. Experiments were performed using intracellular CsF (140 mm) instead of CsCl.A, Top, Representative TTX-RINa traces recorded in an AH neuron in response to 150 msec depolarizing voltage steps (–70 to –25 mV) from a holding potential of –90 mV. Bottom, Holding the neuron at –60 mV for 1.5 sec fully inactivated TTX-RINa. In these experiments, a 100 msec prepulse to –90 mV was applied to remove the fast inactivation (inset). B, Persistent activation of TTX-R INa evoked by 750 msec voltage steps at –60 and –50 mV. C, Activation curves of TTX-RINa obtained from the neuron inA (filled circles) and from a neuron recorded using 140 mm intracellular CsCl for comparison (same cell as in Fig. 4A; open circles). Experiments were performed using 300 nmextracellular TTX. Vh, Holding potential.
Detection of NaV1.9 (Scn11a) mRNA in guinea pig myenteric plexus
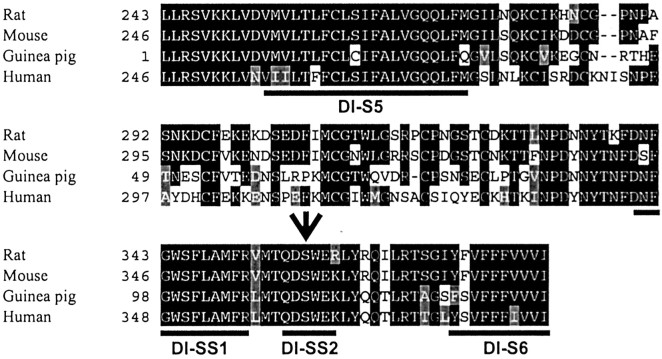
We determined which genes encoding TTX-resistant Na+ channel α subunits are expressed in the guinea pig myenteric plexus. A homology search on the reported sequences of the different members of the neuronal TTX-R Na+ channel genes, namely NaV1.8 (Scn10a) and NaV1.9 (Scn11a), both expressed in DRGs, showed several highly conserved regions on either side of the critical TTX-binding residues in domain I. Using these regions, we designed degenerate primers (see Materials and Methods) and amplified ∼450–480 bp cDNAs, which had been reverse-transcribed from total RNA extracted from guinea pig LMMP preparations using these primers. As a result, we obtained a 451 bp cDNA fragment from domain I encoding the entire S5 to the N-terminal part of S6, which shows the highest homology to NaV1.9 from rat, mouse, and human. The deduced amino acid sequence is 72% identical to rat and mouse NaV1.9 (Fig. 9), whereas it is only 55% identical to rat and mouse NaV1.8. We tentatively assumed that this sequence encoded the guinea pig homolog of NaV1.9 (gpNaV1.9). The TTX phenotype determinant residue in DI-SS2, serine, and the conserved residues implicated in Na+-selective permeability indicate that gpNaV1.9 is a TTX-R Na+ channel. As already reported, the sequence identity of NaV1.9 among species is lower than that for other channel α subunits (Dib-Hajj et al., 1999a,b). As expected, gpNaV1.9 shows most of the divergent amino acids in the extracellular linker, a domain in which most changes are commonly observed among NaV1.9 sequences (Fig. 9). Sequence analysis of most PCR clones isolated from both the ileum and duodenum of guinea pig identified NaV1.9. In similar preparations from rat myenteric plexuses, NaV1.9 but not NaV1.8 mRNAs were also amplified by RT-PCR using specific rat primers (see Fig. 11E).
Fig. 9.
Partial sequence alignment of the predicted amino acid sequences of guinea pig (AF521647), mouse (NM011887), rat (NM019265), and human (AF188679) NaV1.9 subunits.Black and gray indicate amino acid identities and similarities, respectively. Amino acid residues corresponding to putative transmembrane segments (S5–S6) areunderlined. The serine residue of DI-SS2 predicted to underlie the TTX-resistant phenotype is shown by anarrow. The gpNaV1.9 sequence is 72% identical to mNaV1.9 and rNaV1.9 and 70% identical to hNaV1.9.
Fig. 11.
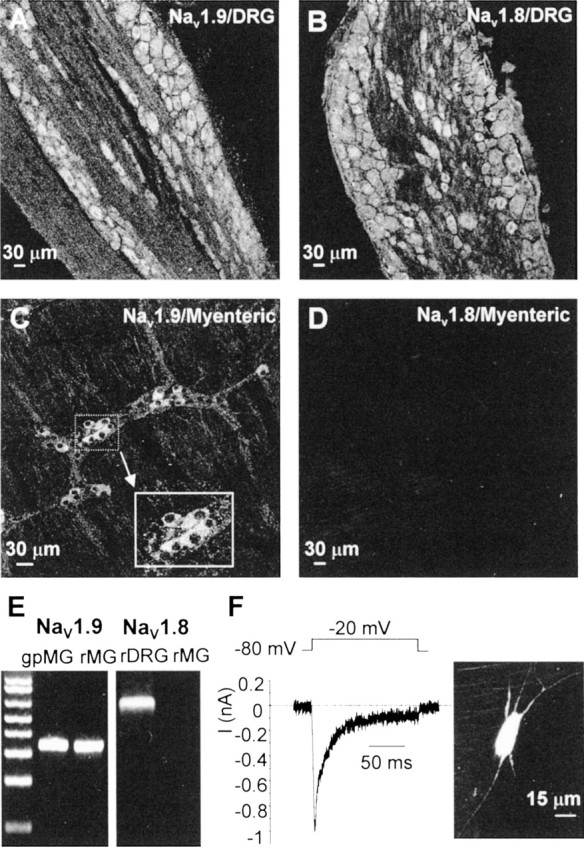
The sodium α subunit NaV1.9 is expressed in rat myenteric neurons. Immunoreactivity for NaV1.9 and NaV1.8 subunits in rat DRG (A, B) and in rat myenteric plexus (C, D) is shown. Experiments were performed using the anti-rNaV1.8 antibody 10169#2 and the anti-rNaV1.9 antibody 6464#2. The same results were obtained with the anti-rNaV1.8 antibody K107 and the anti-rNaV1.9 antibody K186. E, RT-PCR performed using cDNA isolated from rat and guinea pig myenteric plexus using specific primers to the gpNaV1.9 gene.M, One kilobase ladder DNA size standards.F, Representative whole-cell in siturecording of a rat myenteric AH neuron exhibiting TTX-RINa in the presence of 300 nmTTX. Intracellular labeling of the recorded neuron with Lucifer yellow revealed that TTX-R INa is expressed in Dogiel type II neurons.
NaV1.9 mRNA is selectively expressed in myenteric sensory neurons
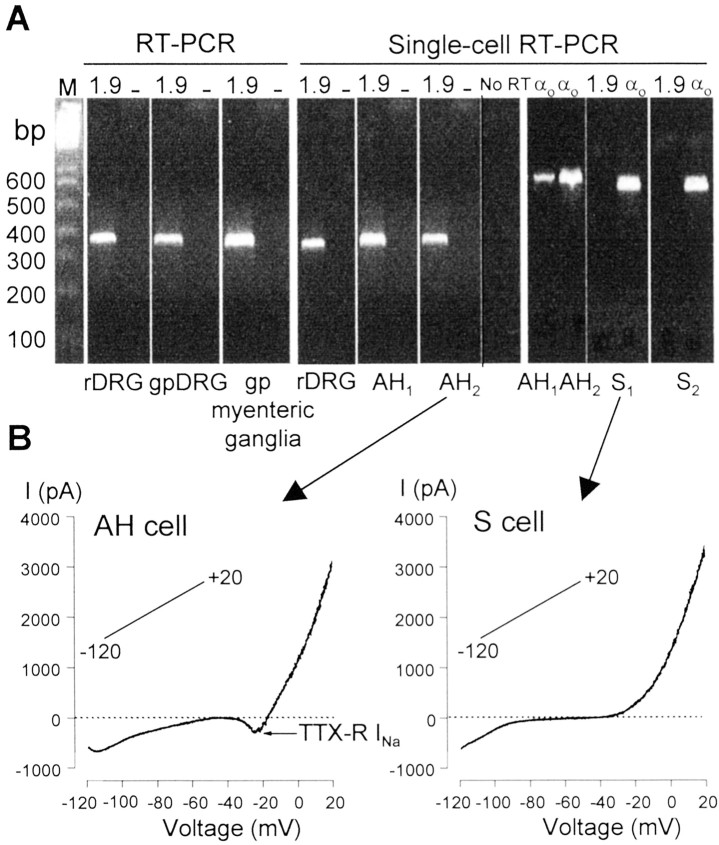
We examined the cell type distribution of the gpNaV1.9 transcript by single-cell RT-PCR using intron-spanning gpNaV1.9-specific primers designed from the cloned sequence. In these experiments, the cytosol of neurons was aspirated after electrophysiological identification of the neuron under study. As a test of primer specificity, RT-PCR was performed initially with rat and guinea pig DRG cDNAs and cDNA derived from guinea pig isolated myenteric ganglia. These experiments revealed that NaV1.9 mRNA is expressed at detectable levels in both DRGs and myenteric ganglia (Fig.10A, left panel). Sequencing of the amplicons yielded the predicted products. Although gpNaV1.9 mRNA was detected in pooled cDNA, at the single-cell level, differences in the expression of NaV1.9 were found between AH and S neurons. Of seven AH neurons (characterized by the slow AHP or TTX-RINa; Fig. 10B), six (85%) showed detectable levels of gpNaV1.9 mRNA, whereas among the eight S-type neurons recorded (which did not display either the slow AHP or TTX-R INa; Fig.10B), none expressed NaV1.9 mRNA. A representative gel in which the PCR amplicons derived from single AH or S cells is shown in Figure 10A, right panel. As a control for the single-cell RT-PCR procedure, approximately one-fourth of the total cellular cDNA from each individual neuron was routinely tested for Gαo-protein subunit mRNA and yielded positive signals in all cells examined (Fig. 10A). No signals were detected in the absence of M-MLV reverse transcriptase (Fig.10A). Taken together, these data show that gpNaV1.9 mRNA is selectively expressed in AH sensory neurons and that its expression directly correlates with the presence of TTX-R INa.
Fig. 10.
The NaV1.9 mRNA is selectively expressed in myenteric AH sensory neurons. A,Left panel, RT-PCR. cDNA isolated from rat DRG, guinea pig DRG, and guinea pig myenteric ganglia was amplified using primers to the gpNaV1.9 gene (1.9). Amplified products were obtained from all cell types but not from negative controls containing no template (–). Right panel, Single-cell RT-PCR from a rat DRG neuron and from electrophysiologically identified guinea pig AH and S myenteric neurons. Two AH cells (AH1,AH2) and two S cells (S1, and S2) are shown. Note that amplified signals were obtained in AH cells but not in S cells. Positive control reactions were performed using specific primers to the αosubunit of G-proteins, a ubiquitously expressed protein. These give a PCR product of 606 bp. Contamination from genomic DNA was routinely tested by omitting the reverse transcriptase in the templates. These controls were consistently negative in these experiments. AH neurons were identified by the sAHP currents characteristic of these cells (data not shown). M, One kilobase ladder DNA size standards. B, Current–voltage relationships obtained using slow voltage ramps (35 mV/sec) in the cells illustrated inA before single-cell RT-PCR. Note that only the AH cell displayed TTX-R INa. Leak currents measured in the –50 to –45 mV voltage range were subtracted.
Selective expression of NaV1.9 protein subunits in sensory neurons
Finally, we have sought evidence for the expression and cellular distribution of NaV1.9 on the protein level using polyclonal antibodies raised against rat epitopes (Black et al., 1999;Coward et al., 2000; Fjell et al., 2000). Control experiments performed on guinea pig DRG neurons were negative for the two anti-NaV1.9 antibodies (6464#2 and K186) raised against the same epitope in the C-terminal domain of rNaV1.9 and were also negative for the two anti-NaV1.8 antibodies raised against different epitopes of rNaV1.8, one in the II–III linker (10169#2) and the other in the C-terminal domain (K107). This indicated that antibodies raised against rat epitopes do not recognize guinea pig sequences. We confirmed that our antibodies did stain rat DRG neurons, producing predominant immunosignals for NaV1.9 and NaV1.8 in small-diameter cells (Fig.11A,B), as described previously (Akopian et al., 1996; Sangameswaran et al., 1996; Dib-Hajj et al., 1998).
Immunoreactivity for NaV1.9 and NaV1.8 protein subunits was therefore tested on myenteric ganglionic neurons of adult rats. Strong immunoreactivity for NaV1.9 but not NaV1.8 was detected in some rat myenteric neurons by confocal immunohistochemistry (Fig. 11C,D). Visualization of the staining revealed a diffuse distribution of NaV1.9 within the cytosol of the cell body that extended slightly into the proximal portions but not along the length of axons. The staining was specific to neurons and did not show up on neighboring glial cells, fibroblasts, and smooth muscle cells. We confirmed the presence of NaV1.9 but not NaV1.8 mRNAs by RT-PCR from cDNA isolated from rat myenteric plexuses (Fig. 11E). We also obtained further evidence that NaV1.9 subunits are selectively expressed in myenteric sensory neurons of rat by combining whole-cell recording of in situ ganglionic neurons with the identification of their morphotypes. All neurons examined that expressed a persistent TTX-resistant Na+current had a polyaxonal morphological type as revealed by Lucifer yellow loading, indicating that, as in guinea pig, these neurons are sensory neurons (Fig. 11F).
Discussion
We have characterized the kinetics and voltage-dependent properties of a previously unreported TTX-resistant Na+ current in myenteric AH neurons. Combining in situ patch-clamp recording, single-cell RT-PCR profiling, and immunodetection we further demonstrated that this current is found in essentially all sensory AH neurons but not in interneurons or motor neurons and was directly correlated with the expression of the NaV1.9 transcript and subunit. Although subtle differences may exist between the TTX-R Na+ current described here and the Nav1.9/NaN persistent current recorded in DRG neurons, the present results provide the first intimation of a contribution by NaV1.9 to native TTX-R Na+ currents in myenteric AH neurons.
A novel TTX-R Na+ current in myenteric neurons
Multiple Na+ currents have been recorded from native neurons that exhibit substantial heterogeneity in gating and TTX sensitivity (Goldin, 2001). The kinetics of the TTX-R currents are slower, and the steady-state inactivation is generally shifted toward less hyperpolarized voltages in comparison with TTX-S currents. These general properties are qualitatively consistent with those of the TTX-R current observed in this study. TTX-RINa expressed in myenteric neurons has a relatively negative threshold (–50 mV) and slow kinetics of activation (τ = ∼10 msec at the midpoint of activation at 33°C). Its activation and steady-state inactivation curves show substantial overlap, defining a large window current that was typically, at its maximum, near 20% of the peak current and accounted for the persistent nature of the current in the negative voltage range. In addition, TTX-R INa also undergoes pronounced ultraslow inactivation. This phenomenon is functionally distinct from the commonly observed fast inactivation (Ogata and Tatebayashi, 1992), as evidenced by the significant differences in kinetics and voltage dependence of these two processes. Importantly, the ultraslow inactivation inhibits the TTX-RINa conductance by half at –60 mV, i.e., near resting membrane potential.
Although TTX-insensitive action potentials were occasionally observed in submucosal neurons of the guinea pig distal colon in studies using sharp microelectrodes (Lomax et al., 2001), this is the first report of a TTX-R Na+ current in myenteric neurons of guinea pig and rat small intestine. Previous voltage-clamp studies performed on cultured myenteric neurons and aiming at isolating Na+ currents failed to detect any TTX-RINa (Zholos et al., 2002). This discrepancy suggests that the expression of the TTX-RINa requires the presence of factors that are present in vivo. This inference is supported by data from many studies showing that neurotrophic factors play a key role in regulating Na+ channel gene expression (Fjell et al., 1999; Boucher et al., 2000; Cummins et al., 2000; Baker and Wood, 2001; Dib-Hajj et al., 2002). Of particular relevance here is the demonstration that the expression of NaV1.9 in DRG neurons is attenuated after several days in culture without added factors and that glial-derived neurotrophic factor is capable of restoring NaV1.9 expression in these neurons both in vitro and in vivo (Cummins et al., 2000).
Biophysical and molecular bases for TTX-RINa
Two neuronal TTX-resistant Na+channel α subunits, NaV1.8/SNS/PN3 (Akopian et al., 1996; Sangameswaran et al., 1996) and NaV1.9/NaN (Dib-Hajj et al., 1998, 1999a,b; Tate et al., 1998; Cummins et al., 1999), both expressed in small DRG neurons, have been cloned (for nomenclature, see Goldin et al., 2000,2001). NaV1.8 encodes a TTX-R channel with slow inactivation kinetics in native DRG neurons and in heterologous expression systems (Akopian et al., 1996; Sangameswaran et al., 1996). Observations in transgenic NaV1.8-null mice (Cummins et al., 1999) and in heterologous expression systems (Dib-Hajj et al., 2002) indicate that NaV1.9/NaN produces a subthreshold and persistent TTX-R Na+current (Cummins et al., 1999).
Our results are consistent with the view that NaV1.9 channels are key determinants of the persistent TTX-R Na+ currents in myenteric neurons. There are four pieces of evidence supporting this conclusion.
First, we have isolated a partial cDNA encoding a voltage-gated Na+ channel from guinea pig myenteric preparations that exhibits typical features of known TTX-R Na+ channels, including the Ser residue in the TTX binding-related site that confers TTX resistance. This amino acid sequence is 72% identical to both rat and mouse NaV1.9, 70% identical to human NaV1.9, and only 55% identical to rat and mouse NaV1.8, indicating that the present sequence corresponds to the guinea pig homolog of NaV1.9 (gpNaV1.9). This degree of sequence identity is expected for NaV1.9 sequences obtained from different species, because the different mammalian homologs of the NaV1.9 gene, in contrast to other Na+ channel genes, are not highly conserved. For example, human NaV1.9 is 74% identical at the amino acid level to both rat and mouse NaV1.9, whereas mouse NaV1.9 is 89% identical to rat NaV1.9 (Dib-Hajj et al., 1999a,b).
Second, single-cell RT-PCR profiling in guinea pig myenteric neurons clearly indicated that expression of TTX-RINa was correlated with the presence of detectable NaV1.9 mRNAs and was strictly restricted to AH- but not S-type neurons (e.g., interneurons and motor neurons). This argues that the difference between AH and S neurons in expressing TTX-R INa can be ascribed to cell type-specific differential transcriptional processing of the NaV1.9 gene.
Third, the conjecture that NaV1.9 channels are major contributors to TTX-R INa is further substantiated by the findings that NaV1.9 mRNA but not NaV1.8 was amplified from cDNA isolated from rat myenteric preparations and that NaV1.9 protein subunits were detected immunologically in rat myenteric neurons, whereas NaV1.8 subunits were not. The failure of two different polyclonal antibodies raised against sequences in the II–III linker and the C terminus of rat NaV1.8 to produce immunological signals in rat myenteric neurons, whereas they consistently stained rat DRG neurons, reinforces this conclusion. It should be noted that previous studies also failed to detect expression of NaV1.8 mRNA in the rat intestine (Akopian et al., 1996).
Last, the properties of TTX-R INaisolated here share many similarities with the Nav1.9/NaN current described in cultured NaV1.8-null DRG neurons (Cummins et al., 1999). In both preparations, the currents activate with slow kinetics (τ = 5–20 msec) and have relatively negative threshold of activation. Moreover, these currents are both resistant to cadmium and exhibit persistent behavior as well as ultraslow inactivation.
Myenteric neuron TTX-R INa (this study) and DRG neuron Nav1.9/NaN (Cummins et al., 1999) differed in their voltage-dependent properties in that the latter displays a hyperpolarized shift of ∼20 mV in the voltage dependence of activation–fast inactivation and ultraslow inactivation. Although this biophysical difference may arise from multiple mechanisms, including interspecies molecular variability, different combinations of auxiliary β subunits (Cummins et al., 2001; Vijayaragavan et al., 2001), or differential glycosylation states (Tyrrell et al., 2001), our voltage-clamp experiments using CsF instead of CsCl in the intracellular solution provided some insights into the origin of this voltage-dependent shift. The properties of TTX-RINa in myenteric neurons isolated using CsF (activation threshold and half-activation voltages shifted negatively by ∼20 to –65 and –54 mV, respectively, and full inactivation at –60 mV) were essentially similar to those of Nav1.9/NaN recorded using CsF in DRG neurons (Cummins et al., 1999).
Taken together, and although we cannot rule out a contribution by another sodium channel α subunit, these properties support the conclusion that the persistent TTX-RINa in AH neurons is produced by Nav1.9.
Cell-specific expression and physiological implications
Our results demonstrate that TTX-RINa and its putative molecular correlate NaV1.9 are selectively expressed in sensory neurons of the myenteric plexus. We consider the cells studied to have been sensory AH neurons on the basis of (1) their Dogiel type II morphology, typical of sensory neurons both in guinea pig and rat; and (2) the slow afterhyperpolarization current characteristic of AH sensory neurons. The presence of NaV1.9 mRNA and subunit may therefore constitute a phenotypic marker of AH sensory neurons.
The selective expression of TTX-R INaand NaV1.9 in sensory AH neurons provides a foundation for explaining the specific functions of these neurons in the ENS. In C-type DRG neurons, Nav1.9/NaN does not participate in action potential electrogenesis and is thought to be involved in subthreshold electrogenesis (Herzog et al., 2001; Dib-Hajj et al., 2002). As shown with Nav1.9/NaN (Herzog et al., 2001), the slow activation kinetics of TTX-R INapreclude involvement of TTX-R INa in fast (TTX-S) spike electrogenesis (Zholos et al., 2002). Rather, TTX-RINa may act as a booster of subthreshold electrogenesis and firing rate, because it is persistent at near-resting membrane potentials and capable of sustaining slow, regenerative responses. Such active responses may participate in regulating neuronal gain in response to depolarizing inputs. Of relevance is the fact that sensory neurons of the ENS receive synaptic inputs in the form of slow EPSPs (Johnson et al., 1980; Hodgkiss and Lees, 1984) or long-lasting postsynaptic excitation (Clerc et al., 1999). Therefore, we hypothesize that TTX-RINa modulates synaptic responsiveness and participates in determining the firing pattern of the sensory responses.
In conclusion, the present study shows for the first time that sensory neurons of the myenteric plexus express a persistent, TTX-resistant Na+ current and provides concordant evidence for the expression of the NaV1.9 gene product in these neurons. These observations support the conclusion that NaV1.9 is a major contributor to the TTX-resistant Na+ current in myenteric neurons. The distinct functional properties of this current may modulate the cellular excitability and may shape the integrative functions of myenteric sensory neurons.
Footnotes
This work was supported by the Centre National de la Recherche Scientifique, GlaxoSmithKline, Wellcome Trust Programme Grant 038171 (P.D.), and a grant from the Department of Veterans Affairs (S.G.W.). We thank J. J. Clare (GlaxoSmithKline, Neurology Centre of Excellence for Drug Discovery, Harlow, UK) for the gift of rNaV1.8 (K107) and rNaV1.9 (K186) antibodies, D. A. Brown (department of Pharmacology, University College London) and C. A. Jones for helpful discussion, and A. Fernandez and J. Ganem for expert technical assistance.
Correspondence should be addressed to Maurice Gola, Laboratoire Intégration des Informations Sensorielles, Unite Mixte de Recherche 6150, Centre National de la Recherche Scientifique, Institut Fédératif de Recherche Jean Roche, Faculté de Médecine, Bd. P. Dramard 13916 Marseille cedex 20. E-mail:gola.m@jean-roche.univ-mrs.fr.
References
- 1.Akopian AN, Sivilotti L, Wood JN. A tetrodotoxin-resistant voltage-gated sodium channel expressed by sensory neurons. Nature. 1996;379:257–262. doi: 10.1038/379257a0. [DOI] [PubMed] [Google Scholar]
- 2.Baker MD, Wood JN. Involvement of Na+ channels in pain pathways. Trends Pharmacol Sci. 2001;22:27–31. doi: 10.1016/s0165-6147(00)01585-6. [DOI] [PubMed] [Google Scholar]
- 3.Bertrand PP, Kunze WA, Bornstein JC, Furness JB, Smith ML. Analysis of the responses of myenteric neurons in the small intestine to chemical stimulation of the mucosa. Am J Physiol. 1997;273:G422–G435. doi: 10.1152/ajpgi.1997.273.2.G422. [DOI] [PubMed] [Google Scholar]
- 4.Black JA, Fjell J, Dib-Hajj SD, Duncan ID, O'Connor LT, Fried K, Gladwell Z, Tate S, Waxman SG. Abnormal expression of SNS/PN3 in cerebellar Purkinje cells following loss of myelin in the taiep rat. NeuroReport. 1999;10:913–918. doi: 10.1097/00001756-199904060-00004. [DOI] [PubMed] [Google Scholar]
- 5.Blum R, Kafitz KW, Konnerth A. Neurotrophin-evoked depolarization requires the sodium channel Nav1.9. Nature. 2002;419:687–693. doi: 10.1038/nature01085. [DOI] [PubMed] [Google Scholar]
- 6.Boucher TJ, Okuse K, Bennett DL, Munson JB, Wood JN, McMahon SB. Potent analgesic effects of GDNF in neuropathic pain states. Science. 2000;290:124–127. doi: 10.1126/science.290.5489.124. [DOI] [PubMed] [Google Scholar]
- 7.Clerc N, Furness JB, Kunze WAA, Thomas EA, Bertrand PP. Long-term effects of synaptic activation at low frequency on excitability of myenteric AH neurons. Neuroscience. 1999;90:279–289. doi: 10.1016/s0306-4522(98)00431-x. [DOI] [PubMed] [Google Scholar]
- 8.Coward K, Plumpton C, Facer P, Birch R, Carlstedt T, Tate S, Bountra C, Anand P. Immunolocalization of SNS/PN3 and NaN/SNS2 sodium channels in human pain states. Pain. 2000;85:41–50. doi: 10.1016/s0304-3959(99)00251-1. [DOI] [PubMed] [Google Scholar]
- 9. Cummins TR, Dib-Hajj SD, Black JA, Akopian AN, Wood JN, Waxman SG. A novel persistent tetrodotoxin-resistant sodium current in SNS-null and wild-type small primary sensory neurons. J Neurosci 19 1999. RC43(1–6). [DOI] [PMC free article] [PubMed] [Google Scholar]
- 10.Cummins TR, Black JA, Dib-Hajj SD, Waxman SG. Glial-derived neurotrophic factor upregulates expression of functional SNS and NaN sodium channels and their currents in axotomized dorsal root ganglion neurons. J Neurosci. 2000;20:8754–8761. doi: 10.1523/JNEUROSCI.20-23-08754.2000. [DOI] [PMC free article] [PubMed] [Google Scholar]
- 11.Cummins TR, Aglieco F, Renganathan M, Herzog RI, Dib-Hajj SD, Waxman SG. Nav1.3 sodium channels: rapid repriming and slow closed-state inactivation display quantitative differences after expression in a mammalian cell line and in spinal sensory neurons. J Neurosci. 2001;21:5952–5961. doi: 10.1523/JNEUROSCI.21-16-05952.2001. [DOI] [PMC free article] [PubMed] [Google Scholar]
- 12.Delmas P, Coste B. Na+ channel NaV1.9: in search of a gating mechanism. Trends Neurosci. 2003;26:55–57. doi: 10.1016/s0166-2236(02)00030-9. [DOI] [PubMed] [Google Scholar]
- 13.Dib-Hajj SD, Tyrrell L, Black JA, Waxman SG. NaN, a novel voltage-gated Na channel, is expressed preferentially in peripheral sensory neurons and down-regulated after axotomy. Proc Natl Acad Sci USA. 1998;95:8963–8968. doi: 10.1073/pnas.95.15.8963. [DOI] [PMC free article] [PubMed] [Google Scholar]
- 14.Dib-Hajj SD, Tyrrell L, Cummins TR, Black JA, Wood PM, Waxman SG. Two tetrodotoxin-resistant sodium channels in human dorsal root ganglion neurons. FEBS Lett. 1999a;462:117–120. doi: 10.1016/s0014-5793(99)01519-7. [DOI] [PubMed] [Google Scholar]
- 15.Dib-Hajj SD, Tyrrell L, Escayg A, Wood PM, Meisler MH, Waxman SG. Coding sequence, genomic organization, and conserved chromosomal localization of the mouse gene Scn11a encoding the sodium channel NaN. Genomics. 1999b;59:309–318. doi: 10.1006/geno.1999.5890. [DOI] [PubMed] [Google Scholar]
- 16.Dib-Hajj SD, Black JA, Cummins TR, Waxman SG. NaN/NaV1.9: a sodium channel with unique properties. Trends Neurosci. 2002;25:253–259. doi: 10.1016/s0166-2236(02)02150-1. [DOI] [PubMed] [Google Scholar]
- 17.Fjell J, Cummins TR, Dib-Hajj SD, Fried K, Black JA, Waxman SG. Differential role of GDNF and NGF in the maintenance of two TTX-resistant sodium channels in adult DRG neurons. Mol Brain Res. 1999;67:267–282. doi: 10.1016/s0169-328x(99)00070-4. [DOI] [PubMed] [Google Scholar]
- 18.Fjell J, Hjelmström P, Hormuzdiar W, Milenkovic M, Aglieco F, Tyrrell L, Dib-Hajj SD, Waxman SG, Black JA. Localization of the TTX-resistant sodium channel NaN in nociceptors. NeuroReport. 2000;11:199–202. doi: 10.1097/00001756-200001170-00039. [DOI] [PubMed] [Google Scholar]
- 19.Franklin JL, Willard AL. Voltage-dependent sodium and calcium currents of rat myenteric neurons in cell culture. J Neurophysiol. 1993;69:1264–1275. doi: 10.1152/jn.1993.69.4.1264. [DOI] [PubMed] [Google Scholar]
- 20.Furness JB, Kunze WAA, Bertrand PP, Clerc N, Bornstein JC. Intrinsic primary afferent neurons of the intestine. Prog Neurobiol. 1998;54:1–18. doi: 10.1016/s0301-0082(97)00051-8. [DOI] [PubMed] [Google Scholar]
- 21.Furness JB, Bornstein JC, Kunze WAA, Bertrand PP, Clerc N. The enteric nervous system and its extrinsic connections. In: Yamada T, editor. Textbook of gastroenterology, Ed 3, Vol 1. Lippincott Williams & Wilkins; Baltimore: 1999. pp. 11–35. [Google Scholar]
- 22.Galligan JJ, Tatsumi H, Shen KZ, Surprenant A, North RA. Cation current activated by hyperpolarisation (IH) in guinea pig enteric neurons. Am J Physiol. 1990;259:G966–G972. doi: 10.1152/ajpgi.1990.259.6.G966. [DOI] [PubMed] [Google Scholar]
- 23.Goldin AL. Resurgence of sodium channel research. Am Rev Physiol. 2001;63:871–894. doi: 10.1146/annurev.physiol.63.1.871. [DOI] [PubMed] [Google Scholar]
- 24.Goldin AL, Barchi RL, Caldwell JH, Hofmann F, Howe JR, Hunter JC. Nomenclature of voltage-gated sodium channels. Neuron. 2000;28:365–368. doi: 10.1016/s0896-6273(00)00116-1. [DOI] [PubMed] [Google Scholar]
- 25.Herzog RI, Cummins TR, Waxman SG. Persistent TTX-resistant Na+ current affects resting potential and response to depolarization in simulated spinal sensory neurons. J Neurophysiol. 2001;86:1351–1364. doi: 10.1152/jn.2001.86.3.1351. [DOI] [PubMed] [Google Scholar]
- 26.Hodgkiss JP, Lees GM. Slow intracellular potentials in AH-neurons of the myenteric plexus evoked by repetitive activation of synaptic inputs. Neuroscience. 1984;11:255–261. doi: 10.1016/0306-4522(84)90228-8. [DOI] [PubMed] [Google Scholar]
- 27.Johnson SM, Katayama Y, North RA. Slow synaptic potentials in neurones of the myenteric plexus. J Physiol (Lond) 1980;301:505–516. doi: 10.1113/jphysiol.1980.sp013220. [DOI] [PMC free article] [PubMed] [Google Scholar]
- 28.Kunze WAA, Bornstein JC, Furness JB. Identification of sensory nerve cells in a peripheral organ (the intestine) of a mammal. Neuroscience. 1995;66:1–4. doi: 10.1016/0306-4522(95)00067-s. [DOI] [PubMed] [Google Scholar]
- 29.Kunze WAA, Clerc N, Furness JB, Gola M. The soma and neurites of primary afferent neurones in the guinea-pig intestine respond differentially to deformation. J Physiol (Lond) 2000;526:375–385. doi: 10.1111/j.1469-7793.2000.00375.x. [DOI] [PMC free article] [PubMed] [Google Scholar]
- 30.Liu M, Seino S, Kirchgessner AL. Identification and characterization of glucoresponsive neurons in the enteric nervous system. J Neurosci. 1999;19:10305–10317. doi: 10.1523/JNEUROSCI.19-23-10305.1999. [DOI] [PMC free article] [PubMed] [Google Scholar]
- 31.Lomax AE, Bertrand PP, Furness JB. Electrophysiological characteristics distinguish three classes of neuron in submucosal ganglia of the guinea-pig distal colon. Neuroscience. 2001;103:245–255. doi: 10.1016/s0306-4522(00)00545-5. [DOI] [PubMed] [Google Scholar]
- 32.Ogata N, Tatebayashi H. Slow inactivation of tetrodotoxin-insensitive Na+ channels in neurons of rat dorsal root ganglia. J Membr Biol. 1992;129:71–80. doi: 10.1007/BF00232056. [DOI] [PubMed] [Google Scholar]
- 33.Renganathan M, Cummins TR, Hormuzdiar WN, Waxman SG. α-SNS produces the slow TTX-resistant sodium current in large cutaneous afferent DRG neurons. J Neurophysiol. 2000;84:710–718. doi: 10.1152/jn.2000.84.2.710. [DOI] [PubMed] [Google Scholar]
- 34.Rugiero F, Gola M, Kunze WAA, Reynaud JC, Furness JB, Clerc N. Analysis of whole-cell currents by patch clamp of guinea-pig myenteric neurones in intact ganglia. J Physiol (Lond) 2002a;538:447–463. doi: 10.1113/jphysiol.2001.013051. [DOI] [PMC free article] [PubMed] [Google Scholar]
- 35.Rugiero F, Mistry M, Sage D, Clerc N, Delmas P, Gola M. A slowly inactivating tetrodotoxin-resistant sodium current in myenteric sensory neurons. FENS Abstr. 2002b;1:A013.10. [Google Scholar]
- 36.Sangameswaran L, Delgado SG, Fish LM, Koch BD, Jakeman LB, Stewart GR, Sze P, Hunter JC, Eglen RM, Herman RC. Structure and function of a novel voltage-gated, tetrodotoxin-resistant sodium channel specific to sensory neurons. J Biol Chem. 1996;271:5953–5956. doi: 10.1074/jbc.271.11.5953. [DOI] [PubMed] [Google Scholar]
- 37.Shah MM, Mistry M, Marsh SJ, Brown DA, Delmas P. Molecular correlates of the M-current in cultured rat hippocampal neurons. J Physiol (Lond) 2002;544:29–37. doi: 10.1113/jphysiol.2002.028571. [DOI] [PMC free article] [PubMed] [Google Scholar]
- 38.Tate S, Benn S, Hick C, Trezise D, John V, Mannion RJ, Costigan M, Plumpton C, Grose D, Gladwell Z, Kendall G, Dale K, Bountra C, Woolf CJ. Two sodium channels contribute to the TTX-R sodium current in primary sensory neurons. Nat Neurosci. 1998;1:653–655. doi: 10.1038/3652. [DOI] [PubMed] [Google Scholar]
- 39.Tyrrell L, Renganathan M, Dib-Hajj SD, Waxman SG. Glycosylation alters steady-state inactivation of sodium channel NaV1.9/NaN in dorsal root ganglion neurons and is developmentally regulated. J Neurosci. 2001;21:9629–9637. doi: 10.1523/JNEUROSCI.21-24-09629.2001. [DOI] [PMC free article] [PubMed] [Google Scholar]
- 40.Vijayaragavan K, O'Leary ME, Chahine M. Gating properties of NaV1.7 and NaV1.8 peripheral nerve sodium channels. J Neurosci. 2001;21:7909–7918. doi: 10.1523/JNEUROSCI.21-20-07909.2001. [DOI] [PMC free article] [PubMed] [Google Scholar]
- 41.Vogalis F, Hillsley K, Smith TK. Diverse ionic currents and electrical activity of cultured myenteric neurons from the guinea pig proximal colon. J Neurophysiol. 2000;83:1253–1263. doi: 10.1152/jn.2000.83.3.1253. [DOI] [PubMed] [Google Scholar]
- 42.Waxman SG. Transcriptional channelopathies: an emerging class of disorders. Nat Rev Neurosci. 2001;2:652–659. doi: 10.1038/35090026. [DOI] [PubMed] [Google Scholar]
- 43.Zholos AV, Baidan LV, Wood JD. Sodium conductance in cultured myenteric AH-type neurons from guinea-pig small intestine. Aud Neurosci. 2002;96:93–102. doi: 10.1016/s1566-0702(01)00364-2. [DOI] [PubMed] [Google Scholar]


