

Abstract
Previous studies have demonstrated that bone morphogenetic proteins (BMPs) activate the Smad1 signaling pathway to regulate cell determination and differentiation in the embryonic nervous system. Studies examining gene and protein expression in the rat cerebellum suggest that this pathway also regulates postnatal differentiation. Using microarrays, we found that Smad1 mRNA expression in the cerebellum increases transiently at postnatal day 6 (P6). Immunohistochemistry and Western blots showed that Smad1 and BMP4 proteins are present in the cerebellum, and that their expression also changes postnatally. The proteins are detectable at P4–P6, a stage at which most cerebellar cells reside in the external germinal layer (EGL), where they extensively differentiate. The levels become maximal at P8–P10, when neurons begin to migrate from the EGL into their mature positions in the internal granule layer. In cerebellar cultures prepared at P6 or P10, BMP4 activates Smad1 signaling to modulate cell differentiation. Brief BMP4 application caused Smad1 translocation from the neuronal cytoplasm into the nucleus, where it is known to regulate transcription in association with Smad4. Longer BMP4 treatment promoted the differentiation of both neuronal and non-neuronal cells. By 3 d, neuronal processes appeared more fasciculated, and the level of synaptotagmin, a protein found in synaptic vesicles, increased. In addition, many astroglial cells became more branched and stellate in morphology. The BMP-induced changes were reduced by treatment with antisense oligonucleotides to Smad1 or Smad4. These findings in vivo and in culture suggest that BMP4 and Smad1 signaling participate in regulating postnatal cerebellar differentiation.
Keywords: Smad1, BMP, granule neurons, cerebellum, differentiation, microarrays
Introduction
The rodent cerebellum offers a model system for examining postnatal differentiation because it develops extensively during the first 3 weeks of life (Altman and Bayer, 1997). In the first postnatal week, granule neuron precursors in the external germinal layer (EGL) of the cerebellar cortex proliferate. As the neurons differentiate, they move into an inner zone of the EGL and then begin to migrate to their mature positions in the internal granule cell layer (IGL) during the second postnatal week. By the end of the third week, migration is complete, and the EGL ceases to exist. The fact that cells can be prepared from the EGL (Raetzman and Siegel, 1999) greatly facilitates analysis of the molecular steps underlying cell migration and differentiation. Recent studies have demonstrated that the potential of these neurons to differentiate in culture is dependent on the age at which they are prepared (Behringer et al., 1996; Raetzman and Siegel, 1999). The ability of the cells to express some GABAA receptor subunits is particularly striking. When cultures are prepared between postnatal day 2 (P2) and P6, the mRNAs encoding the GABAA receptor β2 and γ2 subunits are expressed at low and constant levels. In contrast, transcript levels rise severalfold over time in cultures prepared at P8–P10, a pattern similar to that observed in vivo. These age-dependent differences in the capacity of EGL cells to express receptor subunits presumably result from the alterations in gene expression and signaling that occur during cerebellar development.
Although EGL differentiation has been well characterized, much less is known about the genes that govern this process (Goldowitz and Hamre, 1998; Dahmane and Ruiz-i-Altaba, 1999; Bhatt et al., 2000). To search for the genes involved in this process, microarray assays were performed using cerebellar cells prepared at P4, P6, P8, and P10. One temporally regulated gene identified using this approach was Smad1. SMAD proteins are known to transduce the actions of proteins of the transforming growth factor-β (TGF-β) family, a large family that includes the TGF-βs, activin, and bone morphogenetic proteins (BMPs). Smad1, an intracellular protein, is activated by BMP binding to receptors on the cell surface (Kingsley, 1994; Heldin et al., 1997; Wrana and Attisano, 2000). After receptor activation, Smad1 becomes phosphorylated and associates with Smad4. The complex is then translocated into the nucleus, where it is incorporated into a transcriptional unit that modulates gene expression (Massague et al., 2000). This signaling pathway has been implicated in the regulation of cell determination, differentiation, and morphogenesis during embryogenesis (Kingsley, 1994; Hogan, 1996).
To examine the role of BMP and Smad1 in the postnatal differentiation of the cerebellum, studies were performed in vivo and in culture. These studies demonstrate that Smad1 and BMP4 are expressed in the cerebellum in vivo, and that their levels increase transiently during early postnatal ontogeny. In addition, BMP4 promotes differentiation via Smad1 signaling in cultures enriched in cells from the EGL. Brief treatment with BMP4 induces Smad1 translocation from the cytoplasm into the nuclei of neurons; longer applications promote neuronal and non-neuronal cell differentiation. These studies demonstrate the importance of this signaling pathway in regulating cerebellar cell differentiation.
Materials and Methods
Microarrays
Dissociated cells were prepared from rat (Sprague Dawley;Zivic-Miller Laboratories, Zelienople, PA) cerebella at P4, P6, P8, and P10 using the cell culture protocol (Beattie and Siegel, 1993;Behringer et al., 1996; Gault and Siegel, 1997) (also see below). For each age, cerebellar cortices were removed from 20 to 30 animals, pooled, and digested with 0.05% trypsin for 12 min at 37°C. Preparations of freshly dissociated cells were triturated in the presence of DNase, and RNA was prepared from each sample using Trizol (Invitrogen, Grand Island, NY). Labeled cDNAs were then produced using Affymetrix (Santa Cruz, CA) protocols. Briefly, poly(A+) mRNA was isolated from the RNA samples using the Oligotex kit from Qiagen (Valencia, CA). These mRNAs were used as templates to prepare double-stranded cDNA using the Invitrogen Superscript Choice System. Biotin-labeled cRNAs were synthesized from the cDNA templates using the Ambion (Austin, TX) Megascript T7 kit with the addition of Bio-16-UTP and Bio-11-CTP (Enzo Diagnostics, Farmingdale, NY). The quality of the cRNAs was assessed by hybridization to an Affymetrix test chip containing glyceraldehyde-3-phosphate dehydrogenase, actin, and other control probes. RNA samples exhibiting the best signals on the test chip were each used for a single hybridization to Affymetrix Arrays (RG-U34). After hybridization, the arrays were washed, stained using phycoerythrin-conjugated streptavidin, and read using a Hewlett-Packard (Palo Alto, CA) scanner and Affymetrix GeneChip software.
Protein preparations and Western blot analysis
Smad1, BMP2, and BMP4 expression were examined in samples prepared from the entire cerebellum or dissociated cells from rats ranging in age from P2 to P16 and adults. The cerebellar tissue was harvested from three to six animals at each age and combined to reduce variation. Synaptotagmin and microtubule-associated protein-2 (MAP2) expression were examined in cells cultured at P6 or P10 and maintained for 4–5 d. Extracts were prepared from the tissues or cultured cells using two procedures. First, for Smad1, synaptotagmin, or MAP, the tissues or cells were collected in buffer containing (in mm) 25 Tris-HCl, 137 NaCl, and 3 KCl, pH 7.4, and then centrifuged at 500 × g for 7 min at 4°C (Kumar et al., 2001). Cell pellets were homogenized in buffer (25 mm Tris-HCl, pH 7.4, 5 mmEDTA, 1 mm phenylmethylsulfonyl fluoride, 20 μg/ml leupeptin, 0.1% aprotinin, 1 mmiodoacetamide, 200 μg/ml bacitracin, and 20 μg/ml soybean trypsin inhibitor) for 10 min on ice, followed by sonication for 15–20 sec. The preparations were centrifuged at 14,000 × g for 30 min at 4°C; the resulting pellet was resuspended in homogenization buffer. Alternatively, BMP expression was examined in cerebellar tissue prepared by lysis in eight volumes of 1 m NaCl, 20 mm Tris, 0.5 mm EDTA, 10% glycerol, 1% NP-40, and one-tenth volume of a mammalian tissue extract protease inhibitor mixture (Sigma, St. Louis, MO). The high-salt buffer was required for extraction of the BMPs, perhaps because of their tight association with extracellular matrix molecules (Hall et al., 2002).
For Western blots of Smad1, synaptotagmin, or MAP, 20 μg of protein from each sample was separated on 12% SDS gels and then transferred to nitrocellulose membranes. The membranes were blocked with 5% nonfat dry milk in PBS containing 0.05% Tween 20 (PBST) and incubated for 3 hr at room temperature using antibodies specific for Smad1 (1:2000; Upstate Biotechnology, Lake Placid, NY), synaptotagmin 1a (1:10,000; gift from L. A. Elferink, University of Texas Medical Branch, Galveston, TX) (Elferink et al., 1993), or MAP2 (1:1000; Chemicon International, Temecula, CA). For BMP assays, 15 μg of protein was separated on 15% SDS gels and transferred to polyvinylidene difluoride membranes. After blocking, the filters were incubated overnight at 4°C with antibodies specific for BMP2 (1 μg/ml; Genetics Institute, Cambridge, MA) or BMP4 (1 μg/ml; R&D Systems, Minneapolis, MN) (Hall et al., 2002). After three 10 min washes in PBST, the membranes were incubated for 1 hr at room temperature in horseradish peroxidase-conjugated species-specific IgGs (1:1000; Kirkegaard & Perry, Gaithersburg, MD). The membranes were then washed, and immunoreactive bands were detected using a chemiluminescent horseradish peroxidase substrate (Renaissance Western Blot Chemiluminescence Reagent Plus; NEN Life Sciences, Boston, MA) and Kodak X-OMAT film (Eastman Kodak, Rochester, NY). Pilot experiments were performed to ensure that protein loading and exposure times gave responses in the linear range. To verify protein loading, some blots were stripped and reprobed with an antibody specific for actin (1:1000; Santa Cruz Biotechnology, Santa Cruz, CA). Relative band intensities were compared by analysis of scanned images using the NIH Image program. Similar patterns of protein expression were observed in three or four different experiments.
Tissue culture
Cultures enriched in EGL cells (Raetzman and Siegel, 1999) were prepared from the cerebella of P6 or P10 animals using the procedures described above. The dissociated cells were plated at a density of 2 × 10³cells/mm2 onto poly-l-lysine and laminin-coated 100 mm tissue culture plates (for Western blotting) or 24 well culture dishes containing 13 mm glass coverslips (for immunocytochemistry) in defined medium composed of neurobasal medium (Invitrogen) supplemented with B-27 (Invitrogen), 25 mmKCl, 6.0 gm/l dextrose, 2 mm glutamine, 0.1 U/ml penicillin, and 0.1 mg/ml streptomycin. To examine the short-term effects of BMP2 or BMP4, cultures maintained for 4 d were treated for 45 min with 10 ng/ml protein (R&D Systems), rinsed three times in PBS, and fixed for immunocytochemistry (see below). To examine the effects of longer BMP treatments, 1, 5, or 10 ng/ml BMP was added at plating, and the cultures were examined 3–5 d later for changes in morphology and the expression of neuronal or non-neuronal markers. In some cases, the cultures were treated with BMP4 for shorter periods, rinsed, and returned to control medium before assay. To assess cell proliferation, 10 μm bromodeoxyuridine (BrdU; Roche Diagnostics, Indianapolis, IN) was added on the first day of culture, and the number of cells undergoing division was determined the following day by immunocytochemistry using an antibody against BrdU (1:100; Becton Dickinson, San Jose, CA). In addition, the relative number of neuronal and non-neuronal cells in control and BMP-treated (3 d) cultures was determined by counting cells in 25–30 randomly selected fields on two replicate coverslips. Similar results were obtained from at least three independent experiments.
To determine the importance of SMADs in BMP signaling, cultures were grown in the presence of 3.5 μm antisense oligodeoxynucleotides (ODNs) to rat Smad1 or Smad4 (Genosys, The Woodlands, TX). To enhance uptake into the cells, three bases at the ends of the ODNs were modified to contain phosphorothioate bonds (Pilowsky et al., 1994). Previous studies have demonstrated that the treatment of cerebellar cells in culture with these modified ODNs reduces the levels of targeted proteins without altering cell viability (Piedras-Renteria and Tsien, 1998; Kumar et al., 2001). The probes had the following sequences: Smad1 ODN, 5′-TGAAAACAAGTGGTCA-3′; and SMAD4 ODN, 5′-CTGTGGCACATCAAACT-3′. Neither ODN resembles any other sequence in the GenBank database. To examine the specificity of Smad1 antisense treatments, sister cultures were incubated with the corresponding sense oligonucleotide.
Immunocytochemistry
Cell culture. Control and BMP-treated cells maintained for 1 or 4–5 d in culture were processed for immunocytochemistry as described previously (Kumar et al., 2001). The cells were fixed with 4% formaldehyde in PBS for 20 min at room temperature, rinsed in PBS, and permeabilized by incubation in PBS containing 5% BSA and 0.3% Triton X-100 (dilution buffer) for 1 hr at room temperature. The cells were then incubated in dilution buffer containing antibodies specific for BrdU, Smad1 (1:100), SMAD4 (1:100; Upstate Biotechnology), MAP2 (1:200); synaptotagmin 1a (1:10,000), GFAP (1:400; Becton Dickinson), or BMP4 (1:100) for 1 hr at room temperature. Two procedures were used to detect immunoreactive cells. In most cases, cells incubated with primary antisera were rinsed three times in PBS and then incubated with the appropriate fluorochrome-conjugated species-specific secondary antibody. To enhance Smad1 and Smad4 immunoreactivity, some samples were incubated with primary antibodies, incubated with biotinylated species-specific secondary antibodies (1:300; Jackson ImmunoResearch, West Grove, PA) for 1 hr at room temperature, and then incubated with streptavidin-conjugated horseradish peroxidase for 30 min at room temperature. To detect labeled cells, the samples were processed using the Tyramide Signal Amplification (TSA-Direct) system according to the manufacturer's protocol (NEN Life Sciences). All studies were performed on cells prepared in four to six independent platings. In all studies, the specificity of staining was examined by analyzing cells incubated with only the fluorochrome-conjugated secondary antibody. Only faint background staining was observed using our conditions.
Tissue sections. Fresh cerebella were frozen on dry ice, and 10 μm cryostat sections were cut and stored at −20°C until use. Frozen sections were fixed in 2% formaldehyde at 4°C for 12 min and then permeabilized in PBS containing 0.1% Triton X-100 at room temperature. To detect BMP, the sections were incubated overnight at 4°C in dilution buffer (PBS, 0.1% Triton X-100, 20% goat serum) containing mouse anti-human BMP4 (1:10; R&D Systems). The sections were rinsed in PBS containing 0.1% Triton X-100 and then incubated in biotinylated donkey anti-mouse IgG (1:250; Jackson ImmunoResearch) in buffer for 2 hr. After rinsing, the tissues were incubated in Cy3–streptavidin (1:750 in PBS) for 1 hr. To detect astroglia in the same sections, some tissues were then reacted with rabbit anti-GFAP (1:100) and FITC-conjugated goat anti-rabbit IgG (1:250). Again, only faint background staining was observed in sections incubated with the fluorochrome-conjugated secondary antibody alone.
Cell and tissue staining were examined with a Nikon (Tokyo, Japan) FX-Microphot microscope or with a Zeiss (Oberkochen, Germany) LSM 410 confocal laser scanning microscope using an argon–krypton laser (excitation lines, 488 and 568 nm) and a 100× Plan-Neofluar oil objective. In experiments quantifying staining intensity, all samples were processed using the standard immunofluorescence protocol. Confocal sections (0.5 μm in thickness) were taken of selected cells to localize staining in several planes. After determining the appropriate exposure times for the brightest samples, all images of control and experimental cells were collected using identical magnification and exposure times. Image intensities in the nuclei and cytoplasm of control and treated cells were then compared using the NIH Image program.
Results
Smad1 and BMP4 expression in the cerebellum increase transiently during postnatal ontogeny
Neurons from the EGL of the cerebellum exhibit age-dependent differences in their capacity to differentiate when grown in culture (Behringer et al., 1996; Raetzman and Siegel, 1999). To begin to identify signals involved in regulating EGL differentiation, RNA samples were prepared from cerebellar cells isolated from rats at P4, P6, P8, and P10 and hybridized to a microarray that contains ∼9000 rat genes. These studies demonstrated that 442 genes, including those encoding neurotransmitter receptors and biosynthetic enzymes, neurotrophins, signaling pathway proteins, and transcription factors, exhibited changes in expression of at least threefold over this period. Although the levels of some genes exhibited gradual increases or decreases in expression, others exhibited transient changes. In one such group (45 genes), transcript expression rose from relatively low levels at P4 to peak at P6, a time that coincides with the onset of migration of immature cells from the EGL to their adult positions in the IGL (Altman and Bayer, 1997). An mRNA of particular interest in this group encodes Smad1, a protein that mediates the actions of some of the BMPs. The BMPs, members of the TGF-β superfamily of secreted signaling proteins, are known to be key factors in regulating cellular determination and differentiation during embryogenesis (Hogan, 1996). Although BMPs have been implicated in regulating granule neuron specification during embryogenesis (Alder et al., 1999), our findings suggest that these proteins also modulate postnatal cerebellar development.
To determine whether Smad1 protein expression is temporally regulated in the cerebellum during early postnatal ontogeny, Smad1 levels were analyzed by Western blotting. These studies demonstrated that the Smad1 protein levels change during cerebellar development with a pattern similar to that found for the mRNA on the microarray. As shown in Figure 1A, the Smad1 protein was readily detectable at P2–P4, and its expression increased approximately threefold by P7. Smad1 remained elevated at P13 but declined by P15 to a level only slightly greater than that observed in the first postnatal week. The Smad1 protein further declined in the adult cerebellum, at which time the EGL no longer exists (Altman and Bayer, 1997). At all ages, Smad1 appeared as a doublet of ∼57 kDa. This doublet may represent the phosphorylated and unphosphorylated forms of the protein (Hoodless et al., 1996; Macias-Silva et al., 1996;Massague, 1996).
Fig. 1.

Smad1 and BMP4 protein expression are temporally regulated in the cerebellum. Protein levels increase during early postnatal ontogeny and decline in the adult. A, Representative immunoblot showing Smad1 expression in cerebellar tissue prepared from rats at the indicated postnatal and adult ages.B, Immunoblot of BMP4 expression in cerebellar tissues prepared at the indicated ages. Similar developmental profiles of Smad1 and BMP4 expression were observed in four independent experiments. This blot was stripped and reprobed for actin as a control for sample preparation and loading.
Because Smad1 mediates the effects of BMP2 and BMP4 in vivo(Massague, 2000), additional studies were performed to examine the developmental expression of these proteins in the cerebellum. Western blots demonstrated that the BMP2 and BMP4 proteins are expressed during early postnatal ontogeny. In samples of the entire cerebellum, the level of BMP2 appeared fairly constant at all ages examined (data not shown). In contrast, BMP4 expression (Fig. 1B) exhibited a developmental profile similar to that of Smad1. A weak band of ∼18 kDa, the size of fully processed BMP4 (Hogan, 1996), was detected at P4. Its level increased approximately sixfold to become maximal at P10 and then declined slightly by P15. As with Smad1, the signal was reduced in the adult cerebellum, although its level was still at least twofold greater than that found at P4. The finding that activators of Smad1 signaling are present in the cerebellum supports the possibility that this pathway plays a role in its postnatal differentiation. As a control for sample preparation and loading, the BMP4 blot was stripped and reprobed for actin (Fig.1B). In contrast to BMP4, the intensity of the actin signal varied less than twofold over the experimental time course, a reasonable change considering the extent of cerebellar development during this period.
Smad1 and the BMPs are expressed in the EGL
To investigate the possibility that the Smad1 signaling pathway functions during EGL differentiation, Smad1 and BMP4 expression were examined by Western blotting using samples enriched in cells from this region (Raetzman and Siegel, 1999). These studies demonstrated that both proteins are present in the EGL at all ages between P4 and P16 (Fig. 2), the latest age at which cells are easily isolated from this area. However, in contrast to the dramatic developmental changes in Smad1 protein levels in the entire cerebellum, Smad1 expression in the EGL was strong at all ages (Fig.2A). This apparent difference between the patterns of Smad1 protein expression in the entire cerebellum and that in the EGL presumably reflects the fact that the EGL represents a decreasing fraction of this region as the animal matures. By P21, this region ceases to exist in rodents. The pattern of BMP4 expression was similar to that of Smad1. Again, a strong BMP4 signal was found at all ages examined (Fig. 2B). Its level was maximal between P4 and P10 and declined slightly at P13. The fact that BMP4 expression remains strong as the EGL matures supports the possibility that it modulates differentiation in this cerebellar region. The BMP4 blot in this experiment was also stripped and reprobed for actin as a loading control. As observed above, the intensity of the actin signal showed minimal changes over the experimental time course.
Fig. 2.

Smad1 and BMP4 are expressed in the EGL. EGL cell-enriched samples from animals of the indicated ages were probed for Smad1 (A) or BMP4 (B). The BMP4 blot was stripped and reprobed for actin as a loading control (B). The proteins were detected at all postnatal ages examined. Similar results were obtained in four independent experiments.
The distribution of BMP4 in the cerebellum was examined by immunohistochemistry. These studies demonstrated that BMP4 immunoreactivity was present within many cell populations in P6 (data not shown) and P10 (Fig. 3) cerebella. Within the EGL, BMP4 staining was punctate and appeared to surround cell bodies (Fig. 3B). This pattern could correspond to perikaryal staining of cells within the EGL or to neuronal processes in contact with cells in this region. In addition to the staining in the EGL, virtually all Purkinje neuron cell bodies and axons were positive for BMP4 (Fig. 3A). Finally, intense BMP4 staining was observed in white-matter fiber tracts within the cerebellum (Fig.3D).
Fig. 3.
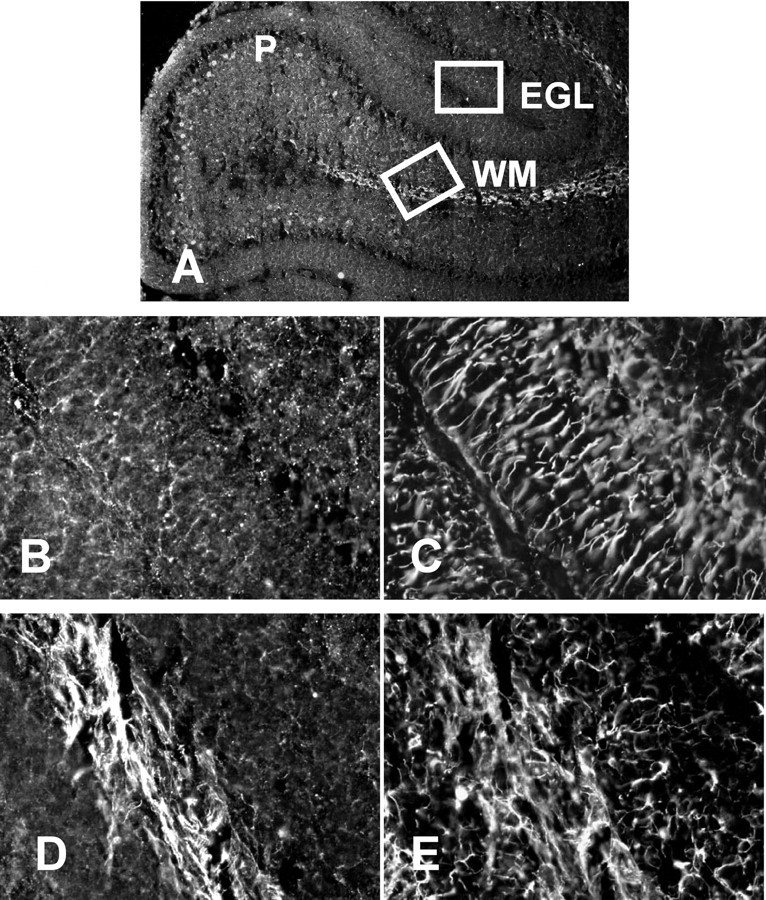
BMP4 is expressed in several cell populations in the postnatal cerebellum. Sections prepared from cerebella isolated from rats at P10 were stained for BMP4 (A, B, D) or GFAP (C, E). BMP4 is detected in the EGL, in Purkinje neurons (P), and in cerebellar fiber tracts (WM). Little overlap is detected in the distribution of BMP4 and GFAP. A, Low-magnification view of tissue stained for BMP4. Insets are viewed at higher magnification in B–E. B, D, Higher-power views of BMP staining in the EGL and cerebellar fiber tracts.C, E, GFAP staining in the same regions shown inB, D.
BMP4 distribution in cerebellar cells was also characterized by costaining sections for GFAP, a marker of astroglia. These studies demonstrated that there was little overlap between the distribution of these two markers. Within the EGL, BMP staining was absent from radially arrayed Bergmann glial cells that were intensely GFAP immunoreactive (Fig. 3, B vs C). Moreover, although the white-matter tracts were intensely positive for BMP4 and GFAP (Fig. 3, D vs E), few fibers appeared to be costained for both markers. Instead, the white-matter staining most likely arises from Purkinje neuron axonal processes in this region. These immunohistochemical findings support the importance of BMP signaling in postnatal cerebellar differentiation.
BMP4 alters Smad1 distribution in granule neurons in culture
To learn how Smad1 signaling might function in postnatal differentiation, the effects of BMP on cerebellar cultures prepared at P6 and P10 were examined. Previous studies have shown that these cultures contain cells derived primarily from the EGL (Raetzman and Siegel, 1999). Although a majority of the cells in these cultures are neurons, as many as 10% are non-neuronal (Behringer et al., 1996). Initial immunohistochemical studies demonstrated that BMP4 and Smad1 are expressed by the cells in culture. Staining for both proteins was detected throughout the cell bodies and processes of virtually all neurons, and small clumps of Smad1-like immunoreactivity were also detected in some nuclei (Fig.4A,C). In addition to the neurons, BMP4 and Smad1 staining of lower intensity was found in the cytoplasm of some non-neuronal cells (data not shown). These cells also exhibited nuclear patches of Smad1 immunoreactivity.
Fig. 4.

BMP4 treatment induces Smad1 translocation into the nucleus. A–D, Fluorescence images of Smad1 staining in cerebellar cells maintained 4 d in culture and incubated in the absence (A, C) or presence (B, D) of BMP4 (10 ng/ml) for 45 min. A, B, Light microscopic images of fields of control (A) and BMP-treated (B) cells. C, D, Projections of confocal images of Smad1 staining in control (C) and BMP-treated (D) cells. Note that the number of Smad1-like immunoreactive patches in nuclei increases after BMP treatment.
Treatment of cultures prepared at either P6 or P10 with BMP4 activated Smad1 translocation and signaling. Although much of the Smad1 staining was found in the cytoplasm of neurons in control conditions (Fig.4A,C), the addition of 10 ng/ml BMP4 to cultures for 45 min increased Smad1 staining in nuclei (Fig.4B,D). Furthermore, the number and size of the nuclear Smad1 immunoreactive patches increased. Quantification of these changes in neurons demonstrated that the intensity of the nuclear staining rose at least 40%. The mean pixel intensity over nuclei increased from 54.4 ± 2.4 (mean ± SEM; n = 28) in control cells to 75.5 ± 3.3 (n = 39;p < 0.001) in the treated cells. Moreover, the fraction of cellular immunoreactivity found over nuclei showed a 30% increase (73 ± 2% in treated cells compared with 57 ± 2% in control cells; p < 0.0001). These findings indicate that cerebellar granule neurons in culture can respond to BMP4 via Smad1 signaling. BMP4 treatment also caused a 25% increase in the total Smad1 immunoreactivity, which may be attributable to a change in the accessibility of Smad1 to antibody.
Previous studies have shown that Smad1 associates with Smad4 (Massague, 1996; Heldin et al., 1997) and forms a transcriptional complex within the nucleus after BMP receptor activation. To determine whether this pathway might function in cultured cerebellar cells, immunocytochemical studies were performed to examine Smad4 distribution. These studies demonstrated that intense Smad4-like immunoreactivity was present in virtually all cells prepared at P6 (Fig.5A,C) or P10 (data not shown). In contrast to Smad1, most of the Smad4 staining was found in the nuclei of control cells (Fig. 5A,C). Moreover, BMP4 treatment caused only an 8% increase in the fraction of total immunoreactivity found over the nucleus (96 ± 2% in treated cells compared with 89 ± 2% in control cells; p< 0.02).
Fig. 5.

Smad4 staining in control and BMP4-treated cells. Fluorescence images of Smad4 staining in cerebellar cells maintained for 4 d and then incubated for 45 min in the absence (A, C) or presence (B, D) of BMP4 (10 ng/ml).A, B, Light microscopic images of fields of control (A) and BMP-treated (B) cells. C, D, Confocal micrographs of individual control (C) and BMP-treated (D) cells show that nuclear staining is only slightly increased.
BMP4 promotes neuronal cell differentiation in cerebellar cell cultures
The morphology of both the neuronal and non-neuronal cells in culture was altered by prolonged treatment with BMP4. In control cultures maintained for 4–5 d, the granule neurons exhibited a network of fibers visualized by staining for MAP (Fig.6A). After treatment with 10 ng/ml BMP4 for 2–3 d, the cell morphology was prominently altered (Fig. 6B). MAP staining became more intense, and the neuronal processes were thicker and appeared more fasciculated. Additional studies demonstrated that these effects were dose-dependent. Although the MAP staining in cultures treated with 1 ng/ml BMP4 was similar to that found in controls, neuronal morphology was slightly altered by treatment with 5 mg/ml. These morphological alterations occurred in the absence of neuronal proliferation or changes in cell number. Fewer than 2% of the neurons in the control (Beattie and Siegel, 1993) or BMP-treated cultures incorporated BrdU, and the neuronal cell number in all cultures was virtually identical at the end of the experimental time course (42.9 ± 2.2 vs 41.8 ± 2.0 cells/field; n = 30 fields for each condition). Finally, the induction of neuronal maturation was specific to activators of the Smad1 signaling pathway. Treatment of the cultures with other TGF-β family members (TGF-β1 and TGF-β3) had no effect on neuronal morphology (data not shown).
Fig. 6.
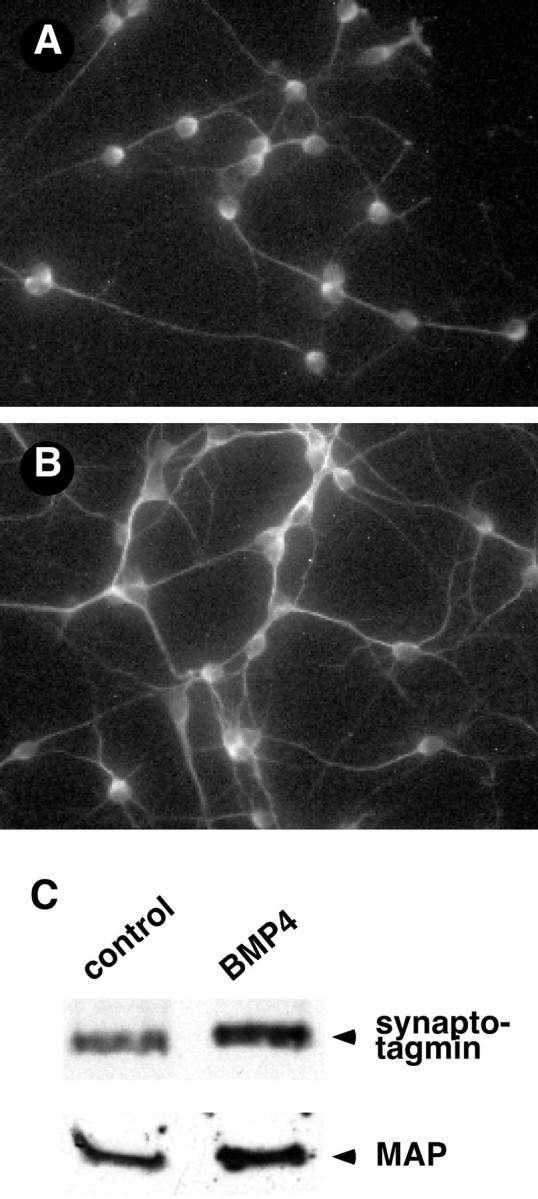
BMP4 induces granule neuron differentiation in cerebellar cultures. A, B, Images of MAP staining in cerebellar cells plated at P6 and grown for 3 d in the absence (A) or presence (B) of 10 ng/ml BMP4. BMP treatment promoted neuronal process outgrowth and branching in a dose-dependent manner. Similar changes were observed in cultures prepared at P10. C, Representative immunoblots of synaptotagmin 1a and MAP in cells maintained in culture in the absence or presence of 10 ng/ml BMP4 for 3 d. The BMP-induced changes in neuronal differentiation observed with immunofluorescence were accompanied by increases in the levels of these neuronal proteins.
The BMP-induced changes in neuronal morphology were accompanied by biochemical changes indicative of differentiation. Treatment with BMP4 (10 ng/ml) for 3–4 d caused a 40% increase in the level of the MAP protein as detected by Western blotting (Fig. 6C). This finding is consistent with the observed increases in the intensity of MAP staining and apparent fasciculation of the neuronal processes. Similarly, BMP treatment induced an increase in the level of another marker of neuronal differentiation, synaptotagmin 1a, a synaptic vesicle protein (Fig. 6C). This increase in synaptotagmin expression raises the possibility that BMP induces synaptogenesis in cell culture and can promote synaptic specialization in the cerebellum.
BMP4 enhances astroglial cell differentiation in cerebellar cultures
In addition to the alterations in neuronal morphology, BMP induced the differentiation of GFAP-immunoreactive astroglial cells in a dose-dependent manner. In control cultures maintained for 5 d, most GFAP-positive cells were radial in morphology; they typically had five unbranched processes that extended beyond a single field of view (Fig. 7A). After a 3 d treatment with 5 (Fig. 7C) or 10 (Fig. 7D) ng/ml BMP4, the GFAP-positive cell processes became shorter and branched. This stellate morphology is typical of more differentiated astrocytes. In fact, a brief exposure to BMP was sufficient to induce this change. Intricately branched astroglial cells were found in cultures treated with BMP for only 1 d and maintained in control medium for an additional 2 d (data not shown). Induction of the stellate morphology occurred in the absence of obvious changes in non-neuronal cell proliferation or number (34.6 ± 1.6 vs 36.2 ± 1.5 GFAP-positive cells/field; n = 30 fields for each condition), suggesting that BMP can promote astroglial cell differentiation.
Fig. 7.

BMP4 promotes the differentiation of astrocytes in cerebellar cultures. A–D, Images of GFAP staining in cells prepared at P6 and grown for 3 d in the absence or presence of increasing concentrations of BMP4. Similar effects were observed in cultures prepared at P10. A, Control. B, A total of 1 ng/ml BMP4. C, A total of 5 ng/ml BMP4.D, A total of 10 ng/ml BMP4.
Smad1 antisense ODN treatment reduces the effects of BMP4
To demonstrate that the BMP-induced changes in neuronal and non-neuronal cell differentiation were mediated via the Smad1 signaling pathway, the effects of reducing Smad1 or Smad4 levels using antisense ODNs were investigated. Because BMP treatment produced such marked alterations in non-neuronal cell morphology, the effects of the ODNs on this cell population are shown (Fig. 8). Western blots demonstrated that the addition of a 3.5 μmconcentration of the antisense Smad1 ODN to cultures for 3 d reduced the level of the targeted protein by 40% (Fig.8E). However, neither astroglial cell number nor morphology were affected by the antisense ODN (Fig. 8, compareA and B) or the corresponding sense ODN (data not shown). In contrast, the antisense ODN prevented the effects of BMP4 on non-neuronal cell morphology. Although BMP4 treatment (10 ng/ml for 3 d) dramatically induced non-neuronal cell branching (Fig.8C), little branching was observed when BMP4 was added together with antisense ODNs to Smad1 (Fig. 8D) or Smad4 (data not shown). The morphology of the ODN/BMP-treated cells (Fig. 8D) appeared similar to that of cells in control cultures (Fig. 8A). This finding supports the importance of Smad1 signaling in promoting the BMP-induced effects.
Fig. 8.
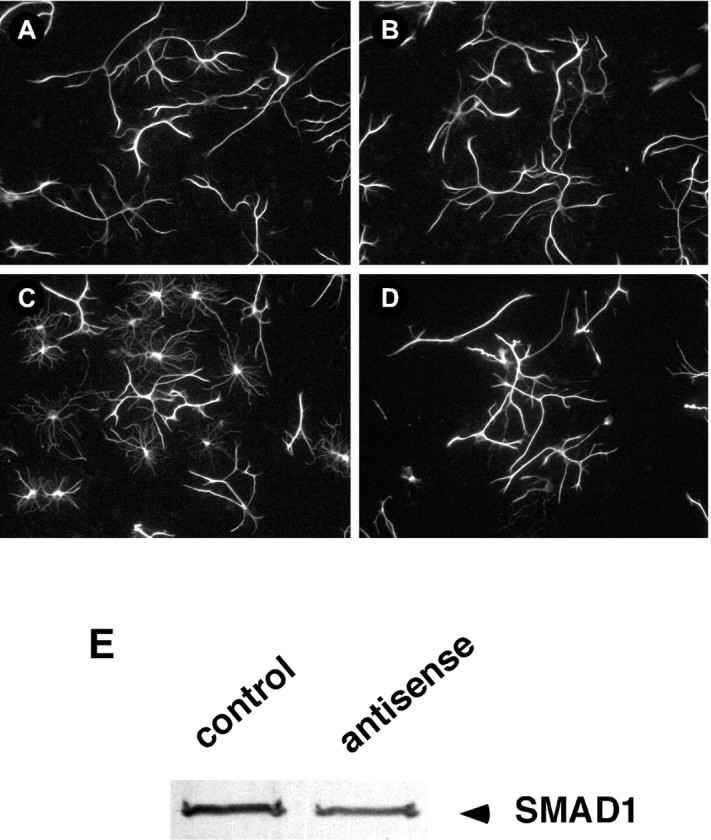
BMP4-induced astrocyte differentiation is inhibited by treatment with a Smad1 antisense ODN. A–D, Fluorescence images of GFAP staining in cerebellar cells plated at P6 and grown for 3 d in the absence or presence of BMP4 (10 ng/ml) and/or the antisense ODN (3.5 μg/ml). A, Control.B, Smad1 ODN-treated cells. C, BMP4-treated cells. D, BMP4- and Smad1 ODN-treated cells. The Smad1 ODN inhibited the BMP4-induced changes in morphology but had no effect by itself. E, Immunoblot of Smad1 expression in cells grown in the absence (control) or presence (antisense) of the Smad1 antisense ODN. The ODN caused similar decreases in Smad1 expression in four independent experiments.
Discussion
The cerebellum provides an ideal system for examining molecular mechanisms underlying the process of postnatal neuronal differentiation. In rodents, this region differentiates extensively during the first 3 weeks postnatally, and the properties of its component cells are well characterized. Using microarrays, an approach that allows detailed analysis of gene expression (Geschwind et al., 2001), we found that the Smad1 transcript rises transiently at P6 and declines by P8. Our study extends an earlier microarray analysis of the entire cerebellum (Matoba et al., 2000) to demonstrate that changes in gene expression can be identified at closely spaced temporal intervals and at specific postnatal ages. Analysis of these changes in the context of the known process of cerebellar development provides insights into signaling pathways involved in differentiation.
The potential importance of Smad1 signaling in modulating postnatal cerebellar development is supported by several findings in vivo and in culture. First, our studies in vivodemonstrate that Smad1 is intensely expressed in the EGL, a region that differentiates extensively during the first 3 weeks of postnatal ontogeny. Although previous studies have demonstrated that Smad1 is expressed in many embryonic and adult tissues (Huang et al., 2000;Flanders et al., 2001), ours is the first to show that it is expressed in the postnatal cerebellum. Second, our studies demonstrate that BMP2 and BMP4, activators of the Smad1 signaling pathway, are also present in the EGL. The pattern of BMP4 expression is similar to that of Smad1, and it remains strong in this region at all stages examined.
The functional significance of the BMPs and the Smad1 signaling pathway in the cerebellum is supported by several other findings. Studies bothin vivo and in culture indicate that receptors mediating the effects of BMP exist in the cerebellum. These studies have demonstrated that mRNAs encoding type Ia and type II BMP receptors are expressed in Purkinje neurons in vivo (Zhang et al., 1998). Similarly, mRNAs encoding the BMP type Ia and Activin I (data not shown) as well as BMP type II (Yabe et al., 2002) receptors exist in cerebellar granule cell cultures. Finally, our studies in culture demonstrate that the BMPs can induce neuronal and non-neuronal cell differentiation in a dose-dependent manner. The fact that these effects are reduced by Smad1 or Smad4 antisense ODNs further implicates the importance of this pathway in the differentiation of both cell populations.
In conjunction with previous studies, our findings suggest that BMPs and related factors function at multiple stages of cerebellar development. Studies on mouse embryos demonstrated that BMP6, BMP7, and growth and differentiation factor 7 are expressed over or around the rhombic lip, the region from which cerebellar granule neuron precursors are derived (Alder et al., 1999). Treatment of neural plate explants prepared from mice at embryonic day 8.5 (E8.5) with these factors induced expression of markers characteristic of granule neuron progenitors. This effect was transient and limited to a 24–48 hr period. These findings implicate the importance of BMPs in regulating cerebellar cell determination during embryogenesis. The possibility that BMP6 and BMP7 also act postnatally is suggested by the fact that mRNAs encoding these proteins exist in cultures of granule neurons prepared at P8. Although the application of either BMP6 or BMP7 to P8 cultures has been shown to enhance neuronal survival, only BMP6 promotes neurite outgrowth (Yabe et al., 2002). A role for BMPs in cerebellar ontogeny is also supported by our finding that the BMP2 and BMP4 proteins are expressed postnatally in this brain region. These findings, along with the effects of these proteins on cells in culture, suggest that the BMPs can modulate cerebellar cell differentiation.
Our data showing that the BMPs can promote both neuronal and astroglial cell differentiation are consistent with previous studies demonstrating that BMPs play multiple roles in development (Mehler et al., 1997). Other studies have found that the effects of BMPs can be age and tissue dependent (Grinspan et al., 2000; Mehler et al., 2000). Although BMP promoted both neuronal and astroglial differentiation when applied to cultures of cortical cells plated at E16, BMP2 induced neuronal cell death at earlier ages (Mabie et al., 1999). In other studies, it has been shown that the BMPs can selectively promote the differentiation of either neuronal or non-neuronal cells. For example, BMPs trigger neuronal differentiation in cultures prepared from precursors in the ventricular zone at E12–E13 (Li et al., 1998). In cultures of sympathetic neurons, BMP treatment can induce dendritic outgrowth (Lein et al., 1995) and promote synaptotagmin I expression (Patzke et al., 2001), changes consistent with our findings. Brief treatment with BMPs can also induce cultures of neural precursor cells from embryonic mice (Nakashima et al., 2001) or oligodendrocytes from newborn rats (Grinspan et al., 2000) to differentiate into astrocytes. Many of these BMP-treated astrocytes have extensively branched processes, a morphology similar to that found in the cerebellar cultures.
In cerebellar cultures plated at P6 or P10, exogenous BMP4 promoted neuronal and astroglial cell differentiation. Because the neuronal and non-neuronal cells express components of the Smad1 signaling pathway, it is possible that BMP directly activates this signaling pathway both in neurons [as found by Guo et al. (2001)] and in astrocytes. However, the possibility that BMP acts indirectly cannot be ruled out. For example, BMP4-induced Smad1 signaling in neurons might induce the release of a factor that promotes astroglial differentiation or vice versa. To test the sequence of effects of BMP4, it will be necessary to perform studies on pure cultures of either neuronal or non-neuronal cells. Additional studies will be necessary to determine whether BMP4 promotes granule neuron differentiation in an autocrine or paracrine manner in vivo. To begin to address these issues, culture conditions are being established to examine signaling cascades in different cell populations.
Although our data suggest that Smad1 signaling plays a role in cerebellar differentiation, its exact function in this process remains to be determined. The fact that the peak of Smad1 expression in the cerebellum coincides with extensive migration of granule neurons into the IGL raises the possibility that Smad1 plays a role in this process. However, because Smad1 is expressed in the EGL at earlier ages, our studies do not rule out the possibility that Smad1 functions in multiple processes that occur during cellular differentiation. These issues cannot yet be addressed in Smad1- and BMP4-deficient mice, because these animals are developmentally retarded and usually die by E10.5 (Tremblay et al., 2001) and E6.5–E9.5 (Winnier et al., 1995), respectively. Answers to these questions require the construction of animals in which expression of the Smad1 or BMP4 gene can be selectively regulated at specific times and in known cell populations.
A number of recent studies have shown that cerebellar differentiation is marked by stage-specific changes in gene expression. In the outer zone of the EGL, proliferating neurons express Math1(Akazawa et al., 1995; Ben-Arie et al., 1997), Cyclin D2 (Ross et al., 1996), Zic (Aruga et al., 1998), and Notch2(Solecki et al., 2001). After migration into the inner zone of the EGL, the cells express TAG-1 (Furley et al., 1990), NeuroD (Miyata et al., 1999), and p27/Kip1 (Miyazawa et al., 2000). Our findings indicate that BMP2 and BMP4, secreted factors that activate the Smad1 pathway, also play a role in postnatal development. A more complete understanding of cerebellar differentiation awaits knowledge of the interactions between the Smad1 signaling cascade and other pathways involved in maturation.
Footnotes
This work was supported by National Institutes of Health Grants NS34317 to R.E.S. and NS39316 to A.H. We thank Mary Ann Pendergast and Amanda Poeppelman for their help in collecting confocal and fluorescence images and Dr. Ruth Keri for help with the design of the microarray studies.
Correspondence should be addressed to Dr. Ruth E. Siegel, Department of Pharmacology, Case Western Reserve University, School of Medicine, Cleveland, OH 44106-4965. E-mail: res7@po.cwru.edu.
References
- 1.Akazawa C, Ishibashi M, Shimizu C, Nakanishi S, Kageyama R. A mammalian helix-loop-helix factor structurally related to the product of Drosophila proneural gene atonal is a positive transcriptional regulator expressed in the developing nervous system. J Biol Chem. 1995;270:8730–8738. doi: 10.1074/jbc.270.15.8730. [DOI] [PubMed] [Google Scholar]
- 2.Alder J, Lee KJ, Jessell TM, Hatten ME. Generation of cerebellar granule neurons in vivo by transplantation of BMP-treated neural progenitor cells. Nat Neurosci. 1999;2:535–540. doi: 10.1038/9189. [DOI] [PubMed] [Google Scholar]
- 3.Altman J, Bayer SA. Development of the cerebellar system in relation to its evolution, structure, and functions. CRC; Boca Raton, FL: 1997. [Google Scholar]
- 4.Aruga J, Minowa O, Yaginuma H, Kuno J, Nagai T, Noda T, Mikoshiba K. Mouse Zic1 is involved in cerebellar development. J Neurosci. 1998;18:284–293. doi: 10.1523/JNEUROSCI.18-01-00284.1998. [DOI] [PMC free article] [PubMed] [Google Scholar]
- 5.Beattie CE, Siegel RE. Developmental cues modulate GABA receptor subunit mRNA expression in cultured cerebellar granule neurons. J Neurosci. 1993;13:1784–1792. doi: 10.1523/JNEUROSCI.13-04-01784.1993. [DOI] [PMC free article] [PubMed] [Google Scholar]
- 6.Behringer KA, Gault LM, Siegel RE. Differential regulation of GABAA receptor subunit mRNAs in rat cerebellar granule neurons: importance of environmental cues. J Neurochem. 1996;66:1347–1353. doi: 10.1046/j.1471-4159.1996.66041347.x. [DOI] [PubMed] [Google Scholar]
- 7.Ben-Arie N, Bellen HJ, Armstrong DL, McCall AE, Gordadze PR, Guo Q, Matzuk MM, Zoghbi HY. Math1 is essential for genesis of cerebellar granule neurons. Nature. 1997;390:169–172. doi: 10.1038/36579. [DOI] [PubMed] [Google Scholar]
- 8.Bhatt RS, Tomoda T, Fang Y, Hatten ME. Discoidin domain receptor 1 functions in axon extension of cerebellar granule neurons. Genes Dev. 2000;14:2216–2228. doi: 10.1101/gad.821600. [DOI] [PMC free article] [PubMed] [Google Scholar]
- 9.Dahmane N, Ruiz-i-Altaba A. Sonic hedgehog regulates the growth and patterning of the cerebellum. Development. 1999;126:3089–3100. doi: 10.1242/dev.126.14.3089. [DOI] [PubMed] [Google Scholar]
- 10.Elferink LA, Peterson MR, Scheller RH. A role for synaptotagmin (p65) in regulated exocytosis. Cell. 1993;72:153–159. doi: 10.1016/0092-8674(93)90059-y. [DOI] [PubMed] [Google Scholar]
- 11.Flanders KC, Kim ES, Roberts AB. Immunohistochemical expression of SMADs 1–6 in the 15-day gestation mouse embryo: signaling by BMPs and TGF-βs. Dev Dyn. 2001;220:141–154. doi: 10.1002/1097-0177(2000)9999:9999<::AID-DVDY1096>3.0.CO;2-4. [DOI] [PubMed] [Google Scholar]
- 12.Furley AJ, Morton SB, Manalo D, Karagogeos D, Dodd J, Jessell TM. The axonal glycoprotein TAG-1 is an immunoglobulin superfamily member with neurite outgrowth-promoting activity. Cell. 1990;61:157–170. doi: 10.1016/0092-8674(90)90223-2. [DOI] [PubMed] [Google Scholar]
- 13.Gault LM, Siegel RE. Expression of the GABAA receptor δ subunit is selectively modulated by depolarization in cultured rat cerebellar granule neurons. J Neurosci. 1997;17:2391–2399. doi: 10.1523/JNEUROSCI.17-07-02391.1997. [DOI] [PMC free article] [PubMed] [Google Scholar]
- 14.Geschwind DH, Ou J, Easterday MC, Dougherty JD, Jackson RL, Chen Z, Antoine H, Terskikh A, Weissman IL, Nelson SF, Kornblum HI. A genetic analysis of neural progenitor differentiation. Neuron. 2001;29:325–339. doi: 10.1016/s0896-6273(01)00209-4. [DOI] [PubMed] [Google Scholar]
- 15.Goldowitz D, Hamre K. The cells and molecules that make a cerebellum. Trends Neurosci. 1998;21:375–382. doi: 10.1016/s0166-2236(98)01313-7. [DOI] [PubMed] [Google Scholar]
- 16.Grinspan JB, Edell E, Carpio DF, Beesley JS, Lavy L, Pleasure D, Golden JA. Stage-specific effects of bone morphogenetic proteins on the oligodendrocyte lineage. J Neurobiol. 2000;43:1–17. [PubMed] [Google Scholar]
- 17.Guo X, Lin Y, Horbinski C, Drahushuk KM, Kim I-J, Kaplan PL, Lein P, Wang T, Higgins D. Dendritic growth induced by BMP-7 requires Smad1 and proteasome activity. J Neurobiol. 2001;48:120–130. [PubMed] [Google Scholar]
- 18.Hall AK, Burke RM, Anand M, Dinsio KJ. Activin and bone morphogenetic proteins are present in perinatal sensory neuron target tissues that induce neuropeptides. J Neurobiol. 2002;52:52–60. doi: 10.1002/neu.10068. [DOI] [PubMed] [Google Scholar]
- 19.Heldin CH, Miyazono K, ten Dijke P. TGFβ signalling from cell membrane to nucleus through SMAD proteins. Nature. 1997;390:465–471. doi: 10.1038/37284. [DOI] [PubMed] [Google Scholar]
- 20.Hogan BL. Bone morphogenetic proteins: multifunctional regulators of vertebrate development. Genes Dev. 1996;10:1580–1594. doi: 10.1101/gad.10.13.1580. [DOI] [PubMed] [Google Scholar]
- 21.Hoodless PA, Haerry T, Abdollah S, Stapleton M, O'Connor MB, Attisano L, Wrana JL. MADR1, a MAD-related protein that functions in BMP2 signaling pathways. Cell. 1996;85:489–500. doi: 10.1016/s0092-8674(00)81250-7. [DOI] [PubMed] [Google Scholar]
- 22.Huang S, Flanders KC, Roberts AB. Characterization of the mouse Smad1 gene and its expression pattern in adult mouse tissues. Gene. 2000;258:43–53. doi: 10.1016/s0378-1119(00)00396-6. [DOI] [PubMed] [Google Scholar]
- 23.Kingsley DM. The TGF-β superfamily: new members, new receptors, and new genetic tests of function in different organisms. Genes Dev. 1994;8:133–146. doi: 10.1101/gad.8.2.133. [DOI] [PubMed] [Google Scholar]
- 24.Kumar M, Luo X, Quirk PL, Siegel RE. Antisense suppression of GABAA receptor β subunit levels in cultured cerebellar granule neurons demonstrates their importance in receptor expression. J Neurochem. 2001;77:211–219. doi: 10.1046/j.1471-4159.2001.t01-1-00217.x. [DOI] [PubMed] [Google Scholar]
- 25.Lein P, Johnson M, Guo X, Rueger D, Higgins D. Osteogenic protein-1 induces dendritic growth in rat sympathetic neurons. Neuron. 1995;15:597–605. doi: 10.1016/0896-6273(95)90148-5. [DOI] [PubMed] [Google Scholar]
- 26.Li W, Cogswell CA, LoTurco JJ. Neuronal differentiation of precursors in the neocortical ventricular zone is triggered by BMP. J Neurosci. 1998;18:8853–8862. doi: 10.1523/JNEUROSCI.18-21-08853.1998. [DOI] [PMC free article] [PubMed] [Google Scholar]
- 27.Mabie PC, Mehler MF, Kessler JA. Multiple roles of bone morphogenetic protein signaling in the regulation of cortical cell number and phenotype. J Neurosci. 1999;16:7077–7088. doi: 10.1523/JNEUROSCI.19-16-07077.1999. [DOI] [PMC free article] [PubMed] [Google Scholar]
- 28.Macias-Silva M, Abdollah S, Hoodless PA, Pirone R, Attisano L, Wrana JL. MADR2 is a substrate of the TGFβ receptor and its phosphorylation is required for nuclear accumulation and signaling. Cell. 1996;87:1215–1224. doi: 10.1016/s0092-8674(00)81817-6. [DOI] [PubMed] [Google Scholar]
- 29.Massague J. TGFβ signaling: receptors, transducers, and Mad proteins. Cell. 1996;85:947–950. doi: 10.1016/s0092-8674(00)81296-9. [DOI] [PubMed] [Google Scholar]
- 30.Massague J, Blain SW, Lo RS. TGFβ signaling in growth control, cancer, and heritable disorders. Cell. 2000;103:295–309. doi: 10.1016/s0092-8674(00)00121-5. [DOI] [PubMed] [Google Scholar]
- 31.Matoba R, Kato K, Saito S, Kurooka C, Maruyama C, Sakakibara Y, Matsubara K. Gene expression in mouse cerebellum during its development. Gene. 2000;241:125–131. doi: 10.1016/s0378-1119(99)00457-6. [DOI] [PubMed] [Google Scholar]
- 32.Mehler MF, Mabie PC, Zhang D, Kessler JA. Bone morphogenetic proteins in the nervous system. Trends Neurosci. 1997;20:309–317. doi: 10.1016/s0166-2236(96)01046-6. [DOI] [PubMed] [Google Scholar]
- 33.Mehler MF, Mabie PC, Zhu G, Gokhan S, Kessler JA. Developmental changes in progenitor cell responsiveness to bone morphogenetic proteins differentially modulate progressive CNS lineage fate. Dev Neurosci. 2000;2:74–85. doi: 10.1159/000017429. [DOI] [PubMed] [Google Scholar]
- 34.Miyata T, Maeda T, Lee JE. NeuroD is required for differentiation of the granule cells in the cerebellum and hippocampus. Genes Dev. 1999;13:1647–1652. doi: 10.1101/gad.13.13.1647. [DOI] [PMC free article] [PubMed] [Google Scholar]
- 35.Miyazawa K, Himi T, Garcia V, Yamagishi H, Sato S, Ishizaki Y. A role for p27/Kip1 in the control of cerebellar granule cell precursor proliferation. J Neurosci. 2000;20:5756–5763. doi: 10.1523/JNEUROSCI.20-15-05756.2000. [DOI] [PMC free article] [PubMed] [Google Scholar]
- 36.Nakashima K, Takizawa T, Ochiai W, Yanagisawa M, Hisatsune T, Nakafuku M, Miyazono K, Kishimoto T, Kageyama R, Taga T. BMP2-mediated alteration in the developmental pathway of fetal mouse brain cells from neurogenesis to astrocytogenesis. Proc Natl Acad Sci USA. 2001;98:5868–5873. doi: 10.1073/pnas.101109698. [DOI] [PMC free article] [PubMed] [Google Scholar]
- 37.Patzke H, Reissmann E, Stanke M, Bixby JL, Ernsberger U. BMP growth factors and Phox2 transcription factors can induce synaptotagmin I and neurexin I during sympathetic neuron development. Mech Dev. 2001;108:149–159. doi: 10.1016/s0925-4773(01)00503-2. [DOI] [PubMed] [Google Scholar]
- 38.Piedras-Renteria ES, Tsien RW. Antisense oligonucleotides against α1E reduce R-type calcium currents in cerebellar granule cells. Proc Natl Acad Sci USA. 1998;95:7760–7765. doi: 10.1073/pnas.95.13.7760. [DOI] [PMC free article] [PubMed] [Google Scholar]
- 39.Pilowsky PM, Suzuki S, Minson JB. Antisense oligonucleotides: a new tool in neuroscience. Clin Exp Pharmacol Physiol. 1994;21:935–944. doi: 10.1111/j.1440-1681.1994.tb02655.x. [DOI] [PubMed] [Google Scholar]
- 40.Raetzman LT, Siegel RE. Immature granule neurons from cerebella of different ages exhibit distinct developmental potentials. J Neurobiol. 1999;38:559–570. [PubMed] [Google Scholar]
- 41.Ross ME, Carter ML, Lee JH. MN20, a D2 cyclin, is transiently expressed in selected neural populations during embryogenesis. J Neurosci. 1996;16:210–219. doi: 10.1523/JNEUROSCI.16-01-00210.1996. [DOI] [PMC free article] [PubMed] [Google Scholar]
- 42.Solecki DJ, Liu X, Tomoda T, Fang Y, Hatten ME. Activated notch2 signaling inhibits differentiation of cerebellar granule neuron precursors by maintaining proliferation. Neuron. 2001;31:557–568. doi: 10.1016/s0896-6273(01)00395-6. [DOI] [PubMed] [Google Scholar]
- 43.Tremblay KD, Dunn NR, Robertson EJ. Mouse embryos lacking Smad1 signals display defects in extra-embryonic tissues and germ cell formation. Development. 2001;128:3609–3621. doi: 10.1242/dev.128.18.3609. [DOI] [PubMed] [Google Scholar]
- 44.Winnier G, Blessing M, Labosky PA, Hogan BL. Bone morphogenetic protein-4 is required for mesoderm formation and patterning in the mouse. Genes Dev. 1995;9:2105–2116. doi: 10.1101/gad.9.17.2105. [DOI] [PubMed] [Google Scholar]
- 45.Wrana JL, Attisano L. The Smad pathway. Cytokine Growth Factor Rev. 2000;11:5–13. doi: 10.1016/s1359-6101(99)00024-6. [DOI] [PubMed] [Google Scholar]
- 46.Yabe T, Samuels I, Schwartz JP. Bone morphogenetic proteins BMP-6 and BMP-7 have differential effects on survival and neurite outgrowth of cerebellar granule cell neurons. J Neurosci Res. 2002;68:161–168. doi: 10.1002/jnr.10210. [DOI] [PubMed] [Google Scholar]
- 47.Zhang D, Mehler MF, Song Q, Kessler JA. Development of bone morphogenetic protein receptors in the nervous system and possible roles in regulating trkC expression. J Neurosci. 1998;18:3314–3326. doi: 10.1523/JNEUROSCI.18-09-03314.1998. [DOI] [PMC free article] [PubMed] [Google Scholar]