

Abstract
Astrocytes have a higher antioxidant potential in comparison to neurons. Pathways associated with this selective advantage include the transcriptional regulation of antioxidant enzymes via the action of the Cap‘n’Collar transcription factor Nrf2 at the antioxidant response element (ARE). Here we show that Nrf2 overexpression can reengineer neurons to express this glial pathway and enhance antioxidant gene expression. However, Nrf2-mediated protection from oxidative stress is conferred primarily by glia in mixed cultures. The antioxidant properties of Nrf2-overexpressing glia are more pronounced than those of neurons, and a relatively small number of these glia (< 1% of total cell number added) could protect fully cocultured naive neurons from oxidative glutamate toxicity associated with glutathione (GSH) depletion. Microarray and biochemical analyses indicate a coordinated upregulation of enzymes involved in GSH biosynthesis (xCT cystine antiporter, γ-glutamylcysteine synthetase, and GSH synthase), use (glutathioneS-transferase and glutathione reductase), and export (multidrug resistance protein 1) with Nrf2 overexpression, leading to an increase in both media and intracellular GSH. Selective inhibition of glial GSH synthesis and the supplementation of media GSH indicated that an Nrf2-dependent increase in glial GSH synthesis was both necessary and sufficient for the protection of neurons, respectively. Neuroprotection was not limited to overexpression of Nrf2, because activation of endogenous glial Nrf2 by the small molecule ARE inducer,tert-butylhydroquinone, also protected against oxidative glutamate toxicity.
Keywords: Nrf2, xCT, system xc–, phase II detoxification enzymes, astrocyte, oxidative glutamate toxicity, glutathione, cystine deprivation, tert-butylhydroquinone, antioxidant response element, quinone reductase, oxidative stress, neuroprotection
Introduction
Glial cells (astrocytes) are known to interact with surrounding neurons by nourishing, protecting, and modulating growth and excitability (Travis, 1994). Although it has been shown repeatedly that astrocytes can improve neuronal survival, the mechanisms of protection remain uncertain. Astrocytes have stronger antioxidative potential than neurons (Raps et al., 1989; Makar et al., 1994; Lucius and Sievers, 1996) and can protect neurons from oxidative stress induced by various compounds such as dopamine, H2O2, and 6-hydroxydopamine and nitric oxide (Desagher et al., 1996; Mena et al., 1996; Chen et al., 2001). One potential defense against the toxicity of reactive oxygen species (ROS) is the induction of a family of phase II detoxification enzymes (Fahey et al., 1997; Kensler, 1997). Data from our lab and others suggest that this response is expressed preferentially in astrocytes, with considerably lower levels in neurons (Ahlgren-Beckendorf et al., 1999; Eftekharpour et al., 2000; Murphy et al., 2001; Johnson et al., 2002). Originally thought to be restricted to promoting xenobiotic conjugation with endogenous ligands, such as glutathione (GSH) (Hayes and Pulford, 1995; Primiano et al., 1997), the observed functions of phase II enzymes have broadened recently. Now, there are ∼2 dozen known phase II enzyme genes, with more to be elucidated via current technologies (Li et al., 2002). Sharing common regulatory pathways, these enzymes possess chemically versatile antioxidant properties and are inducible by various agents, including those found in a normal diet (Fahey et al., 1997; Gao et al., 2001). Treatment of mammalian cells with electrophilic agents provokes a cellular response leading to the coordinated transcription of phase II genes (Prestera et al., 1993). A unique cis-acting regulatory sequence, termed the antioxidant response element (ARE), is essential for the constitutive and induced expression of many antioxidant genes involved in the phase II pathway (Friling et al., 1990; Rushmore et al., 1991; Nguyen et al., 2000). Several lines of evidence suggest that NF-E2-related factor 2 (Nrf2) is an important transcription factor responsible for upregulating ARE-mediated gene expression (Itoh et al., 1997, 1999; Alam et al., 1999; Hayes et al., 2000; Ishii et al., 2000). Studies that use knock-out mice have shown that Nrf2 was part of a transcription factor complex required for regulation of the mouse glutathione S-transferase (GST) and NADPH:quinone oxidoreductase (NQO1) genes (Itoh et al., 1997; Hayes et al., 2000). In addition, Nrf2/small Maf heterodimers bind to the ARE sequence with high affinity during regulation of the GST and NQO1 genes (Venugopal and Jaiswal, 1996). From these observations Nrf2 appears to be the major transcription factor necessary for ARE activation and thus essential for the induction of phase II detoxification enzymes. In this study we use replication-deficient adenoviruses to overexpress Nrf2 protein in both neurons and glia to determine whether augmentation of the ARE-mediated antioxidant response might reduce neuronal vulnerability to oxidative stress.
Materials and Methods
Materials. All chemicals were purchased from Sigma-Aldrich Canada (Ontario, Canada) unless otherwise stated.
Plasmids and adenoviruses. pEF mammalian expression plasmids carrying cDNA encoding mouse Nrf2 and Nrf2DN were a generous gift from Dr. Jawed Alam (Alton Ochsner Medical Foundation, New Orleans, LA; Alam et al., 1999). Rat ARE sequences were obtained from the NQO1 promotor. To make the human placental alkaline phosphatase (hPAP) reporter construct (rQR51), we excised a 51 bp ARE/electrophile response element (EpRE) fragment by using restriction sites (XhoI andHindIII) flanking the ARE sequence from a parent luciferase expression vector (Moehlenkamp and Johnson, 1999) and subcloned it into the pGEM-7zf vector [American Type Culture Collection (ATCC), Manassas, VA] upstream of the hPAP reporter gene. A mutant rQR51 (rQR51mut) was made by replacing the original core ARE sequence with a cassette encoding a mutant ARE core sequence. TheBglII/NheI excisable cassette was constructed with the following oligonucleotides (Sigma-Genosys, The Woodlands, TX). The 10 bp mutation is underlined, and the region corresponding to the ARE core sequence is shown in bold: 5′-CTAGCTCGAGATCCTCAGAGATTTCAGTCTAGAGTCACACGCAAACAGGAAAATCA-3′ and 3′-GAGCTCTAGGAGTCTCTAAAGTCAGATCTCAGTGTGCGTTTGTCCTTTTAGTCTAG-5′.
Recombinant adenoviral vectors were constructed by using the Cre-lox system (Canadian Stroke Network core facility, University of Ottawa, Ottawa, Canada; Hardy et al., 1997). The Nrf2 and Nrf2DN cDNAs were excised from the pEF vector by using restriction enzymesNotI, and NotI and HindIII, respectively. All viruses were titered on human embryonic kidney 293 (HEK293) cells.
Mammalian cell culture. Mixed neuronal–glial cultures were prepared from the cerebral cortex of Wistar rat fetuses embryonic day 17–18 (E17–E18), using the papain dissociation method (Murphy et al., 1990). Viable cells were plated at 1 × 10⁶ cells/ml on poly-d-lysine-coated plastic culture plates (Costar, Pleasanton, CA) in B27-supplemented Neurobasal medium (Invitrogen, San Diego, CA). After 1 din vitro (1 DIV) the medium was changed to MEM (Invitrogen) supplemented with 5.5 gm/ld-glucose, 2 mm glutamine, 10% fetal bovine serum (FBS; HyClone, Logan, UT), 1 mm Na+-pyruvate, 100 U/ml penicillin, and 0.1 mg/ml streptomycin (MEM-pyr). This medium change was required to reduce excessive antioxidant levels from the B27 medium. Enriched neuronal cultures used for Western blot analysis were prepared by culturing cortical cultures in the presence of 10 μm 5-fluoro-2′-deoxyuridine/uridine that was replaced every 4 d until the cultures were harvested at 14 DIV. Enriched glial cultures were prepared from 1–2 d postnatal rat pups. Cortices were dissected, minced, and used in the papain dissociation method. Cells were plated in MEM supplemented with 10% FBS, 5% heat-inactivated horse serum (HyClone), 2 mm glutamine, 100 U/ml penicillin, and 0.1 mg/ml streptomycin in noncoated 10 cm plates (2 plates per brain). After 1 DIV the medium was replaced, and the glia were allowed to grow for 3 d. Adherent neurons were removed from the glial culture by repeated pipetting of the medium. All glial cultures were used within 10 DIV because older, quiescent cultures appeared to lack the antioxidant response. These conditions for isolating glial cells mainly result in a population of type I and II astrocytes. Anti-glial fibrillary acid protein (GFAP) staining suggests that the glial cultures are mainly of the astrocyte phenotype. For a simple neuron–glial coculture setup virus-infected glia were trypsinized and transplanted directly into naive (no contact with virus) cortical culture after 24 hr of transgene expression (coculture; Fig.1A). Glia were transplanted with concentrations ranging from 0.1 × 10⁴ to 2 × 10⁴ cells/ml, a plating density of 0.1–2% of the total number of cells per well. Cocultures with glia that were separated physically from neurons (membrane-delimited coculture) consisted of naive cortical cultures prepared in 24-well plates (neuronal compartment) and infected glia separated in culture plate inserts with 0.4 μm pore size (glial compartment; Millipore, Bedford, MA) (Fig. 1B). Infected glia were trypsinized 6 hr after infection and plated at 2 × 10⁴ cells per insert, a plating density of 2% of the total cell number, into the collagen-coated inserts. For depletion of glial glutathione the glial compartment was pretreated with 200 μml-buthionine sulfoximine (BSO) for 24 hr, then preincubated for 10 min in fresh medium, and washed twice before transfer into the neuronal compartment. For both setups the transplanted glia were washed three times with PBS to prevent the transfer of virus to the neuronal compartment.
Fig. 1.
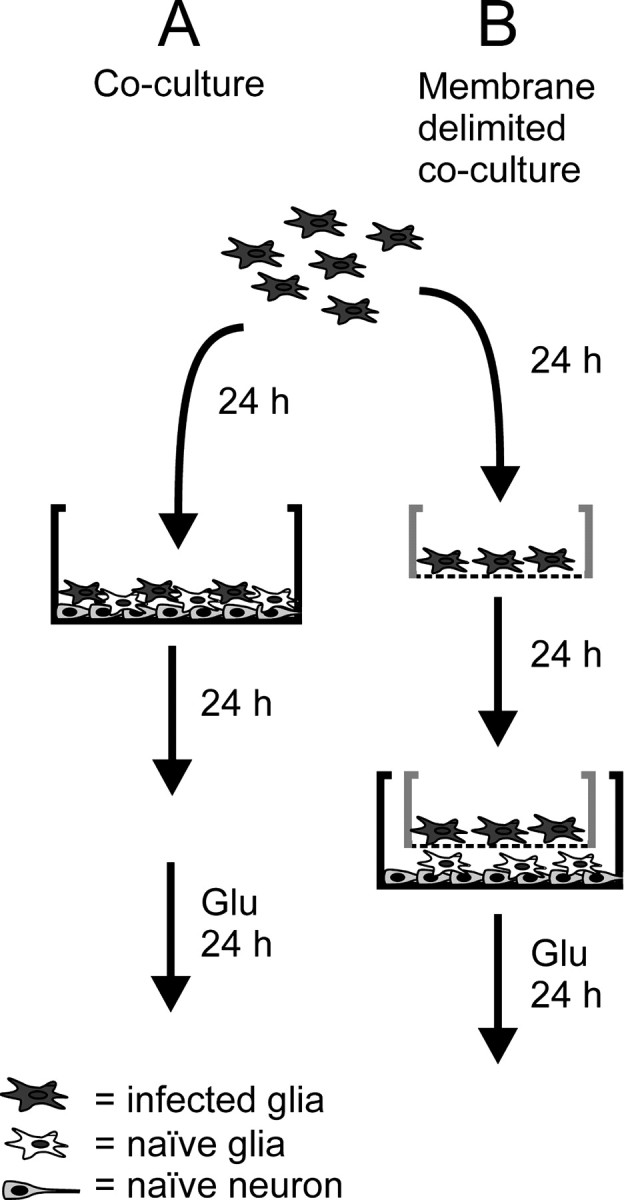
Schematic explanation of neuron–glial coculture setups used in this study. A, For a simple neuron–glial coculture setup the virus-infected glia were transplanted directly into naive (no contact with virus) mixed neuronal–glial cultures after 24 hr of transgene expression. B, Some experiments required a setup by which glia were separated physically from neurons (membrane-delimited coculture). This system consisted of naive cultures prepared in 24-well plates; infected glia were separated by a culture plate insert. Both cocultures were maintained for 24 hr and then exposed to 3 mm glutamate (Glu) for a further 24 hr, followed by quantitation of neuronal viability.
HEK293 (ATCC) were plated at a density of 1 × 10⁵ cells/ml on 10 cm plates (Costar). Culture medium was prepared from MEM supplemented with 10% FBS, 1 mmNa+-pyruvate, 2 mml-glutamine, and 100 U/ml penicillin, 0.1 mg/ml streptomycin. After plating, the cells were allowed to grow for ∼16 hr before commencement of transfection. All cultures were maintained at 37°C in a humidified 95% O2/5% CO2 incubator.
Transfections and infections. HEK293 cells were transiently transfected by the calcium-phosphate method (10 μg/10 cm plate) (Chen and Okayama, 1987) or with Polyfect reagent (Qiagen, Chatsworth, CA) according to the manufacturer's protocol. The transfection efficiency was typically 60–70% as assessed by β-gal staining. Mature (14 DIV) primary cultures of mixed cortical neurons and glia were transiently transfected with the ballistic gene transfer method by using a Helios gene gun (Bio-Rad, Hercules, CA) firing 0.6 μm gold particles coated with DNA (1 μg DNA/mg gold loading ratio). For adenovirus infection the immature cortical cultures were infected at 1 DIV by virus diluted to a multiplicity of infection of 200 in MEM-pyr. The cultures were allowed to express transgenes for 48 hr before usage. All infected cultures were examined for adequate infection efficiency (25% of neurons, 80% of glia) as assessed by green fluorescent protein (GFP) fluorescence.
Toxicity treatment. For all toxicity studies the cortical cultures were used in their immature state (1–4 DIV). MEM-pyr was replaced with MEM supplemented with 5.5 gm/ld-glucose, 2 mm glutamine, 5% FBS, 100 U/ml penicillin, 0.1 mg/ml streptomycin (MEM/5% FBS) containing the indicated concentrations ofl-glutamate, H2O2, or staurosporine. Cells were exposed to all toxins for 24 hr. No inhibitors of GSH oxidation were added to the medium during the toxicity experiments.
Determination of neuronal viability. Neuronal viability was evaluated by two methods: (1) manual counting of cells labeled with fluorescent antibodies to neuron-specific enolase (NSE) or GFP, and (2) 3-(4,5-dimethylthiazol-2-yl)-2,5-diphenyl-2H-tetrazolium bromide (MTT) cell viability assay. For cell counting after immunocytochemistry, 10 pictures of each experimental group were taken with a 20× objective (Zeiss, Oberkochen, Germany), using wide-field fluorescence microscopy (Zeiss Axiophot) with a color CCD camera (Sony powerHAD, model DXC-950, Tokyo, Japan). The imaged areas were chosen randomly from at least three different wells per experimental group. All counting was performed with the rater blinded to the experimental conditions that were used. To confirm cell counts, we scanned the 96-well plates that were used for counting with a Fluoroskan fluorescence plate reader (excitation, 530 nm; emission, 620 nm; Labsystems, Helsinki, Finland) to measure red fluorescence from NSE-positive cells, although not all experiments could be processed this way; absolute levels of NSE fluorescence could vary because of background staining or cell density. All measurements made with the Fluoroskan were background-subtracted, where background was the fluorescence measured from ad-GFP-infected wells treated with 3 mm glutamate (see Fig.6B,C), 30 μmH2O2 (see Fig.5A), or 10 μm staurosporine (see Fig. 5B) for 24 hr. For the MTT assay the cultures were incubated with 0.45 mg/ml MTT diluted in MEM/5% FBS with no phenol red for 2 hr at 37°C after the toxicity studies. Then the MTT staining solution was removed and replaced with PBS and an equal volume of MTT lysis buffer consisting of 20% SDS in 50% dimethylformamide, pH 4.7. The formazan crystals were allowed to dissolve overnight before the plate was read on a Multiskan plate reader (absorbance, 560 nm; Labsystems). In mixed neuron–glia cortical cultures glial-mediated MTT turnover accounted for approximately one-half of the total MTT reduction. To eliminate the glial component of MTT reduction, we used measurements from control wells treated with 3 mm glutamate for 24 hr, in which nearly all neurons had died, as a background that was subtracted from all other groups (see Figs. 7C, 8A).
Fig. 6.

A small fraction of infected glial cells is sufficient to protect neurons from oxidative glutamate toxicity.A, Representative images from glial–neuron coculture setup (see Fig. 1A). Within a typical coculture infected glia (green) and uninfected neurons (red) can be observed. Uninf, Uninfected glia transplanted. B, Group data obtained from plate scanning for NSE (red) fluorescence.C, Decreased neuronal viability is demonstrated by a loss of red fluorescence. The addition of Nrf2-overexpressing glia restores NSE expression to levels found in an ad-GFP-infected group that was not exposed to glutamate. Data represent the mean ± SEM from three separate experiments performed in quadruplicate; *p < 0.05. Scale bar, 80 μm.
Fig. 5.

Nrf2 overexpression in mixed immature cortical cultures protects neurons from H2O2-mediated toxicity, but not staurosporine-induced apoptosis. Ad-GFP- and ad-Nrf2-infected cultures were allowed to express transgenes for 48 hr before exposure to 0.3–30 μm H2O2 (A;n = 3) or 0.1–10 μm staurosporine (B; n = 4) for a further 24 hr. Cells were stained for NSE to evaluate neuronal viability. Data represent the mean ± SEM from the indicated number of experiments performed in quadruplicate; *p < 0.05, compared with ad-GFP-infected control.
Fig. 7.

Release of GSH from glia is both sufficient and necessary for conferring neuronal protection. A,B, Infection with ad-Nrf2 increases total intracellular GSH/GSSG as well as GSH released into the medium (MEM/5% FCS, no phenol red). C, Exogenous addition of reduced GSH concurrently with glutamate treatment protects neurons from oxidative glutamate toxicity. D, Glial GSH release is necessary for Nrf2-dependent neuronal protection. A membrane-delimited coculture (see Fig. 1B) was used, allowing enriched glial cultures to be pretreated separately with the GSH synthesis inhibitor BSO and then to be washed and added to wells containing neurons. BSO pretreatment (200 μm) for 24 hr produces long-term reduction of intracellular GSH/GSSG and release of GSH from glia and abolishes glial-mediated neuronal protection. Data represent the mean ± SEM of at least three independent experiments performed in triplicate; #*p < 0.05.
Fig. 8.

Neuronal protection can be achieved by activation of endogenous Nrf2 with the use of a small molecule inducer.A, Immature cortical cultures pretreated for 24 hr with 10 and 20 μm tBHQ are protected from 1–3 mmglutamate exposure. Partial protection is conferred by tBHQ treatment at 3 mm glutamate. B, Selective induction of endogenous Nrf2 in glia led to partial neuronal protection from oxidative glutamate toxicity. Glia pretreated with a range of tBHQ concentrations (0–20 μm) for 24 hr were transplanted into naive neuronal cultures at a plating density of 5% of the total cell number, using a coculture setup (see Fig.1A). Data represent the mean ± SEM from three independent experiments performed in quadruplicate; *p < 0.05.
Western blot analysis and immunocytochemistry. Cells were washed in PBS and harvested in PBS containing 2 μg/ml aprotinin plus (in mm) 1 phenylmethylsulfonyl fluoride, 1 EGTA, and 1 EDTA; the cells were sonicated for 10 sec to make crude lysate. Protein concentration was measured with the bicinchoninic acid method (BCA; Pierce, Rockford, IL). Samples prepared in loading buffer (7 mg/ml DTT, 6% SDS, 30% glycerol, and 0.38m Tris, pH 6.8, and pyronin Y) were denatured by boiling for 2 min before loading. For SDS-PAGE 30% acrylamide gels were used to run HEK293 protein lysates (10 μg loaded) and enriched neuron or glial lysates (30 μg loaded), respectively. Antibody reactivity was detected by enhanced chemiluminescence substrate (Amersham Biosciences, Arlington Heights, IL). For immunocytochemistry after toxicity experiments the cultures were washed twice with 37°C PBS to remove dead cells and cellular debris, were fixed with 2% paraformaldehyde (PFA) for 10 min, and then were incubated with primary and secondary antibodies. Immunostained cells were mounted in Fluoromount-G (Southern Biotechnology Associates, Birmingham, AL). Antibodies used in this study include anti-Nrf2 from rabbit (1:200 dilution; Santa Cruz Biotechnology, Santa Cruz, CA), anti-GFP from mouse (1:1000; Boehringer Mannheim, Indianapolis, IN), anti-NSE from rabbit (1:2000; Polysciences, Warrington, PA), anti-GFAP from rabbit (1:100; Sigma-Aldrich Canada), anti-mouse Alexa Fluor 488 from goat (1:2000; Molecular Probes, Eugene, OR), anti-actin from goat (1:1000; Santa Cruz Biotechnology), anti-heme oxygenase 1 from rabbit (1:500; Stressgen Biotechnologies, San Diego, CA), anti-rabbit horseradish peroxidase (HRP) from sheep (1:5000; Amersham Biosciences), and anti-goat HRP from donkey (1:5000; Santa Cruz Biotechnology).
Densitometry. Densitometric analysis of Western blots was performed with the Scion Imaging program (version β 4.0.2, Scion, Frederick, MD). Band intensities were measured by taking the mean pixel intensity. All band measurements were background-subtracted.
[3H]-glutamate uptake assay.l-[3H]-glutamate uptake was measured as described previously (Shih and Murphy, 2001). Briefly, infected immature cortical cultures were preincubated in Na+-free HBSS for 10 min at 37°C before being incubated with Na+-free HBSS containing 38 nml-[3H]-glutamate (Amersham Biosciences) and the indicated unlabeled compounds (1 mm) for a further 20 min at 37°C. Then the cells were washed three times with ice-cold Na+-free HBSS and lysed with 0.5% Triton X-100 in 0.1 m potassium phosphate buffer. Radioactivity was determined by liquid scintillation counting and normalized to protein concentration for each sample.
Placental alkaline phosphatase and quinone reductase staining. For hPAP staining (Murphy et al., 2001) the cultures were rinsed with PBS and fixed with 4% PFA and 0.2% glutaraldehyde for 10 min. Preparations were rinsed again with PBS and incubated at 65°C for 30 min to inactivate any endogenous heat-labile alkaline phosphatase activity. The preparations were stained with 1 mg/ml nitroblue tetrazolium (NBT) and 1 mg/ml 5-bromo-4-chloro-3-indoyl phosphate dissolved in 0.1 m Tris buffer, pH 10. The staining reaction was performed at 37°C for ∼30–40 min and was terminated by washing with PBS. Pictures were taken with a 60× objective (Zeiss) that used conventional light microscopy with a color CCD camera. For NQO1 staining (Murphy et al., 1998) the cells were fixed with 2% PFA for 10 min, washed with PBS, and preincubated in buffer A (25 mm Tris, 0.08% Triton X-100, 2 mg/ml BSA, pH 7.4) for 30 min. The preincubation solution was replaced with buffer containing 100 μm NBT and 100 μm LY 83583 (Alexis Pharmaceuticals, San Diego, CA), and staining was initiated with the addition of NADPH (1 mm final). The reaction was incubated at 37°C for 20–30 min and terminated by washing in buffer A. Differential interference contrast (DIC) and phase-contrast pictures were taken before and after staining, respectively, using a 63× oil immersion objective (Zeiss) on an Axiovert 200M microscope (Zeiss) equipped with an AxioCam HRm digital camera (Zeiss). DIC and phase-contrast images were overlaid for final presentation.
Total intracellular GSH assay and effluxed GSH assay.Total GSH was quantified by the method of Tietze (1969). Briefly, cells were collected in PBS and sonicated for 10 sec on ice. The acid-soluble fraction was obtained by adding perchloric acid to a final concentration of 3%, followed by centrifugation at 14,000 ×g for 10 min. The acid-soluble fraction was neutralized to pH 7 with 0.5 m KOH/50 mmTris. After the removal of precipitate (potassium perchlorate) by a second centrifugation, 50 μl aliquots of sample were combined with 100 μl of reaction mixture consisting of 2.5 ml of 1 mm 5,5′,dithiobis-(2-nitrobenzoic acid) (DTNB), 2.5 ml of 5 mm NADPH, and 2.65 ml of phosphate buffer (100 mmNaPO4, pH 7.5, 1 mm EDTA), glutathione reductase (5 U/ml final). The increase in A412 from GSH-mediated reduction of DTNB was measured at 30 sec intervals over 30 min. GSH content among treatment groups was normalized to protein. For GSH efflux assays the MEM/5% FBS with no phenol red was incubated with cultures for 24 hr and used in the same procedure minus the removal of proteins via perchloric acid. In some experiments the proteins were removed by filtration through a 3 kDa molecular weight cutoff membrane (Nanosep3K Omega, Pall Gelman Laboratory, Sydney, Australia). Monochlorobimane (mCBi; Molecular Probes) staining was performed by incubating adenovirus-infected cultures with 60 μm mCBi for 20 min (Tauskela et al., 2000). Stained cultures were washed twice with PBS to remove excess mCBi and were fixed with 4% PFA with 0.2% glutaraldehyde for 20 min. At this stage the cells either were viewed directly for fluorescence (excitation, 360 nm; emission, 410 nm) or were stained further for GFP and GFAP, using immunocytochemistry. Quantitative measurements of mCBi/GSH adduct fluorescence were made with Photoshop (Adobe Systems, Mountain View, CA) by taking mean intensities from individual cells. All values were background-subtracted.
RT-PCR and microarray analysis. Total RNA was isolated from infected cultures with Trizol reagent (Invitrogen) according to the manufacturer's instructions. RNA (1 μg) was reverse-transcribed by using Oligo-dT 15 primer in accordance with the RT System (Promega, Madison, WI). Then the resulting cDNA was PCR-amplified by using primer sets for the genes: GFP, 5′-GAG CTG TTC ACC GGG GTG GTG-3′ and 5′-GAG CTC GAG ATC TGA GTC CGG-3′; mouse Nrf2, 5′-TGA AGC TCA GCT CGC ATT GAT CC-3′ and 5′-AAG ATA CAA GGT GCT GAG CCG CC-3′; rat xCT, 5′-TTG CAA GCT CAC AGC AAT TC-3′ and 5′-CGT CAG AGG ATG CAA AAC AA-3′; actin, 5′-CCC AGA GCA AGA GAG GTA TC-3′ and 5′-AGA GCA TAG CCC TCG TAG AT-3′. PCR conditions were as follows: initial denaturing step that used 1 cycle at 95°C for 3 min, followed by 35 cycles at 95°C for 30 sec, and the appropriate primer annealing temperature (ranging from 53.4 to 56.6°C) for 1 min, then 72°C for 1.5 min, and a final cycle at 72°C for 5 min. The PCR products were separated on a 1.4% agarose gel containing ethidium bromide. Stained cDNA was visualized by using an ultraviolet light source. Microarray analysis was performed as previously described (Li and Johnson, 2002; Li et al., 2002; Stein and Johnson, 2002), using total RNA extracted from primary cultures with Trizol reagent (Invitrogen). Briefly, cDNA was synthesized from total RNA by reverse transcription with T7-(dT)24 primer incorporating a T7 RNA polymerase promotor, followed by a DNA polymerase reaction (MessageAmp kit, Ambion, Austin, TX). Biotin-labeled cRNA was prepared by an in vitrotranscription reaction that used the cDNA from above (MessageAmp kit, Ambion; biotin-labeled nucleotide triphosphates, Enzo Biochem, New York, NY). Labeled cRNA was fragmented by incubation at 94°C for 35 min in the presence of (in mm) 40 Tris-acetate, pH 8.1, 100 potassium acetate, and 30 magnesium acetate. Fragmented cRNA (15 μg) was hybridized for 16 hr at 45°C to a rat genome U34A array (Affymetrix, Santa Clara, CA). After hybridization the gene chips were washed automatically and stained with streptavidin-phycoerythrin by using a fluidics station. Probe arrays then were scanned at 3 μm resolution, using the Genechip System confocal scanner made for Affymetrix by Agilent Technologies (Palo Alto, CA). Affymetrix Microarray Suite 5.0 was used to scan and analyze the relative abundance of each gene from the average difference of hybridization intensities. Analysis parameters used by the software were set to values corresponding to a moderate stringency (α1, 0.04; α2, 0.06; τ, 0.015; γ1L and γ1H, 0.0025; γ2L and γ2H, 0.003). Output from the microarray analysis was stored as an Excel data spreadsheet. The definition of statistically significant increase or decrease for individual genes was based on the following three criteria, in order, as previously described (Li and Johnson, 2002; Li et al., 2002; Stein and Johnson, 2002). (1) Rank analysis of the difference call (a measure of the direction and magnitude of change) was made from three intergroup comparisons (3 × 3, matrix analysis of three replicate samples) for neuronal cultures and two intergroup comparisons (2 × 2) for astrocyte cultures; no change was given a value of zero, marginal increase/decrease was given a value of 1/–1, and increase/decrease was given a value of 2/–2. The final rank referred to summing up the nine values for the neuronal cultures and four values for the astrocyte cultures corresponding to the difference calls. These values varied from 18 to –18 and from 9 to –9 for the neuronal and astrocyte cultures, respectively. The cutoff value for the determination of increase/decrease for neuronal cultures was set as 9/–9 and for astrocyte cultures was set as 4/–4. (2) For the coefficient of variation the cutoffs were set at 1.20. (3) For the fold change the cutoffs were set at 1.3 or greater for increased genes or −1.3 or lower for decreased genes.
Statistical analysis. All experiments were repeated at least three times unless otherwise stated. Results are presented as the mean ± SE. Statistical analysis of raw data was performed with GraphPad Prism 2.0 (San Diego, CA). Experimental groups were compared by one-way ANOVA, two-way ANOVA followed by Bonferroni's posttest, Kruskal–Wallis test, or Student's t test as appropriate. A statistical probability of p < 0.05 was considered significant.
Results
Neurons express lower levels of Nrf2 protein than astrocytes
We previously demonstrated that cortical astrocytes have a higher basal and stimulated level of ARE-mediated gene expression than neurons (Murphy et al., 2001; Johnson et al., 2002). One explanation for this observation would be that astrocytes express higher levels of the transcription factor Nrf2 than neurons. To test this hypothesis, we prepared enriched neuronal and astrocyte primary cortical cultures and probed their extracts with an anti-Nrf2 antibody by Western blot. A 105 kDa Nrf2-specific band was identified in enriched glial cultures that comigrated with recombinant Nrf2 overexpressed in HEK293 cells (Fig.2A,B). The same band was detected at very low levels in neuron-enriched cultures. Densitometry analysis revealed that glial-enriched cultures express ∼12-fold more Nrf2 protein than neuron-enriched cultures, implying that astrocytes may have more pronounced ARE-mediated gene expression because they express higher levels of Nrf2 than neurons (Fig.2B). The 105 kDa band was not detectable in HEK293 cells overexpressing a β-galactosidase control. The Nrf2 antibody, raised against the Nrf2 C-terminal region, also recognized the dominant-negative N-terminal-deleted form of Nrf2 migrating at 29 kDa (Nrf2DN). Although the Nrf2 antibody was used for Western blots, its nonspecific binding activity made it unsuitable for immunocytochemistry.
Fig. 2.

Cortical glia have higher basal Nrf2 expression and ARE promotor activity than neurons. A, Western blot of heterologously expressed Nrf2 (105 kDa) and Nrf2DN (28 kDa) in HEK293 cells. B, A comigrating 105 kDa band corresponding to Nrf2 is observed in enriched cortical glial, but not neuronal, cultures. Densitometric analysis reveals an ∼12-fold difference in Nrf2 protein (n = 3); *p < 0.05. C, Coexpression of Nrf2 cDNA with a hPAP-encoding reporter of ARE-mediated gene expression (rQR51) greatly increases neuronal hPAP expression. Reporter constructs carrying a mutation within the core ARE consensus sequence (rQR51Mut) were not inducible. Coexpression with Nrf2DN cDNA suppresses both neuronal and glial hPAP expression. *p < 0.05, neuron comparison to pEF (empty vector) control; #p< 0.05, glial comparison to pEF control. D, E,Representative hPAP-stained astrocyte-like cells with coexpression of pEF vector only. F, G, With Nrf2 overexpression cells of both neuronal and glial morphology show ARE-driven hPAP expression. Data from hPAP experiments represent the mean ± SEM number of cells counted from triplicate coverslips over four independent experiments.
If a lower basal level of Nrf2 protein is the reason for the lack of ARE-mediated gene expression in neurons, then overexpression of Nrf2 in neurons may be a strategy to boost their antioxidant gene expression. To test this idea, we used a reporter construct carrying a heat-stable hPAP gene driven by a minimal ARE-bearing promoter (rQR51). Previous studies in our lab show that, in rQR51-transfected cortical cultures and cultures derived from transgenic ARE-hPAP reporter mice, hPAP staining is restricted mainly to the astrocyte population (Murphy et al., 2001; Johnson et al., 2002). Consistent with our hypothesis, when rQR51 was cotransfected with an expression vector for Nrf2, the number of neurons staining for hPAP increased dramatically (Fig.2C--G). Coexpression of rQR51 with the empty expression vector pEF did not increase neuronal staining, and coexpression with Nrf2DN not only prevented neuronal staining but also suppressed basal astrocyte staining. Thus neurons are able to undergo ARE-mediated gene expression but appear to be constrained because of insufficient levels of Nrf2 protein. Induction of hPAP expression from rQR51 was dependent on the presence of a wild-type consensus ARE sequence and was abolished by mutation of this sequence (rQR51mut; Fig.2C).
Overexpression of Nrf2 enhances antioxidant activity of neurons and astrocytes in immature cortical cultures
We next evaluated whether Nrf2 overexpression could increase the antioxidant properties of cortical neurons and glia. For these experiments replication-deficient adenoviruses (Crocker et al., 2001) were used to infect a large fraction of neurons efficiently. Three different adenovirus constructs were made with CMV promoters driving the expression of enhanced green fluorescent protein (eGFP) alone (ad-GFP), Nrf2 and eGFP (ad-Nrf2), or Nrf2DN and eGFP (Ad-Nrf2DN). For the latter two viruses each cDNA was driven by a separate CMV promoter. When used to infect immature rat cortical cultures (1 DIV), all three viruses were able to infect ∼25% of the neurons and ∼80% of the glia, when used at a multiplicity of infection of 200.
To characterize the antioxidant activity of ad-Nrf2-infected cultures, we evaluated the protein products of three known Nrf2 target genes: heme-oxygenase-1 (HO-1) (Alam et al., 1999; Gong et al., 2002), system xc− (xCT, cystine transporter) (Ishii et al., 2000; Sasaki et al., 2002), and NQO1 (Bloom et al., 2002). Western blot analysis showed that HO-1 protein levels increased in parallel to Nrf2 overexpression in mixed cortical cultures (Fig. 3A). Similarly, when infected with ad-Nrf2, both neurons (Fig. 3B) and glia (data not shown) exhibited robust increases in NQO1 staining. Glial staining increased over and above normal basal levels (compared with ad-GFP control). Staining also was observed selectively in ad-Nrf2-infected neurons, but not in ad-GFP-infected neurons, further supporting the idea that neurons are capable of having an enhanced antioxidant response but are limited by low basal Nrf2 expression. Uninfected neurons in the ad-Nrf2-infected culture did not stain for NQO1. In addition, when infected with ad-Nrf2, xCT-mediatedl-[3H]-glutamate uptake in mixed cortical cultures increased to 372 ± 82% of the ad-GFP-infected group (Table 1). Conversely, activity was suppressed to 75.7 ± 7.1% of the ad-GFP control in ad-Nrf2DN-infected cultures. The Nrf2-induced increase inl-[3H]-glutamate uptake fit the pharmacological profile of system xc− because it was blocked by competitive inhibitors of cystine uptake such as quisqualate and homocysteic acid (Table 1). Nrf2-dependent upregulation of xCT mRNA also was verified by using RT-PCR with two independent primer sets (Fig. 3C). Comparison of basal xCT mRNA levels between mixed cultures and glial-enriched cultures with RT-PCR showed an approximately threefold (n = 1) higher signal in glial-enriched cultures (data not shown). However, this observation should be interpreted as a qualitative difference attributable to potential nonlinearity in the RT-PCR method. RT-PCR for GFP confirmed than an approximately equal amount of viral gene expression occurred in ad-GFP- and ad-Nrf2-infected cultures as well as between the mixed and glia-enriched culture types.
Fig. 3.

Ad-Nrf2-infected cultures exhibit enhanced antioxidant potential. A, Time course evaluation of Nrf2 protein overexpression with parallel induction of HO-1 expression.B, Histochemical staining revealed increased NQO1 activity in ad-Nrf2-infected neurons, but not neighboring uninfected neurons, visible under DIC optics (bottom panels). Neuronal NQO1 staining was not observed in the ad-GFP group (top panels). Scale bar, 20 μm. C, xCT mRNA levels increase with Nrf2 overexpression as shown by RT-PCR. Nrf2 mRNA derived from infection was detected by using selective mouse primers. D, Nrf2 overexpression increases total intracellular GSH/GSSG levels. Sublethal glutamate exposure (6 hr) leads to partial depletion of intracellular GSH in all groups (open bars). Control groups represent a separate group of cultures with no glutamate exposure but that were vehicle-treated (filled bars). Culture were given a total of 48 hr for expression before being harvested for GSH analysis. E,Increase in mCBi staining is primarily enriched in glia of ad-Nrf2-infected mixed cultures. Cultures are depicted in phase-contrast (Phase), fluorescence immunostaining for anti-GFAP (GFAP+) and anti-GFP (Infected), and 60 μm mCBi staining (mCBi). mCBi staining images show selected areas with high numbers of glial clusters and are not representative of actual mixed culture composition. HO-1 and NQO1 images are representative of at least three separate experiments. GSH data represent mean ± SEM of four separate experiments performed in duplicate; *p < 0.05, compared with GFP control.
Table 1.
Evaluation of Na+-independentl-[3H]-glutamate uptake by systemx in ad-Nrf2-infected mixed immature cortical cultures: percentage increase and pharmacology of induced uptake
| Compound | ad-GFP (%) | ad-Nrf2 (%) |
|---|---|---|
| None | 100 | 372 ± 82 |
| l-Cystine | 115.4 ± 13.2 | 86.5 ± 16.01-159 |
| Quisqualic acid | 77.8 ± 10.8 | 71.8 ± 10.51-159 |
| Homocysteic acid | 74.2 ± 22.0 | 80.0 ± 31.01-159 |
Data represent the mean ± SEM of five independent experiments performed in quadruplicate.
p < 0.05, compared with ad-GFP control.
F1-159: p < 0.05, compared with ad-Nrf2 control with no compounds. Uptake assay performed on mixed neuron/glial immature cultures. The basal rate ofl-[3H]-glutamate uptake by ad-GFP-expressing cultures is 59.1 ± 5.7 fmol/mg protein per min.
Nrf2 overexpression in mixed cultures also generated an approximately four- to fivefold increase in total intracellular glutathione [GSH + oxidized glutathione (GSSG)] as compared with GFP control (Fig.3D). Treating the cultures with 3 mmGlu for 6 hr before harvesting for GSH measurement reduced the GSH levels in all groups without causing neuronal death, but the ad-Nrf2-infected group still contained more GSH in comparison to controls. Using mCBi to stain for GSH in ad-Nrf2-infected cultures, we observed that the GSH/mCBi adduct fluorescence was enriched in GFAP-positive glia cells (Fig. 3E). This staining pattern was not observed in ad-GFP-infected cultures. A detailed quantitation of mCBi fluorescence revealed that both infected and uninfected neurons also were stained more heavily in the ad-Nrf2-infected mixed cultures in comparison to neurons in ad-GFP-infected cultures (Table2). It should be noted, however, that increased mCBi staining can be indicative of both increased GSH levels as well as enhanced GST activity (Tauskela et al., 2000).
Table 2.
Evaluation of GSH-bimane adduct staining in infected mixed cortical cultures
| Cell type | Ad-GFP | Ad-Nrf2 | Ad-Nrf2DN |
|---|---|---|---|
| Infected neuron | 21.1 ± 4.9 (60) | 40.6 ± 10 (60)* | 25.0 ± 5.2 (60) |
| Uninfected neuron | 19.0 ± 4.9 (60) | 34.1 ± 10 (60)* | 19.9 ± 4.5 (60) |
| Infected glia | 61.6 ± 11 (25) | 119 ± 17 (59)* | 35.1 ± 5.2 (40)*,2-159 |
Data represent the mean ± SEM, in arbitrary units of fluorescence intensity. Cell type was identified based on morphology (glial cells larger with web-like processes). The total number of cells evaluated for each group is listed in parentheses; with data collected from cells over three independent experiments performed in duplicate.
p < 0.001, compared with ad-GFP of same cell type.
F2-159: p < 0.05, compared with ad-GFP of same cell type.
Microarray analysis of Nrf2-overexpressing mixed cortical cultures and enriched glial cultures
To define the gene set targeted by Nrf2 thoroughly, we performed microarray analysis on mRNA derived from mixed neuron–glia cultures (3 DIV) and glial-enriched cultures (5–10 DIV) 48 hr after infection with ad-GFP or ad-Nrf2. Affymetrix rat genome U34A arrays were used to monitor the expression of ∼7000 full-length mRNAs and ∼1000 expressed sequence tag clusters. To define our culture systems better, we initially assessed the basal expression of glial markers in GFP-overexpressing cultures. As expected, the basal GFAP and vimentin signals were approximately sevenfold higher than in glial-enriched cultures in comparison to mixed cultures. The GFAP and vimentin signals from the two different culture types were normalized to various housekeeping genes, including lactate dehydrogenase, glyceraldehyde-3-phosphate dehydrogenase, and β-actin; similar results were obtained for each. The basal levels of the housekeeping genes varied by only ∼10% between the glial-enriched and mixed cultures. Conversely, the basal signals for the neuronal markers, neurofilament M and tau microtubule-associated protein, in mixed cultures were ∼34- and ∼62-fold higher, respectively, in comparison to glial-enriched cultures. The relative GFAP signal was used further to estimate that ∼13% of the mRNA from mixed cultures was of glial origin. Basal signals for rat Nrf2 mRNA indicated that glial-enriched cultures typically contained ∼31-fold more endogenous Nrf2 than the mixed cultures. Interestingly, not all transcription factors were enriched in glia because basal signals for CREB, Maf 1, Maf 2, and c-Jun varied only slightly between the two culture types. However, the basal signal for NF-κB also was highly enriched in glial cultures (∼15-fold). As expected from previous work, examination of basal mRNA levels indicated preferential glial expression of antioxidant factors such as NQO1, GST A3, GST P2, HO-1, catalase, thioredoxin reductase, metallothionein 1 or 2, and peroxiredoxin 1 and 5 (Dwyer et al., 1995;Murphy et al., 1998, 2001; Ahlgren-Beckendorf et al., 1999;Eftekharpour et al., 2000).
Analysis of three separate comparisons between mRNA from GFP and Nrf2-overexpressing cultures consistently indicated the selective upregulation of a number of known and previously unknown phase II detoxification genes in response to acute Nrf2 overexpression (48 hr; Tables 3,4). Given the large number of Nrf2-upregulated genes, only some genes were listed and categorized into four groups on the basis of function: detoxification, antioxidant/reducing potential/metabolism, signal transduction, and inflammation. A full gene list including increased and decreased genes is available online:http://www.pharmacy.wisc. edu/facstaff/sciences/JohnsonGroup/microdata.cfm. Of the increased genes, 92 were common to both glial-enriched and mixed cultures, the genes of interest of which are presented in Table 3 (fold induction cutoff, 1.3; repression cutoff, −1.3). In addition, a subset of genes was induced selectively in either the mixed cultures or glial-enriched cultures. Genes of interest from this list are presented in Table 4.
Table 3.
Common Nrf2 upregulated genes in glial-enriched cultures and mixed neuronal/glial cultures
| GenBank accession number | Gene | Glial-enriched | Neuron/glial mixed | ||||||
|---|---|---|---|---|---|---|---|---|---|
| R | Fold | CV | BS | R | Fold | CV | BS | ||
| Detoxification | |||||||||
| M58495 | NAD(P)H:quinone oxidoreductase | 8 | 4.3 | 0.24 | 2621 | 18 | 5.4 | 0.56 | 141 |
| K00136 | Glutathione S-transferase A1 or 2 | 6 | 17.6 | 0.41 | 24 | 12 | 8.8 | 0.80 | 100 |
| K01932 | Glutathione S-transferase A3 | 8 | 12.3 | 0.77 | 4657 | 18 | 19.8 | 0.56 | 223 |
| X62660 | Glutathione S-transferase A4 | 8 | 21.7 | 0.56 | 443 | 18 | 4.1 | 0.42 | 769 |
| X02904 | Glutathione S-transferase P2 | 8 | 3.4 | 0.38 | 22952 | 18 | 2.4 | 0.25 | 7230 |
| J02722 | Heme oxygenase 1 | 8 | 2.8 | 0.18 | 24137 | 18 | 21.3 | 1.2 | 358 |
| M11670 | Catalase | 8 | 4.1 | 0.34 | 1381 | 16 | 1.7 | 0.22 | 593 |
| M11794 | Metallothionein 1 or 2 | 4 | 3.7 | 0.56 | 15750 | 16 | 2.83 | 0.35 | 1274 |
| AI010083 | Peroxiredoxin 1 | 8 | 2.9 | 0.06 | 32993 | 18 | 2.5 | 0.25 | 6609 |
| AF014009 | Peroxiredoxin 6 (1-cys peroxiredoxin) | 8 | 3.3 | 0.12 | 6153 | 14 | 1.8 | 0.20 | 1772 |
| M21060 | Cu/Zn superoxide dismutase | 8 | 1.5 | 0.09 | 28627 | 16 | 1.9 | 0.27 | 14495 |
| AF106563 | p-glycoprotein/multi-drug resistance protein (MDR2) | 6 | 1.9 | 0.23 | 1459 | 10 | 5.9 | 0.71 | 2671 |
| X90642 | Multi-drug resistance protein (MRPI) | 8 | 2.3 | 0.33 | 3432 | 14 | 1.7 | 0.13 | 1317 |
| Signal transduction | |||||||||
| U09583 | Src-related tyrosine kinase | 8 | 22.6 | 0.90 | 89 | 18 | 25.6 | 0.16 | 56 |
| AI231354 | Stress-activated protein kinase, α | 8 | 3.1 | 0.10 | 1097 | 14 | 1.65 | 0.26 | 880 |
| D78610 | Protein tyrosine phosphatase receptor E | 7 | 6.7 | 0.27 | 83 | 14 | 0.0 | 0.00 | 858 |
| M15427 | c-raf | 8 | 3.6 | 0.25 | 3558 | 18 | 1.6 | 0.22 | 7427 |
| U31668 | E2F-5 transcription factor | 8 | 2.8 | 0.06 | 2242 | 18 | 1.7 | 0.16 | 933 |
| U04835 | cAMP-responsive element modulator | 8 | 2.0 | 0.20 | 2242 | 10 | 2.7 | 1.1 | 756 |
| Antioxidant/reducing potential/metabolism | |||||||||
| AI233261 | Glutamate-cysteine ligase, modifier subunit (γGCS) | 8 | 13.0 | 0.13 | 945 | 18 | 5.1 | 0.21 | 208 |
| U73174 | Glutathione reductase 1 | 8 | 3.3 | 0.15 | 1667 | 14 | 2.0 | 0.32 | 1324 |
| U63923 | Thioredoxin reductase 1 | 8 | 2.6 | 0.16 | 10344 | 16 | 3.4 | 0.56 | 3426 |
| M26594 | Malic enzyme 1 | 8 | 8.3 | 0.23 | 1264 | 18 | 10.1 | 0.35 | 227 |
| AI169802 | Ferritin H subunit H | 7 | 1.8 | 0.23 | 50557 | 10 | 1.3 | 0.13 | 18452 |
| J02791 | Acyl-coenzyme A dehydrogenase, medium chain | 8 | 3.2 | 0.22 | 925 | 12 | 3.2 | 0.87 | 42 |
| M60322 | Aldose reductase 1 | 8 | 5.1 | 0.15 | 24812 | 18 | 2.4 | 0.18 | 9958 |
| AA799452 | Transaldolase | 8 | 3.6 | 0.25 | 21356 | 18 | 1.8 | 0.23 | 19236 |
| M96633 | Mitochondrial intermediate peptidase | 8 | 2.8 | 0.30 | 699 | 9 | 1.5 | 0.24 | 452 |
| AA945054 | Cytochrome b5 | 8 | 2.6 | 0.40 | 1902 | 14 | 1.6 | 0.27 | 2179 |
| S53527 | S-100 calcium binding protein β | 8 | 78.7 | 1.15 | 1167 | 10 | 2.3 | 0.68 | 67 |
| U26714 | Solute carrier family 29 (iron-regulated transporter) | 6 | 21.3 | 0.37 | 402 | 18 | 5.9 | 0.27 | 102 |
| Inflammation | |||||||||
| AI176170 | FK506 binding protein | 6 | 1.5 | 0.20 | 19602 | 18 | 1.3 | 0.06 | 18354 |
| AA818025 | CD59 antigen | 8 | 25.9 | 0.04 | 1128 | 18 | 1.4 | 0.08 | 10966 |
| U03388 | Cyclooxygenase 1 | 8 | 3.9 | 0.23 | 2083 | 18 | 5.6 | 0.50 | 312 |
| Housekeeping | |||||||||
| V01217 | β actin | 186225 | 164621 | ||||||
| X02231 | Glyceraldehyde-3-phosphate-dehydrogenase | 405 | 348 | ||||||
| U07181 | Lactate dehydrogenase B | 13108 | 11253 | ||||||
Genes with fold change >1.3 are listed. R, Relative rank; CV, coefficient of variation; BS, basal signal intensity from GFP-infected cultures. Data shown are from n = 2 glial-enriched cultures and n = 3 mixed cultures.
Table 4.
Nrf2 upregulated genes specific to glial enriched cultures or mixed neuronal/glial cultures
| GenBank accession number | Gene | R | Fold | CV | BS |
|---|---|---|---|---|---|
| Neuron increased genes | |||||
| Antioxidant/reducing potential | |||||
| AF090867 | Guanosine monophosphate reductase | 12 | 2.5 | 0.41 | 330 |
| Signal transduction | |||||
| M54987 | Corticotropin-releasing hormone | 12 | 6.8 | 1.20 | 120 |
| M19651 | Fos-related antigen (Fra-1) | 16 | 7.4 | 1.10 | 70 |
| D15069 | Adrenomedullin | 12 | 12.7 | 0.74 | 106 |
| Miscellaneous | |||||
| M84488 | Vascular cell adhesion molecule-1 | 18 | 16.5 | 0.85 | 74 |
| Astrocyte increased genes | |||||
| Detoxification/metabolism | |||||
| S83436 | Glutathione S-transferase, mitochondrial | 4 | 3.9 | 0.27 | 341 |
| AF041105 | Organic anion transporter protein | 4 | 11.3 | 0.47 | 21 |
| S56936 | UDP-glucuronosyltransferase, bilirubin-specific | 6 | 3.0 | 0.12 | 382 |
| X56228 | Rhodonase, thiosulfate sulphurtransferase | 8 | 7.7 | 0.65 | 1686 |
| J02852 | Cytochrome P450 2A3 | 6 | 3.2 | 0.45 | 23 |
| Antioxidant/reducing potential | |||||
| X03518 | γ-Glutamyl transpeptidase | 4 | 6.5 | 0.15 | 149 |
| L38615 | Glutathione synthetase | 8 | 3.9 | 0.04 | 1328 |
| Signal transduction/apoptosis | |||||
| AI228669 | GABA transporter protein | 8 | 25.2 | 0.40 | 26 |
| L00981 | Tumor necrosis factor | 4 | 6.7 | 0.13 | 182 |
| M91595 | Insulin-like growth factor binding protein 2 | 8 | 3.5 | 0.28 | 4228 |
| U63740 | Protein kinase C-binding protein ζ 1 | 4 | 6.2 | 0.81 | 86 |
| AI072770 | Proteolipid protein | 6 | 10.6 | 1.10 | 137 |
| AI145444 | Neurabin, actin-binding protein | 4 | 3.3 | 0.13 | 23 |
| AF061726 | Calpain 3 | 8 | 3.3 | 0.24 | 176 |
| Inflammation | |||||
| AF010464 | Interleukin 7 | 4 | 7.8 | 0.26 | 32 |
| U66322 | Dithiolethione-inducible gene (DIG-1) | 8 | 3.0 | 0.52 | 1515 |
| M16410 | Tachykinin 2 | 4 | 4.5 | 0.65 | 244 |
| Miscellaneous | |||||
| AF098301 | NFB42-neural F box | 8 | 42.6 | 0.86 | 841 |
| X99773 | Neuroserpin, serine proteinase inhibitor | 8 | 6.3 | 0.58 | 187 |
| U09022 | 15 kDa perforational protein (PERF) | 8 | 97.0 | 0.62 | 29 |
| AF029690 | 8-Oxoguanine-DNA-glycosylase | 8 | 4.7 | 0.13 | 1248 |
Genes with fold change >1.3 are listed. R, Relative rank; CV, coefficient of variation; BS, basal signal intensity from GFP-infected cultures. Data shown are from n = 2 glial-enriched cultures and n = 3 mixed cultures.
The increased expression of various GST isoforms NQO1, HO-1, γ-glutamylcysteine synthetase (γ-GCS; only modifier light chain upregulation was observed), thioredoxin reductase, and malic enzyme by Nrf2 overexpression in both cultures types corresponds to the gene induction profile previously observed when electrophilic agents such as tert-butylhydroquinone (tBHQ) and sulforaphane were used (Ahlgren-Beckendorf et al., 1999; Eftekharpour et al., 2000; Li et al., 2002; Thimmulappa et al., 2002). Induction of these well characterized Nrf2 gene targets is, in part, supported by our own immunoblot data for HO-1, histochemical stains for NQO1, and measurements of GSH production (Fig. 3A,B,D). Of particular interest is the induction of many genes associated with the biosynthesis, use, and export of GSH, including the following: (1) uptake of cystine at the cell surface via the xCT cystine/glutamate antiporter, shown by RT-PCR (see Fig. 9) (Bannai, 1986; Sato et al., 1999); (2) synthesis of gGluCys by the rate-limiting enzyme for GSH synthesis γ-GCS; (3) incorporation of Gly to gGluCys to make the complete GSH tripeptide by GSH synthetase; (4) use of GSH by various GSTs and glutathione reductase; (5) possible efflux of GSH via the multidrug resistance protein (MRP1), a mechanism previously described for astrocyte GSH release (Hirrlinger et al., 2001, 2002); and (6) possible extracellular cleavage of GSH by γ-glutamyl transpeptidase (γGT).
Fig. 9.

Schematic diagram of GSH biosynthesis and release pathways that may be involved with Nrf2-dependent coupling of GSH between astrocytes and neurons. Astrocyte GSH synthesis and release are more robust with Nrf2 overexpression. Higher levels of xCT (system xc−) expression were detected, which promotes cystine uptake and provides a precursor for GSH synthesis. Microarray analyses indicate that all major enzymes involved in GSH biosynthesis are upregulated also. GSH release from astrocytes is increased, leading into several possible pathways of extracellular GSH metabolism, including an initial breakdown by γ-glutamylcysteine transpeptidase (γGT) and possible further breakdown by aminopeptidase (Apep) into the glutathione precursors Cys, Gly, and CysGly suitable for neuronal uptake (Dringen et al., 1999, 2001). Alternatively, extracellular GSH may be taken up by neurons directly or may contribute to the reduction of cystine into cysteine, which may be a source of sulfhydryl species for neuronal uptake (Sagara et al., 1993;Wang and Cynader, 2000). Neurons may also uptake cystine for glutathione synthesis (Murphy et al., 1990). Microarray analyses also indicate the upregulation of additional factors involved in detoxification, ROS scavenging, and NADPH production that may work together with GSH to protect neurons. Genes that are upregulated significantly by Nrf2 overexpression are underlined. Intracellular and extracellular concentrations of glutamate are average values from a combination of previous studies in the human brain and CSF (Siegel, 1981). CSF levels of cystine are typically very low at ∼0.2 μm (Lakke and Teelken, 1976; Araki et al., 1988; Wang and Cynader, 2000). The Invitrogen MEM used in this study is formulated to contain 100 μm cystine.
Enhancing antioxidant potential by Nrf2 overexpression protects neurons from cell death caused by oxidative stress, but not staurosporine-induced apoptosis
Can the increased antioxidant potential from Nrf2 overexpression protect neurons in in vitro models of oxidative stress? For this experiment we used a well established NMDA receptor-independent oxidative glutamate toxicity paradigm in which neurons die from GSH depletion (Murphy et al., 1989, 1990). When ad-GFP-infected cultures were treated with 3 mm glutamate, only 12.5 ± 5.3% of the infected neurons were viable after 24 hr (Fig.4A,B). With the same treatment 103.7 ± 4.6% of the ad-Nrf2-infected neurons survived the toxic exposure as compared with the ad-GFP control. Surprisingly, 88.0 ± 14.0% of the uninfected neurons in the same culture were protected also (Fig. 4A,D). The extent of neuronal death in the ad-Nrf2DN-infected group was very similar to that of the ad-GFP-infected group. Doubling the glutamate concentration to 6 mm was not able to overcome the protective effect of Nrf2 (data not shown), suggesting that upregulated glutamate removal mechanisms such as enhanced glutamate metabolism, glutamine synthesis from glutamate, or sodium-dependent glial glutamate uptake were not the main mechanisms for protection. Furthermore, after a 24 hr incubation the glutamate levels in the medium were not significantly different among the ad-GFP and ad-Nrf2 groups as assessed by a fluorescence-based glutamate dehydrogenase cycling assay (data not shown) (Nicholls et al., 1987). To ensure that the observed toxicity was indeed a result of oxidative stress, we added 100 μmα-tocopherol in the presence of 3 mm glutamate, and a nearly complete block of the neuronal death (80.3 ± 11.5% reduction; n = 4) was observed. We further ruled out the possibility of NMDA receptor-mediated excitotoxicity in our paradigm by treating 3–4 DIV cultures with 200 μm NMDA overnight or with a short 500 μm NMDA or glutamate exposure for 10 min in HBSS, followed by washout. Neither treatment caused appreciable neuronal death in these cultures (data not shown). The viability of glial cells was not affected by oxidative glutamate toxicity as observed in previous studies (Murphy et al., 1990) (Fig.4A,C).
Fig. 4.

Nrf2 overexpression in a subpopulation of cells confers widespread neuronal protection from oxidative glutamate toxicity. A, Immunocytochemistry for eGFP (green, identifying infected cells) and NSE (red marker, a neuron-selective marker). Within a typical ad-GFP-infected culture the infected neurons (yellow, red + green), uninfected neurons (red), and infected glia (green) can be observed. B, Group data evaluating the vulnerability of infected neurons to oxidative glutamate toxicity. Data are expressed as a percentage of GFP+NSE+ cells (presumed infected neurons) in the indicated glutamate treatment group as compared with the ad-GFP control group. VE, Vitamin E (α-tocopherol), 100 μm.C, Viability of GFP+NSE− cells (presumed infected glia) present per image was not affected significantly with glutamate treatment.D, Uninfected neurons within cultures containing Nrf2-infected cells are more resistant to oxidative glutamate toxicity. Data represent the mean ± SEM number of cells counted over triplicate wells from at least three independent experiments; *p < 0.05, compared with the GFP control no-glutamate group.
Ad-Nrf2-infected cultures were also more resistant to direct exposure to the pro-oxidant molecule H2O2. Ad-GFP- or ad-Nrf2-infected cultures were exposed to 0.3–30 μmH2O2 for 24 hr. Under these conditions the ad-GFP-infected group began to show significant neuronal toxicity at 3 μmH2O2 and maximum cell death at 30 μm H2O2(Fig. 5A). Infecting the cultures with ad-Nrf2 reduced neuronal toxicity by 53.1 ± 16.9% of the ad-GFP control during exposure to 10 μmH2O2. The protective effect of Nrf2 was overcome by 30 μmH2O2.
Neuronal injury from oxidative stress can exhibit features of an apoptotic pathway (Whittemore et al., 1995; Tan et al., 1998). To test whether Nrf2 upregulation could protect neurons from apoptosis induced by a different pathway than direct exposure to ROS, we treated infected cultures with 0.1–10 μm staurosporine, a potent inhibitor of phospholipid/Ca2+-dependent protein kinase (Tamaoki et al., 1986). Interestingly, overexpression of Nrf2 did not confer any protection from staurosporine-induced toxicity under these conditions (Fig. 5B). In both ad-GFP- and ad-Nrf2-infected groups cell death was observed with 0.3 μm first, whereas maximal toxicity was achieved with 10 μm.
Glutathione released from ad-Nrf2-infected glial is necessary and sufficient for protecting neurons from oxidative glutamate toxicity
Given that a small number of ad-Nrf2-infected glia are present in infected mixed cortical cultures (∼2% of the total cell number according to manual cell-counting data), it is possible that these enhanced glial cells contributed to the observed protection of neurons. To address this possibility, we tested whether ad-Nrf2-infected glia transplanted into naive (uninfected) mixed cultures could protect resident neurons. Ad-Nrf2-infected glia were plated directly into naive cultures at 0.1–2% of the total cell number by using the coculture setup, as detailed in Materials and Methods (Fig.1A). Amazingly, up to 83.3 ± 22.3% of the naive neurons were protected from 3 mm glutamate when the glia were transplanted at only 0.5% (Fig.6A–C). Complete neuronal protection was achieved when glia were plated at 1.5% of the total cell number. This protection was not observed with ad-GFP-, ad-Nrf2DN-infected, or uninfected glia. It should be noted, however, that the plated glial densities slightly underestimate the number of glia during exposure to toxins 24 hr after plating due to glial proliferation.
Glia are known to release a number of protective factors that enhance neuronal survival via a variety of mechanisms. Of particular importance is the release of sulfhydryl species such as GSH, cysteine–glycine (CysGly), or cysteine, which can contribute to neuronal GSH synthesis (Sagara et al., 1993a; Dringen et al., 1999;Wang and Cynader, 2000). When enriched glial cultures were infected with ad-Nrf2, both intracellular and released GSH were increased (Fig.7A,B). When glia were infected with ad-Nrf2 and plated at 2 × 10⁴ cells/ml (equivalent to 2% of the total cell number), the GSH accumulated in the medium over 24 hr was increased significantly to 11.5 ± 1.9 μmas compared with 4.6 ± 0.8 μm with ad-GFP or 2.8 ± 1.2 μm with ad-Nrf2DN. Filtering the medium (<3 kDa size restriction) did not reduce the GSH measured in the medium significantly, suggesting that the released GSH was not protein-bound and was most likely in its free form. Indeed, neuronal toxicity was prevented completely when naive cultures were exposed to 3 mm glutamate in the presence of 10 μm exogenous GSH for 24 hr (Fig.7C). This suggests that the concentration of GSH released into the medium by a small ad-Nrf2-infected glial component was sufficient for neuronal protection from oxidative glutamate toxicity.
To test whether GSH release from ad-Nrf2-infected glia was necessary for the observed neuronal protection, we used BSO, an irreversible blocker of γ-GCS, to inhibit glial GSH synthesis (Griffith and Meister, 1979). To avoid potential effects of BSO on neuronal GSH, we plated infected glia on culture plate inserts and treated them with 200 μm BSO for 24 hr before transfer into neuronal cultures by using the membrane-delimited coculture setup (Fig. 1B). For this setup the glial cells were situated in an upper layer 1–2 mm above naive neurons in the bottom of a well. BSO pretreatment of ad-Nrf2-infected glia suppressed levels of released GSH to ∼3 μm for >24 hr after washout (data not shown) and completely blocked the Nrf2-mediated protection of neurons (Fig. 7D).
Small molecule inducers of Nrf2 increase neuronal survival during oxidative glutamate toxicity
Compounds such as tBHQ and dimethyl fumarate, known inducers of Nrf2 activation and phase II gene induction, have been shown to protect various cell lines against oxidative stress caused by H2O2 and dopamine exposure (Duffy et al., 1998; Li et al., 2002). In this study we have found that direct pretreatment of immature cortical culture with 10–20 μm tBHQ for 24 hr efficiently blocks oxidative glutamate toxicity (Fig. 8A). To compare the protective potential of tBHQ-treated glia with ad-Nrf2-overexpressing glia, we treated enriched glial cultures with 5–20 μm tBHQ for 24 hr to allow for upregulation of an antioxidant response before they were transplanted into naive cortical cultures via the coculture setup (Fig.1A). Glia pretreated with 20 μm tBHQ provided neuronal protection from 3 mm glutamate when they were transplanted at a plating density of 5% of the total cell number (Fig.8B). However, protection was not seen when tBHQ-treated glia were transplanted at 2%, a density sufficient for neuronal protection when ad-Nrf2-infected glia were used. Treating glial with tBHQ increased intracellular GSH content, as previously described (Eftekharpour et al., 2000), and also increased released GSH in a dose-dependent manner (data not shown).
Discussion
Nrf2 overexpression boosts antioxidant potential of glia: protection of neurons from oxidative glutamate toxicity
Overexpression of the Cap‘n’Collar transcription factor Nrf2 upregulates a strong antioxidant response in both neurons and glia dissociated from rat cortex. We show that protection of neurons can be achieved by upregulation of the glial antioxidant response alone. Central to this protection was the augmented synthesis and release of glial GSH, which can be used toward strengthening the neuronal GSH pool. This conclusion was based on several lines of evidence. First, ad-Nrf2 infection of glia significantly increased intracellular and released GSH. Second, microarray analyses indicated the coordinated induction of GSH biosynthesis, use, and export enzymes. Third, exogenous GSH addition mimicked neuroprotection offered by ad-Nrf2-infected glia, and selective depletion of glial GSH with the use of BSO abolished this neuroprotection. Thus Nrf2-dependent enhancement of glial GSH release appears to be necessary and sufficient for neuronal protection. However, it is important to note that suppression of glial GSH synthesis may have deleterious effects on glial health and possibly could alter the expression of other glial-derived protective factors. Although GSH plays an important role for protection in the oxidative glutamate toxicity paradigm, we cannot rule out completely the involvement of other glial-derived factors.
It is well documented that astrocytes can protect neurons from damage caused by various ROS (Desagher et al., 1996; Lucius and Sievers, 1996; Tanaka et al., 1999; Kirchhoff et al., 2001). Previous studies have shown that an adequate astrocyte GSH content is essential because depletion of GSH with BSO abolishes astrocyte-mediated neuroprotection (Drukarch et al., 1997; Chen et al., 2001). One mechanism underlying this protection is the continuous glial delivery of GSH and/or GSH precursors to neurons for GSH synthesis (Yudkoff et al., 1990; Sagara et al., 1993a,b; Dringen et al., 1999, 2000). Interestingly, GSH efflux becomes markedly increased when the astrocytes are exposed to oxidative stress (Sagara et al., 1996), a response that may be initiated by Nrf2 activation.
Although the events necessary for the neuronal uptake of GSH and its precursors remain uncertain, evidence suggests that a number of sulfhydryl species can be used by neurons, including cysteine, cystine, and the CysGly dipeptide (Murphy et al., 1990; Sagara et al., 1993a,b;Kranich et al., 1996; Wang and Cynader, 2000). Two major paths can be initiated with the release of GSH into the medium/CSF (Fig.9). GSH can be metabolized into CysGly and Glu-X conjugates by the glial ectoenzyme γ-GT (Dringen et al., 1999). CysGly can be taken up by neurons or can be hydrolyzed further by the ectoenzyme aminopeptidase N to release cysteine (Dringen et al., 2001). Alternatively, a constant release of GSH can potentiate an extracellular thiol/disulfide exchange reaction with cystine to produce cysteine and a GSH-cysteine conjugate (Wang and Cynader, 2000). There is currently little direct evidence to support the uptake of GSH by neurons. However, both sodium-dependent and -independent GSH transport systems have been isolated from brain cells, including astrocytes (Kannan et al., 2000), bovine brain capillary cells (Kannan et al., 1996), and immortalized mouse brain endothelial cells (Kannan et al., 1999). Furthermore, sodium-dependent GSH transport in rat synaptosomal membrane vesicles exhibited high-affinity kinetics (Km = 4.5 ± 0.8 μm) (Iantomasi et al., 1999) and may be physiologically relevant for uptake considering the low GSH levels found in CSF (5.87 ± 0.29 μm) (Wang and Cynader, 2000).
For a toxicity paradigm we primarily have used oxidative glutamate toxicity in which neurons are exposed to millimolar levels of extracellular glutamate to inhibit cystine uptake completely via the cystine/glutamate antiporter, system xc−, leading to GSH depletion and oxidative stress (Murphy et al., 1989, 1990). In vivo, oxidative stress resulting from glutamate toxicity potentially may play a role in cell death during stroke, injury, and neurodegenerative disease (Coyle and Puttfarcken, 1993). Under these conditions extracellular levels of glutamate need not be in the millimolar range to inhibit cystine uptake, because CSF cystine levels are quite low and can be inhibited easily by only 100 μm glutamate, which is below the level of extracellular glutamate found in models of stroke and trauma (McAdoo et al., 1999; Wang and Cynader, 2000; Schubert and Piasecki, 2001).
The current literature describes the importance of Nrf2 for cellular resistance to pro-oxidant molecules (H2O2, tBHQ, and peroxynitrite), oxidant-generating molecules (menadione), in vivo situations that potentiate ROS-mediated damage (hyperoxic lung injury), as well as cytotoxic molecules that are neutralized by GSH detoxification or glucuronidation (4-hydroxynonenal, acetaminophen) (Duffy et al., 1998; Chan and Kan, 1999; Gao et al., 2001; Cho et al., 2002). However, it remains to be determined whether Nrf2 can provide resistance to relatively ROS-independent forms of cell death (i.e., excitotoxicity). Our data suggest that Nrf2-mediated protection does not extend to staurosporine toxicity and cell death attributed to calcium overload with the use of ionomycin (Duffy et al., 1998), both of which can initiate the apoptotic cascade like ROS accumulation (Ratan et al., 1994).
Characterization of the Nrf2 inducible gene set in neurons and glia via microarray analysis
The phase II enzyme gene set regulated by Nrf2 is broadening rapidly with the use of microarray technology (Li et al., 2002;Thimmulappa et al., 2002). These studies demonstrate that small molecule inducers of Nrf2 such as tBHQ and sulforaphane coordinately upregulate enzymes involved in several important lines of cellular defense: (1) antioxidant scavenging of ROS, (2) neutralization of electrophiles and xenobiotics by glucuronidation and glutathione conjugation, and (3) NADPH-generating metabolic pathways. Our results are in agreement with the enhancement of these lines of cellular defense, in particular GSH biosynthesis and use pathways, during Nrf2 activation. The fact that Nrf2 upregulates GSH-related enzymes is consistent with our observation that glial GSH release is important for neuroprotection. However, in light of the microarray data, which implicate that action of additional factors such as malic enzyme, ferritin H, HO-1, and peroxiredoxins, we believe Nrf2 activation in vivo leads to the activation of multiple enzymes that work in conjunction with enhanced GSH to account for changes in cerebral metabolism after insults such as stroke.
Using Nrf2 overexpression as an approach to identify the Nrf2-regulated gene set has certain advantages. Overexpression leads to robust activation of the ARE and potentially induces more subtly activated genes that may have escaped detection while using tBHQ or other inducers as a transcriptional stimulus. In addition, acute viral overexpression also complements the comparison of gene expression between wild-type and Nrf2 knock-out mice without the added complication of potential gene compensation caused by chronic absence of Nrf2 over the life span of the animal (Thimmulappa et al., 2002).
Because basal Nrf2 levels in neurons are considerably lower than in glia, the induction of these enzymes in neurons by endogenous Nrf2 may not necessarily follow the same profile exhibited by Nrf2 overexpression (Tables 3, 4). Furthermore, the amount of Nrf2 expressed in neurons is likely not the only factor regulating phase II enzyme expression. For example, despite large fold changes in many phase II enzyme mRNAs in mixed cultures (containing mostly neurons), after Nrf2 overexpression the absolute mRNA levels for many phase II enzymes were still well below those found in glial cultures. An estimate of this discrepancy can be made by multiplying the fold induction by the basal signal in Table 3. Perhaps glial cells have higher levels of other ARE-specific transcription factors such as Nrf1 that can contribute to a portion of the observed phase II enzyme gene induction (Venugopal and Jaiswal, 1996, 1998). Alternatively, glia may have reduced Nrf2 degradation via the ubiquitin–proteasome pathway (Nguyen et al., 2002;Sekhar et al., 2002; Stewart et al., 2002).
Given that the expression of phase II detoxification enzymes is generally lower in neurons (Eftekharpour et al., 2000; Murphy et al., 2001; Johnson et al., 2002), the large number of genes that apparently are upregulated in the mixed cultures may reflect, in part, the presence of contaminating glial cells in these cultures. However, genes that appear to be present only in mixed cultures, but not in glial-enriched cultures, suggest that the gene lists may represent a set of Nrf2-regulated genes specific to neurons, including guanosine monophosphate reductase and vascular cell adhesion molecule 1 (Table 4). Similarly, genes that appear to be upregulated selectively in glia cells also were identified, including γGT and UDP-glucuronosyltransferase. Nevertheless, it is important to note that increased expression of a gene in mixed cultures, but not glial-enriched cultures, does not prove necessarily that the gene is upregulated exclusively in neurons. It is possible that glial gene expression could be altered by direct contact with neurons or response to diffusible neuron-derived factors. We have not verified the expression of these putative neuron- or glial-specific genes by usingin situ hybridization or immunostaining.
Small molecule inducers of ARE gene expression in brain cells
In recent years small molecules that induce the activation of Nrf2 have been well characterized (Alam et al., 1999; Ishii et al., 2000;Lee et al., 2001). In this study we found that the selective activation of glial Nrf2 by the inducers partially protected neighboring neurons from oxidative stress, whereas direct treatment of mixed cultures provided more extensive neuronal protection. It is possible that, when mixed cultures are treated with tBHQ, induced neurons are upregulating their own antioxidant defenses in addition to accepting any diffusible sulfhydryl contributions from induced glia. Consistent with this observation, Johnson et al. (2002) demonstrated by using transgenic ARE-hPAP reporter mice that neurons display enhanced ARE-mediated gene expression with tBHQ treatment albeit at a considerably lower level than glia. Mixed cortical cultures prepared from these mice also exhibit increased resistance to oxidative stress (i.e., H2O2) when pretreated with tBHQ (our unpublished data).
From a practical standpoint, diet-based therapies that deliver phase II enzyme inducers to the brain may prove to be an efficient and straightforward means for neuroprotection (Fahey et al., 1997). However, like many other drugs designed for CNS disorders, these inducers face the added complication of passing the blood–brain barrier (BBB) to affect their targets (Miller, 2002). It remains unclear whether phase II enzyme inducers, although small and relatively lipophilic, can pass the BBB efficiently before being cleared from the body. However, once in the brain, activation of both glial and neuronal antioxidant responses with low doses of electrophilic agents may be sufficient for protecting neurons from oxidative stress. Furthermore, if glial delivery of sulfhydryl species to neurons occurs in vivo, efficient coupling is expected, considering the close association of neurons and glia and the much higher glial-to-neuron ratio in the CNS (Travis, 1994).
In conclusion, Nrf2 activation in glia produces a strong antioxidant response, particularly via the GSH synthesis and use pathway. Neuronal viability is enhanced significantly by an increased supply of GSH precursors from Nrf2-overexpressing glia. Future work will determine whether similar neuroprotection can be achieved in vivo by induction of the phase II response by administration of small molecule inducers or strategic adenoviral-mediated Nrf2 overexpression in certain areas of the brain. These approaches may have the potential to mitigate neuronal death caused by oxidative stress during stroke, traumatic injury, or even neurodegenerative disease.
Footnotes
This work was supported by a Rick Hansen Neurotrauma Initiative and a Michael Smith Foundation for Health Research (MSFHR) studentship award (A.Y.S); a grant from the Heart and Stroke Foundation of British Columbia and Yukon (T.H.M.); Grants ES08089 (J.A.J.), ES10042 (J.A.J.), and ES09090 (Environmental Health Sciences Center) from the National Institute of Environmental Health Sciences; and by the Burroughs Wellcome New Investigator in Toxicological Sciences Award (J.A.J.). T.H.M. is a Canadian Institutes of Health Research investigator and MSFHR senior scholar, and is supported by a grant from the Canadian Stroke Network. We thank Jessica Yu for excellent technical assistance, Matthew Slattery and the Molecular Biology Core Facility of the University of Wisconsin Environmental Health Science Center for conducting the gene array hybridizations, Dr. Alaa el-Husseini for use of the Axiovert 200M microscope, and Yingru Lui for anti-HO-1 antibodies.
Correspondence should be addressed to either of the following: Dr. Timothy H. Murphy, 4N1-2255 Wesbrook Mall, University of British Columbia, Vancouver, BC, V6T 1Z3, Canada, E-mail:thmurphy@interchange.ubc.ca; or Dr. Jeffrey A. Johnson, School of Pharmacy, University of Wisconsin, 6125 Rennebohm Hall, 777 Highland Avenue, Madison, WI 53705-2222, E-mail: jajohnson@pharmacy.wisc.edu.
References
- 1.Ahlgren-Beckendorf JA, Reising AM, Schander MA, Herdler JW, Johnson JA. Coordinate regulation of NAD(P)H:quinone oxidoreductase and glutathione S-transferases in primary cultures of rat neurons and glia: role of the antioxidant/electrophile responsive element. Glia. 1999;25:131–142. [PubMed] [Google Scholar]
- 2.Alam J, Stewart D, Touchard C, Boinapally S, Choi AM, Cook JL. Nrf2, a Cap'n'Collar transcription factor, regulates induction of the heme oxygenase-1 gene. J Biol Chem. 1999;274:26071–26078. doi: 10.1074/jbc.274.37.26071. [DOI] [PubMed] [Google Scholar]
- 3.Araki K, Harada M, Ueda Y, Takino T, Kuriyama K. Alteration of amino acid content of cerebrospinal fluid from patients with epilepsy. Acta Neurol Scand. 1988;78:473–479. doi: 10.1111/j.1600-0404.1988.tb03690.x. [DOI] [PubMed] [Google Scholar]
- 4.Bannai S. Exchange of cystine and glutamate across plasma membrane of human fibroblasts. J Biol Chem. 1986;261:2256–2263. [PubMed] [Google Scholar]
- 5.Bloom D, Dhakshinamoorthy S, Jaiswal AK. Site-directed mutagenesis of cysteine to serine in the DNA binding region of Nrf2 decreases its capacity to upregulate antioxidant response element-mediated expression and antioxidant induction of NAD(P)H:quinone oxidoreductase1 gene. Oncogene. 2002;21:2191–2200. doi: 10.1038/sj.onc.1205288. [DOI] [PubMed] [Google Scholar]
- 6.Chan K, Kan YW. Nrf2 is essential for protection against acute pulmonary injury in mice. Proc Natl Acad Sci USA. 1999;96:12731–12736. doi: 10.1073/pnas.96.22.12731. [DOI] [PMC free article] [PubMed] [Google Scholar]
- 7.Chen C, Okayama H. High-efficiency transformation of mammalian cells by plasmid DNA. Mol Cell Biol. 1987;7:2745–2752. doi: 10.1128/mcb.7.8.2745. [DOI] [PMC free article] [PubMed] [Google Scholar]
- 8.Chen Y, Vartiainen NE, Ying W, Chan PH, Koistinaho J, Swanson RA. Astrocytes protect neurons from nitric oxide toxicity by a glutathione-dependent mechanism. J Neurochem. 2001;77:1601–1610. doi: 10.1046/j.1471-4159.2001.00374.x. [DOI] [PubMed] [Google Scholar]
- 9.Cho HY, Jedlicka AE, Reddy SP, Kensler TW, Yamamoto M, Zhang LY, Kleeberger SR. Role of NRF2 in protection against hyperoxic lung injury in mice. Am J Respir Cell Mol Biol. 2002;26:175–182. doi: 10.1165/ajrcmb.26.2.4501. [DOI] [PubMed] [Google Scholar]
- 10.Coyle JT, Puttfarcken P. Oxidative stress, glutamate, and neurodegenerative disorders. Science. 1993;262:689–695. doi: 10.1126/science.7901908. [DOI] [PubMed] [Google Scholar]
- 11.Crocker SJ, Lamba WR, Smith PD, Callaghan SM, Slack RS, Anisman H, Park DS. c-Jun mediates axotomy-induced dopamine neuron death in vivo. Proc Natl Acad Sci USA. 2001;98:13385–13390. doi: 10.1073/pnas.231177098. [DOI] [PMC free article] [PubMed] [Google Scholar]
- 12.Desagher S, Glowinski J, Premont J. Astrocytes protect neurons from hydrogen peroxide toxicity. J Neurosci. 1996;16:2553–2562. doi: 10.1523/JNEUROSCI.16-08-02553.1996. [DOI] [PMC free article] [PubMed] [Google Scholar]
- 13.Dringen R, Pfeiffer B, Hamprecht B. Synthesis of the antioxidant glutathione in neurons: supply by astrocytes of CysGly as precursor for neuronal glutathione. J Neurosci. 1999;19:562–569. doi: 10.1523/JNEUROSCI.19-02-00562.1999. [DOI] [PMC free article] [PubMed] [Google Scholar]
- 14.Dringen R, Gutterer JM, Hirrlinger J. Glutathione metabolism in brain metabolic interaction between astrocytes and neurons in the defense against reactive oxygen species. Eur J Biochem. 2000;267:4912–4916. doi: 10.1046/j.1432-1327.2000.01597.x. [DOI] [PubMed] [Google Scholar]
- 15.Dringen R, Gutterer JM, Gros C, Hirrlinger J. Aminopeptidase N mediates the utilization of the GSH precursor CysGly by cultured neurons. J Neurosci Res. 2001;66:1003–1008. doi: 10.1002/jnr.10042. [DOI] [PubMed] [Google Scholar]
- 16.Drukarch B, Schepens E, Jongenelen CA, Stoof JC, Langeveld CH. Astrocyte-mediated enhancement of neuronal survival is abolished by glutathione deficiency. Brain Res. 1997;770:123–130. doi: 10.1016/s0006-8993(97)00790-7. [DOI] [PubMed] [Google Scholar]
- 17.Duffy S, So A, Murphy TH. Activation of endogenous antioxidant defenses in neuronal cells prevents free radical-mediated damage. J Neurochem. 1998;71:69–77. doi: 10.1046/j.1471-4159.1998.71010069.x. [DOI] [PubMed] [Google Scholar]
- 18.Dwyer BE, Nishimura RN, Lu SY. Differential expression of heme oxygenase-1 in cultured cortical neurons and astrocytes determined by the aid of a new heme oxygenase antibody. Response to oxidative stress. Brain Res Mol Brain Res. 1995;30:37–47. doi: 10.1016/0169-328x(94)00273-h. [DOI] [PubMed] [Google Scholar]
- 19.Eftekharpour E, Holmgren A, Juurlink BH. Thioredoxin reductase and glutathione synthesis is [sic] upregulated by t-butylhydroquinone in cortical astrocytes but not in cortical neurons. Glia. 2000;31:241–248. doi: 10.1002/1098-1136(200009)31:3<241::aid-glia50>3.0.co;2-9. [DOI] [PubMed] [Google Scholar]
- 20.Fahey JW, Zhang Y, Talalay P. Broccoli sprouts: an exceptionally rich source of inducers of enzymes that protect against chemical carcinogens. Proc Natl Acad Sci USA. 1997;94:10367–10372. doi: 10.1073/pnas.94.19.10367. [DOI] [PMC free article] [PubMed] [Google Scholar]
- 21.Friling RS, Bensimon A, Tichauer Y, Daniel V. Xenobiotic-inducible expression of murine glutathione S-transferase Ya subunit gene is controlled by an electrophile-responsive element. Proc Natl Acad Sci USA. 1990;87:6258–6262. doi: 10.1073/pnas.87.16.6258. [DOI] [PMC free article] [PubMed] [Google Scholar]
- 22.Gao X, Dinkova-Kostova AT, Talalay P. Powerful and prolonged protection of human retinal pigment epithelial cells, keratinocytes, and mouse leukemia cells against oxidative damage: the indirect antioxidant effects of sulforaphane. Proc Natl Acad Sci USA. 2001;98:15221–15226. doi: 10.1073/pnas.261572998. [DOI] [PMC free article] [PubMed] [Google Scholar]
- 23.Gong P, Stewart D, Hu B, Li N, Cook J, Nel A, Alam J. Activation of the mouse heme oxygenase-1 gene by 15-deoxy-Δ12,14-prostaglandin j2 is mediated by the stress response elements and transcription factor Nrf2. Antioxid Redox Signal. 2002;4:249–257. doi: 10.1089/152308602753666307. [DOI] [PubMed] [Google Scholar]
- 24.Griffith OW, Meister A. Potent and specific inhibition of glutathione synthesis by buthionine sulfoximine (S-n-butyl homocysteine sulfoximine). J Biol Chem. 1979;254:7558–7560. [PubMed] [Google Scholar]
- 25.Hardy S, Kitamura M, Harris-Stansil T, Dai Y, Phipps ML. Construction of adenovirus vectors through Cre-lox recombination. J Virol. 1997;71:1842–1849. doi: 10.1128/jvi.71.3.1842-1849.1997. [DOI] [PMC free article] [PubMed] [Google Scholar]
- 26.Hayes JD, Pulford DJ. The glutathione S-transferase supergene family: regulation of GST and the contribution of the isoenzymes to cancer chemoprotection and drug resistance. Crit Rev Biochem Mol Biol. 1995;30:445–600. doi: 10.3109/10409239509083491. [DOI] [PubMed] [Google Scholar]
- 27.Hayes JD, Chanas SA, Henderson CJ, McMahon M, Sun C, Moffat GJ, Wolf CR, Yamamoto M. The Nrf2 transcription factor contributes both to the basal expression of glutathione S-transferases in mouse liver and to their induction by the chemopreventive synthetic antioxidants, butylated hydroxyanisole and ethoxyquin. Biochem Soc Trans. 2000;28:33–41. doi: 10.1042/bst0280033. [DOI] [PubMed] [Google Scholar]
- 28.Hirrlinger J, Konig J, Keppler D, Lindenau J, Schulz JB, Dringen R. The multidrug resistance protein MRP1 mediates the release of glutathione disulfide from rat astrocytes during oxidative stress. J Neurochem. 2001;76:627–636. doi: 10.1046/j.1471-4159.2001.00101.x. [DOI] [PubMed] [Google Scholar]
- 29.Hirrlinger J, Schulz JB, Dringen R. Glutathione release from cultured brain cells: multidrug resistance protein 1 mediates the release of GSH from rat astroglial cells. J Neurosci Res. 2002;69:318–326. doi: 10.1002/jnr.10308. [DOI] [PubMed] [Google Scholar]
- 30.Iantomasi T, Favilli F, Vincenzini MT. Evidence of glutathione transporter in rat brain synaptosomal membrane vesicles. Neurochem Int. 1999;34:509–516. doi: 10.1016/s0197-0186(99)00027-3. [DOI] [PubMed] [Google Scholar]
- 31.Ishii T, Itoh K, Takahashi S, Sato H, Yanagawa T, Katoh Y, Bannai S, Yamamoto M. Transcription factor Nrf2 coordinately regulates a group of oxidative stress-inducible genes in macrophages. J Biol Chem. 2000;275:16023–16029. doi: 10.1074/jbc.275.21.16023. [DOI] [PubMed] [Google Scholar]
- 32.Itoh K, Chiba T, Takahashi S, Ishii T, Igarashi K, Katoh Y, Oyake T, Hayashi N, Satoh K, Hatayama I, Yamamoto M, Nabeshima Y. An Nrf2/small Maf heterodimer mediates the induction of phase II detoxifying enzyme genes through antioxidant response elements. Biochem Biophys Res Commun. 1997;236:313–322. doi: 10.1006/bbrc.1997.6943. [DOI] [PubMed] [Google Scholar]
- 33.Itoh K, Ishii T, Wakabayashi N, Yamamoto M. Regulatory mechanisms of cellular response to oxidative stress. Free Radic Res. 1999;31:319–324. doi: 10.1080/10715769900300881. [DOI] [PubMed] [Google Scholar]
- 34.Johnson DA, Andrews GK, Xu W, Johnson JA. Activation of the antioxidant response element in primary cortical neuronal cultures derived from transgenic reporter mice. J Neurochem. 2002;81:1233–1241. doi: 10.1046/j.1471-4159.2002.00913.x. [DOI] [PubMed] [Google Scholar]
- 35.Kannan R, Yi JR, Tang D, Li Y, Zlokovic BV, Kaplowitz N. Evidence for the existence of a sodium-dependent glutathione (GSH) transporter. Expression of bovine brain capillary mRNA and size fractions in Xenopus laevis oocytes and dissociation from γ-glutamyltranspeptidase and facilitative GSH transporters. J Biol Chem. 1996;271:9754–9758. doi: 10.1074/jbc.271.16.9754. [DOI] [PubMed] [Google Scholar]
- 36.Kannan R, Mittur A, Bao Y, Tsuruo T, Kaplowitz N. GSH transport in immortalized mouse brain endothelial cells: evidence for apical localization of a sodium-dependent GSH transporter. J Neurochem. 1999;73:390–399. doi: 10.1046/j.1471-4159.1999.0730390.x. [DOI] [PubMed] [Google Scholar]
- 37.Kannan R, Chakrabarti R, Tang D, Kim KJ, Kaplowitz N. GSH transport in human cerebrovascular endothelial cells and human astrocytes: evidence for luminal localization of Na+-dependent GSH transport in HCEC. Brain Res. 2000;852:374–382. doi: 10.1016/s0006-8993(99)02184-8. [DOI] [PubMed] [Google Scholar]
- 38.Kensler TW. Chemoprevention by inducers of carcinogen detoxication enzymes. Environ Health Perspect. 1997;105[Suppl 4]:965–970. doi: 10.1289/ehp.97105s4965. [DOI] [PMC free article] [PubMed] [Google Scholar]
- 39.Kirchhoff F, Dringen R, Giaume C. Pathways of neuron–astrocyte interactions and their possible role in neuroprotection. Eur Arch Psychiatry Clin Neurosci. 2001;251:159–169. doi: 10.1007/s004060170036. [DOI] [PubMed] [Google Scholar]
- 40.Kranich O, Hamprecht B, Dringen R. Different preferences in the utilization of amino acids for glutathione synthesis in cultured neurons and astroglial cells derived from rat brain. Neurosci Lett. 1996;219:211–214. doi: 10.1016/s0304-3940(96)13217-1. [DOI] [PubMed] [Google Scholar]
- 41.Lakke JP, Teelken AW. Amino acid abnormalities in cerebrospinal fluid of patients with parkinsonism and extrapyramidal disorders. Neurology. 1976;26:489–493. doi: 10.1212/wnl.26.5.489. [DOI] [PubMed] [Google Scholar]
- 42.Lee JM, Moehlenkamp JD, Hanson JM, Johnson JA. Nrf2-dependent activation of the antioxidant response element by tert-butylhydroquinone is independent of oxidative stress in IMR-32 human neuroblastoma cells. Biochem Biophys Res Commun. 2001;280:286–292. doi: 10.1006/bbrc.2000.4106. [DOI] [PubMed] [Google Scholar]
- 43.Li J, Johnson JA. Time-dependent changes in ARE-driven gene expression by use of a noise-filtering process for microarray data. Physiol Genomics. 2002;9:137–144. doi: 10.1152/physiolgenomics.00003.2002. [DOI] [PubMed] [Google Scholar]
- 44.Li J, Lee JM, Johnson JA. Microarray analysis reveals an antioxidant responsive element-driven gene set involved in conferring protection from an oxidative stress-induced apoptosis in IMR-32 cells. J Biol Chem. 2002;277:388–394. doi: 10.1074/jbc.M109380200. [DOI] [PubMed] [Google Scholar]
- 45.Lucius R, Sievers J. Postnatal retinal ganglion cells in vitro: protection against reactive oxygen species (ROS)-induced axonal degeneration by cocultured astrocytes. Brain Res. 1996;743:56–62. doi: 10.1016/s0006-8993(96)01029-3. [DOI] [PubMed] [Google Scholar]
- 46.Makar TK, Nedergaard M, Preuss A, Gelbard AS, Perumal AS, Cooper AJ. Vitamin E, ascorbate, glutathione, glutathione disulfide, and enzymes of glutathione metabolism in cultures of chick astrocytes and neurons: evidence that astrocytes play an important role in antioxidative processes in the brain. J Neurochem. 1994;62:45–53. doi: 10.1046/j.1471-4159.1994.62010045.x. [DOI] [PubMed] [Google Scholar]
- 47.McAdoo DJ, Xu GY, Robak G, Hughes MG. Changes in amino acid concentrations over time and space around an impact injury and their diffusion through the rat spinal cord. Exp Neurol. 1999;159:538–544. doi: 10.1006/exnr.1999.7166. [DOI] [PubMed] [Google Scholar]
- 48.Mena MA, Casarejos MJ, Carazo A, Paino CL, Garcia de Yebenes J. Glia-conditioned medium protects fetal rat midbrain neurones in culture from l-DOPA toxicity. NeuroReport. 1996;7:441–445. doi: 10.1097/00001756-199601310-00016. [DOI] [PubMed] [Google Scholar]
- 49.Miller G. Drug targeting: breaking down barriers. Science. 2002;297:1116–1118. doi: 10.1126/science.297.5584.1116. [DOI] [PubMed] [Google Scholar]
- 50.Moehlenkamp JD, Johnson JA. Activation of antioxidant/electrophile-responsive elements in IMR-32 human neuroblastoma cells. Arch Biochem Biophys. 1999;363:98–106. doi: 10.1006/abbi.1998.1046. [DOI] [PubMed] [Google Scholar]
- 51.Murphy TH, Miyamoto M, Sastre A, Schnaar RL, Coyle JT. Glutamate toxicity in a neuronal cell line involves inhibition of cystine transport leading to oxidative stress. Neuron. 1989;2:1547–1558. doi: 10.1016/0896-6273(89)90043-3. [DOI] [PubMed] [Google Scholar]
- 52.Murphy TH, Schnaar RL, Coyle JT. Immature cortical neurons are uniquely sensitive to glutamate toxicity by inhibition of cystine uptake. FASEB J. 1990;4:1624–1633. [PubMed] [Google Scholar]
- 53.Murphy TH, So AP, Vincent SR. Histochemical detection of quinone reductase activity in situ using LY 83583 reduction and oxidation. J Neurochem. 1998;70:2156–2164. doi: 10.1046/j.1471-4159.1998.70052156.x. [DOI] [PubMed] [Google Scholar]
- 54.Murphy TH, Yu J, Ng R, Johnson DA, Shen H, Honey CR, Johnson JA. Preferential expression of antioxidant response element mediated gene expression in astrocytes. J Neurochem. 2001;76:1670–1678. doi: 10.1046/j.1471-4159.2001.00157.x. [DOI] [PubMed] [Google Scholar]
- 55.Nguyen T, Huang HC, Pickett CB. Transcriptional regulation of the antioxidant response element. Activation by Nrf2 and repression by MafK. J Biol Chem. 2000;275:15466–15473. doi: 10.1074/jbc.M000361200. [DOI] [PubMed] [Google Scholar]
- 56.Nguyen T, Sherratt PJ, Huang HC, Yang CS, Pickett CB. Increased protein stability as a mechanism that enhances Nrf2-mediated transcriptional activation of the antioxidant response element: degradation of Nrf2 by the 26S proteasome. J Biol Chem. 2003;278:4536–4541. doi: 10.1074/jbc.M207293200. [DOI] [PubMed] [Google Scholar]
- 57.Nicholls DG, Sihra TS, Sanchez-Prieto J. Calcium-dependent and -independent release of glutamate from synaptosomes monitored by continuous fluorometry. J Neurochem. 1987;49:50–57. doi: 10.1111/j.1471-4159.1987.tb03393.x. [DOI] [PubMed] [Google Scholar]
- 58.Prestera T, Zhang Y, Spencer SR, Wilczak CA, Talalay P. The electrophile counterattack response: protection against neoplasia and toxicity. Adv Enzyme Regul. 1993;33:281–296. doi: 10.1016/0065-2571(93)90024-8. [DOI] [PubMed] [Google Scholar]
- 59.Primiano T, Sutter TR, Kensler TW. Antioxidant-inducible genes. Adv Pharmacol. 1997;38:293–328. doi: 10.1016/s1054-3589(08)60989-8. [DOI] [PubMed] [Google Scholar]
- 60.Raps SP, Lai JC, Hertz L, Cooper AJ. Glutathione is present in high concentrations in cultured astrocytes but not in cultured neurons. Brain Res. 1989;493:398–401. doi: 10.1016/0006-8993(89)91178-5. [DOI] [PubMed] [Google Scholar]
- 61.Ratan RR, Murphy TH, Baraban JM. Oxidative stress induces apoptosis in embryonic cortical neurons. J Neurochem. 1994;62:376–379. doi: 10.1046/j.1471-4159.1994.62010376.x. [DOI] [PubMed] [Google Scholar]
- 62.Rushmore TH, Morton MR, Pickett CB. The antioxidant responsive element. Activation by oxidative stress and identification of the DNA consensus sequence required for functional activity. J Biol Chem. 1991;266:11632–11639. [PubMed] [Google Scholar]
- 63.Sagara J, Miura K, Bannai S. Cystine uptake and glutathione level in fetal brain cells in primary culture and in suspension. J Neurochem. 1993a;61:1667–1671. doi: 10.1111/j.1471-4159.1993.tb09801.x. [DOI] [PubMed] [Google Scholar]
- 64.Sagara J, Miura K, Bannai S. Maintenance of neuronal glutathione by glial cells. J Neurochem. 1993b;61:1672–1676. doi: 10.1111/j.1471-4159.1993.tb09802.x. [DOI] [PubMed] [Google Scholar]
- 65.Sagara J, Makino N, Bannai S. Glutathione efflux from cultured astrocytes. J Neurochem. 1996;66:1876–1881. doi: 10.1046/j.1471-4159.1996.66051876.x. [DOI] [PubMed] [Google Scholar]
- 66.Sasaki H, Sato H, Kuriyama-Matsumura K, Sato K, Maebara K, Wang H, Tamba M, Itoh K, Yamamoto M, Bannai S. Electrophile response element-mediated induction of the cystine/glutamate exchange transporter gene expression. J Biol Chem. 2002;277:44765–44771. doi: 10.1074/jbc.M208704200. [DOI] [PubMed] [Google Scholar]
- 67.Sato H, Tamba M, Ishii T, Bannai S. Cloning and expression of a plasma membrane cystine/glutamate exchange transporter composed of two distinct proteins. J Biol Chem. 1999;274:11455–11458. doi: 10.1074/jbc.274.17.11455. [DOI] [PubMed] [Google Scholar]
- 68.Schubert D, Piasecki D. Oxidative glutamate toxicity can be a component of the excitotoxicity cascade. J Neurosci. 2001;21:7455–7462. doi: 10.1523/JNEUROSCI.21-19-07455.2001. [DOI] [PMC free article] [PubMed] [Google Scholar]
- 69.Sekhar KR, Yan XX, Freeman ML. Nrf2 degradation by the ubiquitin proteasome pathway is inhibited by KIAA0132, the human homolog to INrf2. Oncogene. 2002;21:6829–6834. doi: 10.1038/sj.onc.1205905. [DOI] [PubMed] [Google Scholar]
- 70.Shih AY, Murphy TH. xCt cystine transporter expression in HEK293 cells: pharmacology and localization. Biochem Biophys Res Commun. 2001;282:1132–1137. doi: 10.1006/bbrc.2001.4703. [DOI] [PubMed] [Google Scholar]
- 71.Siegel GJ. Basic neurochemistry, 3rd Ed. Little Brown; Boston: 1981. [Google Scholar]
- 72.Stein TD, Johnson JA. Lack of neurodegeneration in transgenic mice overexpressing mutant amyloid precursor protein is associated with increased levels of transthyretin and the activation of cell survival pathways. J Neurosci. 2002;22:7380–7388. doi: 10.1523/JNEUROSCI.22-17-07380.2002. [DOI] [PMC free article] [PubMed] [Google Scholar]
- 73.Stewart D, Killeen E, Naquin R, Alam S, Alam J. Degradation of transcription factor Nrf2 via the ubiquitin–proteasome pathway and stabilization by cadmium. J Biol Chem. 2003;278:2396–2402. doi: 10.1074/jbc.M209195200. [DOI] [PubMed] [Google Scholar]
- 74.Tamaoki T, Nomoto H, Takahashi I, Kato Y, Morimoto M, Tomita F. Staurosporine, a potent inhibitor of phospholipid/Ca2+-dependent protein kinase. Biochem Biophys Res Commun. 1986;135:397–402. doi: 10.1016/0006-291x(86)90008-2. [DOI] [PubMed] [Google Scholar]
- 75.Tan S, Sagara Y, Liu Y, Maher P, Schubert D. The regulation of reactive oxygen species production during programmed cell death. J Cell Biol. 1998;141:1423–1432. doi: 10.1083/jcb.141.6.1423. [DOI] [PMC free article] [PubMed] [Google Scholar]
- 76.Tanaka J, Toku K, Zhang B, Ishihara K, Sakanaka M, Maeda N. Astrocytes prevent neuronal death induced by reactive oxygen and nitrogen species. Glia. 1999;28:85–96. doi: 10.1002/(sici)1098-1136(199911)28:2<85::aid-glia1>3.0.co;2-y. [DOI] [PubMed] [Google Scholar]
- 77.Tauskela JS, Hewitt K, Kang LP, Comas T, Gendron T, Hakim A, Hogan M, Durkin J, Morley P. Evaluation of glutathione-sensitive fluorescent dyes in cortical culture. Glia. 2000;30:329–341. [PubMed] [Google Scholar]
- 78.Thimmulappa RK, Mai KH, Srisuma S, Kensler TW, Yamamoto M, Biswal S. Identification of Nrf2-regulated genes induced by the chemopreventive agent sulforaphane by oligonucleotide microarray. Cancer Res. 2002;62:5196–5203. [PubMed] [Google Scholar]
- 79.Tietze F. Enzymic method for quantitative determination of nanogram amounts of total and oxidized glutathione: applications to mammalian blood and other tissues. Anal Biochem. 1969;27:502–522. doi: 10.1016/0003-2697(69)90064-5. [DOI] [PubMed] [Google Scholar]
- 80.Travis J. Glia: the brain's other cells. Science. 1994;266:970–972. doi: 10.1126/science.7973679. [DOI] [PubMed] [Google Scholar]
- 81.Venugopal R, Jaiswal AK. Nrf1 and Nrf2 positively and c-Fos and Fra1 negatively regulate the human antioxidant response element-mediated expression of NAD(P)H:quinone oxidoreductase1 gene. Proc Natl Acad Sci USA. 1996;93:14960–14965. doi: 10.1073/pnas.93.25.14960. [DOI] [PMC free article] [PubMed] [Google Scholar]
- 82.Venugopal R, Jaiswal AK. Nrf2 and Nrf1 in association with Jun proteins regulate antioxidant response element-mediated expression and coordinated induction of genes encoding detoxifying enzymes. Oncogene. 1998;17:3145–3156. doi: 10.1038/sj.onc.1202237. [DOI] [PubMed] [Google Scholar]
- 83.Wang XF, Cynader MS. Astrocytes provide cysteine to neurons by releasing glutathione. J Neurochem. 2000;74:1434–1442. doi: 10.1046/j.1471-4159.2000.0741434.x. [DOI] [PubMed] [Google Scholar]
- 84.Whittemore ER, Loo DT, Watt JA, Cotman CW. A detailed analysis of hydrogen peroxide-induced cell death in primary neuronal culture. Neuroscience. 1995;67:921–932. doi: 10.1016/0306-4522(95)00108-u. [DOI] [PubMed] [Google Scholar]
- 85.Yudkoff M, Pleasure D, Cregar L, Lin ZP, Nissim I, Stern J. Glutathione turnover in cultured astrocytes: studies with [15N]glutamate. J Neurochem. 1990;55:137–145. doi: 10.1111/j.1471-4159.1990.tb08831.x. [DOI] [PubMed] [Google Scholar]