Abstract
This work describes the interaction of the human blood plasma proteins albumin, fibrinogen, and γ-globulins with micro- and nanopatterned polymer interfaces. Protein adsorption studies were correlated with the fibrin clotting time of human blood plasma and with the growth of primary human pulmonary artery endothelial cells (hECs) on these patterns. It was observed that blends of polycaprolactone (PCL) and trimethylsilyl-protected cellulose form various thin-film patterns during spin coating, depending on the mass ratio of the polymers in the spinning solutions. Vapor-phase acid-catalyzed deprotection preserves these patterns but yields interfaces that are composed of hydrophilic cellulose domains enclosed by hydrophobic PCL. The blood plasma proteins are repelled by the cellulose domains, allowing for a suggested selective protein deposition on the PCL domains. An inverse proportional correlation is observed between the amount of cellulose present in the films and the mass of irreversibly adsorbed proteins. This results in significantly increased fibrin clotting times and lower masses of deposited clots on cellulose-containing films as revealed by quartz crystal microbalance with dissipation measurements. Cell viability of hECs grown on these surfaces was directly correlated with higher protein adsorption and faster clot formation. The results show that presented patterned polymer composite surfaces allow for a controllable blood plasma protein coagulation and a significant biological response from hECs. It is proposed that this knowledge can be utilized in regenerative medicine, cell cultures, and artificial vascular grafts by a careful choice of polymers and patterns.
1. Introduction
Synthetic biodegradable polyesters, among them polycaprolactone (PCL), and biogenic polymers such as cellulose in different forms are promising biomaterials for medical applications related to tissue regeneration and artificial vascular grafts.1−4 Though PCL and cellulose were thoroughly studied materials with respect to their distinct physical and chemical properties, detailed investigations on biomolecular and cell interactions on their surface are relatively uncommon for PCL and cellulose.1,5 Such basic detailed studies though allow drawing conclusions on how living systems and biological matter interact with materials being composed of either PCL or cellulose.6,7 Plenty of polymer surface parameters can be studied from a physical, biological, and medical point of view. An important parameter for medicinal materials in contact with bodily fluids and especially with blood, plasma, or serum is protein adsorption and coagulation, all of which distinctively influence cellular response, foreign body reaction, and biodegradation.8,9 Hydrophobic polyesters commonly used as medicinal materials are generally prone to high protein adsorption which can impart unwanted blood clot formation after implantation.10,11 To avoid this, surface modifications and the use of hydrophilic polymers are very common strategies and include negatively charged heparines and a myriade of other polysaccharides.12−20 The arguments behind this are antifouling properties, biodegradability, biocompatibility, natural abundance, or relations to the extracellular matrix of cells, which should provide a hydrophilic environment and promote or direct cell growth.21,22 Despite their desired properties, most naturally occurring polysaccharides are however not thermoplastic and do not possess the mechanical strength and resistance to be easily shaped into scaffolds or implantable vascular grafts.
In the present study, we therefore investigate the potential of the beneficial properties of PCL and cellulose in the form of phase-separated composite blends. The intention is to design materials that combine the hydrophilic, low protein fouling of cellulose with the thermoplasticity and biodegradability of PCL.23 Initial blendability is achieved by protecting the cellulose hydroxyls with trimethylsilyl residues and subsequent exposure of these groups through acid-catalyzed deprotection (Scheme 1). To elucidate the interaction of resulting materials with human serum albumin (HSA), γ-globulins (GLO), and fibrinogen (FIB), detailed quartz crystal microbalance with dissipation (QCM-D) adsorption studies are conducted on thin films after a careful evaluation of their morphology. The same instrument is used to determine the fibrin clotting time, a measure of the anti-coagulative properties of the blend surfaces. These properties are directly correlated with the growth of primary human pulmonary artery endothelial cells (hECs) on the materials because hECs form the endothelium of the vasculature, the surface directly in contact with blood.24 Understanding the interaction of the cells and human blood plasma with the described materials should pave the way for implantable, degradable vascular grafts for autologous tissue regeneration.11
Scheme 1. Nano- and Micropatterned Surfaces from PCL and Cellulose and Their Interaction with Human Blood Plasma Proteins and Primary Human Pulmonary Artery Endothelial Cells.
2. Experimental Section
2.1. Materials
PCL (average molecular weight: Mn: 80 kDa), chloroform (≥99%), serum albumin (HSA, lyophilized powder, ≥97%), fibrinogen (FIB, type I-S, 50–70% protein), γ-globulins (GLO, ≥96%), disodium phosphate heptahydrate (Na2HPO4·7H2O), and sodium dihydrogen phosphate monohydrate (NaH2PO4·H2O) were acquired from Sigma-Aldrich Austria and used as received. Gold-coated QCM-D sensors (QSX301) were obtained from LOT-Oriel (Darmstadt, Germany). For contact angle measurements, Milli-Q water (resistivity >18 MΩ cm) from a Milli-Q-water system (Millipore, USA), diiodomethane (Sigma-Aldrich, 99%), formamide (Sigma-Aldrich, 99%), and glycerol (Sigma-Aldrich, 99.5%) were used. Trimethylsilyl cellulose (TMSC, DSTMS: 2.8, Mw: 149 kDa, derived from Avicel PH-101) was purchased from Thüringisches Institut für Textil- und Kunststoff-Forschung e.V. (TITK, Rudolstadt, Germany).
2.2. Preparation of Micro- and Nanopatterned Composites
TMSC solutions (1 wt %, dissolved in chloroform) were prepared and combined with solutions of PCL (1 wt %, dissolved in chloroform) at room temperature. Different ratios of PCL/TMSC [10:0, 9:1, 7:3, 5:5, 3:7, 1:9, and 0:10 (w/w)] were prepared by mixing the 1 wt % solutions. Silicon wafers (1.5 × 1.5 cm2, 100 surface orientation, Topsil, Germany) were cleaned with a solution-containing H2O2 (30 wt %)/H2SO4 (98 wt %), 1:3; v/v, caution very exothermal reaction upon mixing and the mixed acid is highly corrosive, for 10 min and thoroughly rinsed with water. Film preparation for contact angle and atomic force microscopy (AFM) measurements was performed by spin coating 100 μL of the solutions on the cleaned silicon wafers (Polos MCD wafer spinner, APT corporation, Germany).25 To obtain PCL/cellulose surfaces (termed PCL/TMSC “after regeneration” throughout the paper), the spin-coated films were placed into a 20 mL polystyrene (PS) Petri-dish (4 cm in diameter). Afterwards, a volume of 2 mL of 10 wt % HCl was dropped next to the coated silicon wafers and the Petri-dish was covered with its cap and the films were regenerated into cellulose for 10 min via the exposure of the HCl vapors evolving from the drop. For QCM-D measurements, sensor crystals coated with a gold layer were used as a substrate for spin coating of PCL/TMSC thin films. The crystals were soaked into a mixture of H2O/H2O2 (30 wt %)/NH4OH (5:1:1; v/v/v) for 10 min at 70 °C. After that, they were immersed into a solution-containing H2O2 (30 wt %)/H2SO4 (98 wt %) (1:3; v/v) for 60 s (caution very exothermal reaction upon mixing and the mixed acid is highly corrosive), rinsed with Milli-Q water, and finally blow-dried with nitrogen gas. For the preparation of PCL/cellulose surfaces, 50 μL of PCL/TMSC solutions (as mentioned above) prepared at different ratios was deposited on the static QCM-D Au-coated crystal which was then rotated for 60 s with a spinning speed of 4000 rpm and an acceleration of 2500 rpm s–1. For obtaining PCL/cellulose-coated surfaces, the coated crystals were exposed to vapors of HCl as described above.26,27
For cell culturing experiments, the PCL/TMSC micro- and nanopatterned surfaces after regeneration were prepared on glass slides in the same way as in the QCM-D experiments. Glass slides with four chambers were used for coating of PCL/TMSC solutions. For this experiment, the following five different solutions were used: PCL/TMSC (10:0, 9:1, 5:5, 1:9, and 0:10, w/w). For PCL/TMSC, the same spin coating procedure as mentioned above and 150 μL solutions were used. To obtain PCL/cellulose surfaces, the regeneration to cellulose was performed in a higher volume of HCl vapors. HCl (200 mL; 10 wt %) was stabilized for 1 h in a 300 mL vacuum desiccator equipped with ceramic plates. The spin-coated glass chambers were then placed onto the ceramic plates and were regenerated for 10 min, followed by covering the desiccator with its cap.28 Afterwards, the surfaces were rinsed with water, blow-dried with nitrogen gas, and stored before cell testing experiments.
2.3. Preparation of Protein Samples for QCM-D Experiments
HSA (30 mg mL–1), FIB (3 mg mL–1), and GLO (20 mg mL–1) were dissolved in a 10 mM phosphate-buffered saline (PBS) buffer prepared by dissolving 2.171 g of Na2HPO4·7 H2O (8.1 mM) and 0.262 g of NaH2PO4·H2O (1.9 mM) in 800 mL of water, adjusting to pH 7.4 with 0.1 M HCl and filling up to a volume of 1000 mL at room temperature. A protein mixture was prepared by mixing HSA, FIB, and GLO at the same concentrations as above in a 10 mM PBS buffer at pH 7.4. All protein solutions and buffers were freshly prepared before the QCM-D measurements.
2.4. Atomic Force Microscopy
The surface morphology of the samples was characterized by AFM in the tapping mode with an Agilent 7500 AFM multimode scanning probe microscope (Keysight Technologies, Santa Barbara, USA). The images were acquired after drying the samples with N2 gas. The samples were scanned using silicon cantilevers (ATEC-NC-20, Nanosensors, Germany) with a resonance frequency of 210–490 kHz and a force constant of 12–110 N m–1. All measurements were performed at room temperature. All images were recorded with a resolution of 2048 × 2048 pixels and were processed using the freeware Gwyddion allowing for the AFM roughness to be calculated as the root-mean-square (rms) deviation from the mean height of the topography after leveling of the images by mean plane subtraction.29
2.5. Contact Angle Measurements
To quantify the wettability of micro- and nanopattered PCL/TMSC or PCL/cellulose surfaces, contact angle measurements were performed using the OCA15+ contact angle measurement system from Dataphysics (Germany). Static contact angle (SCA) measurements were taken using four different liquids: Milli-Q water, diiodomethane, glycerol, and formamide. All measurements were conducted at room temperature on at least two independent surfaces with a drop volume of 3 μL. Each SCA value was the average of at least four drops of liquid per surface.
2.6. Profilometry
Layer thickness of the PCL/TMSC and PCL/cellulose films was determined by profilometry using a DEKTAK 150 Stylus Profiler from Veeco (Plainview, NY, USA). The scan length was set to 1000 μm in 3 s. The diamond stylus had a radius of 12.5 μm, and the force was 3 mg with a resolution of 0.333 μm/sample and a measurement range of 6.5 μm. The profile was set to hills and valleys. Prior to the surface scanning, the coating was scratched to remove the PCL/TMSC or PCL/cellulose films in order to determine the thickness of the coating using a step-height profile. The thickness was determined at 3 independent positions, and an average value and standard deviation were calculated.
2.7. Quartz Crystal Microbalance with Dissipation (QCM-D)
A QCM-D instrument (model E4) from Q-Sense (Gothenburg, Sweden) was used. The instrument simultaneously measures changes in the resonance frequency (Δf) and energy dissipation (ΔD) when the mass of an oscillating piezoelectric crystal changes upon increase/decrease in the mass of the crystal surface because of the removal/deposition of the material. Dissipation refers to the frictional losses that lead to damping of the oscillation depending on the viscoelastic properties of the material. For a rigid adsorbed layer that is fully coupled to the oscillation of the crystal, Δfn is given by the Sauerbrey eq 1(30)
| 1 |
where Δfn is the observed frequency shift, C is the Sauerbrey constant (−0.177 mg Hz–1 m–2 for a 5 MHz crystal), n is the overtone number (n = 1, 3, 5, etc.), and Δm is the change in mass of the crystal because of the adsorbed layer. The mass of a soft (i.e., viscoelastic) film is not fully coupled to the oscillation, and the Sauerbrey relation is not valid because energy is dissipated in the film during the oscillation. The damping (or dissipation) (D) is defined as
| 2 |
where Ediss is the energy dissipated and Estor is the total energy stored in the oscillator during one oscillation cycle.
2.7.1. Adsorption of Protein on Nano- and Micropatterned PCL/Cellulose-Coated Surfaces
QCM-D crystals coated with PCL/cellulose films were mounted in the QCM flow cell and equilibrated with Milli-Q-water and 10 mM PBS buffer solution until a stable change in frequency was established. HSA or FIB or GLO or their mixtures were pumped through the QCM-D cell for 180 min followed by the corresponding buffer solution for 60 min. The flow rate was kept at 0.1 mL min–1 throughout all experiments. The temperature was kept at 37 ± 0.1 °C for all experiments. All adsorption experiments were performed in three parallels, and a mean value and standard deviation of the third overtone of dissipation and frequency were calculated. The interaction of the cell growth media with the surfaces was evaluated accordingly by rinsing the surfaces with EBM-2, from Lonza (Allendale, New Jersey). Coagulation experiments were performed in an open QCM-D cell made of poly(tetrafluoroethylene) using citrated normal blood plasma (ORKE 41, HYPHEN, Biomed, France). The plasma solution (100 μL) equilibrated to 37 °C was deposited on the PCL/cellulose-coated QCM sensors. After 2 min, the coagulation was triggered by adding 100 μL of 0.025 M CaCl2 in water (HYPHEN, Biomed, France) until a stable frequency and the dissipation signal was obtained. Every measurement was carried out as triplicate at 37 °C, and an arithmetic mean QCM-D curve was calculated from these experiments for each thin-film composition. The change in frequency and dissipation as a function of time gives details about the fibrin deposition rate (df/dt) defined as the slope of the line tangent at the inflection point of the clot deposition curve.
2.8. Zeta Potential and Protein Charge Titration
The surface zeta potential of cellulose/PCL films coated on QCM-D sensors was calculated from streaming current measurements on a SurPASS Electrokinetic Analyzer from Anton Paar, Austria. Two sensors were mounted opposite of each other inside an adjustable gap cell separated by a distance of approx 100 μm. The streaming current was sensed by Ag/AgCl electrodes in an aqueous solution of 0.01 M NaCl at different pH values adjusted with 0.05 M HCl and 0.05 M NaOH. Throughout the series of surface zeta potential analyses, the electrolyte solution was continuously purged with N2 5.0 to prevent dissolution of carbon dioxide (CO2) from the ambient air. The complete details of the experiments can be found elsewhere.31
The pH-potentiometric titrations were used for determining the isoelectric point (pI) and total charge of proteins (HSA, FIB, and GLO). A glass titration cell was filled with one of the protein solutions and titrated forward (from acidic to alkaline) and backward (from alkaline to acidic) in the pH region 2.5–11 using 0.1 M HCl and 0.1 M KOH. The ionic strength of the solutions was 0.1 M KCl. The titrants were added to the system in a dynamic mode using a double burette Mettler Toledo T70 automatic titration unit. The pH value was measured using a Mettler Toledo (Switzerland) InLab Routine-combined glass electrode. Determination of the amount of charged functional groups is described elsewhere.32
2.9. Cell Culture
Before the cell culturing experiments, the PCL/cellulose-coated cover slides (PCL/TMSC after regeneration) were exposed to UV-light for 15 min followed by rinsing with PBS buffer and blown dry with nitrogen gas. Primary human pulmonary artery endothelial cells (hECs) were obtained from Lonza (Allendale, New Jersey) and were cultured according to the manufacturer’s instructions. Endothelial specific media with growth factor supplements (EBM-2, Lonza) were used and changed every third day. Different surface coatings and their influence on the cell viability of the primary hECs were assessed using a cell counting kit 8 (CCK-8) according to the manufacturer’s instructions (Dojindo Molecular Technologies, Inc). Briefly, cells (20 000 cells/well) were incubated in 4-well glass chamber plates for 72 h on different surface coatings. Subsequently, 10 μL of CCK-8 per 100 μL of culture medium was added to each well, and the cells were incubated for 3 h at 37 °C. Later, the supernatants were transferred to a 96-well plate, where cell viability was assessed as absorbance of each well at 450 nm measured by a microplate reader. The absorbance values were normalized to the total protein concentration of the correspondent surface-treated cells. All of the experiments were performed in triplicates.
2.9.1. Endothelial Cell Staining
For phalloidin or F-actin staining, the cells were grown on the respective PCL/cellulose (PCL/TMSC after regeneration)-coated cover slide and washed with PBS and fixed with 4% formaldehyde for 30 min at 4 °C. Then, the cells were incubated with Alexa555 conjugated-phalloidin (Molecular Probes) for 20 min at room temperature followed by repetitive washing with PBS and mounting with an antifading embedding medium (Vector Laboratories) containing DAPI counterstaining to visualize the nucleus. Images (scale bar 20 μm) were obtained by a Zeiss LSM510 META confocal imaging system with a planeofluar X40/1.3 oil DIC objective (Jena Germany).
2.9.2. Description of Cellular Morphology and Statistical Analysis
Bright-field microscopy images were taken for cells grown on the respective PCL/cellulose (PCL/TMSC after regeneration)-coated cover slide and analyzed with NIH image analysis software Image J. Four morphologic parameters: area, perimeter, circularity, and aspect ratio, were measured and averaged for at least 50 cells for each type of coatings. These morphologic parameters were expressed as a percentage of the respective parameter value for the control condition. PCL coatings were used as the control (scale bar 100 μm). Numerical values are given as mean ± SEM. Statistical analysis was performed using Prism 5 (GraphPad, San Diego, CA, USA). The Student’s t-test was used for nonparametric data. P-values < 0.05 were considered statistically significant.
3. Results and Discussion
3.1. Morphology, Thickness, and Wettability of Films
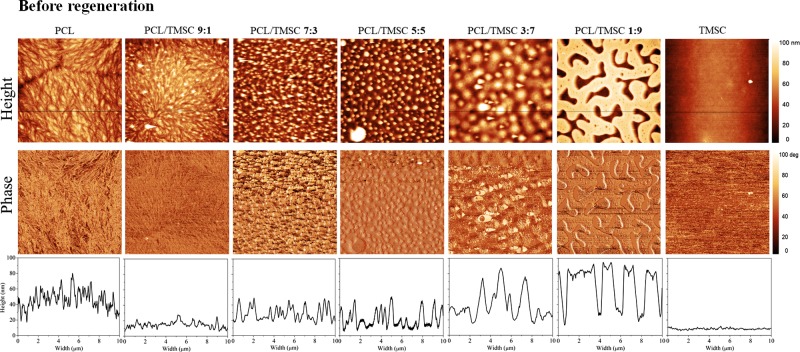
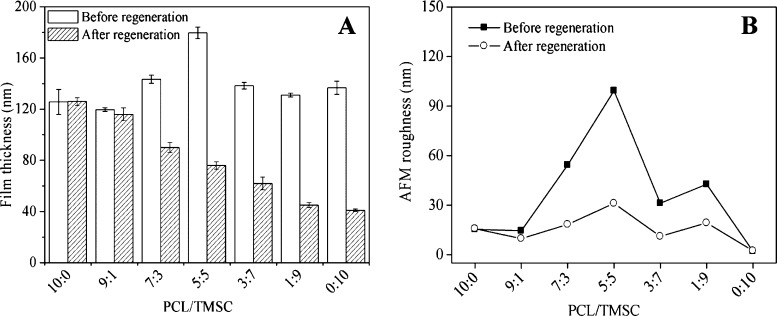
The phase separation patterns of spin-coated films composed of TMSC and PCL can be largely influenced by the polymer ratio of the spinning solution (Figure 1). Whereas pure single materials produce morphologically homogeneous films, increasing amounts of TMSC in a PCL matrix result into increased surface roughness and visible particles. A general trend is observed with increasing amounts of TMSC resulting into larger feature sizes (PCL/TMSC 3:7 ca. 1 μm diameter, PCL/TMSC 5:5 ca. 0.5 μm diameter). It was also found by other authors that films containing TMSC and polymethylmethacrylate had increasing TMSC feature sizes (10–160 nm) with higher TMSC concentrations.33 Structures with an apparently circular shape are noticed for films that contain equal amounts of the two polymers (PCL/TMSC 5:5) resulting into the largest rms roughness of all films (Figure 3B). When the film is composed of 90 wt % TMSC, islands of PCL with feature sizes of approximately 4 μm × 1 μm surrounded by the polysaccharide derivative are visible. A similar trend for feature sizes and morphology was found by others when blending the biobased polyester polyhydroxybutyrate with TMSC into thin films.34 Authors have also investigated blend films composed of PS (polystyrene) and TMSC and found that a mass ratio of 1:2 PS/TMSC qualitatively produces patterns similar to those observed here for PCL/TMSC 1:9.35 Increasing the amounts of PS versus TMSC results into larger but still nanosized droplets of phase-separated PS on the TMSC films. These blend films are however much smoother (rms roughness 0.5 nm at a 10 μm × 10 μm surface area) than those reported here.36 It is hypothesized that this is caused by the higher polarity of PCL compared to PS. Other works on blend films being composed of TMSC and cellulose triacetate (CTA) show micrometer-sized pores at ratios of 5:1 and 1:5 TMSC/CTA with the smallest pores at a ratio of 1:1, a property that is suprisingly not observed here, demonstrating the influence of the polymer composition on the phase separation process.37,38
Figure 1.
AFM images and cross-sectional profiles of nano- and micropatterned surfaces of PCL/TMSC.
Figure 3.
Profilometry thickness (A) and AFM roughness (B) of nano- and micropattered PCL/TMSC surfaces, before and after regeneration.
It could be shown that the polymer phase occupying a larger surface area is TMSC by developing the film with hexamethyldisiloxane (HMDSO) before, or with chloroform (CHCl3) after cleavage of the TMS groups (Supporting Information, Figure S1). It was however not possible to unambiguously distinguish the different polymer phases of cellulose and PCL via energy-dispersive X-ray spectroscopy (data not shown). TMS cleavage by HCl vapors termed “after regeneration” throughout leads to films composed of PCL/cellulose. In the first case, HMDSO treatment selectively removes TMSC, leaving a pattern of PCL behind which resembles the same features as those observed for the initial PCL/TMSC 1:9 film. Cleavage of TMS groups and subsequent removal of the PCL matrix by CHCl3 give residual cellulose patches. Obviously, these patches do not fully resemble the TMSC features as seen in the initial PCL/TMSC 1:9 film. It is assumed that parts of the cellulose detach together with the PCL matrix or that a dewetting of the cellulose fraction causes the observed changes in the morphology. The experiments however evidence that the films are composed of phase-separated PCL/cellulose with distances between the phases in the micrometer range.
Films composed only of TMSC are very smooth without visible particles. All coatings form however closed films which are stable on the gold electrode of QCM-D crystals and silicon wafers with a native SiO2 layer, a prerequisite for further protein adsorption and cell growth studies.
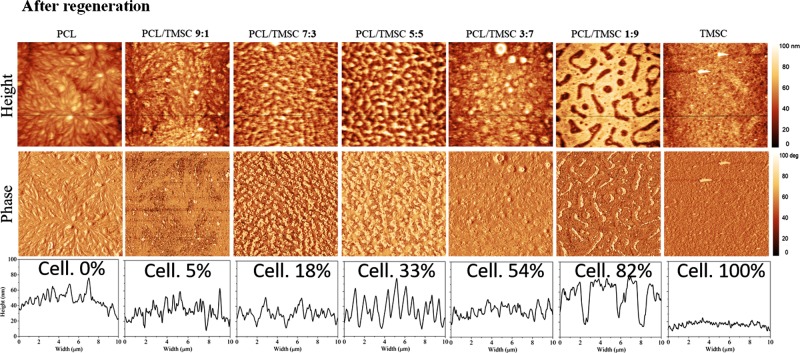
Removal of silyl protecting groups from TMSC leads to an increase in surface roughness and reduction of cellulose mass concentration because of the TMS cleavage but a preservation of the trends in morphological appearance of all composite films (Figure 2). It has been shown previously that the cleavage of silyl groups from TMSC results into a reduction of film thickness of the formed cellulose which can sufficiently explain the observed effects.28,39,40 Polymer chains are obviously not mobile enough in the lateral direction of the solid material upon regeneration to cause significant changes in the morphological appearance. For the films investigated, a decrease in film thickness proportional to the amount of TMSC could be observed, a fact that also demonstrates the removal of TMS groups as shown by ATR–IR spectroscopy (Supporting Information, Figures S2 and S3). According to the ATR–IR spectra, acid vapor treatment does not change the chemical composition of PCL after regeneration. Film thickness is relatively constant for all initially spun non-regenerated materials (120–150 nm). An exception are blend films composed of 50 wt % TMSC which are significantly thicker (180 nm) (Figure 3). This correlates with a higher film roughness stemming from the maximum possible area covered by both polymers at this composition. Although no measurements of crystallinity are presented here, it is known that PCL thin films are semicrystalline materials (crystallinity ca. 58–50%).41 Contrary to that cellulose regenerated from TMSC is regarded as amorphous.42 It is therefore assumed that the overall film crystallinity decreases with the amount of PCL. With the method described here, it was possible to produce stable blend films composed of PCL and regenerated cellulose in a reproducible manner on gold and silicon with a native SiO2 layer. It is supposed that these films can serve as model substrates for the bulk blend specimen of PCL/TMSC/cellulose under the condition that such bulk materials would be investigated with respect to their surface morphology, composition, and wettability. Results from our study could possibly be correlated with those observed on the surface of bulk materials.
Figure 2.
AFM images and cross-sectional profiles of nano- and micropatterned surfaces of PCL/cellulose, obtained from PCL/TMSC by regeneration with HCl vapors. Final cellulose concentrations are shown in wt %.
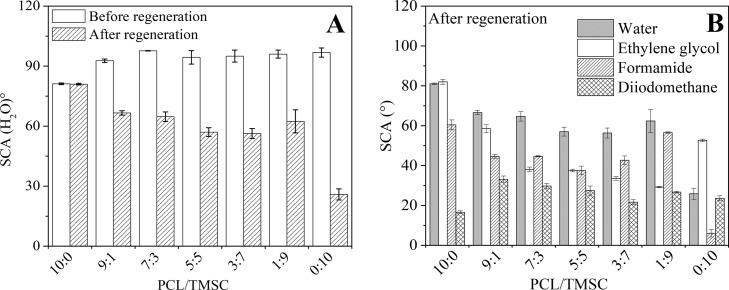
All blend films composed of PCL and TMSC are hydrophobic materials with a static contact angle of water (SCA(H2O)) of approximately 90° (Figure 4A). PCL has a somewhat lower SCA(H2O) of 81 ± 1° because of its more polar character compared to the cellulose derivative. After regeneration and exposure of the hydroxyl moieties, SCA(H2O) is gradually decreasing with higher amounts of polysaccharide present. An exception is the blend film obtained from PCL/TMSC 1:9 which also shows a very different morphology compared to all other films (Figure 2). It is assumed here that structural effects and larger phases of separated polymers are causing the higher SCA(H2O) and a larger standard deviation. The increasing polarity of films with a higher cellulose content can also be proven by the increased wetting of the polar solvents formamide and ethylene glycol (Figure 4B). Whereas the apolar solvent diiodomethane shows the highest wetting on PCL, minor amounts of cellulose present lead to an increase in its contact angle. Overall, the wetting of different liquids reflects the trend of higher polarity with a deviation for films with an initial PCL/TMSC ratio of 1:9 because of large structural differences in the surface morphology. Films composed of PCL and cellulose were further characterized and investigated with respect to the correlation of protein adsorption, fibrin coagulation, and endothelial cell viability and morphology.
Figure 4.
Wettability of water (A) and various solvents (B) on nano- and micropattered PCL/TMSC surfaces before and after regeneration.
3.2. Protein Adsorption
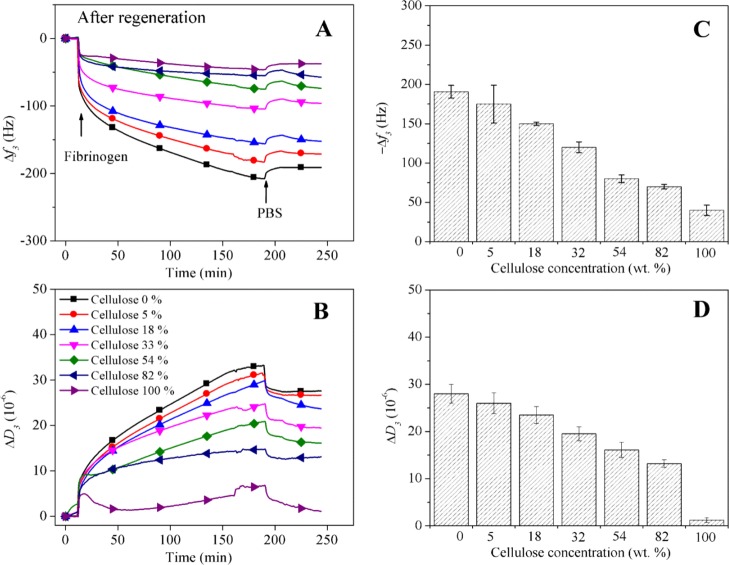
Because of its hydrophobicity, the biomaterial PCL is known to undergo nonspecific adhesion of proteins, which leads to an increased risk of thrombosis and occlusion.7,43 It is therefore of interest to alter the surface properties of PCL and to reduce its tendency toward unwanted adsorption of blood plasma proteins. A clear general trend for the adsorption of HSA, FIB, and GLO in PBS buffer at pH 7.4 and 37 °C was observed. The components of the cell growth media do not cause an observable shift of frequency when brought into contact with any of the films (Figure S4). As exemplarily given in the dynamic measurements with QCM-D in Figure 5A,B for FIB, protein adsorption strongly decreases with increasing amounts of cellulose present. The highest slope in the adsorption kinetics can be observed in the first 10 min after which the velocity of adsorption gradually decreases but does not reach full equilibrium after 200 min. The time until equilibrium is reached seems to be longer for PCL, suggesting a thicker layer and a more pronounced reorientation of the proteins. Rinsing with PBS buffer does not desorb substantial amounts of FIB in the course of 50 min, indicating a strong irreversible binding (Figure 5C). Dissipation values, a measure of the rigidity of the adsorbed surface layer, increase concomitantly with the amount of deposited protein. The ratio of frequency to dissipation (f3/D3), which is the highest for PCL (−190 Hz/27 × 10–6), indicates that the least amount of water is present in the adsorbed protein layer on this polymer, similar to what was found in other studies.8 QCM-D data for HSA and GLO on the same materials give a comparable trend of a lower protein adsorption on surfaces with a higher cellulose content.
Figure 5.
QCM-D frequency (A) and dissipation (B) changes during the adsorption of FIB on blend films containing increasing amounts of cellulose. The final changes in frequency f3 (C) and dissipation D3 (D) after rinsing with buffer are shown.
A summary of all QCM-D adsorption data is depicted in Figure 6 and shows the calculated adsorbed wet protein QCM-D mass (mg m–2) versus the amount of cellulose in the blend films. A strong correlation can be observed, demonstrating that hydrophilicity and hydration of the layers are the main factors that efficiently prevent protein adsorption on the blend and cellulose films. It is interesting that equal mixtures of all three types of proteins have the lowest adsorption also on PCL. Once the surface is blocked by proteins with the highest affinity and diffusion rate, additional binding of other proteins seems to be prevented. No synergistic effects between PCL and cellulose that would lead to minima or maxima in the correlation curve at certain PCL/cellulose ratios was observed. It has been suggested by other authors that a balance between hydrophilicity and hydrophobicity leads to even lower protein adsorption than on monocomponent materials.44,45 Obviously, the domain size of such amphiphilic systems is too large in our case to have an effect on single protein molecules. It is known from other works that cellulose can efficiently reduce protein adsorption because of hydrophilicity and most authors assume a hydration repulsion force to be the dominating effect.46 At pH 7.4, all surfaces show a negative zeta potential (in 10 mM NaCl) with a significant difference in absolute values for the pure polyester: PCL: −40.4 ± 0.3 mV; cellulose: −30.4 ± 0.1 mV; and 33.3 wt % cellulose: −27.6 ± 0.2 mV. The pH value at zero zeta potential is similar for all surfaces (pH 4) resulting into negatively charged materials at pH 7.4 (Figure S5 Supporting Information). All proteins investigated have isoelectric points below pH 7.4 and therefore bear an access of negative charge during the adsorption experiments (dissociated carboxyl groups) as confirmed by acid–base titration (Figure S6, Supporting Information) and literature.8 This leads to the hypothesis that protein binding and the higher affinity toward PCL are not caused by complexation of dissociated groups.5 In a similar manner, this work supports the thought that strongly bound water on the cellulose surface together with the absence or low amounts of charges from dissociated groups is the reason why cellulose efficiently repels the proteins investigated. On hydrophobic PCL, proteins tend to adsorb strongly by releasing water and by reorienting hydrophobic amino acid residues and with it the three-dimensional structure of the protein, a strong entropic driving force for the adsorption process.47,48
Figure 6.
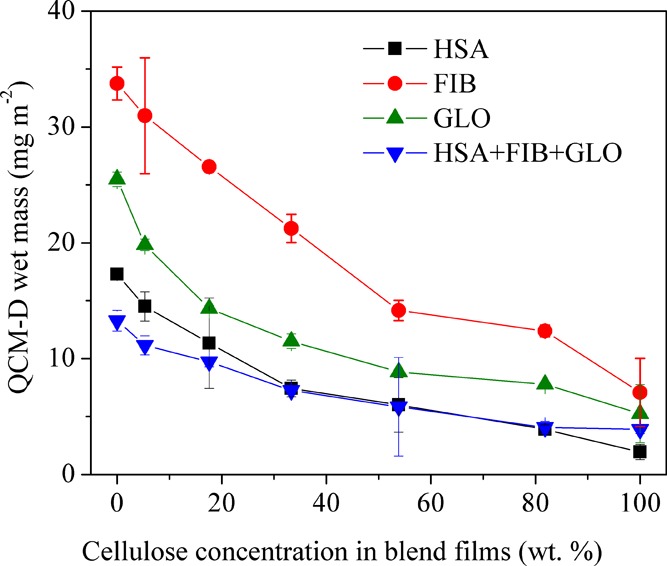
Protein adsorption vs cellulose concentration in blend films after regeneration.
3.3. Blood Plasma Coagulation
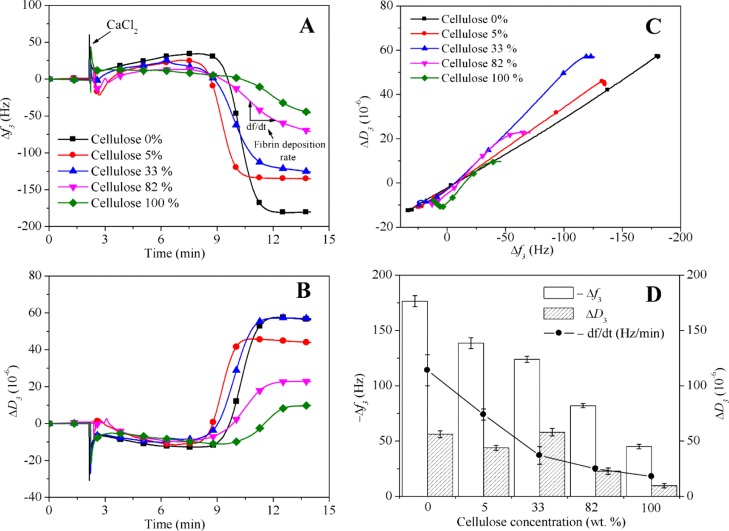
Similarly to the previous results, it was found that Δf3 (Figure 7A) and ΔD3 (Figure 7B) during plasma coagulation are directly proportional to the cellulose concentration. At the onset of thrombin formation induced by Ca2+, QCM-D shows an increase of f3 and a decrease of mechanical energy dissipation D3.49,50 This is interpreted as a release of mass from the surfaces which is less pronounced for higher cellulose concentrations. It is hypothesized that this release is caused by the thrombin-catalyzed proteolytic cleavage of previously and preferentially adsorbed FIB. After sufficiently high concentrations of thrombin and fibrin are accumulated, higher masses of fibrin deposit quickly on the surfaces as expressed by a steep Δf3. Cellulose however seems to strongly retard the fibrin clotting. When ΔD3 and Δf3 are set into relation (Figure 7C), one can observe a fibrin clot with a significantly higher dissipation of the mechanical oscillatory energy per deposited mass for 33% cellulose. According to AFM data in Figure 2, this film has the highest rms roughness but very likely the most equal surface area fraction and the highest interfacial area between both polymers for all films investigated for plasma coagulation. It is proposed that the high interfacial area between the two polymers leads to a more pronounced swelling of the cellulose phase and a preferential deposition of fibrin on PCL and therefore a higher ΔD3/Δf3. For PCL, a fibrin deposition rate (df/dt) of −114 ± 14 Hz min–1 was measured whereas this value was −18 ± 1 Hz min–1 for cellulose. Fourteen minutes after CaCl2 addition, Δf3 was less than −50 Hz and ΔD3 was less than 10 × 10–6 for cellulose. Contrarily, PCL showed values of Δf3 = −170 Hz and ΔD3 = 50 × 10–6 (Figure 7D) with the mentioned local maximum in ΔD3 for films with 33% cellulose. To summarize, cellulose and its composites with lower concentrations of PCL can be regarded as materials that strongly reduce the fibrin clot formation compared to pure PCL. Additionally, a structural contribution is seen by the fact that the rigidity of the fibrin clot is substantially lower on composites containing 33% cellulose.
Figure 7.
Time-dependent change in frequency f3 (A) and dissipation D3, (B) during blood plasma coagulation on films containing increasing amounts of cellulose. (C) f3 vs D3 for the same experiments. (D) Negative f3 and positive D3 shifts 14 min after the addition of CaCl2 including the fibrin deposition rate (df/dt) on films with increasing amounts of cellulose.
3.4. Cell Viability and Morphology
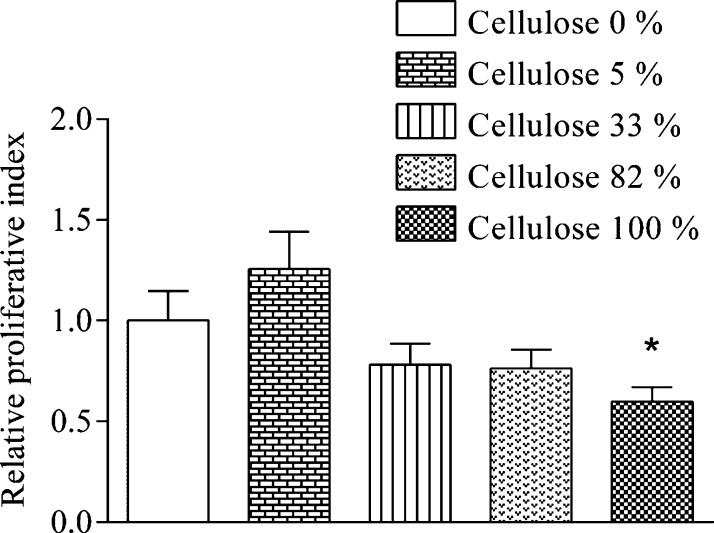
It is proposed widely that cellulose is a beneficial and suitable material worth to be investigated in the field of regenerative medicine and tissue engineering as a scaffold.51−53 Our observation is that hECs show a statistically significant reduced viability when grown on flat hydrophilic cellulose surfaces (SCA(H2O): 26 ± 2°) compared to hydrophobic PCL or blends made of both polymers (Figure 8). A general statement that cellulose is beneficial for endothelial cell growth because of its allegedly biocompatible character can therefore not be made.
Figure 8.
Viability of hECs cultured on PCL/cellulose surfaces.
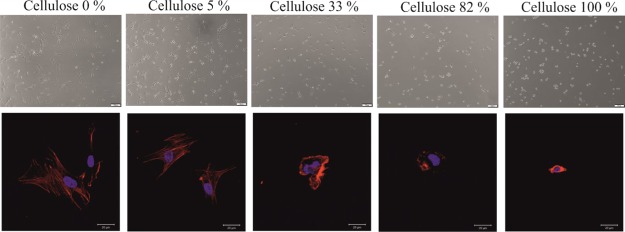
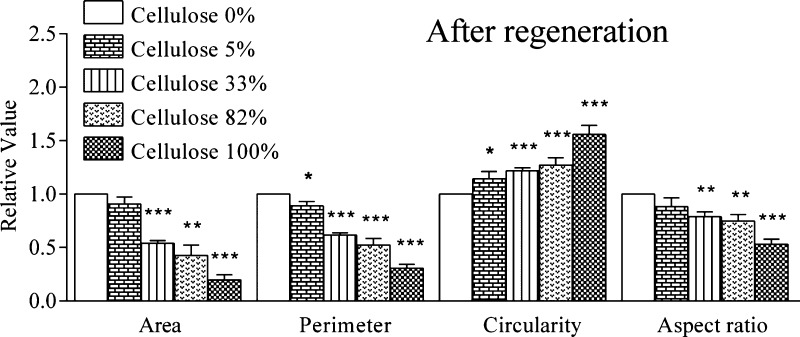
Morphological changes associated with the cell growth on surfaces composed of either two polymers or their blends give a clear indication that increasing amounts of cellulose lead to more spherical cells (Figure 9). On pure PCL, hECs show a spread morphology in fluorescence microscopy after F-actin staining and a relatively even distribution with the absence of larger aggregates in bright-field light microscopy. With increasing amounts of cellulose present in the films, hECs adopt a more circular morphology with almost only the cell nucleus being visible on cellulose. This is also reflected in the bright-field image which shows the highest number of circular cells on cellulose.
Figure 9.
Changes in cellular morphology of hECs cultured on films containing increasing amounts of cellulose visualized in bright field (top) and fluorescence microscopy after staining of F-actin (bottom).
Figure 9 elucidates the quantified morphology based on covered area, perimeter, circularity, and aspect ratio of n ≥ 50 cells analyzed for each film in the bright field. The trends of Figure 9 can be quantitatively seen in Figure 10 with a significant decrease in area, perimeter, and aspect ratio, and a significant increase in circularity with the amount of cellulose present in the films. It is hypothesized here that the hydrophilicity of cellulose, which strongly reduces protein adsorption,46 is responsible for the poor spreading of hECs. Cellulose provides an uncharged hydrophilic, highly hydrated surface on which neither common plasma proteins nor hECs can efficiently attach. It is known that hEC adhesion is based on extracellular or membrane proteins, proteoglycans or polysaccharides all of which obviously do not significantly interact with cellulose.54−56
Figure 10.
Quantification of changes in hECs’ cellular morphology induced by blend films containing increasing amounts of cellulose. For each sample, n ≥ 50 cells were analyzed. Circularity was defined as [4π(cell area)/(cell perimeter)2]. The aspect ratio was defined as the ratio between the long axis of the cell and the longest axis perpendicular to the long axis.
4. Conclusions
It is concluded that PCL can be blended into thin films with TMSC because of its similarities in the solubility. Spin coating allows for the formation of micro- and nanopatterns in such films that contain either TMSC or PCL phases. The TMS protecting group can be completely removed by a gas-phase process with HCl vapors. Such treatments preserve the trends in morphology but change the hydrophilicity because of exposure of cellulose hydroxyl groups. This leads to a clear correlation of reduced protein adsorption with increasing amounts of cellulose present in the films. Accordingly, cellulose strongly reduces the formation of fibrin clots on the surfaces. Primary human pulmonary artery endothelial cells (hECs) respond to the presence of hydrophilic cellulose in the film by a reduced viability and a strongly hindered ability to attach to the surface. It is assumed that the observed effects are due to the strong hydration but neutral charge of the cellulose surface. In summary, cell attachment, protein adsorption, and plasma coagulation strongly correlate with the cellulose content. Composites can be designed that allow for the introduction of these functionality in a spatially arranged manner. It is proposed that carefully designed surfaces and patterns of hydrophobic PCL and hydrophilic cellulose can be exploited as functional materials for regenerative medicine, cell culture, or artificial vascular grafts.
Acknowledgments
This work has been financed by the Slovenian National Research Agency ARRS (grant no. P2-0118 and Z2-9216). The authors are grateful to Assist. Prof. Stefan Spirk from the Graz University of Technology for his help with the profilometry measurements and Dr. Olivija Plohl University of Maribor and Dr. Thomas Luxbacher at the company Anton Paar Austria for zeta potential measurements on their SurPASS 3Electrokinetic Analyzer.
Supporting Information Available
The Supporting Information is available free of charge on the ACS Publications website at DOI: 10.1021/acs.biomac.9b00304.
AFM topographical image of a PCL/TMSC and a PCL/cellulose film (after the removal of PCL with HMDSO or TMSC with chloroform); ATR–IR spectra of PCL/TMSC films, before and after regeneration with HCl vapors; QCM-D frequency for the adsorption of the cell growth media EBM-2 onto PCL/cellulose films; zeta potential of PCL/cellulose films, and pH-potentiometric titrations of proteins (PDF)
Author Contributions
The manuscript was written through contributions of all authors. All authors have given approval to the final version of the manuscript.
The authors declare no competing financial interest.
Supplementary Material
References
- Woodruff M. A.; Hutmacher D. W. The return of a forgotten polymer—Polycaprolactone in the 21st century. Prog. Polym. Sci. 2010, 35, 1217–1256. 10.1016/j.progpolymsci.2010.04.002. [DOI] [Google Scholar]
- Markstedt K.; Mantas A.; Tournier I.; Martínez Ávila H.; Hägg D.; Gatenholm P. 3D Bioprinting Human Chondrocytes with Nanocellulose–Alginate Bioink for Cartilage Tissue Engineering Applications. Biomacromolecules 2015, 16, 1489–1496. 10.1021/acs.biomac.5b00188. [DOI] [PubMed] [Google Scholar]
- Klemm D.; Heublein B.; Fink H.-P.; Bohn A. Cellulose: Fascinating Biopolymer and Sustainable Raw Material. Angew. Chem., Int. Ed. 2005, 44, 3358. 10.1002/anie.200460587. [DOI] [PubMed] [Google Scholar]
- Dugan J. M.; Gough J. E.; Eichhorn S. J. Bacterial cellulose scaffolds and cellulose nanowhiskers for tissue engineering. Nanomedicine 2013, 8, 287–298. 10.2217/nnm.12.211. [DOI] [PubMed] [Google Scholar]
- Lombardo S.; Thielemans W. Thermodynamics of adsorption on nanocellulose surfaces. Cellulose 2019, 26, 249–279. 10.1007/s10570-018-02239-2. [DOI] [Google Scholar]
- Tanaka M.; Sackmann E. Polymer-supported membranes as models of the cell surface. Nature 2005, 437, 656. 10.1038/nature04164. [DOI] [PubMed] [Google Scholar]
- Ren X.; Feng Y.; Guo J.; Wang H.; Li Q.; Yang J.; Hao X.; Lv J.; Ma N.; Li W. Surface modification and endothelialization of biomaterials as potential scaffolds for vascular tissue engineering applications. Chem. Soc. Rev. 2015, 44, 5680–5742. 10.1039/c4cs00483c. [DOI] [PubMed] [Google Scholar]
- Mohan T.; Niegelhell K.; Nagaraj C.; Reishofer D.; Spirk S.; Olschewski A.; Stana Kleinschek K.; Kargl R. Interaction of Tissue Engineering Substrates with Serum Proteins and Its Influence on Human Primary Endothelial Cells. Biomacromolecules 2017, 18, 413–421. 10.1021/acs.biomac.6b01504. [DOI] [PubMed] [Google Scholar]
- Anderson J. M.; Rodriguez A.; Chang D. T. Foreign body reaction to biomaterials. Semin. Immunol. 2008, 20, 86–100. 10.1016/j.smim.2007.11.004. [DOI] [PMC free article] [PubMed] [Google Scholar]
- Fedel M.; Endogan T.; Hasirci N.; Maniglio D.; Morelli A.; Chiellini F.; Motta A. Blood compatibility of polymers derived from natural materials. J. Bioact. Compat. Polym. 2012, 27, 295. 10.1177/0883911512446060. [DOI] [Google Scholar]
- Hiob M. A.; She S.; Muiznieks L. D.; Weiss A. S. Biomaterials and Modifications in the Development of Small-Diameter Vascular Grafts. ACS Biomater. Sci. Eng. 2017, 3, 712–723. 10.1021/acsbiomaterials.6b00220. [DOI] [PubMed] [Google Scholar]
- Liu L.; Shengrong G.; Jiang C.; Congqin N.; Changming D.; Deyue Y. Surface modification of polycaprolactone membrane via layer-by-layer deposition for promoting blood compatibility. J. Biomed. Mater. Res., Part B 2008, 87B, 244–250. 10.1002/jbm.b.31103. [DOI] [PubMed] [Google Scholar]
- Khan S.; Ul-Islam M.; Ikram M.; Islam S. U.; Ullah M. W.; Israr M.; Jang J. H.; Yoon S.; Park J. K. Preparation and structural characterization of surface modified microporous bacterial cellulose scaffolds: A potential material for skin regeneration applications in vitro and in vivo. Int. J. Biol. Macromol. 2018, 117, 1200–1210. 10.1016/j.ijbiomac.2018.06.044. [DOI] [PubMed] [Google Scholar]
- Isobe N.; Komamiya T.; Kimura S.; Kim U.-J.; Wada M. Cellulose hydrogel with tunable shape and mechanical properties: From rigid cylinder to soft scaffold. Int. J. Biol. Macromol. 2018, 117, 625–631. 10.1016/j.ijbiomac.2018.05.071. [DOI] [PubMed] [Google Scholar]
- Menon A. H.; Soundarya S. P.; Sanjay V.; Chandran S. V.; Balagangadharan K.; Selvamurugan N. Sustained release of chrysin from chitosan-based scaffolds promotes mesenchymal stem cell proliferation and osteoblast differentiation. Carbohydr. Polym. 2018, 195, 356–367. 10.1016/j.carbpol.2018.04.115. [DOI] [PubMed] [Google Scholar]
- Kanimozhi K.; Khaleel Basha S.; Sugantha Kumari V.; Kaviyarasu K.; Maaza M. In vitro cytocompatibility of chitosan/PVA/methylcellulose – Nanocellulose nanocomposites scaffolds using L929 fibroblast cells. Appl. Surf. Sci. 2018, 449, 574–583. 10.1016/j.apsusc.2017.11.197. [DOI] [Google Scholar]
- Zeeshan R.; Mutahir Z.; Iqbal H.; Ali M.; Iqbal F.; Ijaz K.; Sharif F.; Shah A. T.; Chaudhry A. A.; Yar M.; Luan S.; Khan A. F. Hydroxypropylmethyl cellulose (HPMC) crosslinked chitosan (CH) based scaffolds containing bioactive glass (BG) and zinc oxide (ZnO) for alveolar bone repair. Carbohydr. Polym. 2018, 193, 9–18. 10.1016/j.carbpol.2018.03.046. [DOI] [PubMed] [Google Scholar]
- Radhakrishnan J.; Subramanian A.; Krishnan U. M.; Sethuraman S. Injectable and 3D Bioprinted Polysaccharide Hydrogels: From Cartilage to Osteochondral Tissue Engineering. Biomacromolecules 2017, 18, 1–26. 10.1021/acs.biomac.6b01619. [DOI] [PubMed] [Google Scholar]
- Mohan T.; Maver T.; Štiglic A. D.; Stana-Kleinschek K.; Kargl R.. 6 - 3D bioprinting of polysaccharides and their derivatives: From characterization to application. Fundamental Biomaterials: Polymers; Woodhead Publishing, 2018; pp 105–141. [Google Scholar]
- Maver T.; Hribernik S.; Mohan T.; Smrke D. M.; Maver U.; Stana-Kleinschek K. Functional wound dressing materials with highly tunable drug release properties. RSC Adv. 2015, 5, 77873–77884. 10.1039/c5ra11972c. [DOI] [Google Scholar]
- Russo L.; Russo T.; Battocchio C.; Taraballi F.; Gloria A.; D’Amora U.; De Santis R.; Polzonetti G.; Nicotra F.; Ambrosio L.; Cipolla L. Galactose grafting on poly(ε-caprolactone) substrates for tissue engineering: a preliminary study. Carbohydr. Res. 2015, 405, 39–46. 10.1016/j.carres.2014.07.027. [DOI] [PubMed] [Google Scholar]
- Stana J.; Stergar J.; Gradišnik L.; Flis V.; Kargl R.; Fröhlich E.; Stana Kleinschek K.; Mohan T.; Maver U. Multilayered Polysaccharide Nanofilms for Controlled Delivery of Pentoxifylline and Possible Treatment of Chronic Venous Ulceration. Biomacromolecules 2017, 18, 2732–2746. 10.1021/acs.biomac.7b00523. [DOI] [PubMed] [Google Scholar]
- Mohan T.; Niegelhell K.; Zarth C. S. P.; Kargl R.; Köstler S.; Ribitsch V.; Heinze T.; Spirk S.; Stana-Kleinschek K. Triggering protein adsorption on tailored cationic cellulose surfaces. Biomacromolecules 2014, 15, 3931–3941. 10.1021/bm500997s. [DOI] [PubMed] [Google Scholar]
- Maron B. A.; Galiè N. Diagnosis, Treatment, and Clinical Management of Pulmonary Arterial Hypertension in the Contemporary Era: A Review. JAMA Cardiol. 2016, 1, 1056–1065. 10.1001/jamacardio.2016.4471. [DOI] [PMC free article] [PubMed] [Google Scholar]
- Kargl R.; Mohan T.; Bračič M.; Kulterer A.; Doliška A.; Stana-Kleinschek K.; Ribitsch V. Adsorption of Carboxymethyl Cellulose on Polymer Surfaces. Evidence of a Specific Interaction with Cellulose.. Langmuir 2012, 28, 11440–11447. 10.1021/la302110a. [DOI] [PubMed] [Google Scholar]
- Mohan T.; Kargl R.; Doliška A.; Ehmann H. M. A.; Ribitsch V.; Stana-Kleinschek K. Enzymatic digestion of partially and fully regenerated cellulose model films from trimethylsilyl cellulose. Carbohydr. Polym. 2013, 93, 191–198. 10.1016/j.carbpol.2012.02.033. [DOI] [PubMed] [Google Scholar]
- Kargl R.; Vorraber V.; Ribitsch V.; Köstler S.; Stana-Kleinschek K.; Mohan T. Selective immobilization and detection of DNA on biopolymer supports for the design of microarrays. Biosens. Bioelectron. 2015, 68, 437–441. 10.1016/j.bios.2015.01.038. [DOI] [PubMed] [Google Scholar]
- Mohan T.; Spirk S.; Kargl R.; Doliška A.; Ehmann H. M. A.; Köstler S.; Ribitsch V.; Stana-Kleinschek K. Watching cellulose grow – Kinetic investigations on cellulose thin film formation at the gas–solid interface using a quartz crystal microbalance with dissipation (QCM-D). Colloids Surf., A 2012, 400, 67–72. 10.1016/j.colsurfa.2012.02.053. [DOI] [Google Scholar]
- Nečas D.; Klapetek P. Gwyddion: an open-source software for SPM data analysis. Open Phys. 2012, 10, 181–188. 10.2478/s11534-011-0096-2. [DOI] [Google Scholar]
- Sauerbrey G. Verwendung von Schwingquarzen zur Wägung dünner Schichten und zur Mikrowägung. Z. Phys. 1959, 155, 206–222. 10.1007/bf01337937. [DOI] [Google Scholar]
- Jachimska B.; Świątek S.; Loch J. I.; Lewiński K.; Luxbacher T. Adsorption effectiveness of β-lactoglobulin onto gold surface determined by quartz crystal microbalance. Bioelectrochemistry 2018, 121, 95–104. 10.1016/j.bioelechem.2018.01.010. [DOI] [PubMed] [Google Scholar]
- Čakara D.; Fras L.; Bračič M.; Kleinschek K. S. Protonation behavior of cotton fabric with irreversibly adsorbed chitosan: A potentiometric titration study. Carbohydr. Polym. 2009, 78, 36–40. 10.1016/j.carbpol.2009.04.011. [DOI] [Google Scholar]
- Kontturi E.; Johansson L.-S.; Laine J. Cellulose decorated cavities on ultrathin films of PMMA. Soft Matter 2009, 5, 1786. 10.1039/b901059a. [DOI] [Google Scholar]
- Niegelhell K.; Süßenbacher M.; Jammernegg K.; Ganner T.; Schwendenwein D.; Schwab H.; Stelzer F.; Plank H.; Spirk S. Enzymes as Biodevelopers for Nano- And Micropatterned Bicomponent Biopolymer Thin Films. Biomacromolecules 2016, 17, 3743–3749. 10.1021/acs.biomac.6b01263. [DOI] [PubMed] [Google Scholar]
- Kontturi E.; Nyfors L.; Laine J. Utilizing Polymer Blends to Prepare Ultrathin Films with Diverse Cellulose Textures. Macromol. Symp. 2010, 294, 45–50. 10.1002/masy.200900032. [DOI] [Google Scholar]
- Nyfors L.; Suchy M.; Laine J.; Kontturi E. Ultrathin Cellulose Films of Tunable Nanostructured Morphology with a Hydrophobic Component. Biomacromolecules 2009, 10, 1276. 10.1021/bm900099e. [DOI] [PubMed] [Google Scholar]
- Taajamaa L.; Kontturi E.; Laine J.; Rojas O. J. Bicomponent fibre mats with adhesive ultra-hydrophobicity tailored with cellulose derivatives. J. Mater. Chem. 2012, 22, 12072. 10.1039/c2jm30572k. [DOI] [Google Scholar]
- Taajamaa L.; Rojas O. J.; Laine J.; Kontturi E. Phase-specific pore growth in ultrathin bicomponent films from cellulose-based polysaccharides. Soft Matter 2011, 7, 10386. 10.1039/c1sm06020a. [DOI] [Google Scholar]
- Mohan T.; Kargl R.; Doliška A.; Vesel A.; Köstler S.; Ribitsch V.; Stana-Kleinschek K. Wettability and surface composition of partly and fully regenerated cellulose thin films from trimethylsilyl cellulose. J. Colloid Interface Sci. 2011, 358, 604–610. 10.1016/j.jcis.2011.03.022. [DOI] [PubMed] [Google Scholar]
- Strasser S.; Niegelhell K.; Kaschowitz M.; Markus S.; Kargl R.; Stana-Kleinschek K.; Slugovc C.; Mohan T.; Spirk S. Exploring Nonspecific Protein Adsorption on Lignocellulosic Amphiphilic Bicomponent Films. Biomacromolecules 2016, 17, 1083–1092. 10.1021/acs.biomac.5b01700. [DOI] [PubMed] [Google Scholar]
- Kosobrodova E.; Kondyurin A.; Chrzanowski W.; Theodoropoulos C.; Morganti E.; Hutmacher D.; Bilek M. M. M. Effect of plasma immersion ion implantation on polycaprolactone with various molecular weights and crystallinity. J. Mater. Sci.: Mater. Med. 2018, 29, 5. 10.1007/s10856-017-6009-1. [DOI] [PubMed] [Google Scholar]
- Mohan T.; Spirk S.; Kargl R.; Doliška A.; Vesel A.; Salzmann I.; Resel R.; Ribitsch V.; Stana-Kleinschek K. Exploring the rearrangement of amorphous cellulose model thin films upon heat treatment. Soft Matter 2012, 8, 9807–9815. 10.1039/c2sm25911g. [DOI] [Google Scholar]
- Zhu Y.; Mao Z.; Gao C. Aminolysis-based surface modification of polyesters for biomedical applications. RSC Adv. 2013, 3, 2509–2519. 10.1039/c2ra22358a. [DOI] [Google Scholar]
- Chen Y.; Thayumanavan S. Amphiphilicity in Homopolymer Surfaces Reduces Non-specific Protein Adsorption. Langmuir 2009, 25, 13795–13799. 10.1021/la901692a. [DOI] [PMC free article] [PubMed] [Google Scholar]
- Kerstetter J. L.; Gramlich W. M. Nanometer-scale self-assembly of amphiphilic copolymers to control and prevent biofouling. J. Mater. Chem. B 2014, 2, 8043–8052. 10.1039/c4tb00961d. [DOI] [PubMed] [Google Scholar]
- Taajamaa L.; Rojas O. J.; Laine J.; Yliniemi K.; Kontturi E. Protein-assisted 2D assembly of gold nanoparticles on a polysaccharide surface. Chem. Commun. 2013, 49, 1318–1320. 10.1039/c2cc37288f. [DOI] [PubMed] [Google Scholar]
- Fang F.; Szleifer I. Kinetics and Thermodynamics of Protein Adsorption: A Generalized Molecular Theoretical Approach. Biophys. J. 2001, 80, 2568–2589. 10.1016/s0006-3495(01)76228-5. [DOI] [PMC free article] [PubMed] [Google Scholar]
- Farcas M.; Cosman N. P.; Ting D. K.; Roscoe S. G.; Omanovic S. A comparative study of electrochemical techniques in investigating the adsorption behaviour of fibrinogen on platinum. J. Electroanal. Chem. 2010, 649, 206–218. 10.1016/j.jelechem.2010.04.004. [DOI] [Google Scholar]
- Andersson M.; Andersson J.; Sellborn A.; Berglin M.; Nilsson B.; Elwing H. Quartz crystal microbalance-with dissipation monitoring (QCM-D) for real time measurements of blood coagulation density and immune complement activation on artificial surfaces. Biosens. Bioelectron. 2005, 21, 79–86. 10.1016/j.bios.2004.09.026. [DOI] [PubMed] [Google Scholar]
- Doliška A.; Strnad S.; Stana J.; Martinelli E.; Ribitsch V.; Stana-Kleinschek K. In Vitro Haemocompatibility Evaluation of PET Surfaces Using the Quartz Crystal Microbalance Technique. J. Biomater. Sci., Polym. Ed. 2012, 23, 697–714. 10.1163/092050611x559232. [DOI] [PubMed] [Google Scholar]
- Domingues R. M. A.; Gomes M. E.; Reis R. L. The Potential of Cellulose Nanocrystals in Tissue Engineering Strategies. Biomacromolecules 2014, 15, 2327–2346. 10.1021/bm500524s. [DOI] [PubMed] [Google Scholar]
- Xu W.; Wang X.; Sandler N.; Willför S.; Xu C. Three-Dimensional Printing of Wood-Derived Biopolymers: A Review Focused on Biomedical Applications. ACS Sustainable Chem. Eng. 2018, 6, 5663–5680. 10.1021/acssuschemeng.7b03924. [DOI] [PMC free article] [PubMed] [Google Scholar]
- Mohan T.; Hribernik S.; Kargl R.; Kleinschek K. S.. Nanocellulosic Materials in Tissue Engineering Applications. Cellulose—Fundamental Aspects and Current Trends; InTech, 2015. [Google Scholar]
- Reinhart-King C. A.Endothelial Cell Adhesion and Migration. Methods in Enzymology; Academic Press, 2008; Vol. 443, Chapter 3, pp 45–64. [DOI] [PubMed] [Google Scholar]
- Caiado F.; Dias S. Endothelial progenitor cells and integrins: adhesive needs. Fibrog. Tissue Repair 2012, 5, 4. 10.1186/1755-1536-5-4. [DOI] [PMC free article] [PubMed] [Google Scholar]
- Moon J. J.; Matsumoto M.; Patel S.; Lee L.; Guan J.-L.; Li S. Role of cell surface heparan sulfate proteoglycans in endothelial cell migration and mechanotransduction. J. Cell. Physiol. 2005, 203, 166–176. 10.1002/jcp.20220. [DOI] [PubMed] [Google Scholar]
Associated Data
This section collects any data citations, data availability statements, or supplementary materials included in this article.


