

Summary
Natural killer (NK) cells are cytotoxic type-1 innate lymphoid cells (ILCs) that defend against viruses and mediate anti-tumor responses, yet mechanisms controlling their development and function remain incompletely understood. We hypothesized that the abundantly expressed microRNA-142 is a critical regulator of type-1 ILC biology. Interleukin (IL)-15 signaling induced miR-142 expression, while global and ILC-specific miR-142-deficient mice exhibited a cell-intrinsic loss of NK cells. Death of NK cells resulted from diminished IL-15-receptor signaling within miR-142-deficient mice, likely via reduced suppressor of cytokine signaling-1 (Socs1) regulation by miR-142-5p. ILCs persisting in Mir142−/− mice demonstrated increased expression of the miR-142-3p-target αV integrin, which supported their survival. Global miR-142-deficient mice exhibited an expansion of ILC1-like cells concurrent with increased transforming growth factor-β (TGF-β) signaling. Further, miR-142-deficient mice had reduced NK cell-dependent function and increased susceptibility to MCMV infection. Thus, miR-142 critically integrates environmental cues for proper type-1 ILC homeostasis and defense against viral infection.
Keywords: NK cells, innate lymphoid cells, ILC1-like cells, microRNA-142, IL-15, integrin, tissue resident, cytokine receptors, murine cytomegalovirus
Graphical Abstract
eTOC
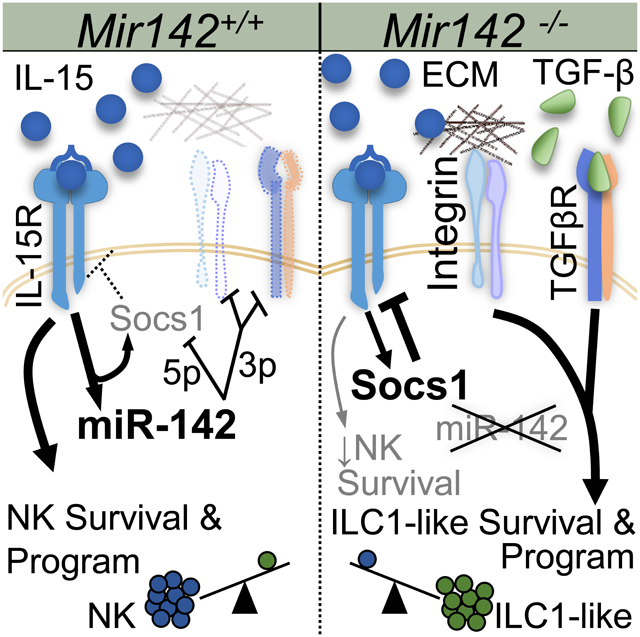
IL-15 and TGF-β support the homeostasis and molecular programs of distinct innate lymphoid cell (ILC) types. Berrien-Elliott and colleagues identify that microRNA-142 is required for IL-15 receptor signaling and NK cell survival, while loss of microRNA-142 results in distinct TGF-β– and/or integrin-supported type-1 ILCs.
Introduction
Type-1 innate lymphoid cells (ILCs) include natural killer (NK) cells, ILC1s, and ILC-1-like cells, which have distinct and overlapping properties. NK cells are important for controlling viral infections and eliminating malignant cells (Vivier et al., 2008). To protect the host, NK cells both release cytokines (e.g. IFN-γ) and kill target cells (Lanier, 2008). Like NK cells, ILC1s produce interferon-γ (IFN-γ) in response to cytokine receptor signals but localize to different sites in vivo and are poorly cytotoxic. NK cells are found throughout lymphoid organs and tissues, whereas ILC1 cells are found primarily in non-lymphoid tissues (Diefenbach et al., 2014). ILC1-like cells have been described in the salivary gland with a discrete phenotype and transcriptional signature (Cortez et al., 2014, 2016, 2017). Although the functions of ILC1 and ILC1-like cells are incompletely understood, evidence suggests they are important for limiting T cell-mediated tissue damage and potentially eliminating virally-infected cells (Cortez et al., 2016; Schuster et al., 2014; Weizman et al., 2017). Other tissue-resident, non-cytotoxic ILCs (ILC 2 and 3) are classified based on the types of cytokines produced and transcription factors required for their development and survival (Diefenbach et al., 2014).
Although the common lymphoid progenitor (CLP) gives rise to T, B, NK and ILCs, NK cells and ILCs are distinct from adaptive T and B cells in both development and function (Yokoyama et al., 2004). NK cell development and education progress in the bone marrow (BM) and secondary lymphoid organs and result in the generation of functionally-competent effector cells (Orr and Lanier, 2010). Recent studies support that ILC1s develop from a precursor down-stream of the CLP and have a transcriptional profile distinct from NK cells (Daussy et al., 2014). During development, both restricted NK cell precursors and type-1 ILCs acquire the IL-2 and -15Rβ chain (CD122), enabling them to respond to the cytokine IL-15, which supports their development, homeostasis (Klose et al., 2014; Marçais et al., 2013), and function (Fehniger et al., 2007). In addition, ILC1 and ILC1-like phenotypes and effector functions may depend on factors within the tissue microenvironment where they reside, especially TGF-β. TGF-β has been shown to drive the generation of a unique subset of ILC1-like cells normally present in the salivary glands (Cortez et al., 2014, 2016, 2017) and can convert NK cells into ILC1-like cells within the tumor microenvironment (Gao et al., 2017). Despite advances in NK cell and ILC biology, the molecular mechanisms controlling their development and homeostasis remain incompletely understood. In particular, while transcriptional regulators of type-1 ILC development have been defined, many post-transcriptional facets of their molecular programs remain unclear (Leong et al., 2016).
MicroRNAs (miRNAs) are small non-coding RNAs that regulate protein production, classically via binding to specific sites in the 3’ untranslated region (UTR) of target mRNAs, thereby preventing their translation or promoting their degradation (Lewis et al., 2005). A large number of individual miRNAs are expressed by NK cells; however, ~50 sequences comprise the majority of mature miRNA sequence content (Fehniger et al., 2010). Furthermore, several miRNAs or miRNA families regulate various aspects of NK cell and ILC biology (Leong et al., 2016; Singh et al., 2017). The conserved mir142 gene encodes two highly-expressed mature miRNAs, 142-3p and 5p, that are processed from the same precursor yet have different mRNA targets. A role for miR-142-3p/5p in regulating hematopoietic cells has been reported using global Mir142−/− mouse models, and is variable depending on the cells examined. Megakaryocytes, mast cells, dendritic cells, and erythrocytes require miR-142 for their development and function and previous reports have demonstrated a reduction in peripheral T cells and altered B cell development in miR-142-deficient mice (Chapnik et al., 2014; Kramer et al., 2015; Mildner et al., 2013; Rivkin et al., 2017; Yamada et al., 2014). miR-142-3p/5p have been also shown to be important for mature T cell effector responses and proliferation (Sun et al., 2015). However, the role of miR-142-3p/5p in type-1 ILC development and function has not been previously reported. Since miR-142-3p and −5p were highly expressed in NK cells, we hypothesized that these miRNAs coordinately regulate type-1 ILC biology. To test this, both global Mir142−/− and ILC-specific mouse models were examined, which revealed a profound impact of miR-142-deficiency on normal type-1 ILC development and homeostasis.
Results
mir-142 deficiency reduces peripheral type-1 ILC cell numbers
To define the importance of miR-142 in the development and persistence of CD45+CD3− NK1.1+NKp46+ type-1 ILCs that include NK cells, ILC1s, and ILC1-like cells, Mir142−/− mice were examined. NK1.1+NKp46+ cell numbers were significantly reduced in the blood, spleen (SP), liver (LV), and lymph nodes (LN) of Mir142−/− mice, compared to control (Mir142+/+) mice. In contrast, the total BM NK1.1+ cell number was not altered (Fig. 1 A-B, Fig. S1). The reduction of type-1 ILCs in the periphery was unlikely to result from a block in maturation, because miR-142-3p and −5p mature miRNA sequences were expressed throughout NK cell maturation (Fig. S2), and the relative frequencies of maturation stage II-IV NK1.1+ cells were unchanged in Mir142−/− mice (Fig. S1).
Figure 1. miR-142 deficiency reduces peripheral type-1 ILC numbers and alters trafficking.

BM, SP, and blood (BL) of Mir142+/+ (control, open green) and Mir142−/− (filled blue) were harvested and assessed for type-1 ILCs (CD45+CD3−NK1.1+NKp46+). (A) Representative flow plot of NK1.1+ NKp46+ cells (gated on CD3−) from the SP and BM. (B) Summary data showing the total NK1.1+ NKp46+ cells, see Fig. S1 (C-D) Schema of the BM chimera assay. (D) Summary of 2 independent experiments with >8 mice per group. (E) Non-competitive BM chimera experiment where control or Mir142−/− BM were transferred into congenic, irradiated recipients. Summary data showing percent CD45.2+CD3−NK1.1+NKp46+ cells from 3 independent experiments with 6 mice per group. (F) Summary data showing the NK cell precursor population numbers: pre-NK precursor (pre-NKp) and restricted NK precursor (rNKp). Data are from >3 independent experiments with >12 mice per group. Data were compared using Student’s T test or Mann-Whitney test. (G) Experimental schema for trafficking experiments. Briefly, control and miR142−/− BM cells were differently labeled with cell trace violet and cell trace yellow. The cells were mixed, injected iv. into WT recipients, and tissues examined for the presence of labeled NK1.1+NKp46+ cells. Flow plots of pre-infusion NK1.1+ cells present at 1:1 ratio. (H) Representative flow cytometry showing NK1.1+ cells. (I) Summary data from (H) showing the ratio of control and miR142−/− NK1.1+ cells. N=10 mice from 2 independent experiments. Significance was determined by Wilcoxon signed rank test against the theoretical value of one (no trafficking alteration, dashed line). Please also see Figure S3.
To establish a cell-intrinsic requirement of miR-142 for normal NK1.1+ cell numbers, mixed BM chimera experiments were performed. Congenic BM cells (CD45.2+ Mir142−/− and CD45.1 Mir142+/+ WT) were transferred into irradiated WT CD45.1+CD45.2+ recipients at a 4:1 or 1:1 ratio and NK1.1+ cell chimerism was assessed in the BM and spleen after 6-12 weeks (Fig. 1C-D). As a control, WT CD45.2+ and WT CD45.1+ BM were transferred into irradiated recipients at the same ratios. If NK1.1+ cells require miR-142 in a cell-intrinsic manner, different NK1.1+ cell frequencies were expected between mice that received WT:WT and Mir142−/−:WT BM. Marked reductions in the frequency of NK1.1+ cells derived from the Mir142−/− BM donor were observed at both ratios, compared to the Mir142+/+ donors, in the BM and spleen of recipient mice (Fig. 1D). Congenic mice reconstituted with Mir142−/− BM in non-competitive transplantation demonstrate a similar reduction in NK1.1+ cells developing from the transferred Mir142−/− BM compared to controls (Fig. 1E). While BM pre-NK cell precursors (pre-NKP, Lin− CD27+CD244+CD122−CD127+FLT3−) do not differ in total numbers between Mir142−/− and control mice, restricted NK precursors (rNKp, Lin−CD27+CD244+CD122+CD127+FLT3−), which depend on IL-15, are significantly reduced (Fig. 1F) (Fathman et al., 2011). CLPs are confirmed as being unaltered in Mir142−/− BM compared to controls (Fig. S3) (Sun et al., 2015). Collectively, these data indicate that miR-142 is required in a cell-intrinsic manner for the homeostasis of peripheral NK1.1+ cells, and the maintenance of the rNKp in the BM.
mir-142 deficiency alters type-1 ILC trafficking in vivo
Altered trafficking from the BM could contribute to the pattern of type-1 ILCs deficiency observed in Mir142−/− mice. In order to investigate this, whole BM cells containing equivalent numbers of NK1.1+ cells from control and Mir142−/− mice were differentially labeled, mixed at a 1:1 ratio, and injected into recipient mice (Fig. 1G). After 16 hours, the spleen, BM, liver, blood, lung, LN and salivary gland (SG) were assessed for the ratio of transferred control:Mir142−/− NK1.1+NKp46+ cells (Fig. 1H-I). Trafficking defects in Mir142−/− BM NK1.1+ cells to the spleen, BM and LN of recipient mice were observed, while preferential trafficking of Mir142−/− BM NK1.1+ cells to the liver and lung of recipient mice was evident (Fig. 1H-I). Transferred NK1.1+NKp46+ cells (both WT and Mir142−/−) were not detected in the SG. Blood NK1.1+ cell frequency was similar between Mir142−/− and control cells after mixed BM adoptive transfer. These data indicate that the Mir142−/− type-1 ILCs preferentially trafficked to non-lymphoid tissues and led to the hypothesis that NK1.1+ cells that persist in Mir142−/− mice have tissue-resident properties.
Mir142−/− mice are deficient in NK cells but accumulate ILC1-like cells
Type-1 ILCs may be categorized based on expression of CD49a (integrin α1) and CD49b (integrin α2) as NK cells (CD49a-CD49b+), tissue-resident ILC1s (CD49a+CD49b−), and SG ILC1-like cells (CD49a+CD49b+) (Cortez et al., 2016; Gasteiger et al., 2015; Sojka et al., 2014). To better define the type-1 ILC subsets impacted within Mir142−/− mice, CD3−NK1.1+NKp46+ cells were examined for CD49a and CD49b expression in lymphoid and non-lymphoid tissues (Fig. 2A-C). The majority of type-1 ILCs in the lymphoid tissues of Mir142−/− mice expressed both CD49a and CD49b, consistent with ILC1-like cells (Fig. 2A-B). This analysis also revealed marked reductions in NK cells in the BM, spleen, SG (all 10% of controls) and liver (20% of controls) of Mir142−/− mice compared to controls (Fig. 2B). In contrast, Mir142−/− mice have expansions of ILC1-like cells in BM (where they matched NK cell numbers within control mice), spleen, and liver (Fig. 2A-B). Mir142−/− mice had reduced ILC1-like cells in the SG where they normally predominate in WT mice (Fig. 2A-B). ILC1 numbers were not substantially altered by miR-142-deficiency in the liver where they normally reside. However, ILC1s were significantly reduced in the SG in Mir142−/− mice compared to controls (Fig. 2B). Finally, mature miR-142-3p and −5p sequences were expressed throughout the type-1 ILC compartment in both mice and humans (Fig. S2) (Collins et al., 2019). Thus, in Mir142−/− mice a complex and tissue-specific impact on type-1 ILCs is evident.
Figure 2. miR-142-deficient mice display altered, tissue-specific type-1 ILC compartment.

The CD3−NK1.1+NKp46+ compartment of Mir142+/+ (open green) and Mir142−/− (filled blue) mice was assessed for CD49a and CD49b by flow cytometry. (A) Representative flow plots of CD3−NK 1.1 +NKp46+ cells. (B) Total number of NK cells (NK, CD49a−CD49b+), ILC1-like (CD49a+CD49b+), and ILC1s (CD49a+CD49b−) within the indicated tissues. Summary from >3 independent experiments with > 10 mice per group. (C) Total numbers of NK, ILC1-like, and ILC1 cells within control (Ncr1-cre+ Mir142+/+) and ILC-specific miR-142-deficient (Ncr1-cre+ Mir142f/f) mice, cells gated on CD3−NK1.1+NKp46+ YFP+. (D) Experimental Schema. BM from control and Ncr1-cre+ Mir142f/f mice were transferred into irradiated recipients and spleens assessed 6 weeks later. (E) Summary data showing the percent of ILC1-like cells from CD3-NK1.1+NKp46+ CD45.1+ (WT) or YFP+ (Mir142f/f) within the indicated recipient mice. Data from 2-3 independent experiments, N=7-10 mice, compared using T-test or Mann-Whitney corrected for multiple comparisons, when appropriate. See also Figure S2.
To confirm whether Mir142−/− type-1 ILCs within lymphoid tissues exhibited characteristics of ILC1-like cells, additional markers were examined. CD43 is normally reduced on SG ILC1-like cells (Cortez et al., 2014), and was also decreased on Mir142−/− NK1.1+NKp46+ cells (Fig. 3A-B). CD73 and TIGIT were increased on NK1.1+NKp46+ cells from Mir142−/− mice compared to controls, also consistent with an SG ILC1-like phenotype (Fig. 3C). Finally, we examined Nfil3, T-bet, and Eomes, transcription factors important for type-1 ILC differentiation. While Nfil3 and T-bet were similar between the type-1 ILC subsets in the spleen of Mir142−/− and control mice, ILC1-like cells from Mir142−/− mice also expressed Eomes similarly to control NK cells (Fig. 3D). Thus, while many cell surface marker alterations are shared between Mir142−/− ILCs and ILC1-like cells, Eomes expression is more similar to NK cells.
Figure 3. miR-142-deficient type-1 ILCs display ILC1-like phenotype in lymphoid tissues.

(A) Representative histograms depict CD43 expression on NK1.1+NKp46+ cells from Mir142−/− (blue) mice compared to controls (green). Gray filled histograms represent CD43− lymphocytes. (B) Summary from (A). (C) Summary CD73 and TIGIT median expression on NK1.1+NKp46+ cells. (D) Transcription factor median expression on Mir142−/− and control NK1.1+NKp46+ cells. Data are from 2-4 independent experiments with N=5-10 mice per group. Data were compared using Student’s T or Mann Whitney tests.
Mice with ILC-specific deletion of miR-142 are deficient in NK cells
To better define the impact of intrinsic miR-142 deficiency on type-1 ILCs, an ILC-specific miR-142 deficient mouse was generated by crossing mice with a Mir142-floxed (Mir142f/f) allele (Kramer et al., 2015) with Cre-recombinase under the Ncr1 (Nkp46)-promoter (Narni-Mancinelli et al., 2011). A reporter Lox-Stop-Lox flanked YFP allele genetically targeted into the Rosa26 locus was used to track Cre activity (Srinivas et al., 2001) (Ncr1-cre+ Mir142f/f) These mice revealed that miR142-3p/5p were critical for the development for NK, ILC1, and ILC1-like cells (Fig. 2C). However, the accumulation of ILC1-like cells observed in the global Mir142−/− was abrogated, with only a modest accumulation of ILC1-like cells observed in the BM. This suggested that ILC-extrinsic factors also amplified the ILC1-like accumulation in global Mir142−/− mice (Fig. 2C). To determine the extrinsic versus intrinsic contributions of miR-142-deficiency, we performed mixed BM chimera experiments (Fig. 2D-E), where WT (CD45.1+) and (Ncr1-cre+ Mir142f/f) BM were mixed at a 1:1 ratio and transferred into irradiated WT or Mir142−/− recipients. After 6 weeks, the splenic type-1 ILC compartment was assessed. WT cells developing in Mir142−/− mice displayed a greater frequency of ILC1-like cells compared to WT cells in control mice (Fig. 2E). Overall these data support the hypothesis that Mir142 is critical for orchestrating NK, ILC1-like, and ILC1 homeostasis. We further investigated ILC1-like cells from the global Mir142−/− mice to better understand the extrinsic mechanisms that contribute to their persistence.
TGF-β signaling and molecular program are increased in Mir142−/− type-1 ILC
TGF-β receptor signaling is involved in the development of ILC1-like cells in the SG (Cortez et al., 2016, 2017), and also resulted in CD49a expression on NK1.1+ cells within a tumor microenvironment (Gao et al., 2017). We hypothesized that TGF-β contributed to the ILC-1-like phenotype and performed gene expression analysis of sorted type-1 ILCs from Mir142−/− and WT control mice. Gene set enrichment analysis (GSEA) revealed that Mir142−/− NK1.1+ cells from the spleen and BM had significantly enriched genes associated with TGF-β receptor signaling (Fig. 4A). Next, the gene signatures of Mir142+/+, Mir142−/− and Smad4Δ/Δ NK1.1+ cells (Cortez et al., 2017) were compared. The ILC-1-like gene signature from Smad4Δ/Δ mice was evident within Mir142−/− NK1.1+ cells, including Il21r, Tnfsf10, Inpp4b, Itga1 up-regulation, and Sell and Mcam down-regulation, compared to controls (Fig. 4B). Murine Tgfbr1 3’UTR was confirmed as a direct biochemical target of miR-142-3p using luciferase reporter assays (Fig. 4C-D) (Lei et al., 2014). TGFBR1 was also increased on splenic NK1.1+ NKp46+ cells in Mir142−/− mice compared to controls (Fig. 4E). Finally, pSMAD-2 and/or −3 were increased in unstimulated and IL-15 and TGF-β-stimulated Mir142−/− NK1.1+ cells compared to controls (Fig. 4F-G). Consistent with the presence of residual splenic NK cells and minimal ILC1s or ILC1-like cells (Fig. 2C), an increase in TGFBR1 or pSMAD-2 and/or −3 signaling was not evident in splenic NK cells from mice with ILC-specific miR-142 deletion, compared to controls (Fig. S4). However, significantly increased ILC1-like cells in the Ncr1-cre+ Mir142f/f BM (Fig. 2C) and the increased ILC1-like cells developing from Ncr1-cre+ Mir142f/f BM in the WT environment (Fig. 2E), suggest a cell-intrinsic contribution of miR-142-3p to the ILC1-like phenotype. Collectively, these data suggest that miR-142 directly targeted Tgfbr1 in vivo, which resulted in enhanced TGF-β receptor signaling, and a type-1 ILC molecular program overlapping with ILC1-like cells. When contrasted to the ILC-specific miR-142-deficient phenotype, these data indicate that a cell-extrinsic mechanism contributes to the ILC1-like phenotype of type-1 ILCs observed in global Mir142−/− mice.
Figure 4. TGF-β signaling is increased in Mir142−/− type-1 ILCs.

(A-B) CD3−NK1.1+NKp46+ cells were flow-sorted from Mir142+/+ (WT) or Mir142−/− (KO) BM or SP and microarray performed. (A) GSEA of the TGF-β Hallmark Signaling Pathway gene set in Mir142−/− versus WT from SP and BM. NES, Normalized enrichment score. (B) Heat map of differentially regulated genes between Mir142+/+, Smad4Δ/Δ, and Mir142−/− NK1.1+ cells. Genes associated with the ILC1-like signature (black), miR-142 targets (blue), and NK cell development and effector functions (green) are indicated. Data are from 3 biological replicates. (C) Predicted miR-142-3p binding site in the 3’UTR of Tgfbr1. (D) Luciferase reporter assay for miR-142 overexpression (OE) without the Tgfbr1 3’UTR (empty), with Tgfbr1 3’ UTR (WT) or with Tgfbr1-mutated at the miR-142-3p binding site in the 3’ UTR (Δ). Data summarize 3 independent experiments and were compared using an ANOVA. (E) Summary TGFBR1 expression on type-1 ILCs from SP of indicated mice (relative expression: median minus FMO); data from > 3 independent experiments were compared with T test (n=6-8 mice per group). (F-G) SP cells were stimulated with 10 ng/mL IL-15 plus 10 ng/mL TGF-β1 or left unstimulated (0 minutes) and assessed for phosphorylated (p) SMAD-2 and/or −3. (F) Representative flow plot showing pSMAD-2 and/or −3 in unstimulated (0m, top) or stimulated (60m, bottom) CD3−NK1.1+ cells. (G) Summary from (F). Data are from 2 independent experiments with 6-7 mice per group. Significance was determined by 2-Way ANOVA. Please also see Figure S4.
miR-142-deficient type-1 ILCs are hyporesponsive to IL-15 signaling
Since IL-15 is a central regulator of type-1 ILC homeostasis, the impact of IL-15 signaling on miR-142-3p/5p expression within NK1.1+ cells was examined. Splenic NK1.1+ cells from WT mice stimulated with IL-15 demonstrated a significant increase in miR-142-3p and −5p over time (Fig. 5A). These data suggested that elimination of miR-142 may impact IL-15 receptor (IL-15R) signaling feedback mechanisms, which could then alter IL-15-induced survival or proliferation. Baseline proliferation and expression of the anti-apoptotic molecule Bcl-2 were similar between controls and persisting Mir142−/− NK1.1+ cells (Fig. S5), suggesting that these were not mechanisms that contributed to the phenotype. To assess survival, control or Mir142−/− splenocytes were incubated for 48 hours with 1 or 10 ng/mL of IL-15 and NK1.1+NKp46+ cell viability was measured (Fig. 5B). Increased NK1.1+ cell death of Mir142−/− spleens compared to controls indicated that Mir142−/− NK1.1+ cells had a reduced survival capacity when supported by IL-15 ex vivo. Thus, Mir142−/− NK1.1+ cells may have altered IL-15 signaling, a critical cytokine for type-1 ILC survival and homeostasis (Cortez et al., 2014; Klose et al., 2014; Ma et al., 2006; Marçais et al., 2013). The expression of the key IL-15R signaling components within Mir142f/f and control NK1.1+ cells were examined and no differences in the abundance of IL-2 and −15Rβ or γc mRNA were detected (data not shown). However, IL-2 and −15Rβ (CD122) protein expression had a modest but significant reduction in MFI on Mir142−/− and Ncr1-cre+Mir142f/f BM and splenic NK1.1+ cells, compared to controls. There was also a modest decrease in γc (CD132) MFI on Mir142−/− NK1.1+ cells in the spleen (Fig. 5C-D, Fig. S5C-D). As a control, NK1.1 MFI was unaltered between Mir142−/− and control NK1.1+ cells from the BM or spleen (Fig. S5). A primary IL-15R signal for NK cell survival is transduced via the JAK and STAT pathway, leading to STAT5 phosphorylation (Marçais et al., 2013). mRNA expression of proximal IL-15R JAK and STAT signaling molecules was unaltered in Mir142−/− mice (Fig. S6). Mir142−/− or Ncr1-cre+ Mir142f/f splenocytes were stimulated with IL-15 and STAT5 (Y694) phosphorylation assessed (Fig. 5E-F). There was a sustained, significant reduction in pSTAT5 MFI in NK1.1+ cells following IL-15 stimulation from the Mir142−/− mice, compared to controls (Fig. 5F). The Ncr1-cre+ Mir142f/f type-1 ILCs also had significantly diminished STAT5 phosphorylation in response to IL-15. Further, since Mir142−/− ILCs signaled excessively through the TGF-βR, we hypothesized that TGF-β negatively impacts NK cell survival. Consistent with this, WT NK1.1+ cell death increased when TGF-β was present in the culture system (Fig. S5). Together, these data support the idea that Mir142−/− NK1.1+ cells fail to sufficiently signal through the IL-15R, leading to reduced survival in vivo. Mir142−/−, Ncr1-cre+ Mir142f/f and control splenocytes were also stimulated with IL-12 for 15 minutes and STAT4 phosphorylation was assessed (Fig. 5G-H). We detected reduced pSTAT4 (Y693) in response to IL-12 in both global and ILC-specific miR-142-deficient NK cells (Fig. 5G-H). These data suggested that a general mechanism led to broad reduction in JAK and STAT signaling in the absence of miR-142.
Figure 5. miR-142-deficient type-1 ILCs are hyporesponsive to IL-15 signaling.

(A) WT CD3−NK1.1+ cells were sorted from the SP and incubated with 10 ng/mL IL-15. Immediately after sorting (baseline) and after stimulation, RNA was extracted from the cells and miR-142-3p/5p expression were assessed by qPCR. Summary data (normalized to baseline) from 2 independent experiments with 3 biological replicates. (B) Splenocytes were incubated with IL-15 for 48 hours in vitro. Summary data depict the percent of type-1 ILCs (CD45+CD3−NK1.1+) positive for 7-AAD and/or Annexin V. (C) Representative histograms of surface expression of CD122 (IL-2 and −15Rβ) on Mir142+/+ and Mir142−/− CD45+CD3−NK1.1+ cells (Global, Top) and Ncr1-cre+ Mir142+/+ and Ncr1-cre+ Mir142f/f CD45+CD3−NK1.1+YFP+ cells (Ncr1-cre+, Bottom). Gray filled histograms depict CD122-negative lymphocytes. (D) Summary data from (C) showing the MFI. (E) Representative histograms showing intracellular pSTAT-5 (Y694) staining in global (left) and Ncrl-cre+ (right) NK1.1+ and/or YFP+ cells after 15-minute stimulation with IL-15. (F) Summary data from (E). (G) Representative histograms showing pSTAT-4 in global (Top) and Ncr1-cre+ (Bottom) CD3− NK1.1+ and/or YFP+ cells after stimulation with IL-12 for 15 minutes. (H) Summary data from (G). (I) Predicted miR-142-5p binding site in Socs1 3’ UTR (top). A luciferase reporter assay for Socs1 3’UTR. Data are compared using an ANOVA. Data summarize 3 independent experiments. (J-K) CD3−NK1.1+ SP cells from control and Mir142−/− SP were sorted and assessed for Socs1 and β-actin by western blot. (J) Representative blot from 3 independent experiments showing Socs1 (top) and β-Actin (bottom). (K) Summary data depicting Socs1 band intensity (normalized using β-actin). Comparisons were made using RM-ANOVA (A, I), Student’s T test/Mann-Whitney (B-D, H), RM-ANOVA (F), paired T test (K). Please also see Figure S5.
Socs1 is a direct target of miR-142-5p in type-1 ILCs
Although IL-15Rβ protein expression was mildly reduced on miR-142-deficient NK1.1+ cells compared to controls, this modest change in surface density was unlikely to explain the lack of STAT5 phosphorylation in response to IL-15. Consistent with findings in human macrophages (Su et al., 2015), the murine Socs1 3’UTR was a direct target of miR-142-5p (Fig. 5I). Increased Socs1 expression would be expected to result in abrogated IL-15-induced JAK and STAT signaling and consequently cell death. Flow-sorted NK1.1+ cells from the spleen of Mir142−/− mice expressed increased Socs1 protein immediately ex vivo (Fig. 5J-K). The modest extent of Socs1 protein increase was expected, since type-1 ILC with increased Socs1 protein would diminish IL-15 survival signals and die, as evidenced by in vivo loss of this compartment (Figs. 1-2). Collectively, these data support the hypothesis that miR-142-5p maintains physiologic IL-15 responsiveness (and hence survival) in peripheral NK1.1+ cells via targeting Socs1.
Integrin αV promotes type-1 ILC cell survival in miR-142-deficient mice
Since all type-1 ILCs depend on IL-15 for survival in WT mice (Diefenbach et al., 2014), our findings raised an important question: how do type-1 ILCs persist in Mir142−/− mice when IL-15-induced pSTAT5 was compromised? Il15−/− mice have residual NK1.1+ cells that persist in the BM and were thought to be immature (Yoshizawa et al., 2011). Consistent with previous reports, Il15−/− mice had a markedly reduced type-1 ILCs (Fig. S3). However, a reproducible CD3− NK1.1+NKp46+CD49b+ cell population was detected within the spleen of Il15−/− mice. These residual type-1 ILCs expressed significantly increased integrin αVβ3 and CD49a (Fig. 6A, Fig. S3). Increased integrin αV was also detected in the BM, spleen, and liver of type-1 ILCs from Mir142−/− and Ncr1-cre+ Mir142f/f mice compared to controls (Fig. 6B-C). Moreover, bioinformatic analyses revealed that the 3’ UTR of Itgav, the gene that encodes integrin αV (CD51) protein, was a predicted target of miR-142-3p. The Itgav 3’ UTR was directly targeted by miR-142-3p (Fig. 6D). We hypothesized that signaling through the vitronectin and fibronectin receptor (αVβ3) may promote NK cell survival when IL-15 signaling is diminished. To test this, Mir142−/− mice were treated with an integrin αV antagonist (cilengetide) for two weeks, and then the type-1 ILC compartment of the spleen was assessed (Reardon et al., 2008). A significant decrease in type-1 ILCs was observed in the treated Mir142−/− mice compared to control-treated Mir142−/− mice (Fig. 6E). Collectively, these data suggest that integrin αV expression is regulated by miR-142-3p and promotes type-1 ILC survival in the absence of normal IL-15R signaling, providing a mechanism for the survival of persisting type-1 ILCs in miR-142-deficient mice.
Figure 6. Integrin aV promotes type-1 ILC survival in miR-142-deficient mice.

(A) Summary data of integrin αVβ3 and CD49a on CD3−NK1.1+NKp46+CD49b+ cells from the SP of Il15−/− or control mice. (B) Representative histogram showing integrin αV expression in the indicated tissues of Global and Ncr1-cre+ mice. (C) Summary showing percent integrin αV+ NK1.1+NKp46+ cells in the indicated tissues from Mir142−/− (left), Ncr1-cre+ Mir142f/f (YFP+, right), and controls. (D) Predicted miR-142-3p binding site in 3’UTR of Itgav (top). Luciferase reporter assay for Itgav 3’UTR (bottom). Data summarize 3 independent experiments and were compared using an ANOVA. (E) Mir142−/− mice were treated for 2 weeks with an αV inhibitor or vehicle. Summary data of total type-1 ILCs in the SP from 4 independent experiments, n=11 mice per group. (C, E) Data were compared using Student’s T test. See also Figure S3.
miR-142-deficient type-1 ILC display altered effector responses in vitro and in vivo
We next assessed the functional impact of miR-142-deficiency on NK1.1+ cells in vitro and in vivo. Although ILC1s and ILC1-like cells are not considered highly cytotoxic, they can degranulate and produce IFN-γ in response to cytokine stimulation or activating receptor ligation (Cortez et al., 2016; Sojka et al., 2014). Splenocytes from Mir142−/−, Ncr1-cre+ Mir142f/f and control mice were stimulated with IL-12 plus IL-15 and NK1.1+ cells were assessed for IFN-γ production (Figure 7A-D). Compared to controls, Mir142−/− type-1 ILCs exhibited a marked reduction in IFN-γ production in response to cytokine co-stimulation (Fig. 7A-B). While ILC1- like cells have been shown to produce less IFN-γ than NK cells, the reduction was modest (~10%) (Cortez et al., 2017). ILC1-like cells from the SG in control mice produced markedly reduced amounts of IFN-γ in response to cytokine stimulation, similar to Mir142−/− NK1.1+ splenocytes (Fig. S7). In addition, NK1.1+ cells within Mir142−/− mice exhibited reduced IFN-γ responses and degranulation to activating receptor ligation and failed to effectively kill TRAIL-sensitive target cells in a standard flow-based killing assay (Fig. S7). These data suggest that type-1 ILCs that persist in the setting of miR-142-deficiency fail to mediate the normal pattern of type-1 ILC functions.
Figure 7. miR-142-deficient type-1 ILCs display altered effector responses in vitro and in vivo.

(A-B) Splenocytes from Mir142+/+ and Mir142−/− mice were stimulated for 6 hours. (A) Representative flow plots showing intracellular IFN-γ staining in CD45+CD3−NK1.1+ cells. (B) Summary data from (A). (C-D) Splenocytes were isolated from Ncr1-cre+ Mir142+/+ (control, open green bars) and Ncr1-cre+ Mir142f/f (filled blue bars) mice and stimulated for 6 hours. (C) Representative flow plots showing intracellular IFN-γ staining in CD45+CD3−NK1.1+YFP+ cells. (D) Summary data from (C). (E-F) 36 hours after MCMV infection, SP NK1.1+ cells were assessed immediately for intracellular IFN-γ protein by flow cytometry. (E) Representative flow plots showing IFN-γ in CD45+CD3−NK1.1+ cells. (F) Summary from (E). (G) Viral copy numbers in the SP of MCMV-naïve control, Mir142+/+ (WT) and Mir142−/− (KO) MCMV-infected mice, were assessed using qPCR 4 days after infection (units: IE1×1000/B-Actin). (H) Mice were infected with 1e5 PFU MCMV and survival assessed. Pooled data from 2-3 independent experiments with >4 mice per group per experiment. Comparisons were made using Student’s T test or Mann-Whitney test, and log-rank (H). See also Figure S7.
Mir142−/− NK1.1+ cells have impaired responses to MCMV infection in vivo
Since Mir142−/− ILC1-like cells are hypofunctional in vitro, we hypothesized that Mir142−/− mice have a compromised response to viral infection in vivo. Consistent with this, type-1 ILCs from Mir142−/− mice exhibited reduced IFN-γ production following polyI:C injection (Fig. S7) and murine cytomegalovirus (MCMV) infection (Fig. 7E-F). Following MCMV infection, Mir142−/− mice had significantly increased viral loads in the spleen compared to control mice (Fig. 7G). This resulted in host susceptibility and death following a normally sub-lethal dose of MCMV (Fig. 7H). Overall, these data indicated that miR-142 is critical for normal type-1 ILC effector functions in vivo.
Discussion
Here we report that a single miRNA gene is essential for the cell-intrinsic development and homeostatic composition of the type-1 ILC compartment. miR-142 was expressed within developing and mature type-1 ILCs from WT mice and its transcription was induced by IL-15R signaling. Loss of miR-142 resulted in a marked reduction of type-1 ILCs that was evident in both global and ILC-specific genetic deletion models. One mechanism contributing to the type-1 ILC reduction was compromised IL-15R signaling and survival. This was likely due to release of the negative regulator of IL-15 signaling, Socs1, from normal miR-142-5p regulation. In global Mir142−/− mice, while NK cells were nearly absent, an expansion of ILC1-like cells in lymphoid tissues was evident. By contrasting global and ILC-specific miR-142 deletion, a cell-extrinsic mechanism was identified that contributed to this aberrant ILC1-like accumulation in lymphoid tissues. Tgfbr1 was found to be targeted by miR-142-3p, and TGF-β signaling was increased in Mir142−/− type-1 ILCs, which promoted the ILC1-like phenotype observed in these mice. While IL-15 signaling was markedly diminished, some type-1 ILCs survived in miR-142-deficient mice. Integrin αV was expressed on persisting type-1 ILCs, and αV antagonists resulted in loss of these cells in vivo, identifying a previously unreported role for integrins to compensate for reduced IL-15R survival signals in type-1 ILCs. These data support the idea that type-1 ILC survival and composition is influenced by both an intrinsic molecular program and the tissue environment, including the cytokine milieu and extracellular matrix (ECM) composition. Collectively, the type-1 ILC alterations in miR-142-deficient mice, which included a profound loss of normal NK cell effector functions, resulted in loss of host protection and survival following viral infection. Thus, miR-142 is vital for normal type-1 ILC homeostasis and function.
This study revealed both cell-intrinsic and cell-extrinsic effects of miR-142 deficiency on type-1 ILCs. Several mechanisms contribute to the change from NK cells to ILC1-like cells in Mir142−/− mice, with ILC-specific miR-142 deficiency clarifying that the loss of NK cells is intrinsic, while the accumulation of ILC-1-like cells was promoted by extrinsic factors. One mechanism was the increased responsiveness to TGF-β by type-1 ILCs. Increased TGF-β signaling has been shown to be detrimental to NK cells, inducing cell death and reducing mTOR signaling (Viel et al., 2016). Consistent with this, miR-142-deficiency nearly eliminated the NK cells normally present in lymphoid tissues. Also in line with enhanced TGF-β signaling in Mir142−/− mice, normally tissue-resident ILC1-like cells expanded in the lymphoid tissues and displayed a TGF-β molecular signature. Loss of miR-142-3p targeting of Tgfbrl in Mir142−/− mice was associated with increased TGFBR1 expression and TGF-β signaling in expanded ILC1-like cells. Since the ILC1-like accumulation was restricted to the BM of ILC-specific miR-142-deleted mice, and transfer of WT BM into Mir142−/− resulted in increased ILC1-like cells, Mir142−/− mice have an ILC-extrinsic increase in TGF-β availability in vivo. Studies report that TGF-β is critical for promoting the ILC1-like phenotype in the SG and within the tumor microenvironment, where NK cells were converted to ILC1-like cells (Cortez et al., 2017; Gao et al., 2017). It will be of interest to investigate the role of miR-142 in these models of ILC1-like cell promotion in future studies.
Our results indicate that miR-142-5p normally supports NK cells by promoting IL-15-based homeostatic survival signals by directly targeting Socs1. Indeed, the persisting Mir142−/− NK1.1+ cells expressed increased Socs1 protein in vivo and miR-142-deficient type-1 ILCs displayed severely reduced STAT5 phosphorylation concomitant with alterations in this pathway. Observing normal ILC1 numbers in the liver and an accumulation of ILC1-like cells in the Mir142−/− mouse model was not predicted since all type-1 ILCs depend on IL-15 for survival in WT mice (Diefenbach et al., 2014). Ncr1-cre+ Mir142f/f mice, which also had deficient IL-15R signaling, did display reductions in the type-1 ILC compartment consistent with the requirement of these cells for IL-15. These differences suggest that there are IL-15-independent mechanisms that can support type-1 ILC survival, and integrin receptor signaling was identified as one mechanism. Mir142-deficient type-1 ILCs express integrin α1 and αV, similar to WT tissue-resident type-1 ILCs (but not NK cells). Integrins interacting with fibronectin (αVβ1) and vitronectin (αVβ3) have been reported to promote expression of the anti-apoptotic molecule BCL-2 (Matter and Ruoslahti, 2001; Zhang et al., 1995), similar to the IL-15R (Cooper et al., 2002). These integrin ligands are abundant in the ECM within the BM (Nilsson et al., 1998), where integrin αV+ type-1 ILCs may receive survival signals that compensate for the reduced IL-15R signaling in miR-142-deficient mice. Previous reports identified that type-1 ILCs in Il15−/− mice display an “immature” αV+ phenotype in the BM. An alternative explanation, supported by our analyses of II15−/− mice, is that αV integrin selectively supports the survival of type-1 ILCs when IL-15 signals were limited. Here, type-1 ILCs were reduced in number when integrin αV was inhibited in Mir142−/− mice in vivo, where IL-15 signaling is also diminished. Linking this concept to the TGF-β signal enhancement in Mir142−− mice, TGF-β is important for SG organogenesis and regulates ECM deposition, including collagens and fibronectin (Hall et al., 2010; Ignotz and Massague, 1986), as well as promoting the collagen receptor VLA-1 (CD49a or α1β1) on type-1 ILCs (Cortez et al., 2016). VLA-1 expressed by ILC1s and ILC1-like cells bind to collagen, which could play a role in promoting survival. Under homeostatic conditions in the LN, lymphocytes do not access collagen, which is ensheathed by fibroblastic reticular cells (Roozendaal et al., 2008). Consistent with a requirement for collagen binding, ILC1-like cells in Mir142−/− mice could not accumulate or survive in the LN microenvironment. This is also consistent with integrin expression and type–1 ILC phenotype of persisting NK1.1+ cells within Mir142−/− mice being promoted by factors within the tissue microenvironment (e.g. TGF-β) and encounters with vitronectin, fibronectin, and collagen in ECM. Such integrin signaling would be especially important for persistence in IL-15-low and TGF-β-rich microenvironments. Collectively, these findings indicate that integrin signaling provides an alternative pro-survival signal for type-1 ILCs, compensating for reduced cytokine survival signals, and warrants further investigation.
Previous studies have demonstrated that miRNAs are involved in NK cell maturation and effector functions (Bezman et al., 2011; Leong et al., 2016; Sullivan et al., 2015). miR-155 is modestly expressed in resting NK cells, but induced upon activation, and has previously been shown to regulate IFN-γ production and NK cell survival in mice, but only in the setting of activation or an immune response to infection. Mice lacking miR-155 have normal peripheral type-1 ILC numbers (Sullivan et al., 2013; Zawislak et al., 2013), but Mir155−/− NK cells failed to expand in response to MCMV infection, intriguingly due to Socs1 regulation (Lu et al., 2015; Zawislak et al., 2013). In contrast, Mir142−/− mice appear to have a marked alteration in the NK1.1+ cell compartment and function at baseline during normal homeostasis, consistent with the abundant expression of these miRNAs throughout NK cell development. Thus, from an evolutionary standpoint, Socs1 represents a key homeostatic feedback mechanism in type-1 ILCs, kept in check during normal homeostasis by miR-142, and by miR-155 only after robust activation. Studies in ILC2 revealed that the miR-17~92 family regulates Socs1 as well (Singh et al., 2017), suggesting a conserved requirement for miRNA regulation of this molecule within the ILC compartment. CIS, another suppressor of cytokine signaling family member, has been identified as an important negative regulator of IL-15 signaling in NK cells (Delconte et al., 2016). In a global deletion model, Cish−/− NK cells display enhanced survival. In that study, Socs1 was shown to be more efficient at preventing JAK1 signal transduction, compared to CIS, demonstrating how potent Socs1 may be at regulating IL-15R signaling (Delconte et al., 2016). Thus, multiple miRNA regulation mechanisms of cytokine receptor feedback appear to be an important aspect of maintaining type-1 ILCs during both homeostasis and response to infection.
In summary, studying type-1 ILCs within miR-142-deficient mice revealed a critical, non-redundant role for miR-142-3p/5p in regulating homeostatic NK cell, ILC1, and ILC1-like cell numbers, as well as responses to IL-15, other cytokines, and viral infection. Thus, miR-142 expression is required for the homeostasis and normal effector responses of type-1 ILCs.
STAR METHODS
CONTACT FOR REAGENTS AND RESOURCE SHARING
Further information and requests for resources and reagents should be directed to and will be fulfilled by the lead contact, Todd A. Fehniger (tfehnige@wustl.edu).
EXPERIMENTAL MODEL AND SUBJECTS DETAILS
Mice
The C57BL/6J Mir142−/− (Sun et al., 2015), Mir142f/f(Kramer et al., 2015), Ncr1-icre (Narni-Mancinelli et al., 2011), and IL-15-deficient (Kennedy et al., 2000) mice have been previously described and are crossed to the C57BL/6 background. C57BL/6J mice were wild-type controls (Jackson Laboratory), and CD45.1 and CD45.2 F1 mice were obtained from C57BL/6J × CD45.1 (Taconic Farms) crosses. All mice were bred and maintained in specific, pathogen-free housing, and all experiments were conducted in accordance with the guidelines of and approval by the Washington University Animal Studies Committee. Male and female mice aged 8-12 weeks were used in each experiment, mice were age- and sex-matched per experiment, and then randomly allocated into experimental groups. Data from all mice are reported, thus there are no exclusion criteria to report.
Cell lines
The 293T cells (gift from M. Sands, Washington University School of Medicine) were maintained in complete DMEM supplemented (10% FBS, 10mM HEPES, 1% NEAA, 1% sodium pyruvate, 1% L-glutamine, 1X penicillin and streptomycin) and 3T3 (ex vivo killing assays) were obtained from ATCC. Cells were grown at 37° in 5% CO2 in supplemented media, per ATCC instructions.
Virus
Viruses and injection of mice salivary gland stock of Smith strain MCMV (ATCC) was prepared using young BALB/c mice that were injected i.p. with 1×10⁶ PFU tissue-culture propagated MCMV, viral titer was determined using standard plaque assay in NIH3T12 fibroblasts (ATCC). Unless otherwise indicated, mice were injected with 1×10⁵ PFU.
METHOD DETAILS
Cell isolation
Mouse tissues were isolated from mice and processed as previously described (Cortez et al., 2016; Leong et al., 2015). For this study, the axillary, brachial, and inguinal LN were harvested, pooled and processed. Briefly, blood was obtained from cardiac puncture and placed into EDTA tubes. Blood was lysed using 1X ACK lysis buffer (2 minutes at room temperature) and washed in PBS. Spleens and lymph nodes were crushed through a 70μM filter and RBC lysed using 1X ACK lysis buffer and washed in PBS. Livers were homogenized and washed with PBS, lymphocytes were obtained using percoll gradient. Salivary glands were digested with collagenase for 45 minutes at 37 °, then crushed through a 70μM filter. Lymphocytes were obtained by percoll gradient. Bone marrow was obtained from the femur by flushing PBS through the bone with a 23G needle. RBCs were lysed with 1X ACK lysis buffer and washed with PBS. All lymphocytes were resuspended in RPMI supplemented with 10% FBS, filtered through mesh, and stored on ice as needed.
Antibodies
The following anti-mouse antibodies were used for flow cytometry analysis as previously described: CD3 (500A2), NK1.1 (PK136), CD45 (30-F11), CD11c (HL3), CD49a (Ha31/8), CD29 (Ha2/5), CD51 (RMV-7), CD49f (GoH3), B7 (M293), CD11a (2D7), Ly-49 C/I (5E6), Ly49 A (A1), Ly-49 D (4E5), Ly-6G/C (Gr1, RB6-8C5), Ly-76 (TER-119), CD132 (4G3), CD135 (FLT-3, A2F10.1), IFN-γ (XMG1.2), pSTAT4 pY693, pSTAT5 pY694, FcBlock (2.4G2), Annexin V, 7-AAD, CD49d (R1-2), CD18 (C71/16), CD61 (2C9.G2), pSMAD2/3 (O72-670), TIGIT (1G9) from BD Biosciences; CD107a (1D4B) from Beckman Coulter; anti-Rabbit IgG from Cell Signaling Technology; CD27 (LG.7F9) CD11b (M1/70), CD122 (TM-β1), CD49b (DX5), Ly49 G2 (eBio4D11), LY-49 H (3D10), NKG2A (B6, 16a11), NKG2D (CX5), Ki67 (SolA15), B220 (RA3-6B2), CD127 (A7R34), Ly6D (49-H4), CD73 (eBioTY/11.8) from Affymetrix/eBioscience.
Quantification of MCMV viral loads using real-time PCR
MCMV viral loads were determined by quantifying the copies of the IE1 gene using qRT-PCR (TaqMan) as previously described (Fogel et al., 2013). Tissue pieces (5 mm3) were minced and placed in Gentra Puregene Cell Lysis Buffer (Qiagen), and DNA was extracted following the manufacturer’s recommended protocol and diluted to 20–50ng/ml. MCMV immediate-early gene 1 (ie1)-specific primers and probe were used to determine viral copy number as described and normalized to β-actin (Actb). Reactions were run in duplicate on a 7500 Fast Real-Time PCR instrument (Applied Biosystems) with an absolute standard curve. The limit of reliable detection using the standard was 100 copies of MCMV, and all values below 100 were rounded up. Graphs represent ([copies MCMV ie1]/[copies Actb]) × 1,000. Statistics were performed on log-transformed data.
IFN-γ assays
IFN-γ stimulations were performed as previously described (Sullivan et al., 2012). Briefly, 1×10⁶ splenocytes were stimulated with recombinant IL-12 and IL-15 (10 ng/mL each; PreproTech) or anti-NK1.1 (plate-bound PK136, 5μg/mL) in complete RPMI for 6 hours in the presence of anti- CD107a. After 1 hour, golgiPlug and golgiStop (BD Biosciences) were added to each well and the cells incubated for an additional 5 hours. Mice were inoculated with 1×10⁵ plaque forming units (p.f.u.) of MCMV (Smith strain, salivary gland stock) ip. and spleens harvested 36 hours later and splenocytes assessed for intracellular IFN-γ. Splenic processing and surface staining were performed on ice, immediately after harvest. For intracellular staining, BD CytoFix/CytoPerm kit was used according to manufacturer’s instructions.
In vivo trafficking assay
Whole BM cells were isolated from mice, labeled with cell trace (CT) violet or CT Yellow per manufacturers’ protocol, mixed at a 1:1 ratio, and injected i.v. into the tail vein of recipient control mice. After 16 hours organs were harvested, enumerated, and assessed by flow cytometry for the relative abundance of labeled NK cells. In this assay, total BM cells were transferred due to limiting numbers of NK1.1+ cells in the BM and equal NK1.1+ cell number in control and Mir142−/− mice.
Ex vivo survival assay
To assess ex vivo viability, 1×10⁶ splenocytes were incubated with 1 or 10 ng/mL IL-15 in complete RPMI for 48 hours. In indicated assays 10 ng/mL rhTGF-β1 (Peprotech) was added, as well. Cells were surface stained and viability assessed by 7-Aminoactinomycin D incorporation (7-AAD; Sigma Aldrich) and Annexin V staining (BD biosciences, according to manufacturer’s instructions).
Cytokine Signaling Assays
To assess cytokine signaling, 1×10⁶ splenocytes were stimulated with IL-12 (10 ng/mL) for 15 minutes, or IL-15 (10 or 100 ng/mL) for 15, 30, and 60 minutes, or 10 ng/mL IL-15 plus 10 ng/mL TGF-β for 15, 30, and 60 minutes and immediately fixed in equal volume of pre-warmed 4% formaldehyde. After fixation for 10 minutes, cells were permeabilized with ice cold 100% methanol and incubated on ice for 30 minutes. Cells were surface stained 15 minutes prior to fixation (CD3 and NK1.1). Intracellular staining was performed overnight at 4°C with the indicated mAbs to detect phosphorylated STAT4, STAT5, or Smad-2 and/or −3.
miRNA 3’UTR reporter luciferase assays
Overexpression of miR-142 and luciferase sensor plasmids were performed as previously described (Fehniger et al., 2010; Sullivan et al., 2012). The wild-type Socs1, Tgfbr1, and the first 1Kb of the Itgav 3’UTR were cloned into the psiCheck2 vector (Promega). The miR142-3p and −5p sites were mutated as indicated using the QuikChange II Site-Directed mutagenesis Kit (Agilent Technologies) following manufacturer’s instructions. miR-142-3p/5p pre-miRNA +/− 200bp flanking genomic sequence was sub-cloned into the pMND overexpression vector (a gift from M. Sands) (Fehniger et al., 2010). All primer sequences used for cloning are available upon request. 293T cells were co-transfected with 400ng of each vector using Dharmafect Duo (Dharmacon). After 48 hours, the Dual-Glow Luciferase Assay (Promega) was performed according to manufacturer’s instructions on an LD400 luminescence detector (Beckman Coulter). miR142 overexpression was confirmed by flow cytometry for GFP expression.
In vivo integrin αV inhibitor assays
Cilengitide (Sigma) was administered for 2 weeks (500 μg Cilengitide ip. on days 1-4, 7-11, 13) (Du et al., 2016). Vehicle control mice received PBS (HyClone).
Flow cytometry and sorting
All flow cytometry data were collected on a Gallios flow cytometer (Beckman Coulter). Data were analyzed using FlowJo (Tree Star) software. Cell sorting was performed on BD FACS Aria II to >95% purity.
mRNA expression analysis by microarray
Mononuclear cells were harvested from Mir142+/+ or Mir142−/− spleen or BM and NK cells were sorted to >95% purity (NK1.1+CD3−). RNA was isolated using TRIzol (Invitrogen) according to manufacturer’s instructions. 50ng of total RNA was used to generate biotinylated cDNA, according to the standard NuGen WT-Ovation Pico RNA Amplification kit. Following fragmentation with NuGen Encore Biotin Module, 2.5 ug of cDNA were hybridized onto Mouse Gene 1.0 ST Arrays in the GeneChip Hybridization Oven 640 for 18 hr at 45°C. GeneChips were then washed and stained in the Affymetrix Fluidics Station 450, and were scanned using the Affymetrix GeneChip 7G 3000 Scanner. The scanned raw .CEL files were analyzed to export signal intensity values, using Affymetrix Expression Console software with Affymetrix Gene Expression workflow using default settings. Differently expressed genes were determined using an ANOVA and significance was determined using a P value with an FDR < 0.05 (Partek Genomics Suite 6.6). Assays were performed in triplicate.
Gene Set Enrichment Analysis (GSEA)
Microarray .CEL files from control and Mir142−/− spleen and bone marrow were used for this analysis. Raw data .CEL files were imported into GenePattern analysis software (Broad Institute publicly available GenePattern server) where background correction and normalization were performed with standard default settings. The .CEL files were combined into one .gct file in GenePattern, then imported into GSEA along with a matching phenotype label file (.cls). GSEA analysis was run with the following parameters: number of permutations = 1000, collapse dataset to gene symbols = true, permutation type = gene_set, chip platform = MoGene_1_0_st.chip, plot graphs for the top sets of each phenotype = 150 (default= 20), gene sets database = h.all.v6.0 symbols.gmt (all hallmarks, version 6), with a phenotype comparison of Mir142−/− versus control for SP and BM. Leading edge analysis was completed on the Hallmark GSEA output with TGF-beta signaling hallmark gene set.
Heat map generation
Gene sets were analyzed in Partek using the gene expression work flow. CEL. files from control and Mir142−/− spleen and bone marrow and the control and Smad4−/− gene set (GSE100247) were used for this analysis (Cortez et al., 2017). The ANOVA was completed with one comparison – wild-type and Mir142−/−. The gene list was generated with > or = +/− 2-fold changes, P-value with FDR = 0.05. There were 159 Genes on the final list. The list of miR-142 predicted targets was generated with TargetScan Mouse, Release 7.1. There were 307 identified targets for 142-3p and 866 for 142–5p, and 42 unique genes were identified as targets for both 3p and 5p. A master list of targets was created, duplicate genes were removed, and the resulting 1128 miR-142 targets were compared to the list of 159 differentially expressed genes that was generated by Partek analysis. Eleven miR-142 targets were found on the Partek analysis list, and 8 of those are annotated on the heat map.
Western blot
Splenic and BM NK cells were sorted and >250,000, cells snap frozen using LN2. Frozen pellets were then lysed on ice for 15 minutes using 1X RIPA buffer plus 1X Protease and phosphatase inhibitor cocktail (Cell Signaling). Lysates plus loading buffer (Cell Signaling) were boiled for 5 minutes and loaded into a Mini-PROTEAN TGX Precast 4-20% Gel (Bio-Rad). The gel was electrophoresed in 1X running buffer according to manufacturer’s instructions. All gels were run with Precision plus protein western standard ladder (Bio-Rad). The proteins were transferred to 0.45 μM nitrocellulose using Mini Protean transfer apparatus (Bio-Rad) according to manufacturer’s instructions. After transfer, the membrane was washed in TBS containing 0.1% Tween-20 (TBS-T) and blocked with TBS containing 5% FBS (Sigma) with agitation at room temperature for 1 hour. Blots were incubated with primary Socs1 (A156, Cell Signaling) or β-Actin (8H10D10, Cell signaling) antibodies overnight at 4°C with agitation. Blots were washed and incubated with anti-Rabbit or anti-Mouse HRP (Cell Signaling) for 60 minutes at room temperature. The blots were developed using the Super Signal West Femto Maximum sensitivity substrate according to manufacturer’s instructions (ThermoScientific). All gels were imaged using BioRad Image Lab. Density was measured using BioRad Image Lab v 5.2.1 (BioRad). Relative well-loading was determined for Mir142−/− cells: control β-actin band intensity/ Mir142−/− band intensity = relative loading. Relative loading was then applied to the measured Mir142−/− band intensity: relative loading x measured band intensity = normalized band intensity.
QUANTIFICATION AND STATISTICAL ANALYSIS
Normal distribution of data was determined by D’Agostino and Pearson omnibus normality test. If data were not normally distributed, the appropriate non-parametric test was performed. All figures depict mean, and uncertainty is represented in figures as standard error of the mean (SEM), unless otherwise indicated. All comparisons utilized a two-sided α of 0.05 for significance testing. Mouse blinding was not performed. Power analyses were not utilized, however, independent experiments were performed at least 2 times with a minimum of 3 mice in each group, and is indicated in the figure legends. All statistics were calculated in GraphPad Prism v8.0 software and are indicated in figure legends. P-values are expressed as follows: * p <0.05, ** p <0.01, *** p <0.001, **** p <0.0001.
DATA AND SOFTWARE AVAILABILITY
The microarray data are accessible within Gene Expression Omnibus (GEO) under accession code GSE85476.
Supplementary Material
KEY RESOURCES TABLE
| REAGENT or RESOURCE | SOURCE | IDENTIFIER |
|---|---|---|
| Antibodies | ||
| APC CD49b anti-mouse mAb (DX5) | Thermo Fisher | Cat #17-5971-82 |
| eFluor660 CD107a anti-mouse mAb (1D4B) | Thermo Fisher | Cat #50-1071-82 |
| PerCP-eFluor710 EOMES anti-mouse mAb (Dan11mag) | Thermo Fisher | Cat #46-4875-82 |
| APC Granzyme B anti-human mAb (GB12) | Thermo Fisher | Cat #MHGB05 |
| PE IFN gamma anti-mouse mAb (XMG1.2) | Thermo Fisher | Cat #12-7311-82 |
| PE-Cyanine7 NKp46 anti-mouse mAb (29A1.4) | Thermo Fisher | Cat #25-3351-82 |
| Alexa Fluor 647 Stat5 (pY694) mAb (47/Stat5(pY694)) | BD Biosciences | Cat #562076 |
| Brilliant Violet 605 anti-mouse CD45 mAb (30-F11) | BioLegend | Cat #103139 |
| Brilliant Violet 605 anti-mouse CD45.1 mAb (A20) | BioLegend | Cat #110737 |
| PE anti-rat/mouse CD49a mAb (Ha31/8) | BD Biosciences | Cat #562115 |
| PerCP-Cy5.5 anti-mouse NK-1.1 mAb (PK136) | BD Biosciences | Cat #561111 |
| PE rat anti-mouse CD43 mAb (S7) | BD Biosciences | Cat #553271 |
| APC CY7 Hamster anti-mouse CD3e mAb (145-2C11) | BD Biosciences | Cat #557596 |
| BV605 Hamster anti-rat/mouse CD49a mAb (Ha31/8) | BD Biosciences | Cat #740375 |
| T-BET BV421 (4B10) | Biolegend | Cat #644815 |
| PE Rat anti-mouse CD51 mAb (RMV-7) | BD Biosciences | Cat #551187 |
| APC-CY7 mouse anti-mouse NK1.1 mAb (PK136) | BD Biosciences | Cat #560618 |
| Pacific Blue Hamster anti-mouse CD3e mAb (500A2) | BD Biosciences | Cat #558214 |
| NFIL3 (E4BP4), Alexa Flour® 647, Clone: 1218A | Fisher (R&D) | IC8888R100 |
| Alexa Fluor 647mouse anti-STAT4 (pY693) | BD Biosciences | Cat #558137 |
| Smad2(pS465/pS457)/Smad3(pS423/pS425) Mouse, PE, Clone: 072-670, BD | BD Biosciences | BDB562586 |
| TGF-beta RI/ALK-5, APC, Clone: 141231, 100 tests | R&D Systems | FAB5871A100 |
| Anti-Mouse CD73 eFluor 450 mAb (eBioTY/11.8) | eBioscience | Cat #48-0731-82 |
| BV605 mouse anti-mouse TIGIT mAb (1G9) | BD Biosciences | Cat #744212 |
| Anti-h/m AF488 IL12RB2 | R&D systems | Cat #FAB1959G |
| PE Anti-mouse CD200R mAb (OXr2) | BioLegend | Cat #123907 |
| Anti-mouse CD3e eFluor 450 mAb (145-2C11) | eBioscience | Cat #48-0031-82 |
| NFIL3/E4BP4 Alexa Fluor 488 | Fisher (R&D) | Cat# IC8888G |
| Pe/Cy7 anti-mouse CD127 (IL-7Ra) mAb (A7R34) | Biolegend | Cat #135014 |
| Anti-mouse CD122 e Fluor 450 mAb (TM-b1) | eBioscience | Cat #48-1-222-82 |
| FITC Hamster anti-mouse CD3e mAb (145-2C11) | BD Biosciences | Cat #553062 |
| FITC mouse anti-mouse NK1.1 mAb (PK136) | BD Biosciences | Cat #553164 |
| Anti-Hu/MO CD45R (B220) FITC mAb (RA3-6B2) | Thermo Fisher | Cat #11-0452-82 |
| PE Hamster anti-mouse CD11c mAb (HL3) | BD Bioscience | Cat #553802 |
| APC anti-mouse CD283 TLR3 mAb (11F8) | Biolegend | Cat #141906 |
| APC CY7 Anti-mouse CD8a mAb (53-6.7) | Biolegend | Cat #100714 |
| Anti-m TGFBR1/ALK5 APC | R&D systems | Cat #FAB5871A |
| PE/CY7 anti-mouse/rat CD61 mAb (HMb3-1) | Biolegend | Cat #104317 |
| APC Ly-49H anti-mouse mAb (3D10) | Thermo Fisher | Cat# 17-5886-82 |
| PE Anti Mouse CD218a IL-18Ra mAb (P3TUNYA) | eBioscience | Cat# 12-5183-82 |
| APC CY7 Rat anti-mouse CD11b mAb (M1/70) | BD Biosciences | Cat# 557657 |
| SOCS1 (A156) Antibody | Cell Signaling | Cat# 3950S |
| STREPTAVIDIN PE | BD Bioscience | Cat# 554061 |
| PE mouse anti-mouse CD212 | BD Biosciences | Cat# 551974 |
| PE Rat anti-mouse CD132 | BD Biosciences | Cat# 554457 |
| anti-CD29, FITC, Clone: Ha2/5, BD | BD Biosciences | BDB561796 |
| FITC Rat anti-mouse CD43 mAb (s7) | BD Biosciences | Cat# 553270 |
| FITC anti-mouse LY49D mAb (49-h4) | Biolegend | Cat#138605 |
| APC anti-mouse NKG2D mAb (CX5) | eBioscience | Cat# 17-5882-82 |
| PE Anti-mouse NKG2A b6 mAb (16a11) | Ebioscience | Cat# 12-5897-82 |
| E450 anti-mouse/rat KI67 mAb (SolA15) | eBioscience | Cat# 48-5698-82 |
| FITC Rat anti-mouse Ly-6G and Ly-6C GR1 mAb (RB6-8C5) | BD Bioscience | Cat# 553127 |
| FITC Rat anti-mouse TER119/Erythroid Cells mAb (TER-119) | BD Biosciences | Cat# 557915 |
| APC Rat anti-mouse CD135 FLT3 mAb (A2F10.0) | BD Biosciences | Cat# 560718 |
| PE anti-mouse CD94 mAb (18d3) | eBioscience | Cat# 12-0941-81 |
| Bacterial and Virus Strains | ||
| MCMV Smith Strain | French Lab | |
| Chemicals, Peptides, and Recombinant Proteins | ||
| Mouse IL-3 | Peprotech | Cat# 213-13 |
| mouse IL-15 | Peprotech | Cat# 210-15 |
| Mouse IL-12 | Peprotech | Cat# 210-12 |
| Recombinant Human TGF-B1 (HEK293 derived), 10ug | Peprotech | Cat# 100-21 |
| RPMI1640 | GE Healthcare Life Science | Cat# SH30027.02 |
| Fetal Bovine Serum (FBS) | Sigma | Cat # F2442 |
| Pen Strep | GE Healthcare Life Science | Cat# SV30010 |
| NEAA | GE Healthcare Life Science | Cat# SH30027.02 |
| Sodium Pyruvate | GE Healthcare Life Science | Cat# SH30239.01 |
| L-Glutamine | Hyclone | Cat# SH30239.01 |
| HEPES | GE Healthcare Life Science | Cat# SH30237.01 |
| fixation/permeabilization kit | BD Bioscience | Cat# 51-2090KZ |
| fixation/permeabilization concentrate | Invitrogen | Cat# 00-5123-43 |
| fixation/permeabilization diluent | Invitrogen | Cat# 00-5223-56 |
| Trizol | Ambion Life Technologies | Cat# 15596026 |
| poly I:C | Invitrogen | Cat # tlrl-pic |
| 7AAD | Sigma | Cat# A9400 |
| Cell Trace Violet | Thermo Fisher | C34557 |
| Cell Trace Yellow | Thermo Fisher | C34567 |
| Phosphate Buffer Saline (PBS) | Hyclone | Cat# SH30028.03 |
| Collagenase | Sigma | Cat# C9407-100MG |
| DNase | Sigma | Cat # D4527-10KU |
| Percoll | GE Healthcare | 17-0891-01 |
| 1X HBSS | Gibco | 14025-076 |
| CFSE | Sigma | 21888-25MG-F |
| 10x PBS | Fisher Scientific | BP3991 |
| Ammonium chloride, 500G | Sigma | A9434-500G |
| Potassium Chloride, 500g, for molecular biology | Sigma | P9541-500G |
| Electron Microscopy Sci. 16% Paraformaldehyde Aq Sol., Case of 10 | Fisher | 50-980-489 |
| DMEM Media | Gibco | 11965 |
| DMSO | Sigma | D2650 |
| EDTA | Corning | 46-034-CL |
| Heparin | Fresenius Kabi USA | 401807K |
| AO/PI | Nexcelom | CS2-0106-5ML |
| Ethyl Alcohol 200 Proof | Pharmco | Cat #11100020S |
| Critical Commercial Assays | ||
| EasySep™ Mouse NK Cell Isolation Kit | Stem Cell Technologies | Catalog # 19855 |
| Direct-zol RNA Microprep | Zymo Research | R2061 |
| PE Annexin V Apoptosis Detection Kit | BD Bioscience | Catalog No. 559763 |
| Automacs NK Cell Isolation Kit | Miltenyi | |
| CellTrace™ Yellow Cell Proliferation Kit, for flow cytometry | Thermo Fisher | |
| CellTrace™ Violet Cell Proliferation Kit, for flow cytometry | Thermo Fisher | C34557 |
| Promega Dual-Glo Luciferase Assay System, 10mL | Thermo Fisher | PR-E2920 |
| Deposited Data | ||
| MicroArray | GEO | GSE85476 |
| Experimental Models: Cell Lines | ||
| Mouse: 3T3 | ATCC | |
| Human: 293T | Sands Lab | |
| Experimental Models: Organisms/Strains | ||
| Mouse: Mir142−/− | Reddy Lab | n/a |
| Mouse: Mir142f/f | Bolden Lab | n/a |
| Mouse: CD45.2 C57BL/6J | The Jackson Laboratory | Cat# JAX: 000664 |
| Mouse: CD45.1 C57BL/6J | The Jackson Laboratory | Cat# JAX: 002014 |
| Mouse: Ncr1-icre | Vivier Lab | |
| Mouse: Il15−/− | Li Lab | |
| Oligonucleotides | ||
| has-miR-142-3p, S(50RT/150 PCR rxns) | Life Technologies | 000464 |
| has-miR-142-5p, S(50RT/150 PCR rxns) | Life Technologies | 002248 |
| snoRNA135, TaqMan microRNA control Assay, S(50RT/150 PCR rxns) | Life Technologies | 001230 |
| Software and Algorithms | ||
| FlowJo | Treestar Inc | |
| Automacs | Miltenyi Biotec | |
| Cellometer | Nexcelom | |
| GraphPad Prism 8 | GraphPad | |
| Image Lab | BioRad | |
Highlights.
miR-142 is induced by IL-15 and required for type-1 ILC development and homeostasis
miR-142 targets SOCS1 thereby promotes IL-15 receptor signaling in type-1 ILCs
αV integrin, a miR142-3p target, promotes IL-15-independent survival in type-1 ILCs
miR-142 is critical for cytokine production and NK cell-mediated viral control
Acknowledgments
We thank Dr. Mark Sands for providing reagents, Dr. Marina Cella for providing human RNA samples, and Dr. Timothy O’Sullivan for useful discussions.
Funding: This work was supported by NIH/NCI F32 CA200253 (M.M.B-E.); NIH T32HL007088 (M.M.B-E., J.A.W. and R.P.S.); NIH R01AI078994 (A.R.F.); NIH U01AI095542, NIH R01DE025884, NIH R01DK103039 (M.C.); 5T32CA009547-30 (V.S.C.); Crohn’s & Colitis Foundation of America (274415, M.C.); Howard Hughes Medical Institute Medical Fellow Award (J.A.W.); Rheumatology Research Foundation, NIH R01 AI127752 (M.A.C.); F30AI129110, T32GM07200 (A.Y.M.); The American Association of Immunologists Fellowship (A.Y.M. and M.A.C.); NIH CA-0173878, NIH/NCI CA-143379, NHLBI/HL-090775 (P.R.); ASH Scholar Award from the American Society of Hematology Foundation, a Physician-Scientist Early Career Award from the Howard Hughes Medical Institute, and NIH R01AI102924, R01CA205239 (T.A.F.).
Footnotes
Competing interests: The authors declare no competing financial interest.
Publisher's Disclaimer: This is a PDF file of an unedited manuscript that has been accepted for publication. As a service to our customers we are providing this early version of the manuscript. The manuscript will undergo copyediting, typesetting, and review of the resulting proof before it is published in its final citable form. Please note that during the production process errors may be discovered which could affect the content, and all legal disclaimers that apply to the journal pertain.
References
- Bezman NA, Chakraborty T, Bender T, and Lanier LL (2011). miR-150 regulates the development of NK and iNKT cells. J Exp Med 2018, 2717–2731. [DOI] [PMC free article] [PubMed] [Google Scholar]
- Chapnik E, Rivkin N, Mildner A, Beck G, Pasvolsky R, Metzl-Raz E, Birger Y, Amir G, Tirosh I, Porat Z, et al. (2014). MiR-142 orchestrates a network of actin cytoskeleton regulators during megakaryopoiesis. Elife 3:e01964, 1–22. [DOI] [PMC free article] [PubMed] [Google Scholar]
- Collins PL, Cella M, Porter SI, Li S, Gurewitz GL, Hong HS, Johnson RP, Oltz EM, and Colonna M (2019). Gene Regulatory Programs Conferring Phenotypic Identities to Human NK Cells. Cell 176, 348–360.e12. [DOI] [PMC free article] [PubMed] [Google Scholar]
- Cooper MA, Bush JE, Fehniger TA, Vandeusen JB, Waite RE, Liu Y, Aguila HL, and Caligiuri MA (2002). In vivo evidence for a dependence on interleukin 15 for survival of natural killer cells. Blood 100, 3633–3638. [DOI] [PubMed] [Google Scholar]
- Cortez VS, Fuchs A, Cella M, Gilfillan S, and Colonna M (2014). Cutting Edge: Salivary Gland NK Cells Develop Independently of Nfil3 in Steady-State. J. Immunol. 192, 4487–4491. [DOI] [PubMed] [Google Scholar]
- Cortez VS, Cervantes-Barragan L, Robinette ML, Bando JK, Wang Y, Geiger TL, Gilfillan S, Fuchs A, Vivier E, Sun JC, et al. (2016). Transforming Growth Factor-β Signaling Guides the Differentiation of Innate Lymphoid Cells in Salivary Glands. Immunity 44, 1127–1139. [DOI] [PMC free article] [PubMed] [Google Scholar]
- Cortez VS, Ulland TK, Cervantes-Barragan L, Bando JK, Robinette ML, Wang Q, White AJ, Gilfillan S, Cella M, and Colonna M (2017). SMAD4 impedes the conversion of NK cells into ILC1-like cells by curtailing non-canonical TGF-β signaling. Nat. Immunol. 18, 995–1003. [DOI] [PMC free article] [PubMed] [Google Scholar]
- Daussy C, Faure F, Mayol K, Viel S, Gasteiger G, Charrier E, Bienvenu J, Henry T, Debien E, Hasan U a, et al. (2014). T-bet and Eomes instruct the development of two distinct natural killer cell lineages in the liver and in the bone marrow. J. Exp. Med. 211, 563–577. [DOI] [PMC free article] [PubMed] [Google Scholar]
- Delconte RB, Kolesnik TB, Dagley LF, Rautela J, Shi W, Putz EM, Stannard K, Zhang J-G, Teh C, Firth M, et al. (2016). CIS is a potent checkpoint in NK cell-mediated tumor immunity. Nat. Immunol. 17, 816–824. [DOI] [PubMed] [Google Scholar]
- Diefenbach A, Colonna M, and Koyasu S (2014). Development , Differentiation , and Diversity of Innate Lymphoid Cells. Immunity 41, 354–365. [DOI] [PMC free article] [PubMed] [Google Scholar]
- Du F, Garg AV, Kosar K, Majumder S, Kugler DG, Mir GH, Maggio M, Henkel M, Lacy-Hulbert A, and McGeachy MJ (2016). Inflammatory Th17 Cells Express Integrin αvβ3 for Pathogenic Function. Cell Rep. 16, 1339–1351. [DOI] [PMC free article] [PubMed] [Google Scholar]
- Fathman JW, Bhattacharya D, Inlay MA, Seita J, Karsunky H, and Weissman IL (2011). Identification of the earliest natural killer cell-committed progenitor in murine bone marrow. Blood 118, 5439–5447. [DOI] [PMC free article] [PubMed] [Google Scholar]
- Fehniger TA, Cai SF, Cao X, Bredemeyer AJ, Presti RM, French AR, and Ley TJ (2007). Acquisition of murine NK cell cytotoxicity requires the translation of a pre-existing pool of granzyme B and perforin mRNAs. Immunity 26, 798–811. [DOI] [PubMed] [Google Scholar]
- Fehniger TA, Wylie T, Germino E, Leong JW, Magrini VJ, Koul S, Keppel CR, Schneider SE, Koboldt DC, Sullivan RP, et al. (2010). Next-generation sequencing identifies the natural killer cell microRNA transcriptome. Genome Res 20, 1590–1604. [DOI] [PMC free article] [PubMed] [Google Scholar]
- Fogel LA, Sun MM, Geurs TL, Carayannopoulos LN, and French AR (2013). Markers of Nonselective and Specific NK Cell Activation. J Immunol 190, 6269–6276. [DOI] [PMC free article] [PubMed] [Google Scholar]
- Gao Y, Souza-Fonseca-Guimaraes F, Bald T, Ng SS, Young A, Ngiow SF, Rautela J, Straube J, Waddell N, Blake SJ, et al. (2017). Tumor immunoevasion by the conversion of effector NK cells into type 1 innate lymphoid cells. Nat. Immunol. 18, 1004–1015. [DOI] [PubMed] [Google Scholar]
- Gasteiger G, Fan X, Dikiy S, Lee SY, Alexander Y, Program I, and Sloan M (2015). Tissue residency of innate lymphoid cells in lymphoid and non- lymphoid organs. Science (80-.). 350, 981–985. [DOI] [PMC free article] [PubMed] [Google Scholar]
- Hall BE, Zheng C, Swaim WD, Cho A, Nagineni CN, Eckhaus MA, Flanders KC, Ambudkar IS, Baum BJ, and Kulkarni AB (2010). Conditional overexpression of TGF-B1 disrupts mouse salivary gland development and function. Lab. Investig. 90, 543–555. [DOI] [PMC free article] [PubMed] [Google Scholar]
- Ignotz R. a, and Massagué J (1986). Transforming growth factor-beta stimulates the expression of fibronectin and collagen and their incorporation into the extracellular matrix. J. Biol. Chem. 261, 4337–4345. [PubMed] [Google Scholar]
- Kennedy MK, Glaccum M, Brown SN, Butz E. a, Viney JL, Embers M, Matsuki N, Charrier K, Sedger L, Willis CR, et al. (2000). Reversible defects in natural killer and memory CD8 T cell lineages in interleukin 15-deficient mice. J. Exp. Med. 191, 771–780. [DOI] [PMC free article] [PubMed] [Google Scholar]
- Klose CSN, Flach M, Möhle L, Rogell L, Hoyler T, Ebert K, Fabiunke C, Pfeifer D, Sexl V, Fonseca-Pereira D, et al. (2014). Differentiation of type 1 ILCs from a common progenitor to all helper-like innate lymphoid cell lineages. Cell 157, 340–356. [DOI] [PubMed] [Google Scholar]
- Kramer NJ, Wang W. Le, Reyes EY, Kumar B, Chen CC, Ramakrishna C, Cantin EM, Vonderfecht SL, Taganov KD, Chau N, et al. (2015). Altered lymphopoiesis and immunodeficiency in miR-142 null mice. Blood 125, 3720–3730. [DOI] [PubMed] [Google Scholar]
- Lanier LL (2008). Evolutionary struggles between NK cells and viruses. Nat Rev Immunol 8, 259–268. [DOI] [PMC free article] [PubMed] [Google Scholar]
- Lei Z, Xu G, Wang L, Yang H, Liu X, Zhao J, and Zhang HT (2014). MiR-142-3p represses TGF-β-induced growth inhibition through repression of TGFβR1 in non-small cell lung cancer. FASEB J. 28, 2696–2704. [DOI] [PubMed] [Google Scholar]
- Leong JW, Schneider SE, Sullivan RP, Parikh B. a, Anthony B. a, Singh A, Jewell B. a, Schappe T, Wagner J. a, Link DC, et al. (2015). PTEN regulates natural killer cell trafficking in vivo. Proc. Natl. Acad. Sci. 112, E700–E709. [DOI] [PMC free article] [PubMed] [Google Scholar]
- Leong JW, Wagner JA, Ireland AR, and Fehniger TA (2016). Transcriptional and post-transcriptional regulation of NK cell development and function. Clin. Immunol. 177, 60–69. [DOI] [PMC free article] [PubMed] [Google Scholar]
- Lewis BP, Burge CB, and Bartel DP (2005). Conserved seed pairing, often flanked by adenosines, indicates that thousands of human genes are microRNA targets. Cell 120, 15–20. [DOI] [PubMed] [Google Scholar]
- Lu L-F, Gasteiger G, Yu I-S, Chaudhry A, Hsin J-P, Lu Y, Bos PD, Lin L-L, Zawislak CL, Cho S, et al. (2015). A Single miRNA-mRNA Interaction Affects the Immune Response in a Context- and Cell-Type-Specific Manner. Immunity 43, 52–64. [DOI] [PMC free article] [PubMed] [Google Scholar]
- Ma A, Koka R, and Burkett P (2006). Diverse functions of IL-2, IL-15, and IL-7 in lymphoid homeostasis. Annu. Rev. Immunol. 24, 657–679. [DOI] [PubMed] [Google Scholar]
- Marçais A, Viel S, Grau M, Henry T, Marvel J, and Walzer T (2013). Regulation of Mouse NK Cell Development and Function by Cytokines. Front. Immunol. 4, 450. [DOI] [PMC free article] [PubMed] [Google Scholar]
- Matter ML, and Ruoslahti E (2001). A signaling pathway from the alpha5beta1 and alpha(v)beta3 integrins that elevates bcl-2 transcription. J Biol Chem 276, 27757–27763. [DOI] [PubMed] [Google Scholar]
- Mildner A, Chapnik E, Manor O, Yona S, Kim KW, Aychek T, Varol D, Beck G, Itzhaki ZB, Feldmesser E, et al. (2013). Mononuclear phagocyte miRNome analysis identifies miR-142 as critical regulator of murine dendritic cell homeostasis. Blood 121, 1016–1027. [DOI] [PubMed] [Google Scholar]
- Narni-Mancinelli E, Chaix J, Fenis A, Kerdiles YM, Yessaad N, Reynders A, Gregoire C, Luche H, Ugolini S, Tomasello E, et al. (2011). Fate mapping analysis of lymphoid cells expressing the NKp46 cell surface receptor. Proc. Natl. Acad. Sci. U. S. A. 108, 18324–18329. [DOI] [PMC free article] [PubMed] [Google Scholar]
- Nilsson SK, Debatis ME, Dooner MS, Madri JA, Quesenberry PJ, and Becker PS (1998). Immunofluorescence characterization of key extracellular matrix proteins in murine bone marrow in situ. J. Histochem. Cytochem. 46, 371–377. [DOI] [PubMed] [Google Scholar]
- Orr MT, and Lanier LL (2010). Natural killer cell education and tolerance. Cell 142, 847–856. [DOI] [PMC free article] [PubMed] [Google Scholar]
- Reardon DA, Fink KL, Mikkelsen T, Cloughesy TF, O’Neill A, Plotkin S, Glantz M, Ravin P, Raizer JJ, Rich KM, et al. (2008). Randomized phase II study of cilengitide, an integrin-targeting arginine-glycine-aspartic acid peptide, in recurrent glioblastoma multiforme. J. Clin. Oncol. [DOI] [PubMed] [Google Scholar]
- Rivkin N, Chapnik E, Birger Y, Yanowski E, Curato C, Mildner A, Porat Z, Amir G, Izraeli S, Jung S, et al. (2017). Rac1 functions downstream of miR-142 in regulation of erythropoiesis. Haematologica 102, e476–e480. [DOI] [PMC free article] [PubMed] [Google Scholar]
- Roozendaal R, Mebius RE, and Kraal G (2008). The conduit system of the lymph node. Int. Immunol. 20, 1483–1487. [DOI] [PubMed] [Google Scholar]
- Schuster IS, Wikstrom ME, Brizard G, Coudert JD, Estcourt MJ, Manzur M, O’Reilly LA, Smyth MJ, Trapani JA, Hill GR, et al. (2014). TRAIL+ NK Cells Control CD4+ T Cell Responses during Chronic Viral Infection to Limit Autoimmunity. Immunity 41, 646–656. [DOI] [PubMed] [Google Scholar]
- Singh PB, Pua HH, Happ HC, Schneider C, von Moltke J, Locksley RM, Baumjohann D, and Ansel KM (2017). MicroRNA regulation of type 2 innate lymphoid cell homeostasis and function in allergic inflammation. J. Exp. Med.jem.20170545. [DOI] [PMC free article] [PubMed] [Google Scholar]
- Sojka DK, Plougastel-Douglas B, Yang L, Pak-Wittel MA, Artyomov MN, Ivanova Y, Zhong C, Chase JM, Rothman PB, Yu J, et al. (2014). Tissue-resident natural killer (NK) cells are cell lineages distinct from thymic and conventional splenic NK cells. Elife 3, 1–21. [DOI] [PMC free article] [PubMed] [Google Scholar]
- Srinivas S, Watanabe T, Lin CS, William CM, Tanabe Y, Jessell TM, and Costantini F (2001). Cre reporter strains produced by targeted insertion of EYFP and ECFP into the ROSA26 locus. BMC Dev Biol 1, 4. [DOI] [PMC free article] [PubMed] [Google Scholar]
- Su S, Zhao Q, He C, Huang D, Liu J, Chen F, Chen J, Liao J-Y, Cui X, Zeng Y, et al. (2015). miR-142-5p and miR-130a-3p are regulated by IL-4 and IL-13 and control profibrogenic macrophage program. Nat. Commun. 6, 8523. [DOI] [PMC free article] [PubMed] [Google Scholar]
- Sullivan R, Leong J, Schneider S, Ireland A, Berrien-Elliott M, Singh A, Schappe T, Jewell B, Sexl V, and Fehniger TA (2015). Mir-15/16 antagonizes Myb to control natural killer cell maturation. J Immunol 195, 2806–2817. [DOI] [PMC free article] [PubMed] [Google Scholar]
- Sullivan RP, Leong JW, Schneider SE, Keppel CKR, Germino E, French AR, and Fehniger TA (2012). MicroRNA Deficient NK Cells Exhibit Decreased Survival but Enhanced Function. J Immunol 188, 3019–3030. [DOI] [PMC free article] [PubMed] [Google Scholar]
- Sullivan RP, Fogel LA, Leong JW, Schneider SE, Wong R, Romee R, Thai T-H, Sexl V, Matkovich SJ, Dorn GW, et al. (2013). miR-155 tunes both the threshold and extent of NK cell activation via targeting of multiple signaling pathways. J Immunol 191, 5904–5913. [DOI] [PMC free article] [PubMed] [Google Scholar]
- Sun Y, Oravecz-Wilson K, Mathewson N, Wang Y, McEachin R, Liu C, Toubai T, Wu J, Rossi C, Braun T, et al. (2015). Mature T cell responses are controlled by microRNA-142. J. Clin. Invest. 125, 2825–2840. [DOI] [PMC free article] [PubMed] [Google Scholar]
- Viel S, Marçais A, Guimaraes FS, Loftus R, Rabilloud J, Grau M, Degouve S, Djebali S, Sanlaville A, Charrier E, et al. (2016). TGF- b inhibits the activation and functions of NK cells by repressing the mTOR pathway. 9, 1–14. [DOI] [PubMed] [Google Scholar]
- Vivier E, Tomasello E, Baratin M, Walzer T, and Ugolini S (2008). Functions of natural killer cells. Nat Immunol 9, 503–510. [DOI] [PubMed] [Google Scholar]
- Weizman O. El, Adams NM, Schuster IS, Krishna C, Pritykin Y, Lau C, Degli-Esposti MA, Leslie CS, Sun JC, and O’Sullivan TE (2017). ILC1 Confer Early Host Protection at Initial Sites of Viral Infection. Cell. [DOI] [PMC free article] [PubMed] [Google Scholar]
- Yamada Y, Kosaka K, Miyazawa T, Kurata-Miura K, and Yoshida T (2014). MiR-142-3p enhances Fc??RI-mediated degranulation in mast cells. Biochem. Biophys. Res. Commun. 443, 980–986. [DOI] [PubMed] [Google Scholar]
- Yokoyama WM, Kim S, and French AR (2004). The dynamic life of natural killer cells. Ann Rev Immunol 22, 405–429. [DOI] [PubMed] [Google Scholar]
- Yoshizawa K, Nakajima S, Notake T, Miyagawa S-I, Hida S, and Taki S (2011). IL-15-high-responder developing NK cells bearing Ly49 receptors in IL-15−/− mice. J. Immunol. 187, 43 5162–5169. [DOI] [PubMed] [Google Scholar]
- Zawislak CL, Beaulieu AM, Loeb GB, Karo J, Canner D, Bezman N. a, Lanier LL, Rudensky AY, and Sun JC (2013). Stage-specific regulation of natural killer cell homeostasis and response against viral infection by microRNA-155. Proc Natl Acad Sci USA 110, 6967–6972. [DOI] [PMC free article] [PubMed] [Google Scholar]
- Zhang Z, Vuori K, Reed JC, and Ruoslahti E (1995). The alpha 5 beta 1 integrin supports survival of cells on fibronectin and up-regulates Bcl-2 expression. Proc. Natl. Acad. Sci. U. S. A. 92, 6161–6165. [DOI] [PMC free article] [PubMed] [Google Scholar]
Associated Data
This section collects any data citations, data availability statements, or supplementary materials included in this article.
Supplementary Materials
Data Availability Statement
The microarray data are accessible within Gene Expression Omnibus (GEO) under accession code GSE85476.