Abstract
Background
Prostate cancer (PCa) remains the second leading cause of deaths due to cancer in the United States in men. The aim of this study was to perform an integrative epigenetic analysis of prostate adenocarcinoma to explore the epigenetic abnormalities involved in the development and progression of prostate adenocarcinoma. The key DNA methylation-driven genes were also identified.
Methods
Methylation and RNA-seq data were downloaded for The Cancer Genome Atlas (TCGA). Methylation and gene expression data from TCGA were incorporated and analyzed using MethylMix package. Methylation data from the Gene Expression Omnibus (GEO) were assessed by R package limma to obtain differentially methylated genes. Pathway analysis was performed on genes identified by MethylMix criteria using ConsensusPathDB. Gene Ontology (GO) term enrichment analysis and Kyoto Encyclopedia of Genes and Genomes (KEGG) pathway analysis were also applied for the identification of pathways in which DNA methylation-driven genes significantly enriched. The protein–protein interaction (PPI) network and module analysis in Cytoscape software were used to find the hub genes. Two methylation profile (GSE112047 and GSE76938) datasets were utilized to validate screened hub genes. Immunohistochemistry of these hub genes were evaluated by the Human Protein Atlas.
Results
A total of 553 samples in TCGA database, 32 samples in GSE112047 and 136 samples in GSE76938 were included in this study. There were a total of 266 differentially methylated genes were identified by MethylMix. Plus, a total of 369 differentially methylated genes and 594 differentially methylated genes were identified by the R package limma in GSE112047 and GSE76938, respectively. GO term enrichment analysis suggested that DNA methylation-driven genes significantly enriched in oxidation–reduction process, extracellular exosome, electron carrier activity, response to reactive oxygen species, and aldehyde dehydrogenase [NAD(P)+] activity. KEGG pathway analysis found DNA methylation-driven genes significantly enriched in five pathways including drug metabolism—cytochrome P450, phenylalanine metabolism, histidine metabolism, glutathione metabolism, and tyrosine metabolism. The validated hub genes were MAOB and RTP4.
Conclusions
Methylated hub genes, including MAOB and RTP4, can be regarded as novel biomarkers for accurate PCa diagnosis and treatment. Further studies are needed to draw more attention to the roles of these hub genes in the occurrence and development of PCa.
Keywords: Prostate adenocarcinoma, Methylation, TCGA, GEO, Integrative epigenetic analysis
Background
Prostate cancer (PCa) remains the second leading cause of deaths due to cancer in the United States in men [1]. Siegel et al. [2] demonstrated that there will have 164,690 newly diagnosed PCa patients and 29,430 deaths in 2018 in the United States. Thus, the diagnosis of PCa in early stage is vitally important [3]. Currently, the serum prostate-specific antigen (PSA) screening remains the primary way for early diagnosis of PCa. However, the sensitivity and specificity of PSA test remains low [4]. Therefore, it is important to find notable biomarkers for the diagnosis of PCa.
Previous studies [5–7] have shown that DNA methylation plays a crucial role in the development and progression of prostate cancer. DNA methylation is treated as a promising investigative tool for the study of progressive prostate cancer because that DNA methylation is a reversible progress [8]. High-throughput screening has been widely used to identify the DNA methylation involved in the initiation and progression of the prostate cancer [9–11]. Epigenetic modifications are crucial for diagnosis and prognosis of prostate cancer and proving additional options for prostate cancer diagnosis and treatment strategies [12, 13].
In this study, prostate cancer associated DNA methylation-driven genes between cancerous and normal samples were identified and GO term enrichment analysis, KEGG pathway analysis, PPI network analysis were also performed respectively.
Results
Identification of DNA methylation-driven genes
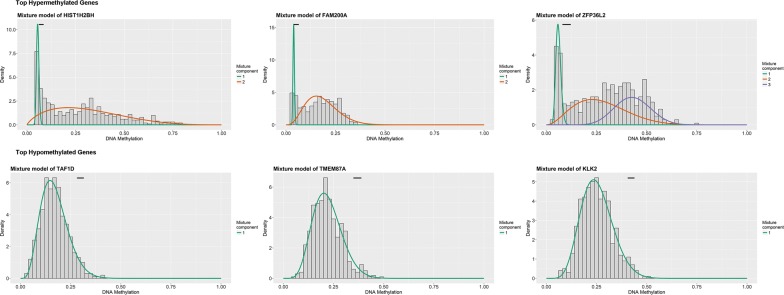
Clinical data of prostate cancer patients extracted from TCGA were demonstrated in Table 1. A total of 266 genes were differentially methylated when comparing tumor to normal by MethylMix criteria for all 553 samples. Representative differential methylation of tumor samples compared with normal samples was demonstrated in Fig. 1 and Table 2. Of these genes, 209 genes (78.57%) were hypermethylated and the remainder of the 57 genes (21.43%) were hypomethylated.
Table 1.
Clinical dada of prostate cancer patients from TCGA
| Characteristic | Total |
|---|---|
| Cohort sizea | 500 |
| Mean age, years | 61.01 ± 6.823 |
| T stage | |
| pT2a | 13 (2.6%) |
| pT2b | 10 (2%) |
| pT2c | 165 (33%) |
| pT3a | 159 (31.8%) |
| pT3b | 136 (27.2%) |
| pT4 | 10 (2%) |
| Unknown | 7 (1.4%) |
| N stage | |
| N0 | 348 (69.6%) |
| N1 | 79 (15.8%) |
| Unknown | 73 (14.6%) |
aThree clinical data of prostate cancer patients are not available
Fig. 1.
Summary of top hypermethylated and top hypomethylated genes. The horizontal black bar demonstrates the distribution of methylation values in the normal samples (denoted as beta values where higher beta values demonstrate greater methylation). The histogram represents the distribution of methylation in tumor samples
Table 2.
Top 10 hypomethylated genes and hypermethylated genes in patients with prostate cancer
| Gene | Normal mean | Tumor mean | Log FC | p value | Adjust p | Cor | Cor p value |
|---|---|---|---|---|---|---|---|
| Top 10 hypomethylated genes | |||||||
| TAF1D | 0.298851771 | 0.17046481 | − 0.809956148 | 5.12E−22 | 1.61E−19 | − 0.515133904 | 3.62E−35 |
| TMEM87A | 0.36898334 | 0.219989007 | − 0.746124244 | 2.40E−22 | 7.57E−20 | − 0.415783216 | 2.80E−22 |
| KLK2 | 0.42230197 | 0.252663444 | − 0.741058027 | 2.34E−25 | 7.36E−23 | − 0.424469057 | 3.03E−23 |
| MARS | 0.661117252 | 0.407190703 | − 0.69920154 | 2.88E−18 | 9.08E−16 | − 0.402813221 | 6.87E−21 |
| SLC10A5 | 0.682378547 | 0.421046571 | -0.696592477 | 1.19E−16 | 3.76E−14 | − 0.320114016 | 2.36E−13 |
| KLK3 | 0.528659515 | 0.348234132 | − 0.602281232 | 2.38E−22 | 7.50E−20 | − 0.352378214 | 4.92E−16 |
| MPC2 | 0.847716806 | 0.573604393 | − 0.563526315 | 3.24E−22 | 1.02E−19 | − 0.509873152 | 2.25E−34 |
| ALDH1A3 | 0.390659331 | 0.266302408 | − 0.552845598 | 6.96E−20 | 2.19E−17 | − 0.500862763 | 4.78E−33 |
| CLDN8 | 0.556942422 | 0.387056997 | − 0.524982157 | 1.24E−14 | 3.91E−12 | − 0.339347771 | 6.50E−15 |
| PMEPA1 | 0.427234317 | 0.301507194 | − 0.50283511 | 1.93E−21 | 6.07E−19 | − 0.559861766 | 1.65E−42 |
| Top 10 hypermethylated genes | |||||||
| HIST1H2BH | 0.073047 | 0.264894 | 1.858512 | 1.40E−15 | 4.41E−13 | − 0.37138 | 9.15E−18 |
| FAM200A | 0.052277 | 0.163374 | 1.643934 | 1.78E−18 | 5.60E−16 | − 0.32491 | 9.86E−14 |
| ZFP36L2 | 0.101664 | 0.293078 | 1.527482 | 1.59E−13 | 5.02E−11 | − 0.47382 | 2.72E−29 |
| WFDC2 | 0.125846 | 0.347072 | 1.463575 | 2.89E−24 | 9.09E−22 | − 0.46874 | 1.27E−28 |
| SMIM10 | 0.169555 | 0.460955 | 1.44287 | 1.29E−18 | 4.06E−16 | − 0.52098 | 4.58E−36 |
| RIPPLY2 | 0.06161 | 0.166659 | 1.435669 | 4.35E−23 | 1.37E−20 | − 0.33215 | 2.57E−14 |
| RTP4 | 0.102519 | 0.273692 | 1.416666 | 4.91E−19 | 1.55E−16 | − 0.51074 | 1.67E−34 |
| FBXO27 | 0.048294 | 0.126663 | 1.391093 | 3.13E−12 | 9.85E−10 | − 0.64419 | 7.67E−60 |
| ZNF492 | 0.057359 | 0.147069 | 1.358401 | 3.63E−20 | 1.14E−17 | − 0.33472 | 1.58E−14 |
| HPDL | 0.14249 | 0.356177 | 1.321732 | 5.48E−20 | 1.73E−17 | − 0.54417 | 8.31E−40 |
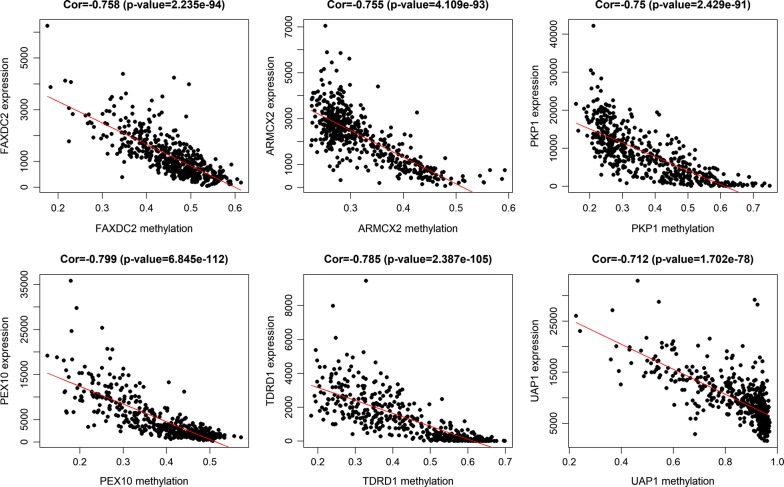
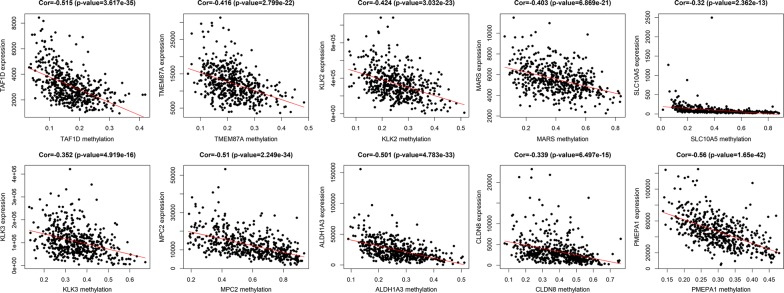
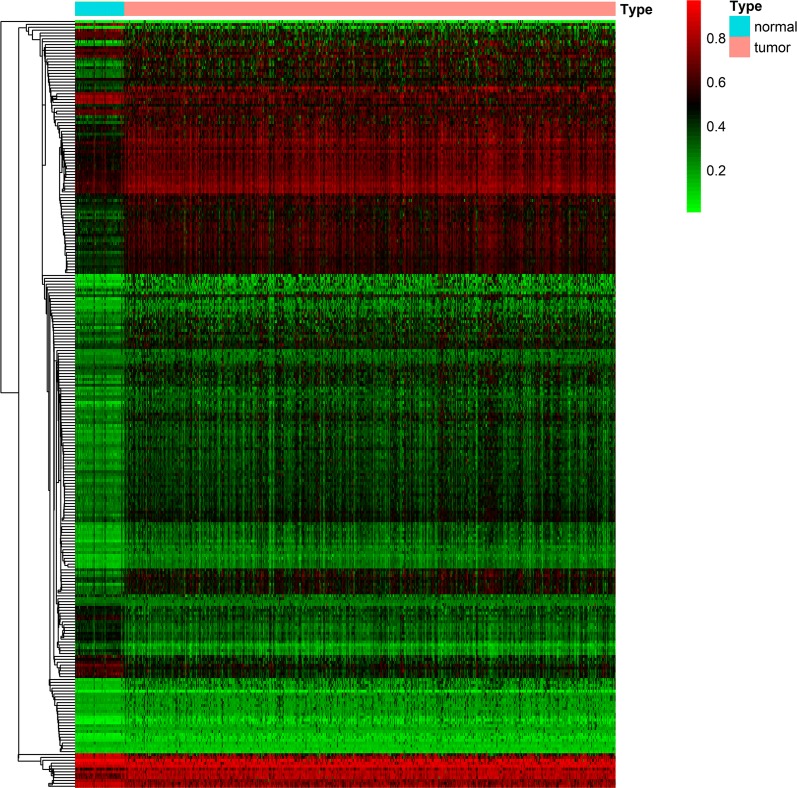
The entire matrix of methylation values was evaluated. In this study, the correlation between gene expression and DNA methylation data was calculated and 266 gene expression were found to be negatively correlated with DNA methylation (Fig. 2). Correlation between genes expression and DNA methylation of top 10 hypermethylated genes (Fig. 3) and top hypomethylated genes (Fig. 4) was also demonstrated. A Heatmap of the methylation values of all patients was demonstrated in Fig. 5.
Fig. 2.
Representative images demonstrated correlation between gene expression and DNA methylation. Gene expression were found to be negatively correlated with DNA methylation. Average β-values are presented on the x-axis, log2 FPKM gene expression values are presented on y-axis
Fig. 3.
Correlation between genes expression and DNA methylation of top 10 hypermethylated genes. Average β-values are presented on the x-axis, log2 FPKM gene expression values are presented on y-axis
Fig. 4.
Correlation between genes expression and DNA methylation of top 10 hypomethylated genes. Average β-values are presented on the x-axis, log2 FPKM gene expression values are presented on y-axis
Fig. 5.
Heatmap of methylation values for 266 genes uniquely methylated in prostate cancer patients
A total of 369 differentially methylated genes and 594 differentially methylated genes were identified by the R package limma in GSE112047 and GSE76938, respectively.
Gene ontology terms analysis of DNA methylation-driven genes obtained from TCGA database
GO term enrichment analysis results varied from GO classification. As to biological process, the DNA methylation-driven genes enriched in oxidation–reduction process, response to reactive oxygen species, xenobiotic catabolic process, bone morphogenesis, hydrogen peroxide biosynthetic process, response to interferon-beta, negative regulation of ATPase activity, and limb morphogenesis. For cellular component, the DNA methylation-driven genes enriched in extracellular exosome. For molecular function, the DNA methylation-driven genes enriched in electron carrier activity, aldehyde dehydrogenase [NAD(P)+] activity, glutathione peroxidase activity, structural molecule activity, and glutathione binding (Fig. 6 and Table 3).
Fig. 6.
Representative enriched GO terms of 266 DNA methylation driven genes in prostate cancer
Table 3.
The top 8 GO terms enriched by the 266 DNA methylation driven genes in prostate cancer
| Category | Term | Count | p value | Genes |
|---|---|---|---|---|
| BP | GO:0055114 ~ oxidation–reduction process | 25 | 2.13E−06 | STEAP4, ME3, OXA1L, GLUD1, DUOX1, PAH, HPDL, ALDH3A1, ALDH1A3, GPX3, HAAO, FASN, GPX7, DHCR24, FAXDC2, MAOB, CRYZ, CDO1, RDH5, CYBA, CYP27A1, AKR1B1, TMLHE, AOX1, CYBRD1 |
| CC | GO:0070062 ~ extracellular exosome | 66 | 6.38E−06 | STEAP4, RARRES2, RPS2, SYNGR2, CANT1, GSTM2, DES, APOD, GPX3, LTF, PI15, ZDHHC1, BST2, CFTR, EEF2, CD40, CD38, KRT17, KRT15, TMEM106A, CYBRD1, HSPB1, SERPINB1, NEU1, CSTA, MFAP4, WFDC2, GSTP1, ACP5, PAH, CD74, B3GNT8, KRT5, ITGB8, KRT7, ALDH1A3, ENTPD5, FASN, RPL3, HAAO, ANGPTL1, RPL7A, MARS, BHMT2, S100A16, LGALS3, KLK2, KLK3, HIST1H2BH, MAOB, KLK1, CRYZ, ANXA2, PROM1, ORM1, ACSM1, C1ORF116, PKP1, PHB2, RAB34, AKR1B1, CAPG, AOX1, ALDH2, SLC46A3, PON3 |
| MF | GO:0009055 ~ electron carrier activity | 7 | 0.001504105 | ACOX2, CYBA, AOX1, AKR1B1, MAOB, ALDH2, HAAO |
| BP | GO:0000302 ~ response to reactive oxygen species | 5 | 0.0019364 | CYBA, APOD, GPX3, GPX7, GSTP1 |
| MF | GO:0004030 ~ aldehyde dehydrogenase [NAD(P)+] activity | 3 | 0.002720156 | ALDH1A3, ALDH2, ALDH3A1 |
| MF | GO:0004602 ~ glutathione peroxidase activity | 4 | 0.002838234 | GSTM2, GPX3, GPX7, GSTP1 |
| BP | GO:0042178 ~ xenobiotic catabolic process | 3 | 0.003748861 | GSTM1, GSTM2, CRYZ |
| BP | GO:0060349 ~ bone morphogenesis | 4 | 0.005820424 | SP5, LTF, ACP5, RIPPLY2 |
KEGG pathway analysis of DNA methylation-driven genes obtained from TCGA
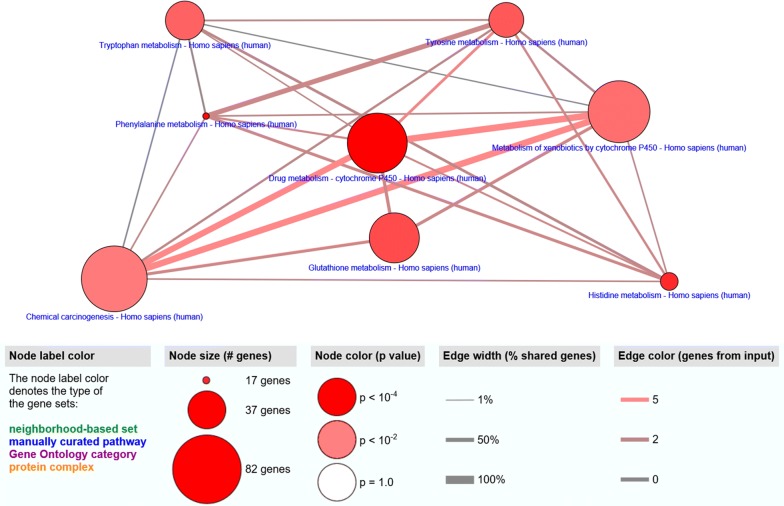
KEGG pathway analysis found five significantly enriched pathways. Seven DNA methylation-driven genes enriched in drug metabolism—cytochrome P450. Four DNA methylation-driven genes enriched in Phenylalanine metabolism. Four DNA methylation-driven genes enriched in Histidine metabolism. Five DNA methylation-driven genes enriched in Glutathione metabolism. Four DNA methylation-driven genes enriched in Tyrosine metabolism (Fig. 7 and Table 4).
Fig. 7.
Pathways enriched of 266 DNA methylation driven genes in prostate cancer
Table 4.
Pathway enriched by the 266 DNA methylation driven genes
| Pathway | External_id | Members_input_overlap | p-value | q-value | Size |
|---|---|---|---|---|---|
| Drug metabolism—cytochrome P450 | hsa00982 | AOX1; GSTM1; GSTM2; ALDH3A1; MAOB; GSTP1; ALDH1A3 | 6.59E−05 | 0.003828899 | 70 |
| Phenylalanine metabolism | hsa00360 | PAH; MAOB; ALDH3A1; ALDH1A3 | 9.23E−05 | 0.003828899 | 17 |
| Histidine metabolism | hsa00340 | MAOB; ALDH3A1; ALDH2; ALDH1A3 | 0.000320403 | 0.008864472 | 23 |
| Glutathione metabolism | hsa00480 | GSTM1; GSTM2; GPX3; GSTP1; GPX7 | 0.00114281 | 0.023713299 | 54 |
| Tyrosine metabolism | hsa00350 | AOX1; ALDH3A1; ALDH1A3; MAOB | 0.001836818 | 0.030491186 | 36 |
| Tryptophan metabolism | hsa00380 | MAOB; HAAO; ALDH2; AOX1 | 0.002722806 | 0.037665486 | 40 |
| Metabolism of xenobiotics by cytochrome P450 | hsa00980 | GSTM1; GSTM2; ALDH3A1; GSTP1; ALDH1A3 | 0.00433977 | 0.051457275 | 74 |
| Chemical carcinogenesis | hsa05204 | GSTM1; GSTM2; ALDH3A1; GSTP1; ALDH1A3 | 0.007094498 | 0.073605418 | 82 |
PPI network analysis of DNA methylation-driven genes
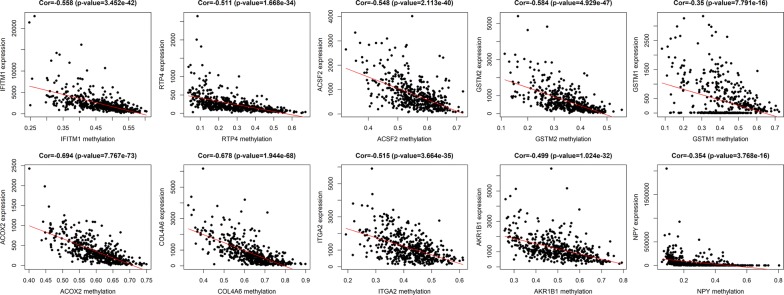
PPI network of DNA methylation-driven genes, consisting of 75 nodes and 90 edges, was constructed by Cytoscape software, based on STRING database. The top 20 differentially expressed DNA methylation-driven genes with high degree of connectivity were selected as the hub DNA methylation-driven genes. There hub genes were IFITM1, RTP4, ACSF2, GSTM2, GSTM1, ACOX2, COL4A6, ITGA2, AKR1B1, NPY, CFTR, GPX7, ALDH3A1, CRYZ, ALDH2, MAOB, GSTP1, GPX3, XAF1, and BST2 (Fig. 8), which might play important roles in DNA methylation in prostate cancer patients. CytoHubba was used to carry out the top 20 hub DNA methylation-driven genes in Cytoscape software (Fig. 9). Correlation between genes expression and DNA methylation of top 10 hub genes was also demonstrated in Fig. 10.
Fig. 8.
PPI network conducted by 266 DNA methylation driven genes
Fig. 9.
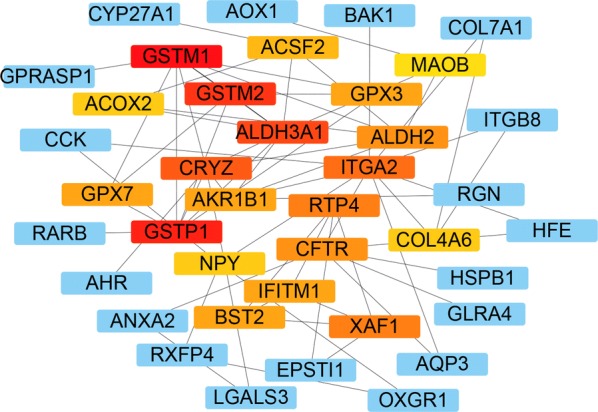
A total of 20 hub genes were found by using the PPI network analysis in Cytoscape software
Fig. 10.
Correlation between genes expression and DNA methylation of top 10 hub genes. Average β-values are presented on the x-axis, log2 FPKM gene expression values are presented on y-axis
Validation of candidate hub DNA methylation-driven genes by the Gene Expression Omnibus (GEO) database
To further investigate the candidate hub DNA methylation-driven genes, GEO database was used to validate these selected genes. Two methylation profile datasets (GSE76938 and GSE112047) were extracted from the GEO for the validation. We then overlapped the differentially methylated genes among 266 genes obtained from TCGA database (Additional file 1: Table S1), 369 genes obtained from GSE112047 (Additional file 2: Table S2), 594 genes obtained from GSE 76938 (Additional file 2: Table S2), and top 20 hub genes obtained from PPI network analysis and identified a common list of 6 methylated genes including AKR1B1, RTP4, MAOB, GSTM2, GPX3, and COL4A6. The outcome was demonstrated by a Venn diagram (Fig. 11).
Fig. 11.
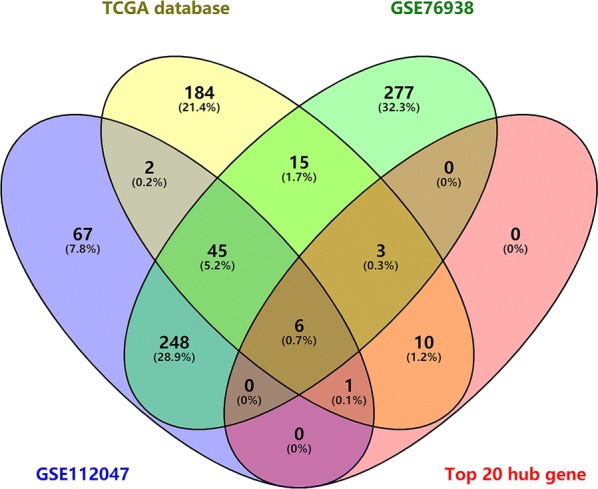
A Venn diagram was used to demonstrate a common list of 6 methylated genes including AKR1B1, RTP4, MAOB, GSTM2, GPX3, and COL4A6
Gene ontology terms analysis of DNA methylation-driven genes obtained from GEO database
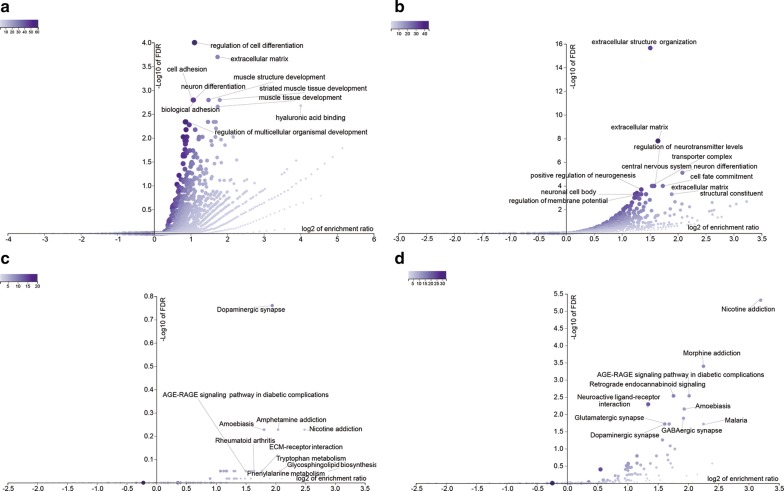
GO term enrichment analysis was perform based on DNA methylation-driven genes obtained from GEO database. The results of GO analyses demonstrated that DNA methylation-driven genes in GSE112047 were mainly enriched in regulation of cell differentiation, extracellular matrix, cell adhesion, muscle structure development, and neuron differentiation (Fig. 12a and Table 5). DNA methylation-driven genes in GSE76938 were mainly enriched in extracellular structure organization, extracellular matrix, central nervous system neuron differentiation, regulation of neurotransmitter levels, and cell fate commitment (Fig. 12b and Table 5).
Fig. 12.
Results of enriched GO terms and pathways in GSE112047 and GSE76938 datasets. Representative enriched GO terms in GSE112047 (a) and GSE76938 (b) datasets and representative pathways in GSE112047 (c) and GSE76938 (d) datasets
Table 5.
| Gene set | Description | Size | Expect | Ratio | p value | FDR |
|---|---|---|---|---|---|---|
| GSE112047 | ||||||
| GO:0045595 | Regulation of cell differentiation | 1699 | 28.866 | 2.1479 | 5.48E−09 | 0.0001 |
| GO:0031012 | Extracellular matrix | 496 | 8.4271 | 3.3226 | 3.00E−08 | 0.0002 |
| GO:0007155 | Cell adhesion | 1369 | 23.259 | 2.1067 | 5.21E−07 | 0.0016 |
| GO:0061061 | Muscle structure development | 610 | 10.364 | 2.7982 | 6.40E−07 | 0.0016 |
| GO:0030182 | Neuron differentiation | 1313 | 22.308 | 2.1069 | 9.19E−07 | 0.0016 |
| GO:0005540 | Hyaluronic acid binding | 22 | 0.3738 | 16.052 | 1.3596E−06 | 0.0021 |
| GO:2000026 | Regulation of multicellular organismal development | 1908 | 32.417 | 1.82 | 3.8179E−06 | 0.0046 |
| GSE76938 | ||||||
| GO:0043062 | Extracellular structure organization | 400 | 11.623 | 2.8392 | 7.43E−08 | 0 |
| GO:0031012 | Extracellular matrix | 496 | 14.412 | 3.1223 | 1.20E−11 | 1.56E−08 |
| GO:0021953 | Central nervous system neuron differentiation | 179 | 5.2012 | 4.2298 | 1.19E−08 | 7.73E−06 |
| GO:0001505 | Regulation of neurotransmitter levels | 335 | 9.7341 | 2.9792 | 1.70E−07 | 0.0001 |
| GO:0045165 | Cell fate commitment | 249 | 7.2352 | 3.3171 | 2.86E−07 | 0.0001 |
| GO:1990351 | Transporter complex | 332 | 9.6469 | 2.9025 | 4.73E−07 | 0.0001 |
| GO:0050769 | Positive regulation of neurogenesis | 447 | 12.989 | 2.5407 | 9.50E−07 | 0.0002 |
| GO:0043025 | Neuronal cell body | 486 | 14.122 | 2.4076 | 2.17E−06 | 0.0004 |
| GO:0005201 | Extracellular matrix structural constituent | 158 | 4.591 | 3.7029 | 3.55E−06 | 0.0005 |
| GO:0042391 | Regulation of membrane potential | 414 | 12.03 | 2.4938 | 4.34E−06 | 0.0005 |
KEGG pathway analysis of DNA methylation-driven genes obtained from GEO
KEGG enrichment analysis was perform based on DNA methylation-driven genes obtained from GEO database. The results of KEGG analyses demonstrated that DNA methylation-driven genes in GSE112047 were mainly enriched in Dopaminergic synapse, Nicotine addiction, and Amphetamine addiction pathways (Fig. 12c and Table 6). DNA methylation-driven genes in GSE76938 were mainly enriched in Nicotine addiction, Morphine addiction, and Retrograde endocannabinoid signaling pathways (Fig. 12d and Table 6).
Table 6.
| Gene set | Description | Size | Expect | Ratio | p value | FDR |
|---|---|---|---|---|---|---|
| GSE112047 | ||||||
| hsa04728 | Dopaminergic synapse | 131 | 2.3422 | 3.8426 | 0.0005 | 0.1734 |
| hsa05033 | Nicotine addiction | 40 | 0.7152 | 5.5931 | 0.0054 | 0.5917 |
| hsa05031 | Amphetamine addiction | 68 | 1.2158 | 4.1126 | 0.0072 | 0.5917 |
| hsa05146 | Amoebiasis | 96 | 1.7164 | 3.4957 | 0.0073 | 0.5917 |
| hsa04512 | ECM-receptor interaction | 82 | 1.4661 | 3.4104 | 0.0154 | 0.8913 |
| hsa05323 | Rheumatoid arthritis | 90 | 1.6091 | 3.1073 | 0.0222 | 0.8913 |
| hsa00604 | Glycosphingolipid biosynthesis | 15 | 0.2682 | 7.4574 | 0.0286 | 0.8913 |
| hsa04933 | AGE-RAGE signaling pathway in diabetic complications | 99 | 1.77 | 2.8248 | 0.0318 | 0.8913 |
| hsa00380 | Tryptophan metabolism | 40 | 0.7152 | 4.1948 | 0.0341 | 0.8913 |
| hsa00360 | Phenylalanine metabolism | 17 | 0.3039 | 6.5801 | 0.0362 | 0.8913 |
| GSE76938 | ||||||
| hsa05033 | Nicotine addiction | 40 | 1.1993 | 9.1721 | 1.47E−08 | 4.8E−06 |
| hsa05032 | Morphine addiction | 91 | 2.7284 | 4.7647 | 2.68E−06 | 0.0004 |
| hsa04723 | Retrograde endocannabinoid signaling | 148 | 4.4374 | 3.3804 | 0 | 0.0029 |
| hsa04933 | AGE-RAGE signaling pathway in diabetic complications | 99 | 2.9682 | 4.0428 | 0 | 0.0029 |
| hsa04080 | Neuroactive ligand-receptor interaction | 277 | 8.305 | 2.5286 | 0.0001 | 0.0051 |
| hsa05146 | Amoebiasis | 96 | 2.8783 | 3.8217 | 0.0001 | 0.007 |
| hsa04727 | GABAergic synapse | 88 | 2.6384 | 3.7901 | 0.0003 | 0.013 |
| hsa04728 | Dopaminergic synapse | 131 | 3.9277 | 3.0553 | 0.0005 | 0.0191 |
| hsa05144 | Malaria | 49 | 1.4691 | 4.7647 | 0.0006 | 0.0191 |
| hsa04724 | Glutamatergic synapse | 114 | 3.418 | 3.2183 | 0.0006 | 0.0191 |
Validation of MAOB and RTP4 expression in the Human Protein Atlas and TCGA
The results of stains on normal prostate tissues demonstrated that the MAOB (Fig. 13a–c, patient id 1938, 2053, and 2098) and RTP4 were highly expressed in normal prostate tissues. With respect to MAOB, the staining was not detected and the intensity was negative in low grade prostate (Patient id 3910) adenocarcinoma (Fig. 13d). Also, the staining was not detected and the intensity was negative in high grade prostate (Patient id 3561) adenocarcinoma (Fig. 13e).
Fig. 13.
Validation of MAOB and RTP4 expression in the Human Protein Atlas. With respect to MAOB, when compared with normal prostate tissues (a–c), the results demonstrated that the staining was not detected and the intensity was negative in low grade (d) and high grade (e) prostate adenocarcinoma, respectively. Also, in terms of RTP4, when compared with normal prostate tissues (f–h), the results demonstrated that the staining was low and the intensity was weak in low grade (i) and high grade (j) prostate adenocarcinoma
Plus, the results of stains on normal prostate tissues demonstrated that the RTP4 (Fig. 13f–h, patient id 1798, 1984, and 3497) were highly expressed in normal prostate tissues. In terms of RTP4, the staining was low and the intensity was weak in low grade prostate (Patient id 4525) adenocarcinoma (Fig. 13i). The staining was low and the intensity was weak in high grade prostate (Patient id 4347) adenocarcinoma (Fig. 13j). Methylation status and correlation between genes expression and DNA methylation of MAOB and RTP4 were demonstrated in Fig. 14a, b.
Fig. 14.
Methylation status and correlation between genes expression and DNA methylation of MAOB (a) and RTP4 (b). Average β-values are presented on the x-axis, log2 FPKM gene expression values are presented on y-axis
Discussion
Epigenetic changes and modifications are a crucial component of initiation and progression of tumorigenesis [14]. DNA methylation has been most studied and hypermethylaiton is associated with a silencing effect on tumor suppressor genes. Previous studies [15–17] reported that the modification of the methylation status of specific genes has been associated with worse prognosis, which demonstrated that the modification of epigenetics may be involved in the progression of tumorigenesis.
Previous studies reveals that DNA methylation plays an important role in the development of prostate cancer and associates with adverse clinical outcomes. The methylation state of promoters of specific genes were also involved in the development of prostate cancer [11, 18, 19]. Larsen et al. [20] reported that DNA-methylation analysis of urine cells captured by microfiltration provides a novel tool for noninvasive detection of high-grade prostate cancer.
The novel genes involved in the epigenetic regulation of prostate cancer could be identified by using high-throughput arrays [7, 9, 18]. We aimed to elucidate the role and importance of DNA methylation in prostate cancer by analyzing The Cancer Genome Atlas Project. In this study, a model-based tool (MethyMix) was used to identify key genes with aberrant methylation and gene expression was linked to aberrant methylation. In this study, the top 3 hypermethylated genes were demonstrated including HIST1H2BH, FAM200A, and ZFP36L2 and the top 3 hypomethylated genes were also demonstrated including TAF1D, TMEM87A, and KLK2.
The GO term analysis revealed that the differentially expressed DNA methylation driven genes were involved in oxidation–reduction process, extracellular exosome, electron carrier activity, response to reactive oxygen species, and aldehyde dehydrogenase [NAD(P)+] activity. Furthermore, the enriched KEGG pathway of the differentially expressed DNA methylation driven genes including drug metabolism—cytochrome P450, phenylalanine metabolism, histidine metabolism, glutathione metabolism, and tyrosine metabolism. PPI analysis demonstrated that hub genes were IFITM1, RTP4, ACSF2, GSTM2, GSTM1, ACOX2, COL4A6, ITGA2, AKR1B1, NPY, CFTR, GPX7, ALDH3A1, CRYZ, ALDH2, MAOB, GSTP1, GPX3, XAF1, and BST2, which might play important roles in DNA methylation in prostate cancer patients. We then overlapped the differentially methylated genes and identified a common list of 6 methylated genes including AKR1B1, RTP4, MAOB, GSTM2, GPX3, and COL4A6.
In terms of GSTM2, Angulo et al. [21] revealed that GSTM2 hypermethylation could be used to predict biochemical recurrence after radical prostatectomy, which suggested that epigenetic silencing of GSTM2 played an important role in involving biochemical recurrence. Plus, Ashour et al. [22] demonstrated that GSTM2 was hypermethylated in PCa and was simultaneously methylated in 40.9% if the PCa, which revealed that epigenetic silencing of GSTM2 is a common event in PCa. Maldonado et al. [23] revealed that GPX3 was aberrantly methylated and silenced in PCa tissues and had tumor suppressor activity in PCa cell lines. Plus, Lin et al. [24] revealed that GPX3, as a DNA methylation-silenced tumor suppressor gene, was hypermethylated in PCa. Strand et al. [25] stated that hypermethylation of COL4A6 could be treated as a frequent target in PCa. Ikeda et al. [26] demonstrated that hypermethylation of COL4A5 was one of the events that was responsible for the development of colorectal cancer.
With respect to AKR1B1, Theresa et al. [27] stated that AKR1B1 promoter methylation proved to be commonly methylated in breast cancer. Also, Wei et al. [28] demonstrated that AKR1B1 could be potential screening markers of colorectal carcinoma. However, the relationship between AKR1B1 methylation and PCa has not been elucidated yet. To the best of our knowledge, RTP4 and MAOB have not been reported to be associated with DNA methylation in the occurrence and development of cancer, which means RTP4 and MAOB could be regarded as potential targets for the new therapeutic managements in prostate cancer. The Human Protein Atlas validated the staining and intensity of RTP4 and MAOB in PCa tissue, the results were consistent with bioinformatic analysis that MAOB and RTP4 may be novel biomarkers in PCa.
In this study, GO term enrichment analysis showed that extracellular exosome was associated with DNA methylation in prostate cancer. Huang et al. [29] demonstrated that extracellular exosomes, especially plasma exosomes, containing miR-1290 and miR-375 may serves as promising prognostic biomarkers for castration-resistant prostate cancer (CRPC). Bryzgunova et al. [30] also demonstrated that extracellular vesicles founded from urine showed a high specificity and sensitivity in distinguishing prostate cancer patients from healthy donors. GO term enrichment analysis also revealed that oxidation–reduction process was also involved in DNA methylation of prostate cancer. Schlaepfer et al. [31] revealed that inhibition of lipid oxidation plays a crucial role in elevating glucose metabolism of PCa cells. Liu et al. [32] also demonstrated that oxidation–reduction reactions was associated with mitochondria and mitochondrial damage in DU145 and PC3 prostate cancer cell lines.
In this study, KEGG pathway enrichment analysis showed that cytochrome P450 pathway was involved in the methylation process in PCa. Chen et al. [33] demonstrated that cytochrome P450 (CYP) enzymes including CYP2R1, CYP27B1 and CYP24A1 were involved in the development and progression of PCa and were treated as promising targets in the treatment of PCa. Mandić et al. [34] also revealed that CYP1A1 can bind to DNA and induced the carcinogenesis of prostate cancer via involving in the various endogenous and environmental reactive compounds. The phenylalanine metabolism was also found to be participant in the methylation process in PCa. Gueron et al. [35] reported that the concomitant resistance (CR) phenomenon occurs in murine prostate cancer accompanied with ROS-damaged phenylalanine and the CR phenomenon was reversed when the phenylalanine were injected into mice. Lapek et al. demonstrated that the histidine-phosphorylated proteins with diverse functions including metabolism, protein folding, and motility play important roles in the development and progression of PCa.
Conclusion
Methylated hub genes, including MAOB and RTP4, can be regarded as novel biomarkers for accurate PCa diagnosis and treatment. Further studies are needed to draw more attention to the roles of these hub genes in the occurrence and development of PCa.
Methods
Data source
Expressing profiles of gene-specific DNA methylation data and clinical information of patients with PCa were downloaded from The Cancer Genome Atlas (TCGA) database (https://tcga-data.nci.nih.gov/tcga/) [36]. The clinicopathological information of the patients with prostate cancer were also extracted. Illumina Human Methylation 450 Beadchip (450 K array) was used to measure the DNA methylation data. A total of 482,421 CpG sites throughout the genome would be assessed [37]. We downloaded level 3 methylation data and level 3 RNA-seq data from the TCGA data portal by using the TCGA-Assembler [38]. Two gene methylation datasets (GSE112047 and GSE76938) were downloaded from the Gene Expression Omnibus (GEO, https://www.ncbi.nlm.nih.gov/geo/). The gene methylation microarray datasets were composed of 16 and 63 normal prostate tissues, respectively, and 16 and 73 PCa tumor tissues, respectively (GPL13534 Illumina HumanMethylation450 BeadChip).
Identification of DNA methylation-driven genes
The expression and methylation were analyzed with R 3.4.4 software (https://www.r-project.org/). For the data from TCGA, the R package MethylMix was applied to perform an analysis integrating gene expression data and methylation data. MethylMix was designed to identify gene expression that were correlated with methylation events. A total of three parts of MethylMix analysis were described as previous studies [39, 40]. For the data from GEO, the R package limma was applied to perform analysis to identify the DMEs. Also, VennDiagram package in R software was used to identify overlapping DNA methylation-driven genes.
Gene ontology analysis
Gene ontology analysis (GO) (http://david.abcc.ncifcrf.gov/) is used for annotating differentially methylated DNA methylation-driven genes [41]. The Database for Annotation, Visualization, and Integrated Discovery (DAVID) (http://david.abcc.ncifcrf.gov/) tool was used for obtaining the enriched GO terms of differentially methylated DNA methylation-driven genes based on the hypergeometric distribution to compute values, which was described as previous study [42]. FDR < 0.05 was set as the threshold value.
Pathway analysis
The gene lists found to be statistically significant by MethylMix were used to perform pathway analysis. The Kyoto Encyclopedia of Genes and Genomes (KEGG; http://www.kegg.jp/) was used to perform the pathway enrichment analysis. Furthermore, the ConsensusPathDB was also used to validate the enriched pathway results. ConsensusPathDB was used to performed pathway analysis as previous studies described [40, 43]. The default settings were as follow: minimum overlap and p value cutoff of 0.01.
Integration of protein–protein interaction (PPI) network
Search Tool for the Retrieval of Interacting Genes (STRING) database (version 10.5) was used to evaluated the PPI information. Differentially methylated DNA methylation-driven genes were mapped to STRING to evaluate the interactive relationships of these genes. Cytoscape software (version 3.6.1) was used to constructed the PPI networks.
Validation of the candidate hub genes screened from TCGA in GEO database and the Human Protein Atlas
To confirm the candidate hub genes we obtained, two datasets (GSE76938 and GSE112047) was downloaded from GEO database to validate the methylation levels of these candidate hub genes. To confirm the expression of these hub genes in PCa tissues, immunohistochemistry of these hub genes were evaluated by the Human Protein Atlas (http://www.proteinatlas.org). The expressions of MAOB and RTP4 were validated in The Human Protein Atlas.
Supplementary information
Additional file 1: Table S1. A gene list of 266 DNA methylation driven genes in TCGA.
Additional file 2: Table S2. A gene list of 369 differentially methylated genes and 594 differentially methylated genes in GSE112047 and GSE76938.
Acknowledgements
None.
Abbreviations
- TCGA
The Cancer Genome Atlas
- GEO
Gene Expression Omnibus
- KEGG
Kyoto Encyclopedia of Genes and Genomes Pathway
- PPI
the protein–protein interaction
- PCa
prostate cancer
- DAVID
The Database for Annotation, Visualization, and Integrated Discovery
- STRING
Search Tool for the Retrieval of Interacting Genes Database
- CRPC
castration-resistant prostate cancer
- CYP
cytochrome P450
- CR
concomitant resistance
Authors’ contributions
Conceived and designed the study: NX, XYX. Collected the literature: NX, HC, WTS, YCL. Wrote the manuscript: YCL, ZBK, YPW. Revised the manuscript: ZBK, YPW, XT, SHC, QSZ. All authors read and approved the final manuscript.
Funding
This study was supported by Natural Science Foundation of Fujian Province (Grant Number: 2017J01197), the Joint Foundation of Fujian Province for Science and Technology Innovative Research Project (Grant Number: 2017Y9093), Foundation of Fujian Provincial Department Of Finance (Grant Number: 2018B011), Startup Fund for scientific research, Fujian Medical University (Grant Number: 2017XQ2041), and the Youth Foundation of Health and Family Planning Commission of Fujian Province, China (Grant Number: 2018-1-51).
Availability of data and materials
All data was obtained from The Cancer Genome Atlas (TCGA, https://tcga-data.nci.nih.gov/tcga/) and Gene Expression Omnibus (GEO, https://www.ncbi.nlm.nih.gov/geo/).
Ethics approval and consent to participate
Not applicable.
Consent for publication
All authors have read and approved the content and agree to submit for consideration for publication in the journal.
Competing interests
The authors declare that they have no competing interests.
Footnotes
Publisher's Note
Springer Nature remains neutral with regard to jurisdictional claims in published maps and institutional affiliations.
Ning Xu Yu-Peng Wu Zhi-Bin Ke and Ying-Chun Liang contributed equally to this work
Contributor Information
Ning Xu, Email: drxun@fjmu.edu.cn.
Yu-Peng Wu, Email: ebong@fjmu.edu.cn.
Zhi-Bin Ke, Email: dr.urology@fjmu.edu.cn.
Ying-Chun Liang, Email: drliang@fjmu.edu.cn.
Hai Cai, Email: chdoctor@fjmu.edu.cn.
Wen-Ting Su, Email: suwenting@fjmu.edu.cn.
Xuan Tao, Email: 417394135@qq.com.
Shao-Hao Chen, Email: shaohao.chen@fjmu.edu.cn.
Qing-Shui Zheng, Email: zhengqingshui@fjmu.edu.cn.
Yong Wei, Phone: +86-059187981687, Email: weiyong2017@fjmu.edu.cn.
Xue-Yi Xue, Phone: +86-059187981687, Email: xuexueyi@fjmu.edu.cn.
Supplementary information
Supplementary information accompanies this paper at 10.1186/s12967-019-2065-2.
References
- 1.Wu Y, Wang A, Zhu B, et al. KIF18B promotes tumor progression through activating the Wnt/beta-catenin pathway in cervical cancer. OncoTargets Ther. 2018;11:1707–1720. doi: 10.2147/OTT.S157440. [DOI] [PMC free article] [PubMed] [Google Scholar]
- 2.Siegel RL, Miller KD, Jemal A. Cancer statistics, 2018. CA Cancer J Clin. 2018;68(1):7–30. doi: 10.3322/caac.21442. [DOI] [PubMed] [Google Scholar]
- 3.Zhang W, Shu P, Wang S, et al. ZNF154 is a promising diagnosis biomarker and predicts biochemical recurrence in prostate cancer. Gene. 2018;675:136–143. doi: 10.1016/j.gene.2018.06.104. [DOI] [PubMed] [Google Scholar]
- 4.Greene KL, Albertsen PC, Babaian RJ, et al. Prostate specific antigen best practice statement: 2009 update. J Urol. 2013;189(1 Suppl):S2–S11. doi: 10.1016/j.juro.2012.11.014. [DOI] [PubMed] [Google Scholar]
- 5.Zhao S, Leonardson A, Geybels MS, et al. A five-CpG DNA methylation score to predict metastatic-lethal outcomes in men treated with radical prostatectomy for localized prostate cancer. Prostate. 2018 doi: 10.1002/pros.23667. [DOI] [PMC free article] [PubMed] [Google Scholar]
- 6.Wu J, Wilson KM, Stampfer MJ, Willett WC, Giovannucci EL. A 24-year prospective study of dietary alpha-linolenic acid and lethal prostate cancer. Int J Cancer. 2018;142(11):2207–2214. doi: 10.1002/ijc.31247. [DOI] [PMC free article] [PubMed] [Google Scholar]
- 7.Wang Y, Qin T, Hu W, Chen B, Dai M, Xu G. Genome-wide methylation patterns in androgen-independent prostate cancer cells: a comprehensive analysis combining MeDIP-bisulfite, RNA, and microRNA sequencing data. Genes. 2018 doi: 10.3390/genes9010032. [DOI] [PMC free article] [PubMed] [Google Scholar]
- 8.Ning B, Li W, Zhao W, Wang R. Targeting epigenetic regulations in cancer. Acta Biochim Biophys Sin. 2016;48(1):97–109. doi: 10.1093/abbs/gmv116. [DOI] [PMC free article] [PubMed] [Google Scholar]
- 9.Zhao S, Geybels MS, Leonardson A, et al. Epigenome-wide tumor DNA methylation profiling identifies novel prognostic biomarkers of metastatic-lethal progression in men diagnosed with clinically localized prostate cancer. Clin Cancer Res. 2017;23(1):311–319. doi: 10.1158/1078-0432.CCR-16-0549. [DOI] [PMC free article] [PubMed] [Google Scholar]
- 10.Strand SH, Orntoft TF, Sorensen KD. Prognostic DNA methylation markers for prostate cancer. Int J Mol Sci. 2014;15(9):16544–16576. doi: 10.3390/ijms150916544. [DOI] [PMC free article] [PubMed] [Google Scholar]
- 11.Park JY. Promoter hypermethylation as a biomarker in prostate adenocarcinoma. Methods Mol Biol. 2015;1238:607–625. doi: 10.1007/978-1-4939-1804-1_32. [DOI] [PubMed] [Google Scholar]
- 12.Chiam K, Ricciardelli C, Bianco-Miotto T. Epigenetic biomarkers in prostate cancer: current and future uses. Cancer Lett. 2014;342(2):248–256. doi: 10.1016/j.canlet.2012.02.011. [DOI] [PubMed] [Google Scholar]
- 13.Graca I, Pereira-Silva E, Henrique R, Packham G, Crabb SJ, Jeronimo C. Epigenetic modulators as therapeutic targets in prostate cancer. Clin Epigenet. 2016;8:98. doi: 10.1186/s13148-016-0264-8. [DOI] [PMC free article] [PubMed] [Google Scholar]
- 14.Sharma PK, Sharma R, Vijay MK, Tiwari P, Goel A, Kundu AK. Emphysematous pyelonephritis: our experience with conservative management in 14 cases. Urol Ann. 2013;5(3):157–162. doi: 10.4103/0974-7796.115734. [DOI] [PMC free article] [PubMed] [Google Scholar]
- 15.Carleton NM, Lee G, Madabhushi A, Veltri RW. Advances in the computational and molecular understanding of the prostate cancer cell nucleus. J Cell Biochem. 2018;119(9):7127–7142. doi: 10.1002/jcb.27156. [DOI] [PMC free article] [PubMed] [Google Scholar]
- 16.Komura K, Yoshikawa Y, Shimamura T, et al. ATR inhibition controls aggressive prostate tumors deficient in Y-linked histone demethylase KDM5D. J Clin Investig. 2018;128(7):2979–2995. doi: 10.1172/JCI96769. [DOI] [PMC free article] [PubMed] [Google Scholar]
- 17.Giudice A, Montella M, Boccellino M, et al. Epigenetic changes induced by green tea catechins a re associated with prostate cancer. Curr Mol Med. 2017;17(6):405–420. doi: 10.2174/1566524018666171219101937. [DOI] [PubMed] [Google Scholar]
- 18.Haldrup C, Pedersen AL, Ogaard N, et al. Biomarker potential of ST6GALNAC3 and ZNF660 promoter hypermethylation in prostate cancer tissue and liquid biopsies. Mol Oncol. 2018;12(4):545–560. doi: 10.1002/1878-0261.12183. [DOI] [PMC free article] [PubMed] [Google Scholar]
- 19.Chen LN, Rubin RS, Othepa E, et al. Correlation of HOXD3 promoter hypermethylation with clinical and pathologic features in screening prostate biopsies. Prostate. 2014;74(7):714–721. doi: 10.1002/pros.22790. [DOI] [PMC free article] [PubMed] [Google Scholar]
- 20.Larsen LK, Jakobsen JS, Abdul-Al A, Guldberg P. Noninvasive detection of high-grade prostate cancer by DNA-methylation analysis of urine cells captured by microfiltration. J Urol. 2018;200(4):749–757. doi: 10.1016/j.juro.2018.04.067. [DOI] [PubMed] [Google Scholar]
- 21.Angulo JC, Lopez JI, Dorado JF, Sanchez-Chapado M, Colas B, Ropero S. A DNA hypermethylation profile independently predicts biochemical recurrence following radical prostatectomy. Urol Int. 2016;97(1):16–25. doi: 10.1159/000446446. [DOI] [PubMed] [Google Scholar]
- 22.Ashour N, Angulo JC, Andres G, et al. A DNA hypermethylation profile reveals new potential biomarkers for prostate cancer diagnosis and prognosis. Prostate. 2014;74(12):1171–1182. doi: 10.1002/pros.22833. [DOI] [PubMed] [Google Scholar]
- 23.Maldonado L, Brait M, Loyo M, et al. GSTP1 promoter methylation is associated with recurrence in early stage prostate cancer. J Urol. 2014;192(5):1542–1548. doi: 10.1016/j.juro.2014.04.082. [DOI] [PMC free article] [PubMed] [Google Scholar]
- 24.Lin HY, Kuo YC, Weng YI, et al. Activation of silenced tumor suppressor genes in prostate cancer cells by a novel energy restriction-mimetic agent. Prostate. 2012;72(16):1767–1778. doi: 10.1002/pros.22530. [DOI] [PMC free article] [PubMed] [Google Scholar]
- 25.Strand SH, Switnicki M, Moller M, et al. RHCG and TCAF1 promoter hypermethylation predicts biochemical recurrence in prostate cancer patients treated by radical prostatectomy. Oncotarget. 2017;8(4):5774–5788. doi: 10.18632/oncotarget.14391. [DOI] [PMC free article] [PubMed] [Google Scholar]
- 26.Ikeda K, Iyama K, Ishikawa N, et al. Loss of expression of type IV collagen alpha5 and alpha6 chains in colorectal cancer associated with the hypermethylation of their promoter region. Am J Pathol. 2006;168(3):856–865. doi: 10.2353/ajpath.2006.050384. [DOI] [PMC free article] [PubMed] [Google Scholar]
- 27.Benezeder T, Tiran V, Treitler AAN, et al. Multigene methylation analysis of enriched circulating tumor cells associates with poor progression-free survival in metastatic breast cancer patients. Oncotarget. 2017;8(54):92483–92496. doi: 10.18632/oncotarget.21426. [DOI] [PMC free article] [PubMed] [Google Scholar]
- 28.Wei J, Li G, Dang S, Zhou Y, Zeng K, Liu M. Discovery and validation of hypermethylated markers for colorectal cancer. Dis Markers. 2016;2016:2192853. doi: 10.1155/2016/2192853. [DOI] [PMC free article] [PubMed] [Google Scholar]
- 29.Huang X, Yuan T, Liang M, et al. Exosomal miR-1290 and miR-375 as prognostic markers in castration-resistant prostate cancer. Eur Urol. 2015;67(1):33–41. doi: 10.1016/j.eururo.2014.07.035. [DOI] [PMC free article] [PubMed] [Google Scholar]
- 30.Bryzgunova OE, Zaripov MM, Skvortsova TE, et al. Comparative study of extracellular vesicles from the urine of healthy individuals and prostate cancer patients. PLoS ONE. 2016;11(6):e0157566. doi: 10.1371/journal.pone.0157566. [DOI] [PMC free article] [PubMed] [Google Scholar]
- 31.Schlaepfer IR, Glode LM, Hitz CA, et al. Inhibition of lipid oxidation increases glucose metabolism and enhances 2-deoxy-2-[(18)F]fluoro-d-glucose uptake in prostate cancer mouse xenografts. Mol Imaging Biol. 2015;17(4):529–538. doi: 10.1007/s11307-014-0814-4. [DOI] [PMC free article] [PubMed] [Google Scholar]
- 32.Liu X, Fu YM, Meadows GG. Differential effects of specific amino acid restriction on glucose metabolism, reduction/oxidation status and mitochondrial damage in DU145 and PC3 prostate cancer cells. Oncol Lett. 2011;2(2):349–355. doi: 10.3892/ol.2011.237. [DOI] [PMC free article] [PubMed] [Google Scholar]
- 33.Chen TC, Sakaki T, Yamamoto K, Kittaka A. The roles of cytochrome P450 enzymes in prostate cancer development and treatment. Anticancer Res. 2012;32(1):291–298. [PubMed] [Google Scholar]
- 34.Mandic S, Horvat V, Marczi S, Lukic I, Galic J. Association study of cytochrome P450 1A1*2A polymorphism with prostate cancer risk and aggressiveness in Croatians. Coll Antropol. 2014;38(1):141–146. [PubMed] [Google Scholar]
- 35.Gueron G, Anselmino N, Chiarella P, et al. Game-changing restraint of Ros-damaged phenylalanine, upon tumor metastasis. Cell Death Dis. 2018;9(2):140. doi: 10.1038/s41419-017-0147-8. [DOI] [PMC free article] [PubMed] [Google Scholar]
- 36.Comprehensive molecular characterization of urothelial bladder carcinoma Nature. 2014;507(7492):315–322. doi: 10.1038/nature12965. [DOI] [PMC free article] [PubMed] [Google Scholar]
- 37.Bibikova M, Barnes B, Tsan C, et al. High density DNA methylation array with single CpG site resolution. Genomics. 2011;98(4):288–295. doi: 10.1016/j.ygeno.2011.07.007. [DOI] [PubMed] [Google Scholar]
- 38.Zhu Y, Qiu P, Ji Y. TCGA-assembler: open-source software for retrieving and processing TCGA data. Nat Methods. 2014;11(6):599–600. doi: 10.1038/nmeth.2956. [DOI] [PMC free article] [PubMed] [Google Scholar]
- 39.Gevaert O. MethylMix: an R package for identifying DNA methylation-driven genes. Bioinformatics. 2015;31(11):1839–1841. doi: 10.1093/bioinformatics/btv020. [DOI] [PMC free article] [PubMed] [Google Scholar]
- 40.Sanford T, Meng MV, Railkar R, Agarwal PK, Porten SP. Integrative analysis of the epigenetic basis of muscle-invasive urothelial carcinoma. Clin Epigenet. 2018;10(1):19. doi: 10.1186/s13148-018-0451-x. [DOI] [PMC free article] [PubMed] [Google Scholar]
- 41.Benjamini Y, Hochberg Y. Controlling the false discovery rate: a practical and powerful approach to multiple testing. J R Stat Soc. 1995;57(1):289–300. [Google Scholar]
- 42.Su P, Wen S, Zhang Y, et al. Identification of the key genes and pathways in esophageal carcinoma. Gastroenterol Res Pract. 2016;2016(3):2968106. doi: 10.1155/2016/2968106. [DOI] [PMC free article] [PubMed] [Google Scholar]
- 43.Kamburov A, Wierling C, Lehrach H, Herwig R. ConsensusPathDB—a database for integrating human functional interaction networks. Nucleic Acids Res. 2009;37(1):D623. doi: 10.1093/nar/gkn698. [DOI] [PMC free article] [PubMed] [Google Scholar]
Associated Data
This section collects any data citations, data availability statements, or supplementary materials included in this article.
Supplementary Materials
Additional file 1: Table S1. A gene list of 266 DNA methylation driven genes in TCGA.
Additional file 2: Table S2. A gene list of 369 differentially methylated genes and 594 differentially methylated genes in GSE112047 and GSE76938.
Data Availability Statement
All data was obtained from The Cancer Genome Atlas (TCGA, https://tcga-data.nci.nih.gov/tcga/) and Gene Expression Omnibus (GEO, https://www.ncbi.nlm.nih.gov/geo/).


