Abstract
Chronic pain is associated with brain atrophy with limited evidence of its impact in the older adult’s brain. We aimed to determine the associations between chronic pain and a brain aging biomarker in persons 60 to 83 years old. Participants of the NEPAL study (n=47) completed demographic, psychological, and pain assessments followed by a QST battery and a T1-weighted MRI. We estimated a brain-predicted age difference that has been previously reported to predict overall mortality risk (brain-PAD; calculated as brain-predicted age minus chronological age), using an established machine-learning model. ANCOVAs and Pearson/Spearman correlations were used to determine associations of brain-PAD with pain, somatosensory and psychological function. Individuals with chronic pain (n=33) had “older” brains for their age compared to those without (n=14, F(1,41)=4.9, p=0.033). Greater average worst pain intensity was associated with an “older” brain (r=0.464, p=0.011). Among participants with chronic pain, those that reported having pain treatments during the past 3 months had “younger” brains compared to those that did not (F(1,27)=12.3, p=0.002). An “older” brain was significantly associated with decreased vibratory (r=0.323, p=0.033) and thermal (r=0.345, p=0.023) detection, deficient endogenous pain inhibition (F(1,25)=4.6, p=0.044), lower positive affect (r =−0.474, p=0.005), a less agreeable (r=−0.439, p=0.020), and less emotionally stable personality (r=−0.387, p=0.042). Our findings suggest that chronic pain is associated with added “age-like” brain atrophy in relatively healthy, community-dwelling older individuals and future studies are needed to determine the directionality of our findings. A brain aging biomarker may help identify people with chronic pain at greater risk of functional decline and poorer health outcomes.
INTRODUCTION
Over 1.5 billion people worldwide suffer from chronic pain and more Americans are affected by chronic pain than by diabetes, heart disease and cancer combined [39]. In particular, epidemiological evidence suggests an age-related increase in pain prevalence with back and knee pain as the most commonly reported pain in those over 65 years of age [38]. Chronic pain in older individuals is a growing public health problem since effective treatments are lacking and pain detrimentally impacts physical and cognitive function, ultimately decreasing quality of life and overall well-being.
Pain is associated with both direct (i.e., the experience of pain) and indirect effects on the brain [35]. Neuroimaging studies have established the prominent role of the brain in pain perception and modulation and in the integration of sensory, motor, emotional and cognitive components that give rise to the complex, individualized pain experience. While most chronic pain conditions are associated with changes to brain structure and function [1,31,35,36], these structures are similarly impacted by normal as well as pathological chronological aging processes. Indeed, chronological aging has been associated with both global and spatially-localized changes to brain structure and function which may be very similar to brain changes reported in chronic pain states. In addition, several preliminary investigations in older adults with and without low back pain (n=8/group) suggest that chronic pain may negatively impact the brain above and beyond age-related effects (i.e., accelerated brain aging) [2–4].
Recently, multivariate methods have been developed to define statistical models of healthy brain aging. Using machine-learning analysis of structural neuroimaging data, chronological age can be accurately predicted in healthy individuals [16]. Using this method, older predicted brain age (as compared to chronological age) has been reported in Alzheimer’s disease [15], mild cognitive impairment [18], HIV [9], schizophrenia [29], and after traumatic brain injury [7]. Meanwhile, protective factors, such as years of education, physical exercise and practicing meditation, have been associated with a positive influence on brain aging [6]. Furthermore, recent work found that having an older-predicted brain age was associated with weaker grip strength, poorer lung function, slower walking speed, lower fluid intelligence, higher allostatic load and increased overall mortality risk measured prospectively [8].
In the present investigation, we employed a neuroimaging-derived brain biomarker to investigate the association between brain aging and chronic pain in community-dwelling individuals aged 60 to 83. Consistent with previous work [8], we estimated a brain-predicted age difference (brain-PAD; calculated as brain-predicted age minus chronological age) using structural neuroimaging (T1-weighted magnetic resonance imaging (MRI)), processed through an established analysis pipeline. The pipeline included comparing voxel-wise gray and white matter volume images to a statistical model that accurately predicts chronological age from neuroimaging data in healthy people; trained on n=2,646 independent healthy adults aged 18–90 years. The primary hypothesis of the present study was that older adults reporting chronic pain will have a greater brain-PAD (i.e., older brain, accelerated brain aging) compared to older adults that did not report chronic pain during the past three months. In addition, we also tested exploratory associations between brain-PAD with clinical pain characteristics, as well as somatosensory and psychological function.
METHODS
Participants
Community-dwelling individuals over the age of 60 who were native English speakers were recruited as part of an ongoing project at the University of Florida (UF) studying the neurobiology of age-related differences in pain modulation and its impact on function (Neuromodulatory Examination of Pain and Mobility Across the Lifespan [NEPAL]). Potential participants were screened over the phone and again in person. Exclusionary criteria included: 1) Alzheimer’s, Parkinson’s or other condition directly impacting the brain; 2) serious psychiatric conditions (e.g., schizophrenia, major depression, bipolar disorder), 3) uncontrolled hypertension (blood pressure >150/95 mm Hg), heart failure, or history of acute myocardial infarction; 4) systemic rheumatic disorders (i.e., rheumatoid arthritis, systemic lupus erythematosus, fibromyalgia); 5) chronic opioid use; 6) magnetic resonance imaging (MRI) contraindications; 7) excessive anxiety regarding protocol procedures; 8) hospitalization within the preceding year for psychiatric illness; 9) HIV or AIDS; and 10) cognitive impairment (Modified Mini-Mental State Examination (3MS) score ≤ 77, [43]. Participants were recruited through posted fliers, newspaper ads, and word of mouth referrals. As the NEPAL study aims to recruit older individuals with and without chronic pain representative of the aging population, individuals were not specifically recruited for the presence of a pain condition. All procedures were reviewed and approved by the University of Florida’s Institutional Review Board and all participants provided verbal and written informed consent. For the current study, data presented are from three separate laboratory visits: 1) a health assessment session (i.e., demographic, general health, pain, and psychological information), 2) a quantitative sensory testing session, and 3) a neuroimaging session detailed below. Other measures including data from other study visits are not included in the present investigation.
Health Assessment Session
Upon verbal and written informed consent, participants completed questionnaires, which included general health and demographic information including all medications taken. Similar to our previous studies in older individuals [11], a trained research coordinator assessed prior and current health and pain history, including detailed information regarding smoking, drinking and exercise habits. The following instruments were also administered during this session to assess self-reported pain and psychological function:
Self-reported Pain: Participants were assigned to the pain group if they reported pain on most days during activities that included walking, using stairs, while in bed, sitting or lying, and standing on a daily basis during the past three months. This definition of chronic pain is consistent with the Task Force for the Classification of Chronic Pain consensus for the 11th version of the International Classification of Diseases (ICD-11) of the World Health Organization (WHO) [44]. Participants also completed a standardized pain history interview regarding the presence of pain across several body regions (i.e., head/face, neck, shoulders, arms, hands, chest, stomach, upper and lower back, leg, knees, and feet) using a validated body manikin [12,34]. Participants were asked to choose the location of their worst pain and asked about its duration, frequency during the past week, intensity on average, and how hard it was to deal with their worst pain. Participants were also asked if they received any treatments or tried any self-remedies (something they may have done at home) to relieve their worst pain during the past 3 months (Yes/No). Finally, all participants were queried regarding current medications.
Psychological and Emotional Function: The 20-item Center for Epidemiologic Studies Depression Scale (CES-D) questionnaire was used to measure the frequency of depressive symptoms during the past week on a 4-point Likert scale [40]. The Positive and Negative Affect Scale (PANAS) was also administered consisting of 20 items rated on a 5-point scale [10,47]. We asked the participants to report how they generally feel with high scores on positive affect reflecting enthusiasm, energy, and alertness, while higher scores on negative affect reflect distress and aversive mood states. The Ten Item Personality Measure (TIPI) is a brief 10-item measure of the Big Five (or Five-Factor Model) personality dimensions: Extraversion (E), Agreeableness (A), Conscientiousness (C), Emotional Stability (ES) and Openness to Experience (O). Each dimension is measured by two descriptors, one of each pair is reverse-scored. Participants rate themselves on a 7-point scale ranging from 1-disagree strongly to 7-agree strongly. The TIPI was created to be finished within a minute [22].
Quantitative Sensory Testing (QST) Session
QST was used to assess somatosensory function, similar to the methodology previously reported by our group in older individuals [11]. All QST procedures were performed in a quiet room with an approximate temperature between 21°C and 23°C. All subjects were seated in a comfortable chair with armrests and a semi-reclining back. Standardized testing was performed at the thenar eminence and on the first metatarsal head on all participants. An overview of the testing procedures was explained to the subject and for each different modality, specific instructions were delivered immediately before beginning the test. Measurement of a particular type of threshold was first demonstrated, and at least one practice trial was conducted to ensure that subjects understood the testing procedures. Vibratory and thermal detection and pain threshold measurements were obtained with the TSA-II Neurosensory Analyzer and accompanying software (Medoc Ltd., Ramat Yishai, Israel). The method of limits was used to obtain all detection thresholds.
Vibration: The handheld VSA-3000 circular probe (contact tip=1.22 cm2) of the Medoc system was used to measure vibratory thresholds for a 100 Hz stimulus frequency. Subjects were asked to indicate as soon as they felt the vibratory sensation. Three trials, separated by ~10 sec each, began at 0 μm at a rate of 0.5 μm/sec and increased until the subject indicated that the stimulus was felt or until the maximum amplitude of 130 μm was reached. The mean value across the three trials was calculated as the vibratory detection threshold for each site.
Thermal Detection: A 30 × 30 mm thermode connected to the TSA-II Neurosensory Analyzer was used to deliver thermal stimuli. Each trial began at 32°C and the temperature decreased (for cool) or increased (for warm) at a rate of 1°C/sec until the subject perceived the stimulus or until the stimulus reached the cutoff value (0°C for cool and 50°C for warm). Each trial was separated by ~10 sec. The average of threshold temperatures across four trials was calculated as detection threshold for each modality and test site.
Thermal Pain: Subjects were instructed to indicate as soon as the sensation changed from “just being cold to being painfully cold” or from “just being hot to being painfully hot.” Each trial began at 32°C and was either decreased (for cold pain) or increased (for heat pain) at a rate of 1°C/sec until pain threshold was reached or the cutoff value was reached (0°C for cold pain and 50°C for heat pain). Each trial was separated by at least 20 sec. The mean across three trials at each test site was calculated as the pain detection threshold.
Pressure Pain: Pressure pain thresholds were assessed on the quadriceps and trapezius muscles with the order of testing counterbalanced. For all test sites, a handheld digital pressure algometer (AlgoMed; Medoc) was applied at a constant rate of 30kPa/s. Participants were instructed to press a button when the pressure sensation “first became painful”. Application was repeated 3 times on each site to create a mean pressure pain threshold for that site. The maximum application pressure was 1000kPa based on safety considerations. For individuals reaching maximum pressure levels without reporting pain, a value of 1000 was assigned.
Conditioned Pain Modulation Procedure: A subset of participants completed a conditioned pain modulation (CPM) paradigm as recommended by Yarnitsky and colleagues [50]. For the test stimulus, heat was applied to the thenar eminence increasing at a rate of 1°C/sec and was discontinued by the subject at pain-40 (pain level of 40/100). The temperature required to produce pain-40 was recorded. The conditioning stimulus was cold-water immersion of the contralateral hand for 1 minute, which was reported by most participants as mild to moderately painful. The test stimulus was presented immediately after the conditioning stimulus (CS). A pain inhibition score was calculated as a first minus last temperature divided by first temperature (X 100) calculation whereby inhibition was denoted by a negative value, and pain facilitation by a positive value as recommended by expert consensus [50].
Neuroimaging Session
MRI data were collected at the University of Florida’s McKnight Brain Institute on the Advanced Magnetic Resonance Imaging and Spectroscopy (AMRIS) facility’s Philips (Best, the Netherlands) 3-Tesla scanner using a 32-channel radio-frequency coil. A high resolution, T1-weighted turbo field echo anatomical scan was collected using the following parameters: TR = 7.0 ms, TE = 3.2 ms, 170 slices acquired in a sagittal orientation, flip angle = 8 degrees, resolution = 1 mm3. Head movement was minimized via cushions positioned inside the head coil and instructions to participants.
Brain-predicted age biomarker
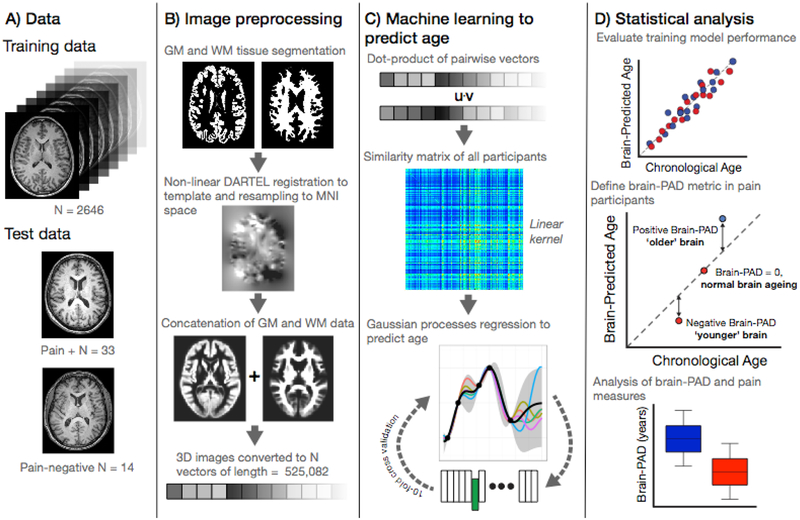
The brain aging biomarker used here was derived using a previously established ‘brain-age’ framework [6]. This involved training a machine-learning model to accurately predict chronological age from neuroimaging data in a training cohort comprised of 2,646 healthy individuals (age mean = 41.17 ± 19.69 years; age range = 18 – 90 years; males = 1,333; females = 1,313). This used segmented and spatially-normalized T1-weighted MRI scans as the predictor variables in a Gaussian Processes regression, with chronological age as the outcome variable. As per previous reports [8] model accuracy was high (assessed using ten-fold cross-validation), with a mean absolute error of 4.9 years and a correlation between chronological age and ‘brain-predicted’ age of r = 0.95. Then, using the regression model trained on the full independent dataset (n=2,646), brain-predicted age values were generated for the n=47 participants in the current study. The individual participants’ chronological age was then subtracted from this brain-predicted age value to generate a brain-predicted age difference (brain-PAD) score, which was used for further analysis. Neuroimaging data comprising the training dataset were obtained via publicly-available repositories [8] and were screened according to local study protocols to ensure that they were free of neurological and psychiatric disorders, had no history of head trauma and other major medical conditions. Ethical approval for each initial study and subsequent data sharing was verified for each data repository. Figure 1 summarizes brain-predicted age biomarker calculation.
Figure 1.
Study methods.
A) Data used in the study comprising the ‘brain-age’ training sample of n=2,646 healthy individuals and the current experiment cohort (n=47) comprising those with chronic pain (n=33) and those without (n=14).
B) Image pre-processing, applied to all images, used SPM12 software to segment T1-weighted MRIs into gray and white matter probability maps. These were then spatially-normalized using DARTEL non-linear registration to a custom template in MNI152 space, with 1.5mm3 voxels, using 4mm spatial smoothing. These normalized 3D images were converted into 1D vectors and the gray and white matter vectors concatenated.
C) Machine learning age prediction involved generating a linear kernel by calculating the dot-product of all pairs of image vectors across all participants, resulting in a similarity matrix. The similarity matrix was used as input into a Gaussian Processes regression to predict chronological from the image vectors. The model trained on the full training set was then applied to the n=47 participants from the chronic pain study to generate a brain-predicted age value for each participant.
D) Statistical analysis was conducted to evaluate performance of the regression model performance using ten-fold cross-validation. Brain-predicted age difference (brain-PAD) was then calculated for the chronic pain study participants; whereby chronological age was subtracted from brain-predicted age. Brain-PAD was then used for subsequent statistical analysis of pain-related variables.
Experimental Design and Statistical Analysis
Data were entered by one experimenter and checked for accuracy by a blinded experimenter. QST data were z-transformed for each modality at each test site and then combined for analysis due to the multicollinearity within thermal and pain modalities. Thus, four standardized Z-scores were created for vibratory detection, thermal detection, thermal pain and pressure pain thresholds that were used for further statistical analysis. The combination of these modalities is appropriate based on the physiological properties of sensory channels [49].
We used t-tests to compare groups with respect to continuous/discrete ordinal variables and χ2 analyses to assess associations with nominal variables. Assumptions underlying each statistical test were tested. Two-way analysis of covariance (ANCOVA) procedures were conducted with Pain Group and Sex as between subject factors controlling for chronological age and exercise. Sex was entered as a between-subject factor because of previously reported sex-differences in predicted brain age [8] as well as sex-based differences in brain alterations across chronic pain conditions [24]. Chronological age was entered as a covariate due to the wide age range of our sample (60–83) and the known brain changes that occur in old age. Finally, there were significant differences between groups regarding regularly exercising, hence the variable “exercise” was also included as a nuisance variable in all analysis. As the current study was specifically aimed at comparing brain-PAD between individuals with and without chronic pain, only the main effect of Pain Group in the main ANOVA model was of interest with a probability less than 0.05 considered statistically significant. Partial eta squared was reported to assess effect sizes where small, medium and large effect sizes are represented by 0.01, 0.06 and 0.14 [5], respectively were also included to assess the magnitude of the group differences. We employed Pearson correlations for interval level variables while Spearman correlations were used for ordinal level variables to assess associations between Brain-PAD with pain, somatosensory and psychological variables. Partial correlations were also used accounting for sex, chronological age, and exercise. Effect size magnitudes for correlations of 0.1, 0.3 and 0.5 are reflective of small, medium and large effects, respectively [30]. For the additional exploratory analyses examining associations between brain-PAD and clinical pain characteristics, somatosensory and psychological function, we report both uncorrected (i.e, p =) as well as corrected probability values (i.e., corrected p =) accounting for multiple comparisons applying the Holm-Bonferroni method [26] using the calculator by Gaetano [17]. Data analyses were performed using IBM SPSS 25 software.
RESULTS
Demographics
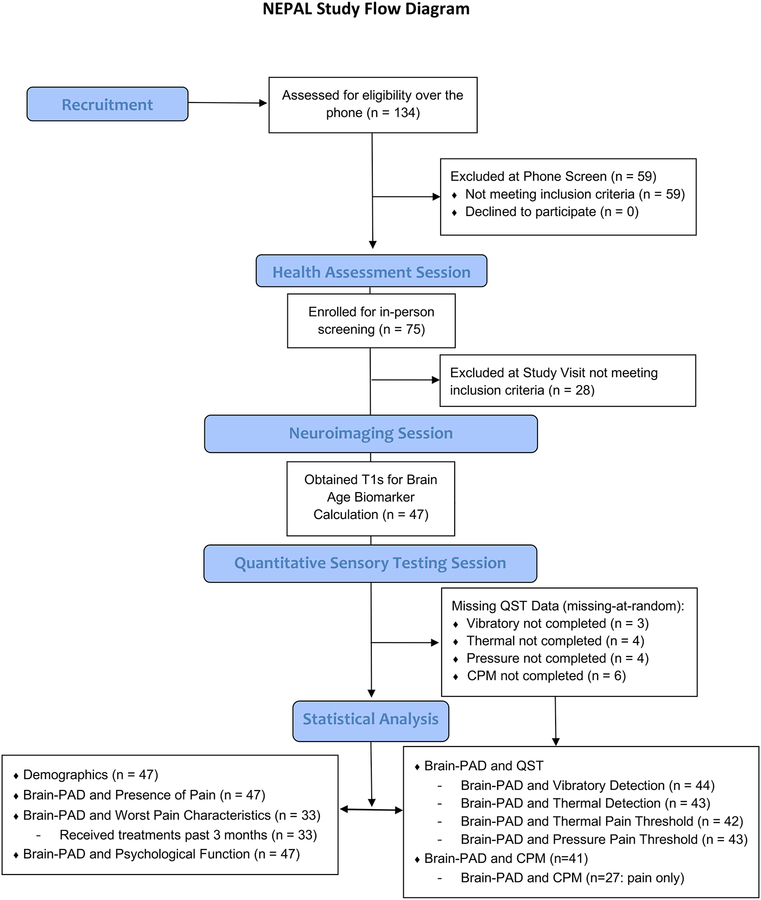
Forty-seven older adults ranging in age from 60 to 83 years of age (mean age = 70.9 ± 6.0, 74.5% female) participated in our study. Figure 2 shows the flow of recruited and enrolled participants in the NEPAL study. The majority of our sample (n = 33, 70%) reported pain on most days during the past 3 months (i.e., chronic pain) and 63% of those reported pain at multiple sites (40% reported pain at 2 different locations). Sample clinical and demographic characteristics are presented in Table 1. There were no significant differences between the groups in relation to self-reported health and lifestyle characteristics except for exercise participation (Table 2).
Figure 2.
Screening and enrollment for the NEPAL study.
Table 1.
Differences in demographic and clinical characteristics between the groups.
| No Chronic Pain (n=14) | Chronic Pain (n=33) | p-value | |
|---|---|---|---|
| Chronological Age, mean ± SD years | 71.5 ± 7.3 | 70.6 ± 5.5 | 0.647 |
| Predicted Brain Age, mean ± SD years | 67.8 ± 10.6 | 69.4 ± 8.6 | 0.592 |
| Sex, no. (%) | 0.076* | ||
| Male | 6 (52.6) | 6 (18.2) | |
| Female | 8 (47.4) | 27 (81.8) | |
| Race, no. (%) | 0.304* | ||
| Caucasian | 13 (92.9) | 30 (90.9) | |
| African American | 0 (0) | 2 (6.1) | |
| Asian/Pacific Islander | 1 (7.1) | 0 (0) | |
| Other | 0 (0) | 1 (3.0) | |
| Education, no. (%) | 0.133* | ||
| High school | 2 (14.3) | 11 (33.3) | |
| Two-year | 1 (7.1) | 7 (21.2) | |
| Four-year | 2 (14.3) | 7 (21.2) | |
| Masters | 7 (50.0) | 6 (18.2) | |
| Doctorate | 2 (14.3) | 2 (6.1) | |
| CES-D, mean ± SD years | 5.9 ± 5.0 | 8.8 ± 5.4 | 0.085* |
| 3MS, mean ± SD years | 99.1 ± 1.3 | 97.3 ± 3.4 | 0.008* |
| Duration of Pain, mean ± SD years | - | 6.3 ± 8.8 | - |
| Worst Pain Intensity | - | 5.2 ± 1.9 | - |
| # of Anatomical Pain Sites | - | 3.1 ± 2.2 | - |
| Medications, no. (%) | 5 (38.5) | 16 (48.5) | 0.421* |
| Narcotic Medications (PRN), no. (%) | 0 (0) | 6 (18.2) | 0.088* |
| Antidepressant Medications, no. (%) | 1 (7.1) | 9 (27.3) | 0.123* |
| Anticonvulsant Medications, no. (%) | 0 (0) | 4 (12.1) | 0.173* |
| NSAID Medications, no. (%) | 4 (28.6) | 16 (48.5) | 0.207* |
X2
Table 2.
Self-reported health and lifestyle characteristics of our participants.
| “Have you ever had…” | No Chronic Pain (n=14) | Chronic Pain (n=33) | p-value |
|---|---|---|---|
| High Blood Pressure, no. (%) | 5 (35.7) | 15 (45.5) | 0.537* |
| Diabetes, no. (%) | 1 (7.1) | 3 (9.0) | 0.827* |
| Anemia, no. (%) | 5 (38.5) | 12 (36.4) | 0.966 |
| Heart Trouble, no. (%) | 2 (14.3) | 3 (9.0) | 0.597 |
| Asthma, no. (%) | 3 (21.4) | 2 (6.1) | 0.118 |
| Bronchitis, no. (%) | 6 (52.6) | 16 (48.5) | 0.724 |
| Allergies, no. (%) | 7 (50.0) | 16 (48.5) | 0.775 |
| Cancer, no. (%) | 6 (52.6) | 13 (39.4) | 0.825 |
| Lung Disease, no. (%) | 1 (7.1) | 0 (0) | 0.121 |
| Kidney Trouble, no. (%) | 3 (21.4) | 3 (9.0) | 0.246 |
| Liver Trouble, no. (%) | 1 (7.1) | 2 (6.1) | 0.890 |
| Mononucleosis, no. (%) | 3 (21.4) | 6 (18.2) | 0.796 |
| Measles, no. (%) | 13 (92.9) | 28 (84.8) | 0.452 |
| Migraine, no. (%) | 1 (7.1) | 5 (15.2) | 0.452 |
| Skin Disease, no. (%) | 4 (28.6) | 7 (21.2) | 0.586 |
| Thyroid Problems, no. (%) | 3 (21.4) | 7 (21.2) | 0.987 |
| Ulcer, no. (%) | 4 (28.6) | 14 (42.4) | 0.472 |
| Do you exercise regularly, no. (%) | 14 (100) | 23 (69.7) | 0.020 |
| Do you smoke, no. (%) | 1 (7.1) | 2 (6.0) | 0.890 |
| Do you drink alcoholic drinks, no. (%) | 10 (71.4) | 17 (51.5) | 0.207 |
Brain-PAD and Presence of Pain
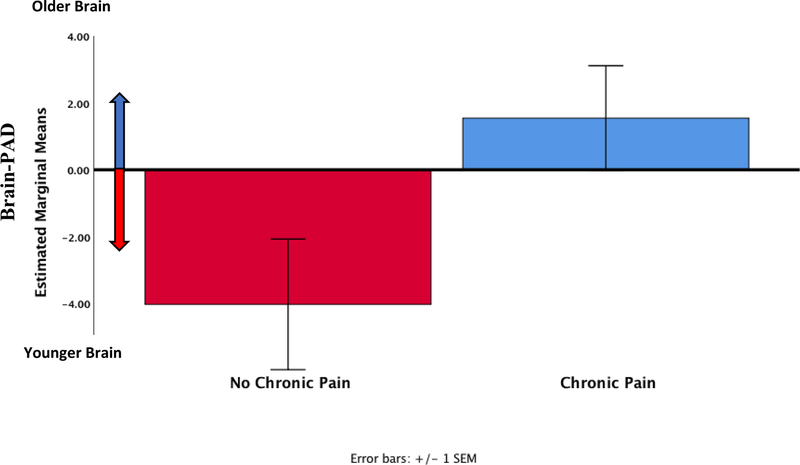
A two-way ANCOVA was used to compare brain-PAD between pain groups and sex, controlling for chronological age and exercise. Levene’s test and Shapiro-Wilks normality checks were carried out and the assumptions met. There was a significant difference in brain-PAD between older adults who reported chronic pain (1.5 ± 1.6) versus those that did not (−4.0 ± 1.9, F (1,41) = 4.9, p = 0.033, partial eta squared = 0.11, ANCOVA, see Figure 3), which was our main proposed study hypothesis. There was no significant sex difference in brain-PAD (F (1,41) = 3.8, p = 0.057, partial eta squared = 0.09, ANCOVA) or Pain Group × Sex interaction (F (1,41) = 1.8, p = 0.187, partial eta squared = 0.04, ANCOVA), although these results were not of interest in the present investigation.
Figure 3.
Predicted brain age difference (predicted brain age – chronological age) across the groups (n=47) adjusted for chronological age, sex and exercise.
Brain-PAD and Worst Pain Characteristics
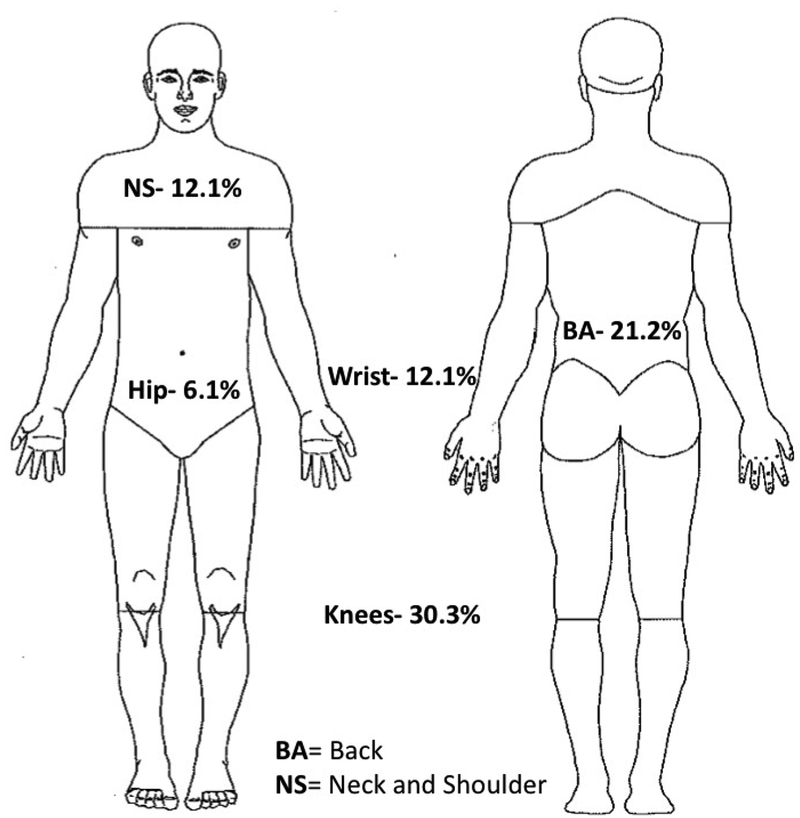
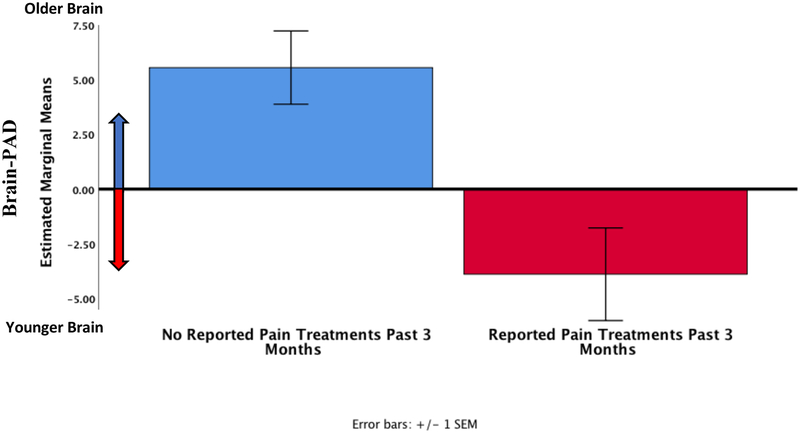
Worst pain location within the participants that experienced pain (n = 33) is depicted in Figure 4. Brain-PAD was significantly correlated with average intensity of the worst pain (r = 0.464, p = 0.011, corrected p = 0.033). However, self-reported worst pain duration (r = −0.100, p = 0.606, corrected p = 1.000) and worst pain frequency during the past week (r = 0.039, p = 0.842, corrected p = 1.000) were not significantly correlated with brain-PAD. Adjusted partial correlations controlling for sex, chronological age, and exercise did not significantly change the results. We compared brain-PAD between individuals reporting receiving treatments (including self-remedies at home) to relieve their worst pain during the past 3 months using a two-way ANCOVA (Between-subject factors: treatment groups and sex, controlling for chronological age and exercise). Levene’s test and Shapiro-Wilks normality checks were carried out and the assumptions met. Brain-PAD was significantly lower for individuals who reported receiving treatments to relieve their worst pain (−3.9 ± 1.5) versus those that did not (5.6 ± 1.4, F (1,27) = 12.3, p = 0.002, corrected p = 0.008, partial eta squared = 0.31, ANCOVA, Figure 5).
Figure 4.
Location of worst pain reported by our sample (n=33).
Figure 5.
Brain-PAD in pain participants who reported having any treatments or trying any self-remedies (something they may have done at home) to relieve their worst pain during the past 3 months (n=19) compared to those that did not (n=14).
Brain-PAD and Psychological Function
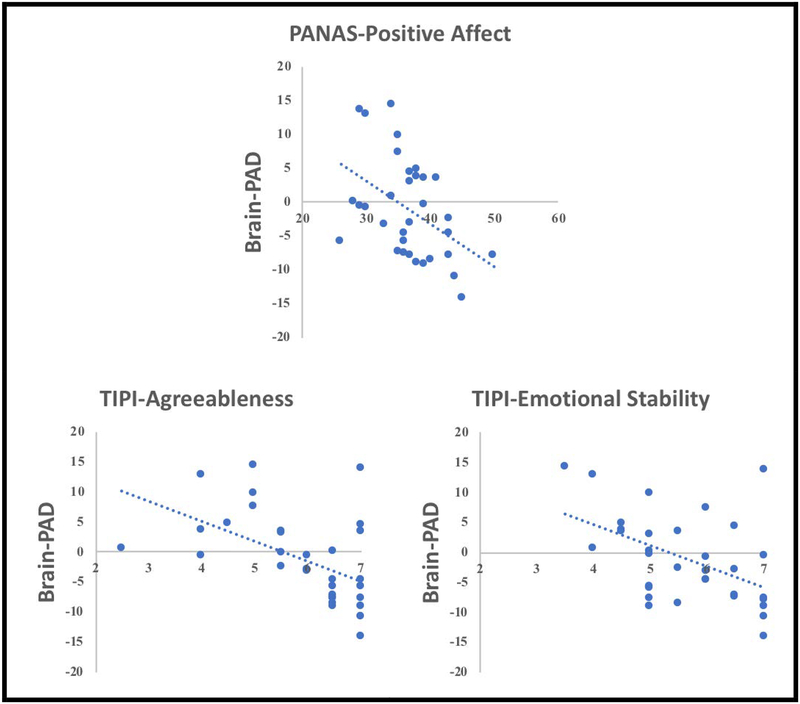
Spearman correlations were used to determine associations between brain-PAD and psychological variables. No significant associations between brain-PAD and the psychological variables emerged across all participants (corrected and uncorrected p’s > 0.05). However, among individuals reporting chronic pain (n = 33), “younger” brain-PAD was significantly associated with greater PANAS-Positive Affect Trait (r = −0.474, p = 0.005, corrected p = 0.040), TIPI-Agreeableness (r = −0.439, p = 0.020, corrected p = 0.140), TIPI-Emotional Stability (r = −0.387, p = 0.042, corrected p = 0.252, Figure 6). Brain-PAD was not correlated with CES-D (r = 0.122, p = 0.414, corrected p = 1.000), PANAS-Negative Affect (r = 0.033, p = 0.857, corrected p = 1.000), TIPI-Extraversion (r = −0.135, p = 0.494, corrected p = 1.000), TIPI-Conscientiousness (r = −0.301, p = 0.120, corrected p = 1.000) or TIPI-Openness to Experiences (r = 0.119 p = 0.819, corrected p = 1.000).
Figure 6.
Associations between brain-PAD and psychological function in older individuals with chronic pain (n=33).
Brain-PAD and QST
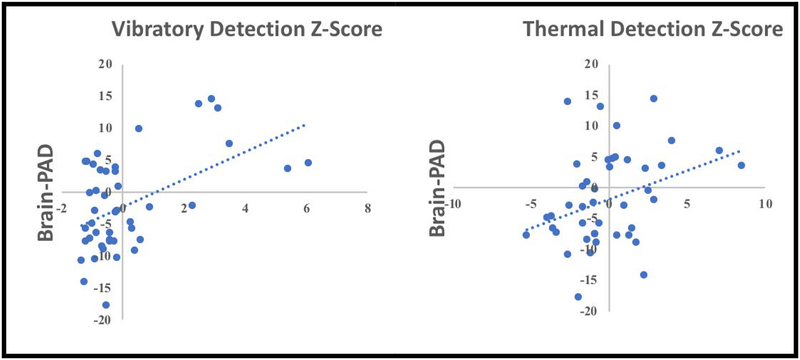
Pearson’s Moment correlations were used to determine associations between brain-PAD and QST variables. Greater vibratory detection thresholds were significantly associated with greater Brain-PAD (i.e., older brain) (r = 0.323, p = 0.033, corrected p = 0.099, Figure 7a). Similarly, greater thermal detection thresholds were also significantly associated with greater Brain-PAD (i.e., older brain) (r = 0.345, p = 0.023, corrected p = 0.092, Figure 7b). There were no associations between Brain-PAD and thermal (r =0.057, p = 0.719, corrected p = 0.719) or pressure pain thresholds (r = 0.230, p = 0.137, corrected p = 0.274). Subgroup analysis within persons with pain did not significantly change our results (corrected and uncorrected p’s > 0.05).
Figure 7.
Associations between brain-PAD and somatosensory function in our sample (n=47).
Brain-PAD and CPM
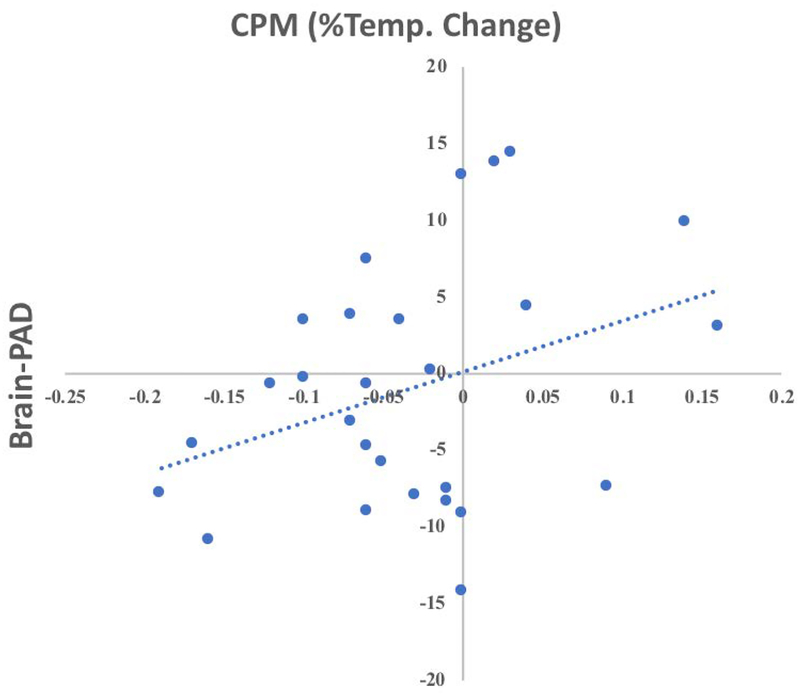
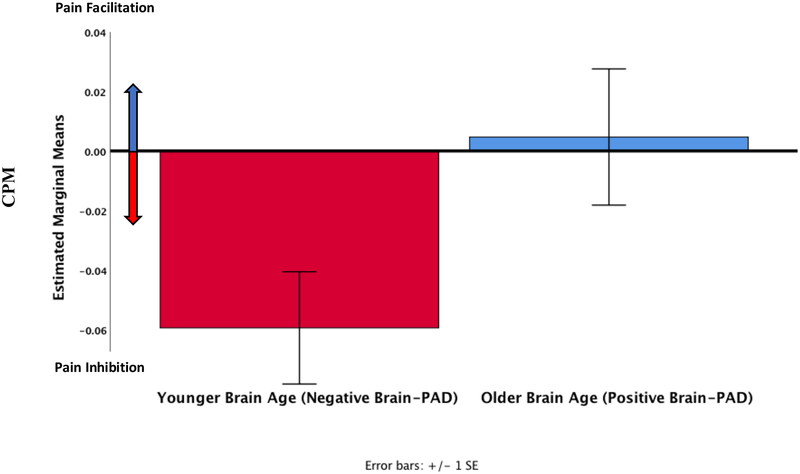
Across participants who underwent the CPM procedure (n = 41), there were no strong correlations between brain-PAD and CPM scores (Pearson’s r = 0.132, p = 0.409). However, among individuals reporting chronic pain (n=27), brain-PAD was correlated with CPM scores (Pearson’s r = 0.346, Figure 8), but this coefficient was not statistically significant (p = 0.077, corrected p = 0.148). Finally, we wanted to explore whether there was a difference in CPM depending on a participant’s brain-PAD. Individuals with a lower brain-PAD exhibited significantly greater endogenous pain inhibition during the CPM procedure (−0.06 ± 0.01) compared to those that had a greater brain-PAD (0.01 ± 0.02, F (1,25) = 4.6, p = 0.044, corrected p = 0.132, partial eta squared = 0.17, ANCOVA, Figure 9). Adding sex to the model, decreased the statistical significance of this finding (p = 0.074, corrected p = 0.148).
Figure 8.
Associations between brain-PAD and CPM in older individuals with chronic pain (n=33).
Figure 9.
CPM in a subset of pain participants who had a younger appearing brain (n=16) compared to those that had an older appearing brain (n=11). More negative numbers reflect better pain inhibition.
DISCUSSION
We conducted the first examination of how chronic pain relates to a biomarker of brain aging in community-dwelling older adults. Several important contributions emerged from this investigation. First, older individuals with chronic pain had an “older” appearing brain compared to those without chronic pain and greater average pain intensity was associated with an “older” brain. Second, among participants that experienced chronic pain, those that reported having pain treatments during the past 3 months had a “younger” appearing brain compared to those that did not report receiving any pain treatments. Finally, an “older” brain was significantly associated with decreased somatosensory perception, deficient endogenous pain inhibition, lower positive affect, having a less agreeable personality, and being less emotionally stable.
As hypothesized, chronic pain was associated with an “older” brain relative to an individual’s chronological age. Older pain-free controls had on average a brain that looked 4 years younger than their chronological age while the chronic pain group had on average a brain that appeared 2 years older than their chronological age adjusting for important covariates. In a previous study, each extra year of brain-predicted age (i.e., having a brain-PAD score of +1) resulted in a 6.1% relative subsequent increase in the risk of death between ages 73 and 80 [8]. This is consistent with a recent meta-analysis suggesting that chronic pain increases the risk of mortality [33]. Our findings are also consistent with previous chronic pain research, that used univariate methods to infer that pain is associated with altered brain structure; in individuals 25 to 65 years of age with fibromyalgia [31] and 15 to 55 years of age in temporomandibular disorders [36]. Apkarian and colleagues [1] also reported global decreases in gray matter in people with chronic low back pain that were significantly greater than the expected age-related decreases alone. While their sample’s age ranged from 20–75 years of age, only 5 participants were between 60 and 75 years of age. Thus, the inclusion of younger and middle-aged individuals in these previous studies has hindered the direct examination of the interaction of pain with the aging brain, given the known age-related decrements in the brain’s gray and white matter. However, our findings directly support several previous preliminary investigations in older adults with low back pain (n=8/group) where pain was significantly associated with significant changes in gray and white matter [2–4].
The variability in brain-predicted age in people with chronic pain was related to some characteristics of their pain experience. An older-appearing brain was associated with greater average intensity of a participant’s worst pain, even after accounting for other potential confounders. In addition, individuals reporting they tried or received any pain-relieving treatments during the past 3 months had younger-appearing brains compared to those that did not. This is further supported experimentally, where those participants with “older” brains exhibited deficient endogenous pain modulation using a CPM paradigm. In combination, our findings suggest that chronic pain, when not sufficiently relieved, is negatively associated with brain structure above and beyond associations with chronological aging alone. Previously, Rodriguez-Raecke and colleagues [42] reported gray matter decreases that were reversed when pain was successfully treated in middle-aged and older individuals. Future prospective studies including pain interventions should address these questions with greater statistical power.
Better vibratory and thermal detection at two different body sites (i.e., hand and foot) was also associated with a younger brain. Chronological aging is associated with a progressive decrease in vibratory and thermal perception [23,32]. The presumed underlying causes include skin aging and subsequent reductions in receptor density and superficial skin blood flow [27]. However, animal and human studies also suggest that changes relating to fiber loss and decreased conduction velocity may also be involved [21,23,37,45,46]. Interestingly, our results suggest that chronic pain may also be associated with perceptual aging where even subclinical decrements in somatosensation may potentially impact the brain and vice-versa. Although both vibratory and thermal systems have different components (e.g., sensory receptors, spinal cord pathways, thalamic termination sites), they still require the brain for integration and ultimately perception. Future mechanistic studies are needed to determine peripheral versus central contributions of aging in the elderly.
Brain-PAD was also associated with positive, but not negative affect in those participants with chronic pain. This is consistent with the idea that positive affect may have a unique role in modulating the pain experience [14]. Although not currently understood, it is likely that positive affect impacts the pain experience via multiple converging supraspinal mechanisms. First, increased positive affect and associated cognitions may translate into positive expectations for recovery and potential treatment success [20]. Thus, positive affect may also enhance motivation and treatment adherence [48], which are important predictors of the success of exposure to treatments [13]. In addition, positive affect can enhance extinction learning or inhibitory learning processes [51], which may further optimize the efficacy of existing treatments. Similarly, a personality characterized by greater emotional stability and agreeableness was associated with a younger appearing brain in those with chronic pain. In the Baltimore Longitudinal Study of Aging, larger orbitofrontal and dorsolateral prefrontal cortices and rolandic operculum were associated with greater emotional stability, and a larger orbitofrontal cortex with higher agreeableness [28]. Moreover, agreeableness was a significant positive predictor of attendance to a physical rehabilitation program after surgery [25]. In general, distinct personality traits are associated with stable individual differences in gray matter volumes [41]. Taken together, our findings underscore the idea that higher order traits such as personality characteristics are a feature of large-scale brain structure and function that may be negatively impacted by chronic pain and be sensitive to a brain aging biomarker.
Our study has some limitations. While the sample size for the training set was large, the NEPAL study cohort was relatively small. However, NEPAL participants are well-characterized across multiple characteristics relevant to the study of pain and aging within the biopsychosocial model of pain [19]. In addition, our groups were very similar regarding age-related health comorbidities and overall medication intake, which can make it hard to compare and isolate pain differences. Second, the current analysis was cross-sectional; therefore, we cannot determine whether a specific brain-predicted age preceded or was subsequent to pain. From the present findings, directionality or causality cannot be inferred as it is equally possible that brain aging plays a central role for the sensitivity and resilience to many symptoms and disorders associated with biological aging including chronic pain. Future studies are needed using longitudinal data to determine trajectories of brain aging and how they relate to pain and future health outcomes. Third, the NEPAL participants were high functioning community-dwelling older individuals, who were relatively healthy for their age. They were cognitively normal, free from overt disability and neurological disorders. Given that greater self-reported exercise was associated with positive brain aging in a previous investigation, it is possible that the true association between pain and brain-PAD was underestimated in our sample since everyone reported exercising regularly in our control group. Fourth, our brain aging measure does not provide the anatomical specificity to determine which brain regions are specifically “aged” as brain aging is not a uniform process. Future studies including participants with more severe pain and lower levels of physical function are required to further elucidate these associations. In addition, the development of region-specific aging biomarkers will help the field and ultimately clinical practice. Finally, many of our study findings became non-statistically significant after correcting for multiple comparisons, which amplifies the probability of finding a false-positive result. Future studies are needed to replicate our findings and determine whether our reported associations were due to chance alone.
We present evidence that a clinically-relevant neuroimaging aging biomarker previously associated with greater risk of general functional decline and mortality during aging, is similarly associated with the presence and severity of the complex experience of pain in older individuals. Brain-PAD could be a valuable marker of brain health requiring minimal manual training to implement at the individual level with the potential to be estimated in large numbers of people, as structural MRI is collected routinely in clinical settings. Our findings also suggest that both pain treatments and psychological traits may significantly mitigate the effect of pain on the aging brain and could further decrease the risk of age-related deterioration and death.
Acknowledgements:
We are grateful to our volunteers for their participation and the NEPAL study team (Paige Lysne, Lorraine Hoyos, Darlin Ramirez, Brandon Apagueno and Rachna Sannegowda). This work was supported by the National Institutes of Health (NIA K01AG048259/R01AG059809 to YC-A, NIAAA K01AA025306 to EP, NIA K01AG050707 to AJW), the University of Florida Clinical Translational Sciences Institute (NCATSUL1TR001427) the Center for Cognitive Aging & Memory, McKnight Brain Foundation, the University of Florida Claude D. Pepper Older Americans Independence Center (P30AG028740). James Cole was supported by the UK Research and Innovation Fellowship (reference # MR/R024790/1). All authors report no conflict of interest.
REFERENCES
- [1].Apkarian AV, Sosa Y, Sonty S, Levy RM, Harden RN, Parrish TB, Gitelman DR. No Title. 2004;24. doi: 10.1523/JNEUROSCI.2541-04.2004. [DOI] [PMC free article] [PubMed] [Google Scholar]
- [2].Buckalew N, Haut MW, Aizenstein H, Morrow L, Perera S, Kuwabara H, Weiner DK. Differences in brain structure and function in older adults with self-reported disabling and nondisabling chronic low back pain. Pain Med (United States) 2010;11. doi: 10.1111/j.1526-4637.2010.00899.x. [DOI] [PMC free article] [PubMed] [Google Scholar]
- [3].Buckalew N, Haut MW, Aizenstein H, Rosano C, Edelman KD, Perera S, Marrow L, Tadic S, Venkatraman V, Weiner D. White matter hyperintensity burden and disability in older adults: is chronic pain a contributor? PM R 2013;5:471–80; 10.1016/j.pmrj.2013.03.004. [DOI] [PMC free article] [PubMed] [Google Scholar]
- [4].Buckalew N, Haut MW, Morrow L, Weiner D. Chronic pain is associated with brain volume loss in older adults: Preliminary evidence. Pain Med 2008;9:240–248. doi: 10.1111/j.1526-4637.2008.00412.x. [DOI] [PubMed] [Google Scholar]
- [5].Cohen J Statistical power analysis for the behavioral sciences. Academic Press, 1977. p. [Google Scholar]
- [6].Cole JH, Franke K. Predicting Age Using Neuroimaging: Innovative Brain Ageing Biomarkers. Trends Neurosci 2017;40:681–690. doi: 10.1016/j.tins.2017.10.001. [DOI] [PubMed] [Google Scholar]
- [7].Cole JH, Leech R, Sharp DJ, Alzheimer’s Disease Neuroimaging Initiative. Prediction of brain age suggests accelerated atrophy after traumatic brain injury. Ann Neurol 2015;77:571–581. doi: 10.1002/ana.24367. [DOI] [PMC free article] [PubMed] [Google Scholar]
- [8].Cole JH, Ritchie SJ, Bastin ME, Valdés Hernández MC, Muñoz Maniega S, Royle N, Corley J, Pattie A, Harris SE, Zhang Q, Wray NR, Redmond P, Marioni RE, Starr JM, Cox SR, Wardlaw JM, Sharp DJ, Deary IJ. Brain age predicts mortality. Mol Psychiatry 2018;23:1385–1392. doi: 10.1038/mp.2017.62. [DOI] [PMC free article] [PubMed] [Google Scholar]
- [9].Cole JH, Underwood J, Caan MWA, De Francesco D, van Zoest RA, Leech R, Wit FWNM, Portegies P, Geurtsen GJ, Schmand BA, Schim van der Loeff MF, Franceschi C, Sabin CA, Majoie CBLM, Winston A, Reiss P, Sharp DJ, COBRA collaboration. Increased brain-predicted aging in treated HIV disease. Neurology 2017;88:1349–1357. doi: 10.1212/WNL.0000000000003790. [DOI] [PMC free article] [PubMed] [Google Scholar]
- [10].Crawford JR, Henry JD. The positive and negative affect schedule (PANAS): construct validity, measurement properties and normative data in a large non-clinical sample. Br J Clin Psychol 2004;43:245–65. doi: 10.1348/0144665031752934. [DOI] [PubMed] [Google Scholar]
- [11].Cruz-Almeida Y, King CD, Goodin BR, Sibille KT, Glover TL, Riley JL, Sotolongo A, Herbert MS, Schmidt J, Fessler BJ, Redden DT, Staud R, Bradley LA, Fillingim RB. Psychological profiles and pain characteristics of older adults with knee osteoarthritis. Arthritis Care Res 2013;65:1786–1794. [DOI] [PMC free article] [PubMed] [Google Scholar]
- [12].Cruz-Almeida Y, Martinez-Arizala A, Widerström-Noga EG. Chronicity of pain associated with spinal cord injury: A longitudinal analysis. J Rehabil Res Dev 2005;42. [DOI] [PubMed] [Google Scholar]
- [13].Ek J-W, van Gijn JC, Samwel H, van Egmond J, Klomp FPAJ, van Dongen RTM. Pain exposure physical therapy may be a safe and effective treatment for longstanding complex regional pain syndrome type 1: a case series. Clin Rehabil 2009;23:1059–66. doi: 10.1177/0269215509339875. [DOI] [PubMed] [Google Scholar]
- [14].Finan PH, Garland EL. The Role of Positive Affect in Pain and Its Treatment. Clin J Pain 2015;31:177–187. doi: 10.1097/AJP.0000000000000092. [DOI] [PMC free article] [PubMed] [Google Scholar]
- [15].Franke K Gaser C Longitudinal changes in individual BrainAGE in healthy aging, mild cognitive impairment, and Alzheimer’s Disease. GeroPsych (Bern) 2012;25:235–245. Available: http://psycnet.apa.org/fulltext/2012-32697-006.pdf. [Google Scholar]
- [16].Franke K, Ziegler G, Klöppel S, Gaser C. Estimating the age of healthy subjects from T1-weighted MRI scans using kernel methods: Exploring the influence of various parameters. Neuroimage 2010;50:883–892. doi: 10.1016/j.neuroimage.2010.01.005. [DOI] [PubMed] [Google Scholar]
- [17].Gaetano J Holm-Bonferroni Sequential Correction: An EXCEL Calculator - Ver. 1.2 | Request PDF. 2013. Available: https://www.researchgate.net/publication/242331583_Holm-Bonferroni_Sequential_Correction_An_EXCEL_Calculator_-_Ver_12.
- [18].Gaser C, Franke K, Klöppel S, Koutsouleris N, Sauer H, Alzheimer’s Disease Neuroimaging Initiative. BrainAGE in Mild Cognitive Impaired Patients: Predicting the Conversion to Alzheimer’s Disease. PLoS One 2013;8:e67346. doi: 10.1371/journal.pone.0067346. [DOI] [PMC free article] [PubMed] [Google Scholar]
- [19].Gatchel RJ, Adams L, Polatin PB, Kishino ND. Secondary loss and pain-associated disability: theoretical overview and treatment implications. J Occup Rehabil 2002;12:99–110. Available: http://www.ncbi.nlm.nih.gov/pubmed/12014230. [DOI] [PubMed] [Google Scholar]
- [20].George SZ, Robinson ME. No Title. 2010;11. doi: 10.1016/j.jpain.2010.02.016. [DOI] [Google Scholar]
- [21].Gescheider GA, Beiles EJ, Checkosky CM, Bolanowski SJ, Verrillo RT. The effects of aging on information-processing channels in the sense of touch: II. Temporal summation in the P channel. Somatosens Mot Res 1994;11:359–65. Available: http://www.ncbi.nlm.nih.gov/pubmed/7778412. [DOI] [PubMed] [Google Scholar]
- [22].Gosling SD, Rentfrow PJ, Swann WB. A very brief measure of the Big-Five personality domains. J Res Pers 2003;37:504–528. doi: 10.1016/S0092-6566(03)00046-1. [DOI] [Google Scholar]
- [23].Guergova S, Dufour A. Thermal sensitivity in the elderly: A review. Ageing Res Rev 2011;10:80–92. doi: 10.1016/j.arr.2010.04.009. [DOI] [PubMed] [Google Scholar]
- [24].Gupta N, Heiden M, Mathiassen SE, Holtermann A. Is self-reported time spent sedentary and in physical activity differentially biased by age, gender, body mass index, and low-back pain?; 44:163–170. doi: 10.5271/sjweh.3693. [DOI] [PubMed] [Google Scholar]
- [25].Hilliard RC, Brewer BW, Cornelius AE, Van Raalte JL. Big Five Personality Characteristics and Adherence to Clinic-Based Rehabilitation Activities after ACL Surgery: A Prospective Analysis. open Rehabil J 2014;7:1–5. Available: http://www.ncbi.nlm.nih.gov/pubmed/25663952. [DOI] [PMC free article] [PubMed] [Google Scholar]
- [26].Holm S A Simple Sequentially Rejective Multiple Test Procedure Author(s): Scand J Stat 1979;6:65–70. doi: 10.2307/4615733. [DOI] [Google Scholar]
- [27].Joynt RJ. Aging and the nervous system. Merck Man Geriatr 2000:1507. [Google Scholar]
- [28].Kapogiannis D, Sutin A, Davatzikos C, Costa P, Resnick S. The five factors of personality and regional cortical variability in the baltimore longitudinal study of aging. Hum Brain Mapp 2013;34:2829–2840. doi: 10.1002/hbm.22108. [DOI] [PMC free article] [PubMed] [Google Scholar]
- [29].Koutsouleris N, Davatzikos C, Borgwardt S, Gaser C, Bottlender R, Frodl T, Falkai P, Riecher-Rossler A, Moller H-J, Reiser M, Pantelis C, Meisenzahl E. Accelerated Brain Aging in Schizophrenia and Beyond: A Neuroanatomical Marker of Psychiatric Disorders. Schizophr Bull 2014;40:1140–1153. doi: 10.1093/schbul/sbt142. [DOI] [PMC free article] [PubMed] [Google Scholar]
- [30].Kraemer HC, Blasey C. How Many Subjects?: Statistical Power Analysis in Research. 1 Oliver’s Yard, 55 City Road London EC1Y 1SP: SAGE Publications, Ltd, 2016. p. doi: 10.4135/9781483398761. [DOI] [Google Scholar]
- [31].Kuchinad A, Schweinhardt P, Seminowicz DA, Wood PB, Chizh BA, Bushnell MC. No Title. 2007;27. doi: 10.1523/JNEUROSCI.0098-07.2007. [DOI] [PMC free article] [PubMed] [Google Scholar]
- [32].Lin Y-H, Hsieh S-C, Chao C-C, Chang Y-C, Hsieh S-T. Influence of aging on thermal and vibratory thresholds of quantitative sensory testing. J Peripher Nerv Syst 2005;10:269–81. doi: 10.1111/j.1085-9489.2005.10305.x. [DOI] [PubMed] [Google Scholar]
- [33].Macfarlane GJ, Barnish MS, Jones GT. Persons with chronic widespread pain experience excess mortality: longitudinal results from UK Biobank and meta-analysis. Ann Rheum Dis 2017;76:1815–1822. doi: 10.1136/annrheumdis-2017-211476. [DOI] [PubMed] [Google Scholar]
- [34].Margolis RB, Chibnall JT TR. Test-retest reliability of the pain drawing instrument. - PubMed - NCBI. Pain 1988;33:49–51. Available: https://www.ncbi.nlm.nih.gov/pubmed/3380550. [DOI] [PubMed] [Google Scholar]
- [35].May A Chronic pain may change the structure of the brain. PAIN® 2008;137:7–15. doi: 10.1016/J.PAIN.2008.02.034. [DOI] [PubMed] [Google Scholar]
- [36].Moayedi M, Weissman-Fogel I, Salomons TV, Crawley AP, Goldberg MB, Freeman BV, Tenenbaum HC, Davis KD. White matter brain and trigeminal nerve abnormalities in temporomandibular disorder. Pain 2012;153:1467–1477. doi: 10.1016/j.pain.2012.04.003. [DOI] [PubMed] [Google Scholar]
- [37].Nusbaum NJ. Aging and sensory senescence. South Med J 1999;92:267–75. Available: http://www.ncbi.nlm.nih.gov/pubmed/10094265. [DOI] [PubMed] [Google Scholar]
- [38].Patel KV, Guralnik JM, Dansie EJ, Turk DC. Prevalence and impact of pain among older adults in the United States: Findings from the 2011 National Health and Aging Trends Study. Pain 2013. [DOI] [PMC free article] [PubMed] [Google Scholar]
- [39].Pfeifer GM. Transforming Pain Care: An IOM Report. AJN, Am J Nurs 2011;111:18. doi: 10.1097/01.NAJ.0000405050.15701.e2. [DOI] [PubMed] [Google Scholar]
- [40].Radloff LS. The CES-D Scale. Appl Psychol Meas 1977;1:385–401. doi: 10.1177/014662167700100306. [DOI] [Google Scholar]
- [41].Riccelli R, Toschi N, Nigro S, Terracciano A, Passamonti L. Surface-based morphometry reveals the neuroanatomical basis of the five-factor model of personality. Soc Cogn Affect Neurosci 2017;12:nsw175. doi: 10.1093/scan/nsw175. [DOI] [PMC free article] [PubMed] [Google Scholar]
- [42].Rodriguez-Raecke R, Niemeier A, Ihle K, Ruether W, May A. Brain Gray Matter Decrease in Chronic Pain Is the Consequence and Not the Cause of Pain. J Neurosci 2009. [DOI] [PMC free article] [PubMed] [Google Scholar]
- [43].Teng EL, Chui HC. The Modified Mini-Mental State (MMS) examination. J Clin Psychiatry 1987. [PubMed] [Google Scholar]
- [44].Treede R-D, Rief W, Barke A, Aziz Q, Bennett MI, Benoliel R, Cohen M, Evers S, Finnerup NB, First MB, Giamberardino MA, Kaasa S, Kosek E, Lavand’homme P, Nicholas M, Perrot S, Scholz J, Schug S, Smith BH, Svensson P, Vlaeyen JWS, Wang S-J. A classification of chronic pain for ICD-11. Pain 2015;156:1003–7. doi: 10.1097/j.pain.0000000000000160. [DOI] [PMC free article] [PubMed] [Google Scholar]
- [45].Victor MRA. Other Somatic Sensation In: Victor MRA, editor. Principles of Neurology. McGraw-Hill Medical, 2001. pp. 159–162. Available: https://neurology.mhmedical.com/Content.aspx?bookId=690§ionId=50910868. [Google Scholar]
- [46].Victor MRA. The Neurology of Aging In: Victor MRA, editor. Principles of Neurology. McGraw-Hill Medical, 2001. pp. 644–7. Available: https://accessmedicine.mhmedical.com/content.aspx?sectionid=50910879&bookid=690. [Google Scholar]
- [47].Watson D, Clark LA, Tellegen A. Development and validation of brief measures of positive and negative affect: the PANAS scales. J Pers Soc Psychol 1988;54:1063–70. Available: http://www.ncbi.nlm.nih.gov/pubmed/3397865. [DOI] [PubMed] [Google Scholar]
- [48].Wiech K, Tracey I. Pain, decisions, and actions: a motivational perspective. Front Neurosci 2013;7:46. doi: 10.3389/fnins.2013.00046. [DOI] [PMC free article] [PubMed] [Google Scholar]
- [49].Willis WD, Coggeshall RE. The Sensory Channels. Sensory Mechanisms of the Spinal Cord. Boston, MA: Springer US, 2004. pp. 789–881. doi: 10.1007/978-1-4615-0035-3_12. [DOI] [Google Scholar]
- [50].Yarnitsky D, Bouhassira D, Drewes AM, Fillingim RB, Granot M, Hansson P, Landau R, Marchand S, Matre D, Nilsen KB, Stubhaug A, Treede RD, Wilder-Smith OHG. Recommendations on practice of conditioned pain modulation (CPM) testing. Eur J Pain 2015;19:805–806. doi: 10.1002/ejp.605. [DOI] [PubMed] [Google Scholar]
- [51].Zbozinek TD, Craske MG. Positive affect predicts less reacquisition of fear: relevance for long-term outcomes of exposure therapy. Cogn Emot 2017;31:712–725. doi: 10.1080/02699931.2016.1142428. [DOI] [PubMed] [Google Scholar]


