

SUMMARY
The cardiogenic transcription factors (TFs) Mef2c, Gata4, and Tbx5 can directly reprogram fibroblasts to induced cardiac-like myocytes (iCLMs), presenting a potential source of cells for cardiac repair. While activity of these TFs is enhanced by Hand2 and Akt1, their genomic targets and interactions during reprogramming are not well studied. We performed genome-wide analyses of cardiogenic TF binding and enhancer profiling during cardiac reprogramming. We found that these TFs synergistically activate enhancers highlighted by Mef2c binding sites and that Hand2 and Akt1 coordinately recruit other TFs to enhancer elements. Intriguingly, these enhancer landscapes collectively resemble patterns of enhancer activation during embryonic cardiogenesis. We further constructed a cardiac reprogramming gene regulatory network and found repression of EGFR signaling pathway genes. Consistently, chemical inhibition of EGFR signaling augmented reprogramming. Thus, by defining epigenetic landscapes these findings reveal synergistic transcriptional activation across a broad landscape of cardiac enhancers and key signaling pathways that govern iCLM reprogramming.
In Brief
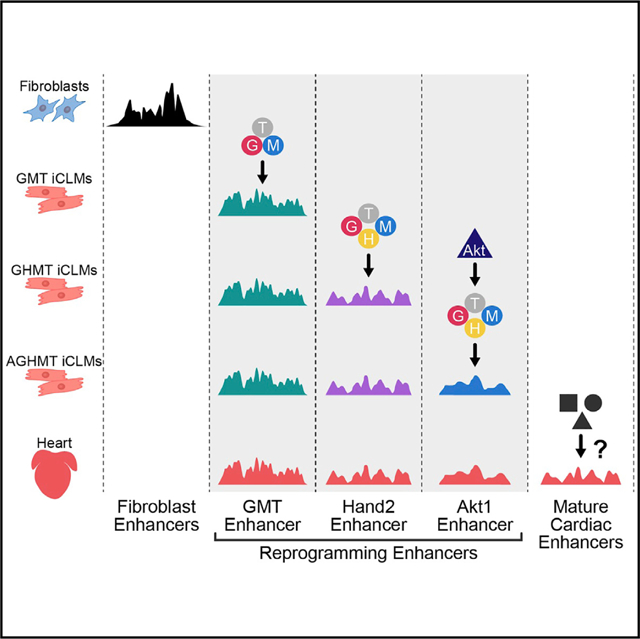
Hashimoto and colleagues show that reprogramming factors act in concert at cardiac regulatory elements to directly reprogram mouse fibroblasts into induced cardiac-like myocytes (iCLMs). Moreover, cardiac reprogramming is achieved by activation of endogenous cardiac enhancers that initiate a cardiogenic gene regulatory network.
Graphical Abstract
INTRODUCTION
Ischemic heart disease, caused by myocardial infarction, is the leading cause of death worldwide (Roth et al., 2017). After myocardial infarction, cardiomyocytes (CMs) are lost and replaced by a fibrotic scar, due to the minimal regenerative capacity of the adult heart. The damaged heart subsequently undergoes a pathological remodeling process, leading to cardiac dysfunction and heart failure with poor prognosis (Cohn et al., 2000). Current heart failure therapies are based on drugs or electromechanical devices. There is a major unmet need for alternative therapies to treat ischemic heart disease (Hashimoto et al., 2018).
To potentially overcome these issues, we and others have tested an alternative approach to directly reprogram resident cardiac fibroblasts (CFs) into induced cardiac-like myocytes (iCLMs) by cardiogenic transcription factors (TFs), bypassing the pluripotent state. Direct cardiac reprogramming was first achieved by forced expression of Gata4, Mef2c, and Tbx5 (referred to as GMT) in fibroblasts (leda et al., 2010). However, the reprogramming efficiency by GMT was relatively low. Addition of other factors to the GMT cocktail improves reprogramming efficiency, including Hand2 (referred to as GHMT) and a constitutively active form of Akt1 to GHMT (referred to as AGHMT) (Abad et al., 2017; Addis et al., 2013; Mohamed et al., 2017; Muraoka et al., 2014; Song et al., 2012; Yamakawa et al., 2015; Zhao et al., 2015; Zhou et al., 2015, 2017). Alternative approaches using different TF cocktails or combinations of microRNAs (miRNAs) and chemicals have also been shown to achieve and enhance cardiac reprogramming (Fu et al., 2015; Jayawardena et al., 2012; Lalit et al., 2016; Wang et al., 2014).
It is well known that many TFs act through combinatorial interactions to govern organ development and cell-type-specific differentiation (Spitz and Furlong, 2012). In this regard, the cardiac reprogramming factors Gata4, Mef2c, Tbx5, and Hand2 are key regulators of heart development, but their expression and biological functions are not limited to the heart (Galdos et al., 2017; Harvey, 2002; Olson, 2006). Additionally, although genome-wide transcriptome profiling has demonstrated the upregulation of cardiac markers and downregulation of fibroblast markers during cardiac reprogramming (Zhou et al., 2015), the mechanism by which these factors orchestrate reprogramming remains unclear.
We sought to study the molecular mechanisms by which cardiac reprogramming factors contribute to cell-fate conversion using a genome-wide approach. Here, we used chromatin immunoprecipitation followed by massively parallel DNA sequencing (chromatin immunoprecipitation sequencing [ChIP-seq]) to profile the genomic binding sites of reprogramming TFs and the landscape of active enhancers, annotated by H3K27ac histone modification, during cardiac reprogramming (Creyghton et al., 2010). We found that reprogramming TFs rapidly silence fibroblast enhancers and synergistically activate cardiac enhancers predominantly enriched with Mef2 motifs. Addition of Hand2 and Akt1 to GMT expands TF co-occupancy and activates additional cardiac enhancers, which further augments cardiac gene expression. Moreover, additional cardiac enhancers were sequentially activated during the reprogramming process, in accordance with the temporal acquisition of functional phenotypes in iCLMs. We discovered that subsets of conserved reprogramming enhancers displayed unique spatial expression patterns in the developing heart. Finally, by constructing a gene regulatory network (GRN) from our genomic data, we found that EGF receptor signaling is directly suppressed by reprogramming TFs and that inhibition of EGF and Jak2 signaling augmented reprogramming in fibroblasts. Our study describes the epigenomic dynamics that underlie cardiac reprogramming, which is cooperatively orchestrated by reprogramming factors to convert fibroblasts toward a cardiac lineage.
RESULTS
Rapid Genome-wide Co-occupancy of Reprogramming Factors during Reprogramming
To gain insights into the molecular mechanisms of fibroblast to CM reprogramming, we initially examined the recruitment of reprogramming factors to genomic DNA binding sites using ChIP-seq. To determine the timing of the reprogramming process, we first quantified the expression of the cardiac markers, Tnnt2 and Myh6, in mouse embryonic fibroblasts (MEFs) reprogrammed by retroviral expression of GMT, GHMT, and AGHMT, after 2 and 7 days of reprogramming (Figures 1A and S1A). Expression of both cardiac markers was detectable as early as day 2 (Figure S1A). Therefore, we sought to identify genomic binding sites for Gata4, Hand2, Mef2c, and Tbx5 in MEFs 2 days after reprogramming by the AGHMT cocktail. Hand2 and Mef2c were tagged with 3xTy1 since currently available antibodies for Hand2 and Mef2c are inadequate for ChIP. We confirmed that the 3xTy1 tag did not affect the expression or reprogramming efficiency of these TFs by western blotting, immunostaining, Ca2+ flux, and beating (Figures S1B–S1F). ChIP-seq analysis performed on day 2 AGHMT iCLMs revealed that reprogramming TFs rapidly occupy chromatin sites, and we identified 24,933 total peaks (binding sites) for Gata4, 21,156 for Hand2, 10,526 for Mef2c, and 26,788 for Tbx5 (Figure 1B).
Figure 1. Genome-wide Co-occupancy of Reprogramming Factors in AGHMT iCLMs.
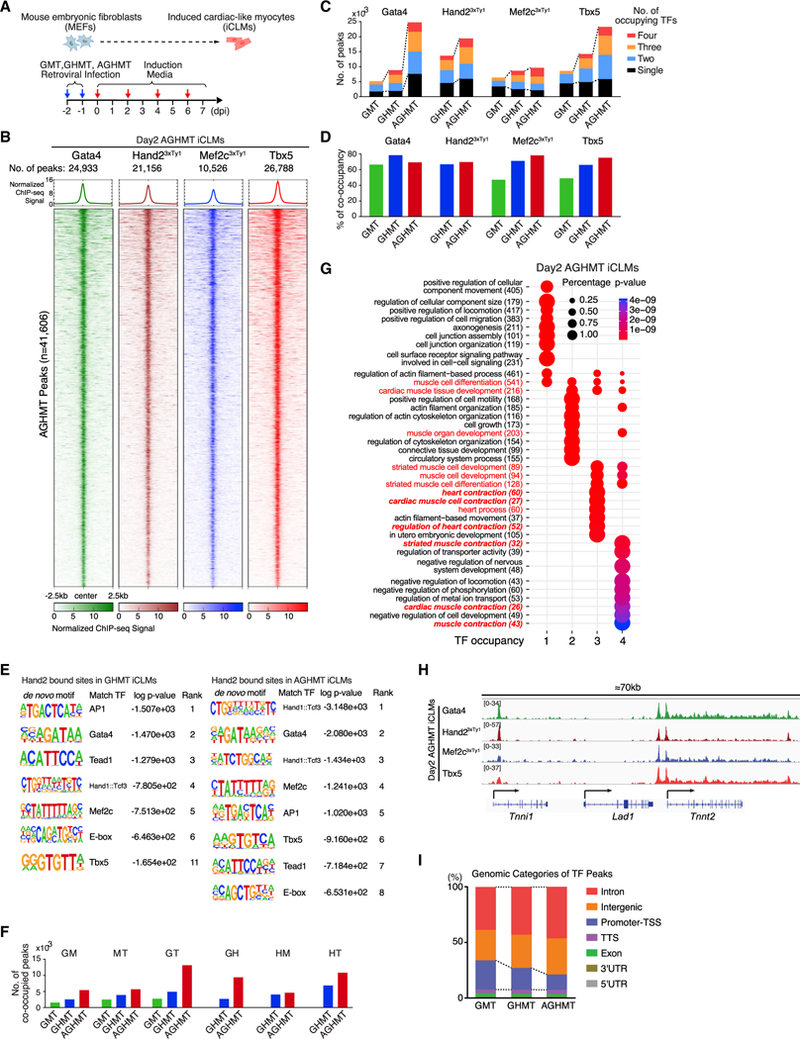
(A) Strategy for cardiac reprogramming in MEFs. (dpi, days post-induction.)
(B) ChIP-seq data for Gata4, Hand2, Mef2c, and Tbx5 display co-occupancy at 41,606 genomic binding sites in day 2 AGHMT iCLMs. ChIP-seq signal heatmap using a 5 kb window was centered on peak regions and sorted in descending order by signal intensity.
(C) Number of TF peaks of GMT, GHMT, and AGHMT in day 2 iCLMs.
(D) Percentage of TF peaks co-occupied by more than two TFs.
(E) De novo motifs identified at Hand2 bound sites in day 2 iCLMs by HOMER.
(F) Number of TF peaks with different pairs of TFs in day 2 iCLMs.
(G) TF peaks were annotated to the nearest neighboring genes, and GO enrichment analysis was performed with DAVID (v.6.8). GO enrichment from different groups based on the number of occupying TFs was performed with clusterProfiler (v.3.6.0).
(H) Genome browser view showing the co-occupancy of Gata4, Hand2, Mef2c, and Tbx5 in a 70 kb window encompassing Tnni1, Lad1, and Tnnt2 genes in day 2 iCLMs.
(I) GMT, GHMT, and AGHMT ChIP-seq peaks were classified into seven genomic categories. Dashed lines connect the group of intronic and intergenicTF peaks.
See also Figures S1 and S2 and Table S1.
To assess the distribution of genomic binding sites occupied by the TFs in response to the AGHMT cocktail, we plotted the ChIP signals that were present in at least one of the peaks for Gata4, Hand2, Mef2c, andTbx5 (defined as AGHMT peaks; total n = 41,606). Interestingly, this analysis revealed substantial co-occupancy of reprogramming TFs, with ~50% of peaks being co-occupied by at least two TFs at these regions (Figure 1B; Table S1). These findings suggest that Gata4, Hand2, Mef2c, and Tbx5 are synchronously recruited to genomic sites during cardiac reprogramming. To understand the effect of Hand2 and Akt1 on TF binding, we repeated ChIP-seq in day 2 GMT and GHMT iCLMs and similarly found co-occupancy of TFs in genomic binding sites during GMT and GHMT reprogramming, albeit to reduced proportions compared to AGHMT (~33% and ~46% of peaks were co-occupied, respectively) (Figures S2A and S2B; Table S1).
Since the percentage of co-occupancy differed between reprogramming cocktails, we analyzed the occurrence of co-occupancy among individual TF peaks (Table S1). Interestingly, addition of Hand2 increased the proportion of co-occupancy in Gata4, Mef2c, and Tbx5 peaks, indicating the recruitment of these TFs to additional chromatin sites by Hand2 (Figures 1C and 1D). To further define the Hand2-responsive elements, we performed de novo motif discovery of the Hand2 peaks using HOMER (Heinz et al., 2010). Consistently, motifs recovered from Hand2 peaks matched the consensus E-box motif, a DNA element that is usually bound by basic helix-loop-helix (bHLH) proteins, such as Hand2 (Figure 1E) (Laurent et al., 2017). Moreover, Hand2 peaks were enriched for consensus motifs for Gata4, Mef2c, and Tbx5, suggesting that these factors may directly bind to Hand2-enriched binding sites. Other enriched motifs corresponded to consensus sites for binding of TF AP-1 and TEA domain family member 1 (Tead1), which are known transcriptional regulators of heart development (Jahangiri et al., 2016; Yoshida, 2008).
Addition of Akt1 dramatically increased the number of Gata4 binding sites, consistent with previous reports demonstrating Gata4 transcriptional regulation by the Akt1/GSK3 β pathway (Condorelli et al., 2002; Morisco et al., 2001) (Figure 1C). Since Gata4 is known to physically interact with Mef2c, Hand2, and Tbx5 and thereby synergistically activate cardiac gene expression, we analyzed the number of TF peaks shared by different pairs of reprogramming TFs (Ang et al., 2016; Dai et al., 2002; Maitra et al., 2009; Morin et al., 2000). Akt1 significantly expanded the co-binding sites of Gata4-Hand2 (GH) and Gata4-Tbx5 (GT) pairs, suggesting Gata4 is a key factor in enhancement of reprogramming by Akt1 (Figure 1F). Although these binding pairs increased with the addition of Hand2, the increase was not as striking in comparison to Akt1. Thus, Hand2 expanded the co-occupancy of reprogramming TFs, whereas Akt1 increased the total number of binding sites.
To gain broader insights into the significance of TF co-occupancy, we annotated each TF peak to its nearest neighboring gene and compared gene ontology (GO) term enrichment among the TF peaks clustered by the number of TFs bound using clusterProfiler (Yu et al., 2012). Remarkably, annotation of co-occupied TF binding sites compared to single TF peaks in GMT (Figure S2C), GHMT (Figure S2D), and AGHMT (Figure 1G) showed stronger enrichment in heart- or muscle-related GO terms, with higher significance in GHMT and AGHMT iCLMs. As a representative example, the promoter region of Tnnt2, which encodes cardiac muscle troponin T, displayed co-occupancy of Gata4, Hand2, Mef2c, and Tbx5 in day 2 AGHMT iCLMs (Figure 1H).
Since addition of Hand2 and Akt1 increased the number of TF peaks, we analyzed the location of these TF peaks to see whether there were any commonalities among the newly generated peaks. Interestingly, we found that addition of Hand2 and Akt1 decreased the proportion of TF peaks in promoter regions and increased binding at introns and intergenic regions (Figures 1I and S2E). This pattern suggests that Hand2 and Akt1 may function to coordinate the recruitment of TFs to potential enhancer elements.
Reprogramming Factors Coordinate the Activation of Cardiac Enhancers
Although activation at gene promoters is important for transcriptional regulation, distal enhancers play a pivotal role in directing tissue-specific gene expression, especially during lineage commitment in development (Creyghton et al., 2010; Wamstad et al., 2012). The activation of a distinct enhancer network may underlie direct cardiac reprogramming, and we sought to characterize this regulatory landscape by performing ChlP-seq for the active enhancer histone mark, H3K27ac, after 2 days of cardiac reprogramming (Creyghton et al., 2010). We recovered between 80,000 and 100,000 H3K27ac peaks in mock-infected MEFs and iCLMs reprogrammed with GMT, GHMT and AGHMT. Of these, peaks that were present in promoter regions (−2,000 to +2,000 bp from the transcription start site [TSS]) were excluded from further analyses to focus on cardiac enhancers (King et al., 2016). We then compared the H3K27ac enhancer peaks among different populations in day 2 iCLMs and clustered them into three groups: H3K27ac peaks in fibroblasts that were lost in iCLMs (Fibroblast-E), maintained during the cardiac reprogramming process (Mock-Shared-E), and enriched specifically in iCLMs (Reprogramming-E) (Figure 2A). Among the Fibroblast-E peaks, we identified subsets of enhancers that were silenced in response to GMT, Hand2 (GHMT), or Akt1 (AGHMT) (Figure 2A).
Figure 2. Synergistic Enhancer Activation during Reprogramming.
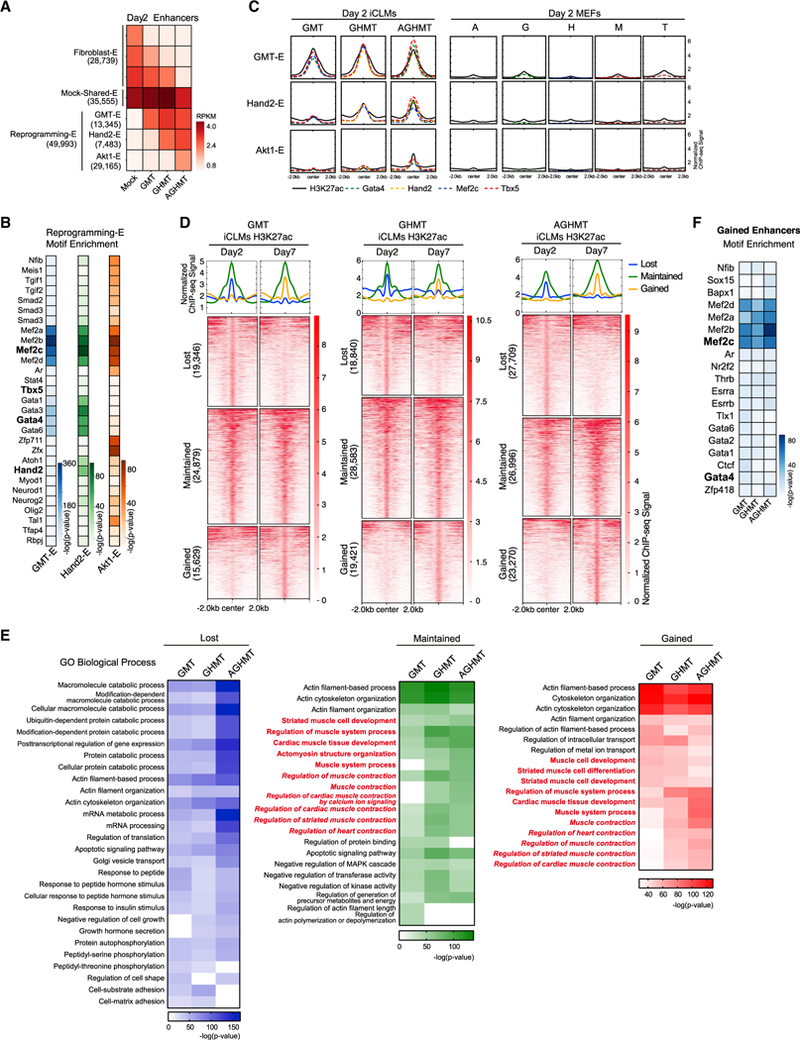
(A) H3K27ac enhancer peaks in day 2 iCLMs clustered into three groups (Fibroblast-Enhancer, Mock-Shared-Enhancer, and Reprogramming-Enhancer). Fibroblast-Enhancer and Reprogramming-Enhancer were then sub-clustered into groups depending on their response to GMT, GHMT, and AGHMT (GMT-E, Hand2-E, and Akt1-E for Reprogramming-E). Each box represents the mean RPKM H3K27ac enhancer signals of the group of enhancers.
(B) Heatmaps of known motifs enriched in GMT-E, Hand2-E, and Akt1-E peaks.
(C) Normalized ChIP-seq binding profiles for H3K27ac and TFs show similar distribution patterns on a genome-wide scale in iCLMs. TF peaks show higher correlation with Hand2-E and Akt1-E peaks in the presence of Hand2 and Akt1, respectively. Single-factor overexpressing MEFs show weak signals of H3K27ac and TF binding at the Reprogramming-E regions.
(D) Heatmaps of reprogramming enhancers clustered into three distinct groups depending on differences between day 2 and 7 iCLMs.
(E) Heatmaps of overrepresented terms belonging to the Biological Process GO in each enhancer cluster. Terms related to heart or muscle contraction are highlighted in red italics.
(F) Heatmap of known motifs enriched in enhancers gained by day 7 compared to day 2 iCLMs.
To identify enhancers uniquely activated by Hand2 and Akt1, we then focused on those histone marks present only during the cardiac reprogramming process (Reprogramming-E) and compared these among the different iCLM populations. We were able to cluster the Reprogramming-E peaks into the following groups: H3K27ac enhancer peaks that were maintained among GMT, GHMT, and AGHMT reprogramming (GMT-E, n = 13,345), responsive to Hand2 (Hand2-E, n = 7,483), and responsive to Akt1 (Akt1-E, n = 29,165) (Figures 2A and S3A). To evaluate the functional relevance of these sub-groups of enhancer regions, we annotated the peaks to nearest genes using Genomic Regions Enrichment of Annotations Tool (GREAT) (McLean et al., 2010). This in silico analysis revealed that genes associated with the GMT-E and Hand2-E peaks associated strongly with the GO term for muscle system process (Figure S3B). Additionally, these genes showed expression patterns detected in the cardiovascular system based on the Mouse Genomics Informatics (MGI) database. In contrast, annotation of Akt1-E peaks did not show strong enrichment in muscle- or heart-related GO terms but rather strong enrichment related to chromatin and histone modification (Figure S3B). This may suggest that Akt1 acts indirectly to further activate regulatory elements during the reprogramming process.
To define the relationship between enhancers and reprogramming TF binding, we performed a motif discovery of the Reprogramming-E peaks using HOMER. Indeed, all four reprogramming TF consensus motifs were enriched in the Reprogramming-E peaks. However, Mef2c motifs were most dominantly represented in all three of the Reprogramming-E groups, suggesting that transcriptional activation is mainly occurring in the vicinity of Mef2c binding sites (Figure 2B; Table S2). We then overlapped these enhancer regions with the reprogramming TF binding sites previously identified (Figures 1B, S2A, and S2B). Accordingly, the Reprogramming-E regions showed an abundant overlap with multiple reprogramming TF binding sites (Figure 2C). Interestingly, although Hand2-E and Akt1-E peaks were enriched with reprogramming TF motifs, TF binding at these regions was dependent on Hand2 and Akt1, respectively (Figure 2C). This indicates that Hand2 and Akt1 facilitate TF access to these enhancer regions enriched with Mef2c motifs, thereby increasing the co-occupancy of reprogramming TFs.
To determine whether a single reprogramming factor can sufficiently activate reprogramming enhancers, we also performed H3K27ac and TF ChlP-seq in MEFs solely overexpressing each single factor, 2 days post-infection. Each single factor showed approximately 25,000–45,000 newly generated H3K27ac peaks compared to mock-infected cells (Figure S3C). Although these single-factor unique enhancers (SFEs) (Akt1-SFE, Gata4-SFE, Hand2-SFE, Mef2c-SFE, and Tbx5-SFE) showed some overlap in their peaks, known motif discovery revealed that SFE regions were not highly enriched with all four reprogramming TF motifs (Figures S3D and S3E). Additionally, GO analysis of the single-factor responsive enhancers did not show enrichment with heart- or muscle-related terms (Figure S3F). Most importantly, single-factor responsive enhancers and single-factor TF peaks did not show strong signals in the Reprogramming-E regions (Figure 2C). Together, these data suggest that the initial process of cardiac reprogramming is activated by cooperative actions of cardiogenic factors at regulatory elements highly enriched with Mef2c binding sites.
To further explore the temporal dynamics of the reprogramming enhancers, we performed H3K27ac ChlP-seq in day 7 iCLMs and compared the enhancer profile with day 2 iCLMs, since spontaneous beating initiates around day 7 in AGHMT-induced iCLMs. We then clustered day 2 and day 7 iCLM enhancers into three distinct groups: those enhancer sites that were lost, maintained, or gained by day 7 relative to day 2 iCLMs (Figure 2D). Enhancers lost by day 7 displayed GO terms related to general cellular processes such as catabolic and mRNA processes, transcriptional regulation, and protein phosphorylation (Figure 2E). In contrast, annotation of the enhancers gained or maintained by day 7 revealed a significant association with GO terms related to cytoskeleton processes and heart or muscle processes including differentiation, development, and contraction (Figure 2E). This suggests that, after the activation of the reprogramming enhancer landscape on day 2, additional time is required for establishment of the mature cardiac enhancer landscape. Interestingly, motif discovery at enhancers gained by day 7 in all three iCLM groups again yielded strong enrichment of Mef2c consensus motifs, indicating a persistent regulatory function of Mef2c for maturation during reprogramming (Figure 2F; Table S3). However, gained enhancers in GMT, GHMT, and AGHMT were mostly unique to each cocktail (Figure S3G). The strong enrichment of heart- and muscle-related GO terms in gained enhancers of GHMT and AGHMT-treated iCLMs suggests that Hand2 and Akt1 also carry out a unique role in iCLM maturation. The distinct effect of Hand2 and Akt1 in enhancing iCLM maturation is also supported by the fact that day 2 Hand2-E and Akt1-E regions are not sufficiently activated later in day 7 mock or GMT iCLMs (Figure S3H).
Cardiac Reprogramming Shares Enhancers with Cardiogenic Processes
To explore the relationship between cardiac enhancer activation during reprogramming and other cardiogenic processes, we first compared reprogramming enhancers with enhancers activated during cellular differentiation. By using an embryonic stem cell (ESC) cardiac differentiation H3K27ac ChlP-seq dataset, we first overlapped Reprogramming-E regions from Figure 2A with the active enhancers in different stages defined as ESC, mesoderm (MES), cardiac precursor (CP), and CM by stage-specific expression of functionally related genes (Wamstad et al., 2012). Interestingly, Reprogramming-E regions showed overlap with all four differentiation stages but predominantly with CP and CM stages (Figure 3A). GO analysis of these overlapping enhancers using GREAT showed enrichment of terms related to heart or muscle differentiation, development, and contraction, particularly in CP and CM stages (Figure 3B). These findings suggest that the direct cardiac reprogramming process follows an epigenetic trajectory of cellular differentiation primarily from the CP stage.
Figure 3. Conservation of the Reprogramming Enhancer Landscape in Cardiogenic Processes.
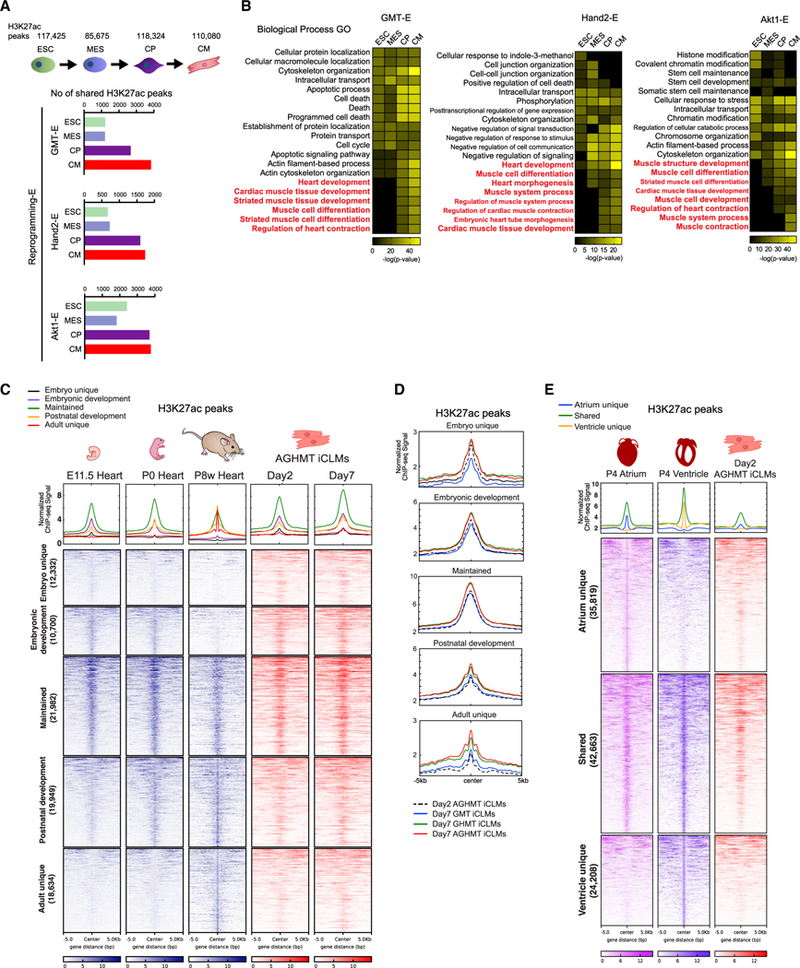
(A) Comparison of Reprogramming-E peaks with active enhancers in embryonic stem cells (ESC), mesoderm (MES), cardiac precursors (CP), and cardiomyocytes (CM).
(B) Heatmaps of overrepresented terms belonging to the Biological Process GO using GREAT in each reprogramming enhancer cluster.
(C) Heatmaps of H3K27ac enhancer ChIP-seq signals of E11.5, P0, and P8 week hearts from ENCODE datasets, and day 2 and 7 AGHMT iCLMs clustered according to their appearance in different developmental stages.
(D) Normalized ChIP-seq binding profiles for H3K27ac of day 2 AGHMT, and day 7 GMT, GHMT, and AGHMT iCLMs, in each developmental cluster from Figure 3C are shown.
(E) Heatmap of H3K27ac enhancer ChIP-seq signals of P4 atrium, ventricle, and day 2 AGHMT iCLMs using a 10 kb window, clustered according to their presence in P4 atrium and ventricle. Normalized ChIP-seq binding profiles for H3K27ac in each cluster are shown.
We then compared the enhancer landscape of AGHMT-treated iCLMs with ENCODE H3K27ac datasets of hearts from different developmental stages to reveal the relationship between reprogramming and heart development (Consortium, 2012). We first clustered active heart enhancers according to their appearance in different developmental stages: active enhancers that are unique to E11.5 heart (Embryo unique), shared among E11.5 and P0 hearts (Embryonic development), shared among E11.5, P0, and P8 week hearts (Maintained), shared among P0 and P8 week hearts (Postnatal development), and unique to P8 week heart (Adult unique) (Figure 3C). Strikingly, AGHMT iCLM enhancer peaks showed the strongest signal intensity in the Maintained cluster regions, then in the Embryonic development and Postnatal development cluster regions, and weak signal intensity in the Embryo unique and Adult unique cluster regions (Figure 3C). This explains that, among these three developmental stages, iCLMs represent a similar enhancer landscape to that of the neonatal heart, where the heart is switching from embryonic to adult enhancers. Interestingly, day 7 AGHMT iCLM enhancers showed stronger enrichment in Postnatal development and Adult unique clusters compared to day 2 AGHMT iCLMs (Figure 3D). Moreover, day 7 AGHMT iCLM enhancers also showed stronger enrichment in these two clusters compared to day 7 GMT and GHMT iCLM enhancers (Figure 3D). These findings suggest that continuous culture of iCLMs and addition of Hand2 and Akt1 both enable iCLMs to gain active enhancers unique to the postnatal heart as it matures (Figure 3D).
We were also interested in whether iCLM enhancers show any correlation with sub-regional cardiac enhancers in vivo. To define these enhancers, we performed H3K27ac ChIP-seq on P4 atrium and ventricle, since the neonatal heart demonstrates the highest similarity with iCLM enhancers. We then clustered enhancers active in P4 atrium and ventricle using a similar approach as in our previous analyses: active enhancers that are unique to P4 atrium (Atrium unique), shared among P4 atrium and ventricle (Shared), and unique to P4 ventricle (Ventricle unique) (Figure 3E). Overlap with the day 2 AGHMT iCLM enhancers showed that iCLMs are predominantly enriched with “Shared” enhancers, consistent with our previous report of diverse cardiac cell types induced during cardiac reprogramming (Nam et al., 2014).
Overall, these analyses revealed commonalities in enhancer activation between cardiac reprogramming and other cardiogenic processes. Although iCLMs are epigenetically linked to CP and CM stages in terms of lineage commitment, iCLMs are still immature, demonstrating closest similarity to neonatal heart enhancers and lacking activation of maturation enhancers.
Reprogramming Enhancers Display Diverse Cardiac Expression Patterns In Vivo
To determine whether reprogramming enhancers were also active in vivo, we overlapped iCLM enhancers (Mock-Shared-E and Reprogramming-E) with enhancers shown to be active in the mouse heart as verified in the VISTA Enhancer Browser (Blow et al., 2010; Visel et al., 2007). Of our iCLM enhancers, 119 enhancers overlapped with 158 mouse heart enhancers available in the VISTA dataset, confirming the in vivo cardiac activity of certain reprogramming enhancers (Figure 4A; Table S4). Analysis of transgenic mouse LacZ enhancer reporter assays on 18 elements from the 119 overlapping VISTA elements revealed the subregional cardiac activity of iCLM enhancers, which showed strong LacZ signal localized in the myocardium of the embryonic heart at E11.5 (Figures 4B, S4A, and S4B; Table S5). This finding that reprogramming enhancers display various subregional in vivo cardiac activity patterns is compatible with our previous analysis showing strongest enrichment of reprogramming enhancer signals in atrium and ventricle shared enhancer regions (Figure 3E).
Figure 4. In Vivo Cardiac Activity of Reprogramming Enhancers.
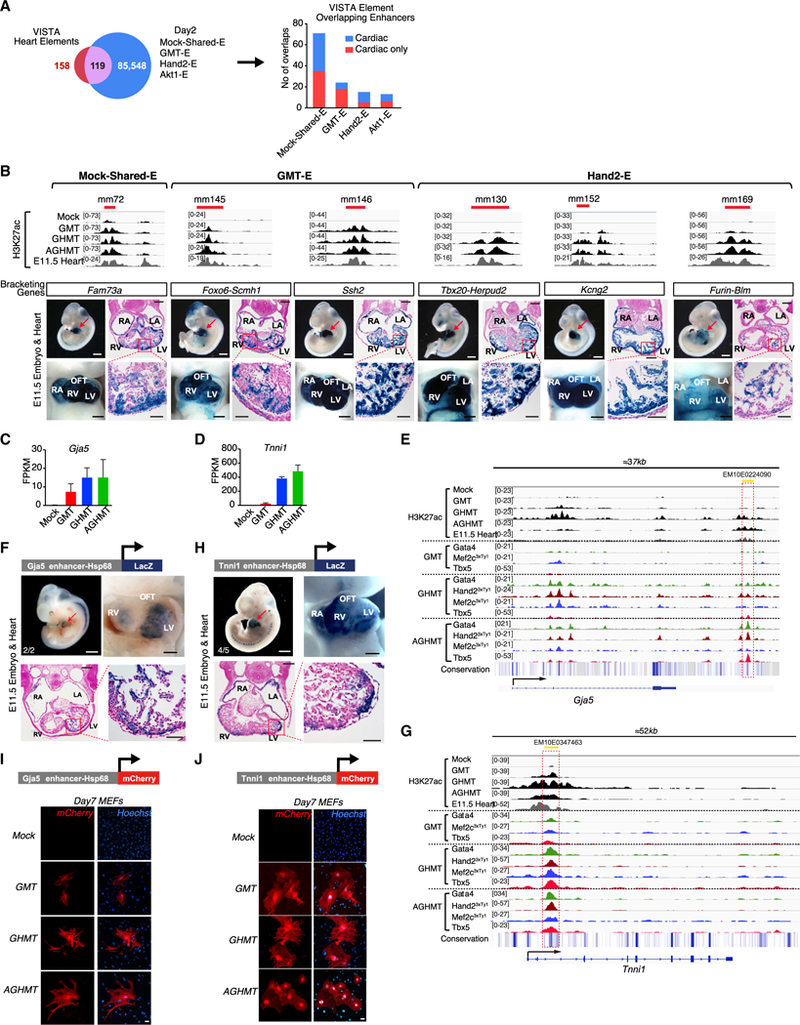
(A) iCLM enhancers (Mock-Shared-E + GMT-E + Hand2-E + Akt1-Efrom Figure 2A) were overlapped with 158 mouse heart enhancers from the VISTA enhancer database, which showed an overlap of 119 enhancers. Numbers of iCLM enhancers in different groups overlapping with the VISTA heart enhancers are shown. “Cardiac only” indicates enhancers that show exclusively cardiac activity and “Cardiac” indicates enhancers that show activity in the heart plus other tissues, based on the VISTA database.
(B) Top: H3K27ac enrichment profiles showing predicted enhancers. Red bars indicate respective VISTA enhancer elements. Bottom: subregional cardiac enhancer activities of six VISTA heart enhancers that overlap iCLM enhancers. Shown is a representative transgenic E11.5 embryo with LacZ reporter staining (blue) indicating enhancer activity. Red arrowhead indicates the heart and heart sections that were counter-stained with Nuclear Fast Red. (white scale bars: 1 mm; black scale bars: 500 μm for whole-mount heart and 200 and 50 μm for low- and high-magnification histology sections, respectively)
(C and D) mRNA expression of Gja5 (C) and Tnnil (D) is upregulated in day 2 iCLMs based on RNA-seq (n = 3 per group). Data are represented as mean ± SD.
(E) A highly conserved putative regulatory element ~25 kb downstream of the Gja5 locus (Gja5-E) that overlaps with an ENCODE based candidate Regulatory Element (EM10E0224090) is co-occupied by TFs during cardiac reprogramming. Conservation track was generated from Euarchontoglires subset of the UCSC genome browser.
(F) Schematic of Gja5 enhancer LacZ construct and a representative image of E11.5 transgenic embryo and heart stained with β-galactosidase showing LacZ expression in the heart. Numbers indicate embryos with cardiac expression over the total LacZ+ genotyped embryos (white scale bar: 1 mm; black scale bar: 500 mm). A section of the E11.5 transgenic heart was counter-stained with Nuclear Fast Red (black scale bars: 200 and 50 μm for low-and high-magnification histology sections, respectively).
(G) A highly conserved putative regulatory element in the Tnni1 intronic locus that overlaps with an ENCODE based candidate Regulatory Element (EM10E0347463) is co-occupied by TFs during cardiac reprogramming. The red dashed box indicates the region of the putative regulatory element.
(H) Schematic of Tnni1 enhancer LacZ construct and a representative image of E11.5 transgenic embryo and heart stained with β-galactosidase showing LacZ expression in the heart. Numbers indicate embryos with cardiac expression over the total LacZ+ genotyped embryos (white scale bar: 1 mm; black scale bar, 500 μm). A section of E11.5 transgenic heart was counter-stained with Nuclear Fast Red (Black scale bars, 200 and 50 μm for low- and high-magnification histology sections, respectively).
(I and J) Schematic of Gja5 (I) and Tnni1 (J) enhancer mCherry construct. Gja5-E- or Tnni1-E-Hsp68-mCherry was retrovirally delivered to MEFs together with the reprogramming factors. Representative image of day 7 mock-infected, GMT, GHMT, and AGHMT MEFs shows mCherry expression. (Bars, 50 μm.)
See also Figures S4 and S5, Table S4, and Table S5.
We also tested two reprogramming enhancers that did not overlap with the mouse VISTA heart elements using transgenic mouse reporter assays. We chose two enhancers co-occupied by TFs that neighbor the genes Gja5 or Tnni1, since these two genes are well characterized and strongly upregulated during reprogramming (Figures 4C and 4D). Gja5 encodes Connexin 40 (Cx40), a gap junction protein that plays an important role in the cardiac conduction system (Bagwe et al., 2005). We identified a highly conserved enhancer ~25 kb downstream of Gja5, which was activated and associated with TF co-occupancy during cardiac reprogramming in the presence of Hand2 (Figure 4E). This 664 bp enhancer is a short fragment homologous to part of the VISTA human element hs2126 (5,192 bp) and also partially overlapped with a candidate regulatory element EM10E0224090 from Search Candidate Regulatory Elements by ENCODE (SCREEN) (Consortium, 2012; Dickel et al., 2016). LacZ staining confirmed strong activity of this putative Gja5 enhancer (Gja5-E) in the myocardium of multiple chambers at E11.5 as well as at other stages of embryonic development (Figures 4F and S5A). Tnni1 encodes the predominant Troponin I isoform expressed in embryonic skeletal and cardiac muscle (Corin et al., 1994). We identified a highly conserved enhancer (1,171 bp) in an intronic region of Tnni1, which was activated and associated with TF co-occupancy during reprogramming, and partially overlapped with SCREEN candidate regulatory element EM10E0347463 (Figure 4G). LacZ staining confirmed strong activity of this putative Tnni1 enhancer (Tnni1-E) in the myocardium of multiple cardiac chambers at E11.5 and E13.5 (Figures 4H and S5B).
Additionally, we generated Gja5- and Tnni1-E-Hsp68-mCherry retroviral constructs to test enhancer activity during reprogramming. Retroviral delivery of these individual constructs along with reprogramming factors resulted in activation of mCherry expression in iCLMs, confirming that these enhancers are activated during reprogramming (Figures 4I, 4J, and S5C–S5G).
iCLM Transcriptional Modules Correlate with the Reprogramming Enhancer Landscape
To understand the correlation between reprogramming enhancers and gene expression profiles during reprogramming, we performed RNA sequencing (RNA-seq) on day 2 iCLMs. In silico analyses using PANTHER indicated that upregulated genes in GMT, GHMT, and AGHMT iCLMs compared to Mock (GMT-up, GHMT-up, and AGHMT-up) were associated with GO terms related to heart and muscle development, while down-regulated genes (GMT-down, GHMT-down, and AGHMT-down) were associated with terms related to cell cycle (Mi et al., 2017) (Figures 5A–5C). To clarify the relationship between enhancer activation and transcriptional dynamics during reprogramming, we annotated the Reprogramming-E peaks to the nearest neighboring genes and calculated enrichment significance by hypergeometric distribution. This analysis revealed a significant correlation between Reprogramming-E peaks and upregulated genes in iCLMs, supporting the hypothesis that activation of enhancers by TF co-occupancy contributes to gene activation during reprogramming, and Hand2 and Akt1 enhance this process (Figure 5D). For example, Hand2-andAkt1-dependent activation of H3K27ac peaks near the Myh6, Mhrt, and Myh7 locus is associated with their transcriptional upregulation in day 2 iCLMs (Figure 5E). We then performed global differential gene expression analyses in different iCLMs and clustered the genes uniquely responsive to GMT, Hand2,orAkt1 (Figure 5F). Consistent with previous reports of reprogramming enhancement by Hand2 and Akt1, in silico analyses revealed that Hand2- and Akt1-responsive genes displayed high enrichment in heart and muscle development and contraction-related GO terms (Figure 5G) (Song et al., 2012; Zhou et al., 2015).
Figure 5. Reprogramming Enhancers Positively Correlate with Gene Upregulation during Cardiac Reprogramming.
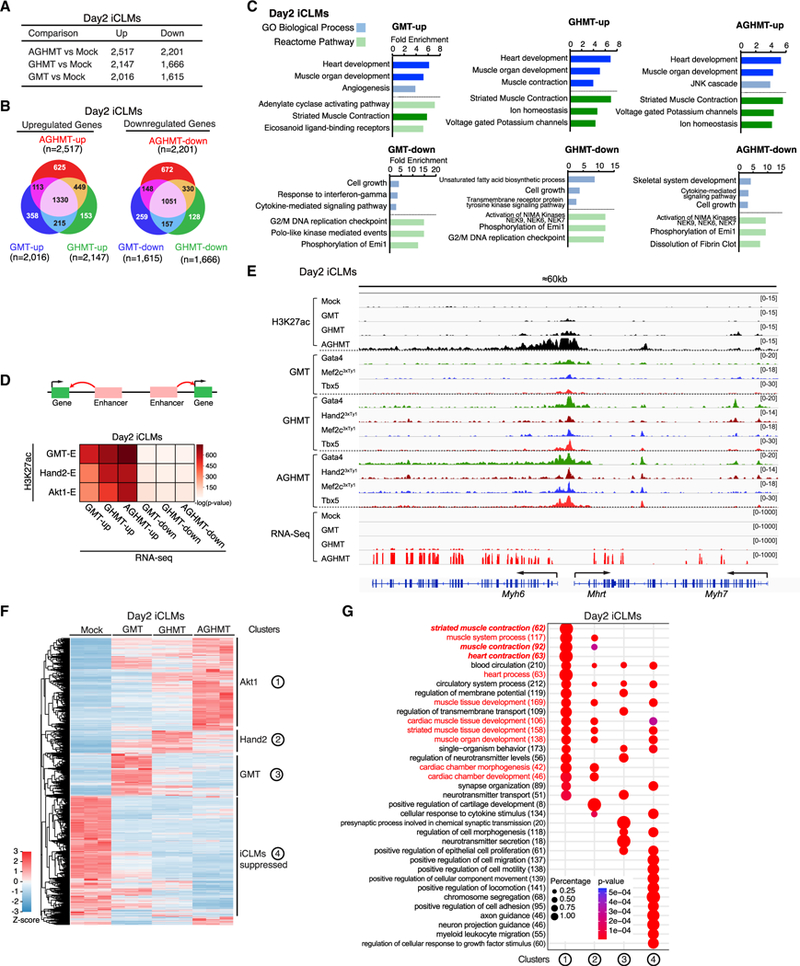
(A and B) Table (A) and Venn diagrams (B) displaying the number of common and unique genes upregulated and downregulated in GMT, GHMT, and AGHMT day 2 iCLMs compared to mock (n = 3 per group).
(C) In silico functional annotation of day 2 iCLM gene sets performed using PANTHER, and the three most overrepresented GO Biological Process (blue) and Reactome Pathway (green) terms are shown. Terms related to heart or muscle are highlighted in dark colors.
(D) The enrichment significance of differentially expressed genes (columns) overlapping the reprogramming enhancer cluster (rows) in day 2 iCLMs was calculated using hypergeometric distribution.
(E) A genome browser view of the Myh6, Mhrt, and Myh7 locus showing Hand2-andAkt1-dependent activation ofH3K27ac peaks withTF co-occupancy,which is associated with mRNA upregulation in day 2 iCLMs.
(F) Heatmap of normalized FPKMs for all differentially expressed genes that meet inclusion criteria (|log2 FC| ≥ 1.0,p value ≤ 0.01, false discovery rate [FDR] ≤ 1%) for GMT, GHMT, and AGHMT day 2 iCLMs compared to mock-infected MEFs.
(G) Genes from clusters corresponding to the numbers in (E) were used to perform GO enrichment analysis for Biological Process with DAVID (v.6.8). clusterProfiler (v.3.6.0) was used to visualize GO term enrichment. Terms related to heart or muscle are highlighted in red, and heart- or muscle-contraction-related terms are highlighted in red italics.
See also Figure S6.
We also performed RNA-seq on day 7 iCLMs to study the transcriptional dynamics during reprogramming. In agreement with delayed activation of cardiac enhancers annotated to functional phenotypes (Figure 2E), genes that were upregulated between day 2 and 7 showed significant enrichment in GO terms related to heart or muscle contraction, while downregulated genes were highly enriched in terms related to extracellular matrix (ECM) (Figure S6A). Additionally, approximately half of the genes in day 2 iCLM clusters 1 (Akt1) and 2 (Hand2) were upregulated in day 7 GHMT or GMT iCLMs, suggesting that Akt1 and Hand2 both enhance reprogramming by possibly inducing and accelerating unique gene expression (Figure S6B).
iCLM GRN Reveals Transcriptional Targets of Reprogramming Factors
We next investigated the relationship between transcriptional regulation by TFs in reprogramming and the heart in vivo. We performed ChIP-seq on P4 mouse ventricle for Gata4 and Tbx5 (GT) and compared the data with day 2 AGHMT iCLM GT peaks. Among the 33,409 iCLM GT peaks, 19,808 peaks were also bound by GT in the P4 ventricle, suggesting that certain reprogramming regulatory elements are also co-occupied by reprogramming factors in vivo (Figure 6A). However, iCLMs had 13,601 unique GT peaks, which could potentially be regulatory elements contributing to the reprogramming process. In silico analyses using GREAT showed enrichment of GO terms related to cardiac and muscle development and differentiation in the shared and P4 ventricle unique GT peaks (Figure 6B). In contrast, unique iCLM GT peaks showed enrichment of noncardiac GO terms, which suggested that the role of reprogramming TFs in transcriptional regulation during reprogramming could differ from in vivo cardiac development.
Figure 6. Construction of GRN during Cardiac Reprogramming.
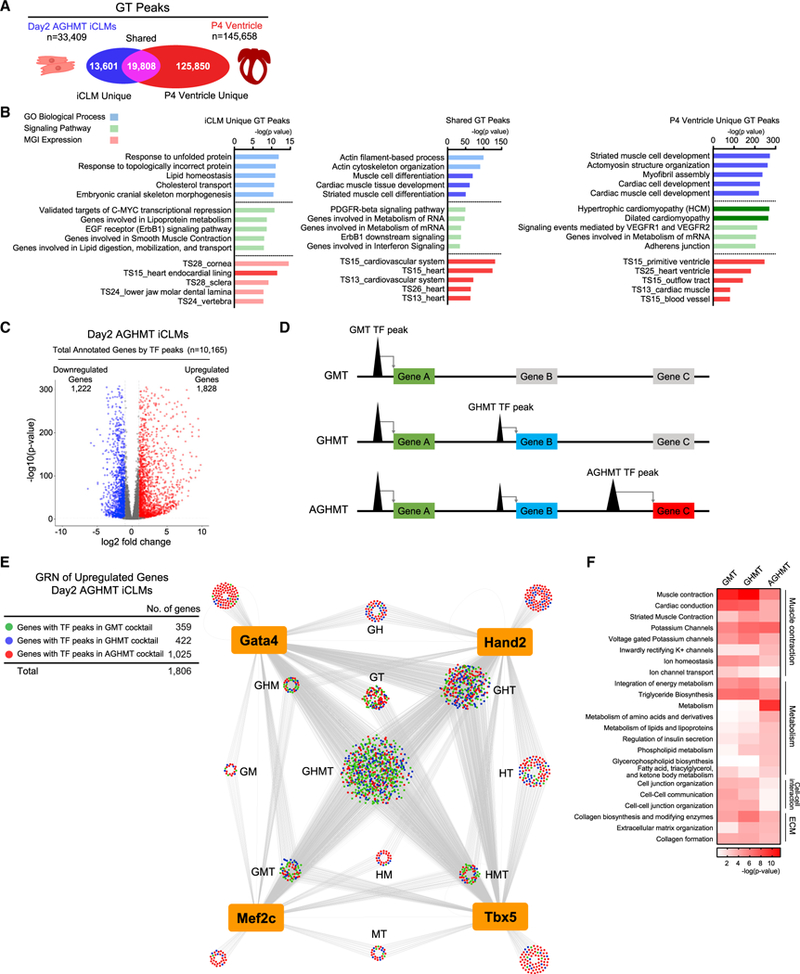
(A) Comparison of Gata4 and Tbx5 (GT) peaks between day 2 AGHMT iCLMs and P4 ventricle.
(B) In silico functional annotation using GREAT showing the five most overrepresented GO Biological Process (blue), Signaling Pathway (green), and MGI Expression (red) terms. Terms related to heart or muscle are highlighted in dark colors.
(C) Volcano plot of all differentially expressed genes annotated by day 2 AGHMT iCLMs TF peaks. Genes with their expression increased or decreased greater than 2-fold in AGHMT iCLMs compared to mock-infected MEFs with p value <0.01 are colored in red and blue, respectively.
(D) Strategy for constructing GRN. Genes were colored according to their nearest TF peaks, if the peak activation was GMT (green), Hand2 (GHMT) (blue), orAktl (AGHMT) (red) dependent.
(E) GRN of reprogramming factors and upregulated genes in day 2 AGHMT iCLMs. Each node represents a gene and edges are drawn to all the annotated genes of reprogramming TF peaks.
(F) Genes colored in green (GMT), blue (Hand2), or red (Akt1) in (E) were used in GO analyses using PANTHER. Heatmap shows upregulated signaling pathways targeted by reprogramming factors.
See also Table S6.
Therefore, to study the cooperative actions of reprogramming TFs in transcriptional regulation during reprogramming, we decided to construct a GRN of reprogramming factors in day 2 AGHMT iCLMs. We first annotated all TF peaks (41,606) of day 2 AGHMT iCLMs in Figure 1B to their nearest neighboring genes and clustered the TF binding peaks depending on their target gene expression (Figure 6C). We then took the genes upregulated in day 2 AGHMT iCLMs compared to mock-infected MEFs and colored them according to their nearest TF peak to denote whether the activation was GMT (green), Hand2 (GHMT) (blue), or Akt1 (AGHMT) (red) dependent (Figure 6D). Finally, connecting each gene with reprogramming factors based on the TF peaks provided a GRN of reprogramming factors with their potential direct target genes during reprogramming (Figure 6E). Consistent with our finding of enhancer activation by co-occupancy, most of the upregulated genes were regulated by at least two reprogramming factors, with the largest numbers in GHMT (n = 700) and GHT (n = 332) groups (Table S6). In silico analysis using PANTHER showed that genes in the upregulated GRN were highly enriched in GO terms related to muscle contraction, metabolism, cell-cell interaction, and ECM, consistent with fibroblasts converting to a contracting muscle cell with high metabolic demand (Figure 6F).
We then constructed a GRN of downregulated genes in day 2 AGHMT iCLMs compared to mock-infected MEFs, which also showed that the largest number of genes were regulated by GHMT (n = 290) and GHT (n = 265) groups (Figure 7A; Table S6). Genes in the downregulated GRN showed high enrichment in GO terms related to the cell cycle, ECM, and inflammation pathways, which have been reported to enhance reprogramming by their suppression (Figures 7B, S7A, and S7B) (Liu et al., 2017; Zhao et al., 2015; Zhou et al., 2017). Additionally, in the downregulated GRN, we unexpectedly found enrichment of genes related to the EGF receptor (Egfr/Erbb1) signaling (Figures 7C and 7D). Interestingly, the Egfr signaling pathway was also shown to be enriched in our previous in silico analysis of iCLM unique and shared GT peaks (Figure 6B). Moreover, re-programming TF peaks unique to AGHMT iCLMs were identified within the Egfr locus (Figure S7C). These peaks were associated with a dampening of H3K27ac signal, suggesting that ectopic binding of the reprogramming TFs in iCLMs may suppress Egfr expression (Figure S7C).
Figure 7. Inhibition of EGFR Signaling Enhances Cardiac Reprogramming.
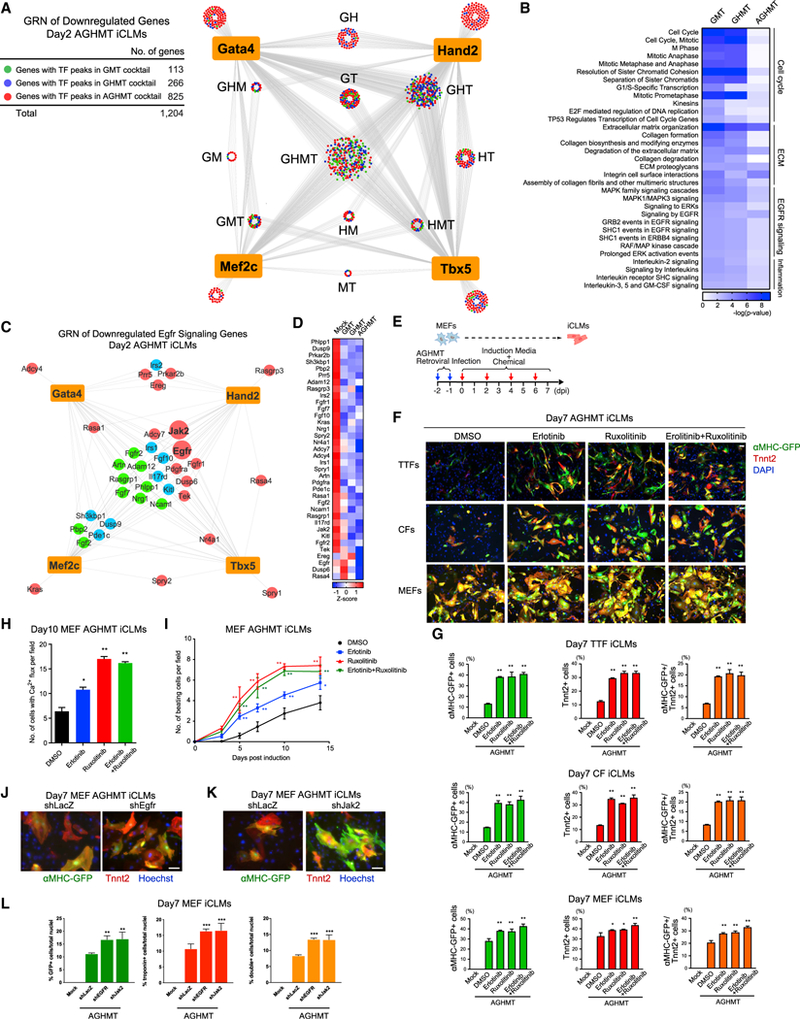
(A) GRN of reprogramming factors and downregulated genes in day 2 AGHMT iCLMs. Each node represents a gene and edges are drawn to all the annotated genes of reprogramming TF peaks.
(B) Genes colored in green (GMT), blue (Hand2), or red (Akt1) in (A) were used for GO analyses using PANTHER. Heatmap shows downregulated signaling pathways targeted by reprogramming factors.
(C) GRN of downregulated Egfr signaling pathway genes in day 2 AGHMT iCLMs.
(D) Gene expression heatmap of all genes from (C).
(E) Strategy for testing chemicals on iCLMs during reprogramming.
(F) Representative immunocytochemistry images of AGHMT reprogrammed fibroblasts from αMHC-GFP transgenic mice treated with DMSO or the indicated chemicals. Cells were fixed and stained for αMHC-GFP (green), Tnnt2 (red), and DAPI (blue) 7 days after infection. (Bars, 100 μm.)
(G) Quantification by flow cytometry of αMHC-GFP+ and Tnnt2+ iCLMs 7 days after treatment with AGHMT and DMSO or the indicated chemicals (n = 3, independent experiments). (*p < 0.05 versus AGHMT+DMSO, **p < 0.01 versus AGHMT+DMSO.) Data are represented as mean ± SD.
(H) Quantification of Ca2+ flux-positive MEFs after 10 days of reprogramming using Fluo-4 NW dye (n = 3, independent experiments). (*p < 0.05 versus AGHMT+DMSO, **p < 0.01 versus AGHMT+DMSO). Data are represented as mean ± SD.
(I) Quantification of spontaneous beating MEF iCLMs after treatment (n = 3, independent experiments). (*p < 0.05 versus AGHMT+DMSO, **p < 0.01 versus AGHMT+DMSO.) Data are represented as mean ± SD.
(J and K) Representative immunocytochemistry images of AGHMT iCLMs from αMHC-GFP transgenic mice treated with Egfr shRNA(J) or Jak2 shRNA(K). Cells were fixed and stained for αMHC-GFP (green), Tnnt2 (red), and Hoechst (blue) 7 days after infection. (Bars, 100 μm.)
(L) Quantification of αMHC-GFP+ and Tnnt2+ iCLMs 7 days after infection with AGHMT and the indicated shRNAs by immunocytochemistry (n = 3, independent experiments). (**p < 0.01 versus AGHMT+shLacZ, ***p < 0.0001 versus AGHMT+shLacZ.) Data are represented as mean ± SD.
Based on these findings, we surmised that inhibiting the Egfr signaling pathway could enhance cardiac reprogramming. We tested the clinically utilized small-molecule tyrosine kinase inhibitor, Erlotinib, on iCLMs during reprogramming (Huang et al., 2012) (Figure 7E). Treatment with 5 μM Erlotinib enhanced the AGHMT reprogramming efficiency of MEFs, adult CFs, and tail-tip fibroblasts (TTFs) as measured by immunostaining of cardiac markers, Ca2+ flux, and spontaneous beating (Figures 7F–7I, S7D, and S7E; Video S1). To further assess the impact of Egfr signaling inhibition on reprogramming, we focused on Jak2, a gene identified in our downregulated GRN of Egfr signaling (Figures 7C and 7D). Although discrepancies were reported on the outcome of Jak inhibition in cardiac reprogramming, we surmised this could be due to differences in the reprogramming cocktails (Christoforou et al., 2013; Jayawardena et al., 2012; Moisan et al., 2015; Muraoka et al., 2014). Therefore, we tested another Jak inhibitor, Ruxolitinib, in our AGHMT reprogramming assay. Interestingly, treatment with 5 μM Ruxolitinib enhanced reprogramming efficiency by immunostaining to a similar degree but demonstrated increased Ca2+ flux and spontaneous beating compared to Erlotinib (Figures 7F–7I; Video S1). However, 5 μM Erlotinib and 5 μM Ruxolitinib together did not show synergistic effects, suggesting that enhancement by these chemicals shares some common signaling pathways (Figures 7F–7I). To confirm that the augmentation of reprogramming was not specific to these chemicals, we tested an alternative Egfr inhibitor, Gefitinib, and a Jak2 inhibitor, AZD1480, and demonstrated that both chemicals consistently augmented reprogramming of MEFs (Figures S7F and S7G). Additionally, we inhibited Egfr and Jak2 expression by small hairpin RNAs, which also augmented reprogramming of MEFs (Figures 7J–7L, S7H, and S7I). In conclusion, GRN analysis revealed transcriptional networks directly regulated by reprogramming factors during cardiac reprogramming, and we identified the Egfr signaling pathway as a target to enhance the reprogramming process.
DISCUSSION
Cardiogenesis is known to be coordinated by combinatorial actions of multiple TFs, but the epigenomic regulation during cardiac reprogramming has not been previously investigated (He et al., 2011; Luna-Zurita et al., 2016). Here, we found that cardiogenic TFs function in a combinatorial manner by co-occupying myriad regulatory elements during the reprogramming process. In addition, our study highlights the importance of Mef2c in these combinatorial interactions for reprogramming (Wang et al., 2015). ChIP-seq analyses at the initial stage of reprogramming revealed that Gata4 and Tbx5 are recruited to Mef2 binding sites in reprogramming enhancers, where they work in concert for transcriptional activation. Consistently, reprogramming enhancers activated by Hand2 and Akt1 were also highly enriched with Mef2 motifs. These data suggest that cooperative actions of reprogramming TFs in the vicinity of Mef2 binding sites are crucial for cardiac reprogramming, and we propose that Mef2c is a protagonist in this process by recruiting reprogramming TFs to its binding sites. This notion also explains the failure of the Gata4, Hand2, and Tbx5 cocktail to reprogram fibroblasts into iCLMs, despite their synergistic transcriptional activities (Dai et al., 2002; Maitra et al., 2009).
Epigenetic Commonalities between Reprogramming and Cardiogenesis
Enhancers are major contributors to transcriptional divergence, based on their wide diversity among cell types and species (Chang and Bruneau, 2012; Gilsbach et al., 2018). Enhancer landscape commonalities between cardiac reprogramming and cellular differentiation reveal a biological link between these two cardiogenic processes. Considering that the reprogramming process is a direct cell-fate conversion by cardiogenic TFs, we were surprised to find an overlap between reprogramming enhancers and active enhancers in ESCs. The unexpected activation of these ESC enhancers provides new insights into the epigenetic function of reprogramming TFs and may explain why small molecules or growth factors involved in cardiac differentiation from pluripotent stem cells augment reprogramming (Abad et al., 2017; Yamakawa et al., 2015).
The early iCLM enhancer landscape was most similar to that of the neonatal heart among different developmental stages. However, we demonstrated that maturation enhancers are subsequently activated in iCLMs at a later time point (day 7), and the addition of Hand2 and Akt1 further augmented this process. These findings suggest that activation of maturation enhancers is essential for iCLMs to acquire a more functional phenotype. Furthermore, Mef2c plays a key role in this process, as demonstrated by the enrichment of its binding site in these enhancer regions. Thus, our study highlights the impact of enhancer activation in cardiac reprogramming and defines factors that can activate maturation enhancers and thereby produce more mature iCLMs.
Egfr Signaling Inhibits Reprogramming
GRN analysis enabled the identification of Egfr signaling as an inhibitory pathway of reprogramming. Considering the therapeutic potential of the reprogramming approach, we verified the inhibitory action of Egfr signaling by applying short hairpin RNA (shRNA) and already clinically available chemicals (Kobayashi and Hagiwara, 2013; Vannucchi et al., 2015). Although the precise mechanism has yet to be determined, since Egfr inhibition is known to enhance cardiac differentiation from pluripotent stem cells, the unpredicted activation of ESC enhancers in iCLMs may account for its action (Ramachandra et al., 2016).
Summary
In conclusion, our genome-wide study reveals a transition of enhancer landscape and gene expression during cardiac re-programming, which is orchestrated by cooperative TF function. However, the immaturity of iCLMs indicates additional processes required for full activation of a cardiac enhancer landscape. Considering the therapeutic potential of direct cardiac reprogramming, it will be interesting to dissect the epigenetic landscape of cardiac reprogramming in human cells, as reprogramming factors differ between mouse and human fibroblasts (Fu et al., 2013; Nam et al., 2013; Wada et al., 2013). Such information may explain why additional factors are required to reprogram human fibroblasts into CMs and provide new insights into human reprogramming thereby advancing the field for regenerative therapy.
STAR★METHODS
CONTACT FOR REAGENT AND RESOURCE SHARING
Further information and requests for resources and reagents should be directed to and will be fulfilled by the Lead Contact, Eric Olson (eric.olson@utsouthwestern.edu).
EXPERIMENTAL MODEL AND SUBJECT DETAILS
Cell lines
Platinum-E (Plat-E) Retroviral Packaging Cell Lines (Cell Biolabs) were grown in DMEM supplemented with 10% fetal bovine serum (FBS), 1% penicillin/streptomycin, 10 μg/mLblasticidin (Thermo Fisher Scientific), and 1 μg/mL puromycin (Thermo Fisher Scientific). Plat-E cells under ten passages were used for retrovirus production. HEK-293 cells were grown in DMEM supplemented with 10% FBS and 1% penicillin/streptomycin, and were used for Western Blotting as described below.
Mice
All experiments involving animals were approved by the Institutional Animal Care and Use Committee at the University of Texas Southwestern Medical Center. All mice used in this study were housed at the Animal Resource Center at the University of Texas Southwestern Medical Center and bred inside a SPF facility with 12h light/dark cycles and monitored daily with no health problems reported. All animals were housed in groups of maximum five per cage with ad libitum access to food and water. αMHC-GFP mice were maintained on a mixed C57BL/6 background (Song et al., 2012).
METHOD DETAILS
Cell culture
MEFs from E13.5–14.5 C57BL/6 or αMHC-GFP mice were prepared as previously described (Nam et al., 2014) and cultured in fibroblast growth medium (DMEM containing 10% FBS and 1% penicillin/streptomycin) until experiments were performed. Adult mouse tail tip fibroblasts and cardiac fibroblasts from 4–6 weeks old C57BL/6 or αMHC-GFP were prepared as previously described and cultured in fibroblast growth medium until experiments were performed (Zhou et al., 2017). Mouse sex was not identified since fibroblasts used for each experiment were collected from a litter.
Retrovirus production and cardiac reprogramming
Generation of retroviral expression constructs encoding Gata4, Hand2, Mef2c, Tbx5, and Akt1 has been previously described (Song et al., 2012; Zhou et al., 2015). Retroviral construct for the expression of shRNA targeting Egfr was purchased from Origene. For generating the retroviral construct of shRNA targeting LacZ and Jak2, sequence 5’- CTACACAAATCAGCGATTTcgaaAAATCGCT GATTTGTGTAG-3’ and sequence 5’- GGTGGAATTCAGTGGTCAAGAcgaaTCTTGACCACTGAATTCCACC-3’ were cloned into an entry vector using BLOCK-iT U6 Entry Vector Kit (Thermo Scientific) and recombined into pMXs-GW vector by Gateway cloning. pMXs-GW was a gift from Dr. Shinya Yamanaka (Addgene plasmid # 18656) (Takahashi and Yamanaka, 2006). For some ChIP experiments, retroviral constructs that have a 3xTy1-epitope tag added to the N terminus of mouse Hand2 or the C terminus of mouse Mef2c were used. Retroviruses were produced using Platinum E cells, as described previously (Zhou et al., 2017). Briefly, retroviral constructs were transfected into Platinum E cells using FuGENE 6 transfection reagent. Twenty-four hours after transfection, wildtype or αMHC-GFP fibroblasts were seeded into culture dishes or plates that were precoated with SureCoat (Cellutron) or Matrigel (Corning). Forty-eight hours after transfection, the viral medium was filtered through a 0.45-μm filter and polybrene was added at a concentration of 8 μg/mL. Then fibroblasts were infected by replacing growth medium with the above viral mixture. The viral infection was serially repeated twice and twenty-four hours after the second infection, the viral medium was replaced with induction medium, composed of DMEM/199 (4:1), 10% FBS, 5% horse serum, 1% penicillin/streptomycin, 1% nonessential amino acids, 1% essential amino acids, 1% B-27, 1% insulin-selenium-transferrin, 1% vitamin mixture, and 1% sodium pyruvate (Invitrogen). Induction medium was replaced every two to three days until experiments were performed. Chemical compounds: 5 μM Erlotinib (Selleck-chem, S1032); 5 μM Ruxolitinib (Selleckchem, S1378); 5 μM Gefitinib (Selleckchem, ZD1839); 2.5 μM AZD 1480 (Selleckchem, S2162) were freshly added to induction medium each time after medium change.
Quantitative mRNA measurement
Total RNA was extracted using TRIzol (Invitrogen) according to the vender’s protocol. RNA was reverse-transcribed to cDNA using iScript Supermix (Bio-Rad). qPCR was performed using KAPA SYBR Fast (Kapa Biosystems) and gene expression was analyzed by theCt method. Primers used were Fw 5’-GCC CAGTAC CTCCGAAAGTC-3’ and Rv5’-GCCTTAACATACTCCTTGTC-3’ for Myh6 and primers Fw 5’-GTA GAG GAC ACC AAA CCC AAG-3’ and Rv 5’- GAG TCT GTA GCT CAT TCA GGT C-3’ for Tnnt2. For input normalization, we used Gapdh Fw 5’-AGG TCG GTG TGA ACG GAT TTG-3’ and Rv 5’-TGT AGA CCA TGT AGT TGA GGT CA-3’. Measurements were recorded in triplicate.
Immunocytochemistry
Immunocytochemistry was performed as previously described (Zhou et al., 2015). Briefly, cells were fixed in 4% PFAfor 15 min at room temperature and blocked with 5% goat serum. Fixed cells were then incubated on a rotator with mouse monoclonal anti-Tnnt2 antibody (1:500, Thermo Scientific, MA5–12960), rabbit anti-GFP antibody (1:500, Thermo Scientific, A-11122), and rabbit anti-mCherry antibody (1:500, Abcam, ab167453) in 5% goat serum for 1 h at room temperature or 4 °C overnight. After three washes with PBS, cells were incubated with appropriate Alexa fluorogenic secondary antibodies (1:500, Invitrogen) at room temperature for 1 hr. Image acquisition and analysis was done on a BZ-X710 (Keyence). For quantification, cells were manually quantified and averaged to yield an individual replicate in four randomly selected low-power fields of view from each well in three independent experiments.
Western blot analyses
HEK-293 cells were transfected with plasmids using FuGENE6 and cell lysates were analyzed after 48 hours of transfection. Western blot analyses were performed as previously described (Song et al., 2012). Briefly, cell lysates were prepared using RIPA buffer with complete protease inhibitor cocktail tablets (Roche). Lysates were boiled with 4x Laemmli buffer for 5 min at 95°C. Antibodies used were anti-Mef2c antibody (1:1000, Cell Signaling, 5030), anti-Hand2 antibody (1:200, R&D Systems, AF3876), anti-Ty1 antibody (1:1000, Diagenode, C15200054), and anti-Gapdh antibody (1:1000, Merck Millipore, MAB374).
Flow cytometry
Flow cytometry was performed as previously described (Zhou et al., 2017). Briefly, cells were trypsinized, harvested, and suspended into single cells. Then cells were fixed and permeabilized using BD Cytofix/Cytoperm (BD Biosciences). Antibodies used were mouse monoclonal anti-Tnnt2 antibody (1:200, Thermo Scientific, MA5–12960), rabbit anti-GFP antibody (1:200, Thermo Scientific, A-11122), donkey anti-mouse Alexa fluor 647 (1:200, Invitrogen, A-31571) and goat anti-rabbit Alexa fluor 488 (1:200, Invitrogen, A-11008). Cells were analyzed using FACSCalibur (BD Biosciences) and FlowJo software (FLOWJO, LCC).
Beating cell analysis and calcium assay
Beating cell analyses were performed as previously described on Matrigel coated dish (Corning, 354248) (Zhou et al., 2015). Beating cells were manually counted in eight randomly selected high-power fields per well in at least three independent experiments. Calcium assay was performed as previously described on Matrigel coated dishes with some modification (Zhou et al., 2015). Fluo-4 NW Calcium Assay Kit (Thermo Scientific, F36206) was used according to the manufacturer’s protocol and Ca2+ flux was measured on fibroblasts 10 days after retroviral treatment. Briefly, after replacing culture medium with the dye loading solution, plates were incubated at 37°Cfor30 minutes, then at room temperature for an additional 30 minutes before measurement. Ca2+ flux positive cells were manually counted in ten randomly selected high-power fields per well in three independent experiments.
In vitro and in vivo transgenic reporter assays
Enhancer names tested in this study are the unique identifiers used in the VISTA Enhancer Browser (https://enhancer.lbl.gov/) (Visel et al., 2007). Putative Gja5 and Tnni1 enhancers were cloned into an hsp68-lacZ expression vector and LacZ transgenic mouse assays were conducted as previously described (Kothary et al., 1989; Liu et al., 2007; Visel et al., 2007). Embryos were collected at indicated stages and stained for β-galactosidase activity, and mice carrying LacZ transgenes were identified by PCR analysis. For in vitro reporter assay, LacZ coding sequences from Tnni1-E- and Gja5-E-Hsp68-LacZ plasmids were removed with KasI and MfeI digestion, and replaced by mCherry coding sequences using Infusion cloning. Then Tnni1 -E- and Gja5-E-Hsp68-mCherry expression cassettes were PCR amplified with a XhoI site on enhancer end (5′) and a BamHI site on mCherry end (3′) and cloned into BamHI and XhoI linearized pMXs-Puro plasmid by Infusion cloning. The Tnni1 -E- or Gja5-E-Hsp68-mCherry construct was retrovirally delivered to MEFs together with reprogramming factors and mCherry expression was investigated in iCLMs. Genomic coordinates of all enhancers are listed in Table S5.
ChIP-seq sample preparation
For ChIP-seq sample preparation, MEFs two or seven days after retroviral transduction were crosslinked with 1% formaldehyde in PBS for 30 min and neutralized by the addition of glycine to a final concentration of 0.125M for 5 min. MEFs were then harvested and washed with cold PBS for ChIP. For mouse heart sample preparation, ChIP was performed as previously described (Huang et al., 2016; Xu et al., 2012), or by using ChIP-IT Express ChIP kits (Active Motif) following the vender’s protocol. In brief, cell lysates were sonicated (ten cycles of 30 s on/off) to shear DNA using a Bioruptor Pico sonicator (Diagenode, B01060010). Then, chromatin was incubated with indicated antibodies overnight at 4 °C. Pre-washed rinsed Dynabeads (protein G) were then added to the anti-body-treated chromatin, and immunoprecipitation was performed on a rotator for 3 hours at 4 °C. The following antibodies were used for ChIP experiments: anti-Gata4 antibody (Santa Cruz Biotechnology, sc-1237), anti-Tbx5 antibody (Santa Cruz Biotechnology, sc-17866), anti-Ty1 antibody (Diagenode, C15200054), and anti-H3K27ac antibody (Diagenode, C15410196). ChIP-seq libraries were generated using KAPA Hyper Prep Kit following the manufacturer’s protocol (Kapa Biosystems), and single-end sequenced on the Illumina NextSeq500 system using the 75bp high output sequencing kit. Subsequent massive parallel sequencing was performed at the University of Texas Southwestern Genomics and Microarray Core Facility or the Sequencing Core Facility in Children’s Medical Center Research Institute at University of Texas Southwestern Medical Center.
RNA-seq sample preparation
For RNA-seq sample preparation, total RNA was extracted from MEFs two or seven days after retroviral transduction, using TRIzol (Invitrogen) according to the vender’s protocol. Illumina RNA-seq was performed by the University of Texas Southwestern Microarray Core Facility.
QUANTIFICATION AND STATISTICAL ANALYSIS
ChIP-seq analysis
The raw reads were aligned to the mouse reference genome (GRCh38/mm10) using default parameters in BWA version 0.7.12 (Li and Durbin, 2009). The aligned reads were subsequently filtered for quality and uniquely mappable reads were retained for further analysis using Samtools version 1.3 (Li et al., 2009) and Sambamba version 0.6.6 (Tarasov etal., 2015). Library complexity was measured using BEDTools version 2.26.0 (Quinlan and Hall, 2010) and met ENCODE data quality standards (Landt et al., 2012). Relaxed peaks were called using MACS version 2.1.0 (Feng etal., 2012) with a p value of 1×10⁻² for H3K27ac and SPP version 1.4 (Kharchenko etal., 2008) with an IDR = 0.01 for each replicate and pseudoreplicate. For H3K27ac, peak calls that were observed in either all replicates or both pseudoreplicates were used for subsequent analysis. For ENCODE data, raw data were downloaded from the Data Coordination Center of the ENCODE project (https://www.encodeproject.org/). For annotating active enhancers, we used the peaks of H3K27ac and excluded peaks located in promoter regions (±2kbfrom TSS). GREAT (McLean et al., 2010) was used for GO, Signaling pathway, and MGI expression analysis. To generate the heatmap and profiles of ChIP-seq intensities, we used deepTools version 2.5.0 (Ramírez etal., 2016) to generate read abundance from all ChIP-seq datasets around peak center (±5.0kb/ 2.5 kb/2.0 kb), using computeMatrix. These matrices were then used to generate heatmaps or profiles, using plotHeatmap or plotProfile, respectively. To identify enriched motifs within each type of enhancer, we performed motif enrichment analysis using HOMER version 4.9 as previously described (Heinz et al., 2010, 2015). Significance analysis of global enhancer activity was calculated using the hypergeometric distribution given the number of enhancers to nearest neighboring gene overlapped to regulated genes for each condition under comparison and the total number of genes in the genome.
RNA-seq analysis
Following sequencing as described above, reads with Phred quality scores less than 20 and less than 35 bp after trimming were removed from further analysis using trimgalore version 0.4.1. Quality-filtered reads were then aligned to the mouse reference genome GRCm38 (mm10) using the HISAT2 (v 2.0.1) (Pertea et al., 2016) aligner with default settings and marked duplicates using Sambamba version 0.6.6 (Tarasov et al., 2015). Aligned reads were quantified using featurecount (v1.4.6) (Liao et al., 2014) per gene ID against Gencode version 10 (Mudge and Harrow, 2015). Differential gene expression analysis was done using the R package DEseq2 (v 1.6.3). Cutoff values of absolute fold change greater than 1.0 and FDR ≤ 0.01 were then used to select for differentially expressed genes between sample group comparisons. Normalized gene count values were averaged within groups for heatmap generation and clustered using the R package clusterProfiler (v3.6.0) (Yu et al., 2012). GO enrichment and pathway analysis was performed using PANTHER to determine molecular and biological functional categories (Mi et al., 2017). Volcano plots were generated using the R package ggplot2. DAVID (v6.8) gene functional annotation and classification tool (Huang etal., 2009a, 2009b) was used to annotate the list of differentially expressed genes with respective Gene Ontology terms and perform GO enrichment analysis for biological function category. The enrichGO function in clusterProfiler (v3.6.0) (Yu et al., 2012) was used to perform GO enrichment analysis for each cluster. Gene Ontology groups were selected for significance using a p value cutoff of 0.01.
Gene regulatory network analysis
Each ChIP-seq TF peak was annotated to its nearest gene using HOMER (version 4.9). These genes were overlapped with the RNA-seq data and clustered based on their differential gene expression. The TF to gene interaction matrix was visualized using Cytoscape (v3.6.0). Genes which appeared in GMT or GHMT TF peaks annotation, but did not show up in the GHMT or AGHMT TF peaks annotation, respectively, were excluded from the analysis. The set of nearest neighboring genes for each active enhancer was determined for each cell line group.
Statistical analysis
Statistical analyses were performed using GraphPad Prism 7 (GraphPad Software, Inc.) and statistical significance (p < 0.05) was determined using the Student’s t test. All data are presented as mean ± SD (error bars).
DATA AND SOFTWARE AVAILABILITY
All ChIP-seq data can be accessed at Gene Expression Omnibus (GEO) Series: GEO: GSE112315. All RNA-seq data can be accessed at GEO Series: GEO: GSE112316. All datasets used in this paper have been deposited in the GEO with accession number: GEO: GSE112317.
Supplementary Material
KEY RESOURCES TABLE.
| REAGENT or RESOURCE | SOURCE | IDENTIFIER |
|---|---|---|
| Antibodies | ||
| Mouse monoclonal anti-Tnnt2 | Thermo Fisher Scientific | Cat#MA5-12960; RRID: AB_11000742 |
| Rabbit polyclonal anti-GFP | Thermo Fisher Scientific | Cat# A-11122; RRID: AB_221569 |
| Alexa fluor 647 donkey anti-mouse IgG | Thermo Fisher Scientific | Cat# A-31571; RRID:AB_162542 |
| Alexa fluor 488 goat anti-rabbit IgG | Thermo Fisher Scientific | Cat# A-11008; RRID:AB_143165 |
| Alexa fluor 555 goat anti-mouse IgG | Thermo Fisher Scientific | Cat# A-28180; RRID:AB_2536164 |
| Alexa fluor 488 donkey anti-rabbit IgG | Thermo Fisher Scientific | Cat# A-21206; RRID:AB_2535792 |
| Goat polyclonal anti-Gata4 | Santa Cruz Biotechnology | Cat# sc-1237; RRID: AB_2108747 |
| Goat polyclonal anti-Tbx5 | Santa Cruz Biotechnology | Cat# sc-17866; RRID:AB_2200827 |
| Mouse monoclonal anti-Ty1 | Diagenode | Cat# C15200054 |
| Rabbit polyclonal anti-H3K27ac | Diagenode | Cat# C15410196; RRID:AB_2637079 |
| Rabbit monoclonal anti-Mef2c | Cell Signaling | Cat# 5030; RRID:AB_10548759 |
| Goat polyclonal anti-Hand2 | R&D Systems | Cat# AF3876; RRID:AB_2295155 |
| Mouse monoclonal anti-Gapdh | Merck Millipore | Cat# MAB374; RRID:AB_2107445 |
| Rabbit polyclonal anti-mCherry | Abcam | Cat# ab167453; RRID:AB_2571870 |
| Bacterial and Virus Strains | ||
| One Shot™ TOP10 Chemically Competent E. coli | Thermo Fisher Scientific | C404010 |
| One Shot™ Stbl3™ Chemically Competent E. coli | Thermo Fisher Scientific | C737303 |
| Chemicals, Peptides, and Recombinant Proteins | ||
| Erlotinib | Selleckchem | S1032 |
| Ruxolitinib | Selleckchem | S1378 |
| Gefitinib | Selleckchem | ZD1839 |
| AZD1480 | Selleckchem | S2162 |
| B27 supplements | Invitrogen | 17504–044 |
| SureCoat | Cellutron | sc9035 |
| Insulin, Transferrin, Selenium Solution | Invitrogen | 41400045 |
| MEM Non-Essential Amino Acids Solution | Invitrogen | 11140050 |
| MEM Vitamin Solution | Invitrogen | 11120052 |
| MEM Amino Acids Solution | Invitrogen | 11130051 |
| Matrigel | Corning | 354248 |
| 4’,6-diamidino-2-phenylindole | Thermo Fisher Scientific | D1306 |
| Hoechst 33342, Trihydrochloride, Trihydrate | Thermo Fisher Scientific | H3570 |
| Critical Commercial Assays | ||
| ChIP-IT Express | Active Motif | 53008 |
| BLOCK-iT U6 RNAi Entry Vector Kit | Thermo Fisher Scientific | K494500 |
| Deposited Data | ||
| Raw and analyzed data | This paper | GEO: GSE112315, GEO: GSE112316, GEO: GSE112317 |
| Experimental Models: Cell Lines | ||
| Platinum-E (Plat-E) Retroviral Packaging Cell Line | Cell Biolabs | RV-101 |
| HEK-293 Cell Line | ATCC | CRL-1573; RRID:CVCL_0045 |
| Experimental Models: Organisms/Strains | ||
| Mouse: αMHC-GFP | Song et al., 2012 | N/A |
| Mouse: C57BL/6J | The Jackson Laboratory | N/A |
| Oligonucleotides | ||
| Primer: Mouse Myh6 Forward: 5’-GCC CAG TAC CTC CGA AAG TC-3’ | This paper | N/A |
| Primer: Mouse Myh6 Reverse: 5’-GCC TTA ACA TAC TCC TTG TC-3’ | This paper | N/A |
| Primer: Mouse Tnnt2 Forward: 5’-GTA GAG GAC ACC AAA CCC AAG-3’ | This paper | N/A |
| Primer: Mouse Tnnt2 Reverse: 5’-GAG TCT GTA GCT CAT TCA GGT C-3’ | This paper | N/A |
| Primer: Mouse Gapdh Forward: 5’-AGG TCG GTG TGA ACG GAT TTG-3’ | This paper | N/A |
| Primer: Mouse Gapdh Reverse: 5’-TGT AGA CCA TGT AGT TGA GGT CA-3’ | This paper | N/A |
| Jak2 shRNA sequence: 5’- GGTGGAATTCAGTGG TCAAGAcgaaTCTTGACCACTGAATTCCACC-3’ | This paper | N/A |
| LacZ shRNA sequence: 5’- CTACACAAATCAGCG ATTTcgaaAAATCGCTGATTTGTGTAG-3’ | This paper | N/A |
| Recombinant DNA | ||
| pMXs-GW | Addgene | #18656; RRID:Addgene_18656 |
| pMXs-puro | Cell Biolabs, Inc. | RTV-012 |
| pMXs-Mef2c-3xTy1 | This paper | N/A |
| pMXs-3xTy1-Hand2 | This paper | N/A |
| pBabeX-Gata4 | Song et al., 2012 | N/A |
| pBabeX-Hand2 | Song et al., 2012 | N/A |
| pBabeX-Mef2c | Song et al., 2012 | N/A |
| pBabeX-Tbx5 | Song et al., 2012 | N/A |
| Gja5 enhancer-Hsp68-LacZ | This paper | N/A |
| Tnni1 enhancer-Hsp68-LacZ | This paper | N/A |
| pMXs-puro-Gja5 enhancer-Hsp68-mCherry | This paper | N/A |
| pMXs-puro-Tnni1 enhancer-Hsp68-mCherry | This paper | N/A |
| pRS-Egfr shRNA | ORIGENE | TR509941 |
| pMXs-Jak2 shRNA | This paper | N/A |
| Software and Algorithms | ||
| FlowJo v10.5.3 | FLOWJO, LCC | https://www.flowjo.com/ |
| Cytoscape v3.6.0 | Institute for Systems Biology | https://cytoscape.org/ |
| R v3.4.1 | The R Foundation | https://www.r-project.org/foundation/ |
| MACS v2.1.0 | Feng et al., 2012 | http://liulab.dfci.harvard.edu/MACS/ |
| GREAT | McLean et al., 2010 | http://great.stanford.edu/public/html/ |
| BEDTools v2.26.0 | Quinlan and Hall, 2010 | https://bedtools.readthedocs.io/en/latest/ |
Highlights.
Reprogramming factors highly co-occupy regulatory elements during cardiac reprogramming
Hand2 and Akt1 recruit reprogramming TFs to cardiac regulatory elements in iCLMs
Cardiac reprogramming establishes an epigenetic landscape of heart development
Inhibition of EGF receptor signaling augments cardiac reprogramming
ACKNOWLEDGMENTS
We thank J. Cabrera for graphical assistance; J. McAnally for performing microinjection for the in vivo transgenic reporter assay; J. Richardson, J. Shelton, and the UT Southwestern Histology Core for help with histopathology; and J. Xu, X. Liu, and the Sequencing Core Facility at Children’s Research Institute and the Genomics and Microarray Core Facility at UT Southwestern for performing the Illumina sequencing. We are grateful to M.S. Kim for advice about the bioinformatics analysis. This work was supported by grants from the NIH (AR-067294, HL-130253, and HL-138426), Fondation Leducq Transatlantic Networks of Excellence in Cardiovascular Research, and the Robert A. Welch Foundation (grant 1-0025 to E.N.O.). H.H. was supported by a Uehara Memorial Foundation Postdoctoral Fellowship and a Kanae Foreign Study Grant. Z.W. was supported by a predoctoral fellowship from the American Heart Association (19PRE34380436). G.A.G. was supported by an NIH T32 Training grant (5T32HL125247-04). V.S.M was supported by Cancer Prevention and Research Institute of Texas (RP150596). Research by M.O., D.E.D., and A.V. was conducted at the E.O. Lawrence Berkeley National Laboratory and performed under Department of Energy Contract DE-AC02-05CH11231, University of California. The work was supported by NHLBI grant R24HL123879 (to A.V.). We thank the ENCODE Consortium and the ENCODE production laboratories for generating the particular datasets.
Footnotes
SUPPLEMENTAL INFORMATION
Supplemental Information can be found online at https://doi.org/10.1016/j.stem.2019.03.022.
DECLARATION OF INTERESTS
E.N.O. is a cofounder and member of the Scientific Advisory Board of Tenaya Therapeutics and holds equity in the company. The other authors declare no competing interests.
REFERENCES
- Abad M, Hashimoto H, Zhou H, Morales MG, Chen B, Bassel-Duby R, and Olson EN (2017). Notch Inhibition Enhances Cardiac Reprogramming by Increasing MEF2C Transcriptional Activity. Stem Cell Reports 8, 548–560. [DOI] [PMC free article] [PubMed] [Google Scholar]
- Addis RC, Ifkovits JL, Pinto F, Kellam LD, Esteso P, Rentschler S, Christoforou N, Epstein JA, and Gearhart JD (2013). Optimization of direct fibroblast reprogramming to cardiomyocytes using calcium activity as a functional measure of success. J. Mol. Cell. Cardiol. 60, 97–106. [DOI] [PMC free article] [PubMed] [Google Scholar]
- Ang YS, Rivas RN, Ribeiro AJS, Srivas R, Rivera J, Stone NR, Pratt K, Mohamed TMA, Fu JD, Spencer CI, et al. (2016). Disease Model of GATA4 Mutation Reveals Transcription Factor Cooperativity in Human Cardiogenesis. Cell 167, 1734–1749. [DOI] [PMC free article] [PubMed] [Google Scholar]
- Bagwe S, Berenfeld O, Vaidya D, Morley GE, and Jalife J (2005). Altered right atrial excitation and propagation in connexin40 knockout mice. Circulation 112, 2245–2253. [DOI] [PMC free article] [PubMed] [Google Scholar]
- Blow MJ, McCulley DJ, Li Z, Zhang T, Akiyama JA, Holt A, Plajzer-Frick I, Shoukry M, Wright C, Chen F, et al. (2010). ChIP-Seq identification of weakly conserved heart enhancers. Nat. Genet. 42, 806–810. [DOI] [PMC free article] [PubMed] [Google Scholar]
- Chang CP, and Bruneau BG (2012). Epigenetics and cardiovascular development. Annu. Rev. Physiol. 74, 41–68. [DOI] [PubMed] [Google Scholar]
- Christoforou N, Chellappan M, Adler AF, Kirkton RD,Wu T, Addis RC, Bursac N, and Leong KW (2013). Transcription factors MYOCD, SRF, Mesp1 and SMARCD3 enhance the cardio-inducing effect of GATA4, TBX5, and MEF2C during direct cellular reprogramming. PLoS ONE 8, e63577. [DOI] [PMC free article] [PubMed] [Google Scholar]
- Cohn JN, Ferrari R, and Sharpe N (2000). Cardiac remodeling-concepts and clinical implications: a consensus paper from an international forum on cardiac remodeling. Behalf of an International Forum on Cardiac Remodeling. J. Am. Coll. Cardiol. 35, 569–582. [DOI] [PubMed] [Google Scholar]
- Condorelli G, Drusco A, Stassi G, Bellacosa A, Roncarati R, Iaccarino G, Russo MA, Gu Y, Dalton N, Chung C, et al. (2002). Akt induces enhanced myocardial contractility and cell size in vivo in transgenic mice. Proc. Natl. Acad. Sci. USA 99, 12333–12338. [DOI] [PMC free article] [PubMed] [Google Scholar]
- Consortium, E.P.; ENCODE Project Consortium (2012). An integrated encyclopedia of DNA elements in the human genome. Nature 489, 57–74. [DOI] [PMC free article] [PubMed] [Google Scholar]
- Corin SJ, Juhasz O, Zhu L, Conley P, Kedes L, and Wade R (1994). Structure and expression of the human slow twitch skeletal muscle troponin I gene. J. Biol. Chem. 269, 10651–10659. [PubMed] [Google Scholar]
- Creyghton MP, Cheng AW, Welstead GG, Kooistra T, Carey BW, Steine EJ, Hanna J, Lodato MA, Frampton GM, Sharp PA, et al. (2010). Histone H3K27ac separates active from poised enhancers and predicts developmental state. Proc. Natl. Acad. Sci. USA 107, 21931–21936. [DOI] [PMC free article] [PubMed] [Google Scholar]
- Dai YS, Cserjesi P, Markham BE, and Molkentin JD (2002). The transcription factors GATA4 and dHAND physically interact to synergistically activate cardiac gene expression through a p300-dependent mechanism. J. Biol. Chem. 277, 24390–24398. [DOI] [PubMed] [Google Scholar]
- Dickel DE, Barozzi I, Zhu Y, Fukuda-Yuzawa Y, Osterwalder M, Mannion BJ, May D, Spurrell CH, Plajzer-Frick I, Pickle CS, et al. (2016). Genome-wide compendium and functional assessment of in vivo heart enhancers. Nat. Commun. 7, 12923. [DOI] [PMC free article] [PubMed] [Google Scholar]
- Feng J, Liu T, Qin B, Zhang Y, and Liu XS (2012). Identifying ChIP-seq enrichment using MACS. Nat. Protoc. 7, 1728–1740. [DOI] [PMC free article] [PubMed] [Google Scholar]
- Fu JD, Stone NR, Liu L, Spencer CI, Qian L, Hayashi Y, Delgado-Olguin P, Ding S, Bruneau BG, and Srivastava D (2013). Direct reprogramming of human fibroblasts toward a cardiomyocyte-like state. Stem Cell Reports 1, 235–247. [DOI] [PMC free article] [PubMed] [Google Scholar]
- Fu Y, Huang C, Xu X, Gu H, Ye Y, Jiang C, Qiu Z, and Xie X (2015). Direct reprogramming of mouse fibroblasts into cardiomyocytes with chemical cocktails. Cell Res. 25, 1013–1024. [DOI] [PMC free article] [PubMed] [Google Scholar]
- Galdos FX, Guo Y, Paige SL, VanDusen NJ, Wu SM, and Pu WT (2017). Cardiac Regeneration: Lessons From Development. Circ. Res. 120, 941–959. [DOI] [PMC free article] [PubMed] [Google Scholar]
- Gilsbach R, Schwaderer M, Preissl S, Grüning BA, Kranzhöfer D, Schneider P, Nührenberg TG, Mulero-Navarro S, Weichenhan D, Braun C, et al. (2018). Distinct epigenetic programs regulate cardiac myocyte development and disease in the human heart in vivo. Nat. Commun. 9, 391. [DOI] [PMC free article] [PubMed] [Google Scholar]
- Harvey RP (2002). Patterning the vertebrate heart. Nat. Rev. Genet. 3, 544–556. [DOI] [PubMed] [Google Scholar]
- Hashimoto H, Olson EN, and Bassel-Duby R (2018). Therapeutic approaches for cardiac regeneration and repair. Nat. Rev. Cardiol. 15, 585–600. [DOI] [PMC free article] [PubMed] [Google Scholar]
- He A, Kong SW, Ma Q, and Pu WT (2011). Co-occupancy by multiple cardiac transcription factors identifies transcriptional enhancers active in heart. Proc. Natl. Acad. Sci. USA 108, 5632–5637. [DOI] [PMC free article] [PubMed] [Google Scholar]
- Heinz S, Benner C, Spann N, Bertolino E, Lin YC, Laslo P, Cheng JX, Murre C, Singh H, and Glass CK (2010). Simple combinations of lineage-determining transcription factors prime cis-regulatory elements required for macrophage and B cell identities. Mol. Cell 38, 576–589. [DOI] [PMC free article] [PubMed] [Google Scholar]
- Heinz S, Romanoski CE, Benner C, and Glass CK (2015). The selection and function of cell type-specific enhancers. Nat. Rev. Mol. Cell Biol. 16, 144–154. [DOI] [PMC free article] [PubMed] [Google Scholar]
- Huang W, Sherman BT, and Lempicki RA (2009a). Bioinformatics enrichment tools: paths toward the comprehensive functional analysis of large gene lists. Nucleic Acids Res. 37, 1–13. [DOI] [PMC free article] [PubMed] [Google Scholar]
- Huang W, Sherman BT, and Lempicki RA (2009b). Systematic and integrative analysis of large gene lists using DAVID bioinformatics resources. Nat. Protoc. 4, 44–57. [DOI] [PubMed] [Google Scholar]
- Huang S, Holzel M, Knijnenburg T, Schlicker A, Roepman P, McDermott U, Garnett M, Grernrum W, Sun C, Prahallad A, et al. (2012). MED12 controls the response to multiple cancer drugs through regulation of TGF-β receptor signaling. Cell 151, 937–950. [DOI] [PMC free article] [PubMed] [Google Scholar]
- Huang J, Liu X, Li D, Shao Z, Cao H, Zhang Y, Trompouki E, Bowman TV, Zon LI, Yuan GC, et al. (2016). Dynamic Control of Enhancer Repertoires Drives Lineage and Stage-Specific Transcription during Hematopoiesis. Dev. Cell 36, 9–23. [DOI] [PMC free article] [PubMed] [Google Scholar]
- leda M, Fu JD, Delgado-Olguin P, Vedantham V, Hayashi Y, Bruneau BG, and Srivastava D (2010). Direct reprogramming of fibroblasts intofunctional cardiomyocytes by defined factors. Cell 142, 375–386. [DOI] [PMC free article] [PubMed] [Google Scholar]
- Jahangiri L, Sharpe M, Novikov N, González-Rosa JM, Borikova A, Nevis K, Paffett-Lugassy N, Zhao L, Adams M, Guner-Ataman B, et al. (2016). The AP-1 transcription factor component Fosl2 potentiates the rate of myocardial differentiation from the zebrafish second heart field. Development 143, 113–122. [DOI] [PMC free article] [PubMed] [Google Scholar]
- Jayawardena TM, Egemnazarov B, Finch EA, Zhang L, Payne JA, Pandya K, Zhang Z, Rosenberg P, Mirotsou M, and Dzau VJ (2012). MicroRNA-mediated in vitroand in vivo direct reprogramming of cardiac fibroblasts to cardiomyocytes. Circ. Res. 110, 1465–1473. [DOI] [PMC free article] [PubMed] [Google Scholar]
- Kharchenko PV, Tolstorukov MY, and Park PJ (2008). Design and analysis of ChlP-seq experiments for DNA-binding proteins. Nat. Biotechnol. 26, 1351–1359. [DOI] [PMC free article] [PubMed] [Google Scholar]
- King AD, Huang K, Rubbi L, Liu S, Wang CY, Wang Y, Pellegrini M, and Fan G (2016). Reversible Regulation of Promoter and Enhancer Histone Landscape by DNA Methylation in Mouse Embryonic Stem Cells. Cell Rep. 17, 289–302. [DOI] [PMC free article] [PubMed] [Google Scholar]
- Kobayashi K, and Hagiwara K (2013). Epidermal growth factor receptor (EGFR) mutation and personalized therapy in advanced nonsmall cell lung cancer (NSCLC). Target. Oncol. 8, 27–33. [DOI] [PMC free article] [PubMed] [Google Scholar]
- Kothary R, Clapoff S, Darling S, Perry MD, Moran LA, and Rossant J (1989). Inducible expression of an hsp68-lacZ hybrid gene in transgenic mice. Development 105, 707–714. [DOI] [PubMed] [Google Scholar]
- Lalit PA, Salick MR, Nelson DO, Squirrell JM, Shafer CM, Patel NG, Saeed I, Schmuck EG, Markandeya YS, Wong R, et al. (2016). Lineage Reprogramming of Fibroblasts into Proliferative lnduced Cardiac Progenitor Cells by Defined Factors. Cell Stem Cell 18, 354–367. [DOI] [PMC free article] [PubMed] [Google Scholar]
- Landt SG, Marinov GK, Kundaje A, Kheradpour P, Pauli F, Batzoglou S, Bernstein BE, Bickel P, Brown JB, Cayting P, et al. (2012). ChlP-seq guidelines and practices of the ENCODE and modENCODE consortia. Genome Res. 22, 1813–1831. [DOI] [PMC free article] [PubMed] [Google Scholar]
- Laurent F, Girdziusaite A, Gamart J, Barozzi I, Osterwalder M, Akiyama JA, Lincoln J, Lopez-Rios J, Visel A, Zuniga A, and Zeller R (2017). HAND2 Target Gene Regulatory Networks Control Atrioventricular Canal and Cardiac Valve Development. Cell Rep. 19, 1602–1613. [DOI] [PMC free article] [PubMed] [Google Scholar]
- Li H, and Durbin R (2009). Fast and accurate short read alignment with Burrows-Wheeler transform. Bioinformatics 25, 1754–1760. [DOI] [PMC free article] [PubMed] [Google Scholar]
- Li H, Handsaker B, Wysoker A, Fennell T, Ruan J, Homer N, Marth G, Abecasis G, and Durbin R; 1000 Genome Project Data Processing Subgroup (2009). The Sequence Alignment/Map format and SAMtools. Bioinformatics 25, 2078–2079. [DOI] [PMC free article] [PubMed] [Google Scholar]
- Liao Y, Smyth GK, and Shi W (2014). featureCounts: an efficient general purpose program for assigning sequence reads to genomic features. Bioinformatics 30, 923–930. [DOI] [PubMed] [Google Scholar]
- Liu N, Williams AH, Kim Y, McAnally J, Bezprozvannaya S, Sutherland LB, Richardson JA, Bassel-Duby R, and Olson EN (2007). An intragenic MEF2-dependent enhancer directs muscle-specific expression of microRNAs 1 and 133. Proc. Natl. Acad. Sci. USA 104, 20844–20849. [DOI] [PMC free article] [PubMed] [Google Scholar]
- Liu Z, Wang L, Welch JD, Ma H, Zhou Y, Vaseghi HR, Yu S, Wall JB, Alimohamadi S, Zheng M, et al. (2017). Single-cell transcriptomics reconstructs fate conversion from fibroblast to cardiomyocyte. Nature 551, 100–104. [DOI] [PMC free article] [PubMed] [Google Scholar]
- Luna-Zurita L, Stirnimann CU, Glatt S, Kaynak BL, Thomas S, Baudin F, Samee MA, He D, Small EM, Mileikovsky M, et al. (2016). Complex Interdependence Regulates Heterotypic Transcription Factor Distribution and Coordinates Cardiogenesis. Cell 164, 999–1014. [DOI] [PMC free article] [PubMed] [Google Scholar]
- Maitra M, Schluterman MK, Nichols HA, Richardson JA, Lo CW, Srivastava D, and Garg V (2009). Interaction of Gata4 and Gata6 with Tbx5 is critical for normal cardiac development. Dev. Biol. 326, 368–377. [DOI] [PMC free article] [PubMed] [Google Scholar]
- McLean CY, Bristor D, Hiller M, Clarke SL, Schaar BT, Lowe CB, Wenger AM, and Bejerano G (2010). GREAT improves functional interpretation of cis-regulatory regions. Nat. Biotechnol. 28, 495–501. [DOI] [PMC free article] [PubMed] [Google Scholar]
- Mi H, Huang X, Muruganujan A, Tang H, Mills C, Kang D, and Thomas PD (2017). PANTHER version 11: expanded annotation data from Gene Ontology and Reactome pathways, and data analysis tool enhancements. Nucleic Acids Res. 45 (D1), D183–D189. [DOI] [PMC free article] [PubMed] [Google Scholar]
- Mohamed TM, Stone NR, Berry EC, Radzinsky E, Huang Y, Pratt K, Ang YS, Yu P, Wang H, Tang S, et al. (2017). Chemical Enhancement of In Vitro and In Vivo Direct Cardiac Reprogramming. Circulation 135, 978–995. [DOI] [PMC free article] [PubMed] [Google Scholar]
- Moisan A, Lee YK, Zhang JD, Hudak CS, Meyer CA, Prummer M, Zoffmann S, Truong HH, Ebeling M, Kiialainen A, et al. (2015). White-to-brown metabolic conversion of human adipocytes by JAK inhibition. Nat. Cell Biol. 17, 57–67. [DOI] [PMC free article] [PubMed] [Google Scholar]
- Morin S, Charron F, Robitaille L, and Nemer M (2000). GATA-dependent recruitment of MEF2 proteins to target promoters. EMBO J. 19, 2046–2055. [DOI] [PMC free article] [PubMed] [Google Scholar]
- Morisco C, Seta K, Hardt SE, Lee Y, Vatner SF, and Sadoshima J (2001). Glycogen synthase kinase 3beta regulates GATA4 in cardiac myocytes. J. Biol. Chem. 276, 28586–28597. [DOI] [PubMed] [Google Scholar]
- Mudge JM, and Harrow J (2015). Creating reference gene annotation forthe mouse C57BL6/J genome assembly. Mamm. Genome 26, 366–378. [DOI] [PMC free article] [PubMed] [Google Scholar]
- Muraoka N, Yamakawa H, Miyamoto K, Sadahiro T, Umei T, Isomi M, Nakashima H, Akiyama M, Wada R, Inagawa K, et al. (2014). MiR-133 promotes cardiac reprogramming by directly repressing Snai1 and silencing fibroblast signatures. EMBO J. 33, 1565–1581. [DOI] [PMC free article] [PubMed] [Google Scholar]
- Nam YJ, Song K, Luo X, Daniel E, Lambeth K, West K, Hill JA, DiMaio JM, Baker LA, Bassel-Duby R, and Olson EN (2013). Reprogramming of human fibroblasts toward a cardiac fate. Proc. Natl. Acad. Sci. USA 110, 5588–5593. [DOI] [PMC free article] [PubMed] [Google Scholar]
- Nam YJ, Lubczyk C, Bhakta M, Zang T, Fernandez-Perez A, McAnally J, Bassel-Duby R, Olson EN, and Munshi NV (2014). Induction of diverse cardiac cell types by reprogramming fibroblasts with cardiac transcription factors. Development 141, 4267–4278. [DOI] [PMC free article] [PubMed] [Google Scholar]
- Olson EN (2006). Gene regulatory networks in the evolution and development of the heart. Science 313, 1922–1927. [DOI] [PMC free article] [PubMed] [Google Scholar]
- Pertea M, Kim D, Pertea GM, Leek JT, and Salzberg SL (2016). Transcript-level expression analysis of RNA-seq experiments with HISAT, StringTie and Ballgown. Nat. Protoc. 11, 1650–1667. [DOI] [PMC free article] [PubMed] [Google Scholar]
- Quinlan AR, and Hall IM (2010). BEDTools: a flexible suite of utilities for comparing genomic features. Bioinformatics 26, 841–842. [DOI] [PMC free article] [PubMed] [Google Scholar]
- Ramachandra CJ, Mehta A, Lua CH, Chitre A, Ja KP, and Shim W (2016). ErbB Receptor Tyrosine Kinase: A Molecular Switch Between Cardiac and Neuroectoderm Specification in Human Pluripotent Stem Cells. Stem Cells 34, 2461–2470. [DOI] [PubMed] [Google Scholar]
- Ramírez F, Ryan DP, Gruning B, Bhardwaj V, Kilpert F, Richter AS, Heyne S, Dündar F, and Manke T (2016). deepTools2: a next generation web server for deep-sequencing data analysis. Nucleic Acids Res. 44, W160–W165. [DOI] [PMC free article] [PubMed] [Google Scholar]
- Roth GA, Johnson C, Abajobir A, Abd-Allah F, Abera SF, Abyu G, Ahmed M, Aksut B, Alam T, Alam K, et al. (2017). Global, Regional, and National Burden of Cardiovascular Diseases for 10 Causes, 1990 to 2015. J. Am. Coll. Cardiol. 70, 1–25. [DOI] [PMC free article] [PubMed] [Google Scholar]
- Song K, Nam YJ, Luo X, Qi X, Tan W, Huang GN, Acharya A, Smith CL, Tallquist MD, Neilson EG, et al. (2012). Heart repair by reprogramming non-myocytes with cardiac transcription factors. Nature 485, 599–604. [DOI] [PMC free article] [PubMed] [Google Scholar]
- Spitz F, and Furlong EE (2012). Transcription factors: from enhancer binding to developmental control. Nat. Rev. Genet. 13, 613–626. [DOI] [PubMed] [Google Scholar]
- Takahashi K, and Yamanaka S (2006). Induction of pluripotent stem cells from mouse embryonic and adult fibroblast cultures by defined factors. Cell 126, 663–676. [DOI] [PubMed] [Google Scholar]
- Tarasov A, Vilella AJ, Cuppen E, Nijman IJ, and Prins P (2015). Sambamba: fast processing of NGS alignment formats. Bioinformatics 31, 2032–2034. [DOI] [PMC free article] [PubMed] [Google Scholar]
- Vannucchi AM, Kiladjian JJ, Griesshammer M, Masszi T, Durrant S, Passamonti F, Harrison CN, Pane F, Zachee P, Mesa R, et al. (2015). Ruxolitinib versus standard therapy for the treatment of polycythemia vera. N. Engl. J. Med. 372, 426–435. [DOI] [PMC free article] [PubMed] [Google Scholar]
- Visel A, Minovitsky S, Dubchak I, and Pennacchio LA (2007). VISTA Enhancer Browser-a database of tissue-specific human enhancers. Nucleic Acids Res. 35, D88–D92. [DOI] [PMC free article] [PubMed] [Google Scholar]
- Wada R, Muraoka N, Inagawa K, Yamakawa H, Miyamoto K, Sadahiro T, Umei T, Kaneda R, Suzuki T, Kamiya K, et al. (2013). Induction of human cardiomyocyte-like cells from fibroblasts by defined factors. Proc. Natl. Acad. Sci. USA 110, 12667–12672. [DOI] [PMC free article] [PubMed] [Google Scholar]
- Wamstad JA, Alexander JM, Truty RM, Shrikumar A, Li F, Eilertson KE, Ding H, Wylie JN, Pico AR, Capra JA, et al. (2012). Dynamic and coordinated epigenetic regulation of developmental transitions in the cardiac lineage. Cell 151, 206–220. [DOI] [PMC free article] [PubMed] [Google Scholar]
- Wang H, Cao N, Spencer CI, Nie B, Ma T, Xu T, Zhang Y, Wang X, Srivastava D, and Ding S (2014). Small molecules enable cardiac reprogramming of mouse fibroblastswith a single factor, Oct4. Cell Rep. 6, 951–960. [DOI] [PMC free article] [PubMed] [Google Scholar]
- Wang L, Liu Z, Yin C, Asfour H, Chen O, Li Y, Bursac N, Liu J, and Qian L (2015). Stoichiometry of Gata4, Mef2c, and Tbx5 influences the efficiency and quality of induced cardiac myocyte reprogramming. Circ. Res. 116, 237–244. [DOI] [PMC free article] [PubMed] [Google Scholar]
- Xu J, Shao Z, Glass K, Bauer DE, Pinello L, Van Handel B, Hou S, Stamatoyannopoulos JA, Mikkola HK, Yuan GC, and Orkin SH (2012). Combinatorial assembly of developmental stage-specific enhancers controls gene expression programs during human erythropoiesis. Dev. Cell 23, 796–811. [DOI] [PMC free article] [PubMed] [Google Scholar]
- Yamakawa H, Muraoka N, Miyamoto K, Sadahiro T, Isomi M, Haginiwa S, Kojima H, Umei T, Akiyama M, Kuishi Y, et al. (2015). Fibroblast Growth Factors and Vascular Endothelial Growth Factor Promote Cardiac Reprogramming under Defined Conditions. Stem Cell Reports 5, 1128–1142. [DOI] [PMC free article] [PubMed] [Google Scholar]
- Yoshida T (2008). MCAT elements and the TEF-1 family of transcription factors in muscle development and disease. Arterioscler. Thromb. Vasc. Biol. 28, 8–17. [DOI] [PubMed] [Google Scholar]
- Yu G, Wang LG, Han Y, and He QY (2012). clusterProfiler: an R package for comparing biological themes among gene clusters. OMICS 16, 284–287. [DOI] [PMC free article] [PubMed] [Google Scholar]
- Zhao Y, Londono P, Cao Y, Sharpe EJ, Proenza C, O’Rourke R, Jones KL, Jeong MY, Walker LA, Buttrick PM, et al. (2015). High-efficiency re-programming of fibroblasts into cardiomyocytes requires suppression of pro-fibrotic signalling. Nat. Commun. 6, 8243. [DOI] [PMC free article] [PubMed] [Google Scholar]
- Zhou H, Dickson ME, Kim MS, Bassel-Duby R, and Olson EN (2015). Akt1/protein kinase B enhances transcriptional reprogramming of fibroblasts to functional cardiomyocytes. Proc. Natl. Acad. Sci. USA 112, 11864–11869. [DOI] [PMC free article] [PubMed] [Google Scholar]
- Zhou H, Morales MG, Hashimoto H, Dickson ME, Song K, Ye W, Kim MS, Niederstrasser H, Wang Z, Chen B, et al. (2017). ZNF281 enhances cardiac reprogramming by modulating cardiac and inflammatory gene expression. Genes Dev. 31, 1770–1783. [DOI] [PMC free article] [PubMed] [Google Scholar]
Associated Data
This section collects any data citations, data availability statements, or supplementary materials included in this article.
Supplementary Materials
Data Availability Statement
All ChIP-seq data can be accessed at Gene Expression Omnibus (GEO) Series: GEO: GSE112315. All RNA-seq data can be accessed at GEO Series: GEO: GSE112316. All datasets used in this paper have been deposited in the GEO with accession number: GEO: GSE112317.