Abstract
Background
The mustache toad, Vibrissaphora ailaonica, is endemic to China and belongs to the Megophryidae family. Like other mustache toad species, V. ailaonica males temporarily develop keratinized nuptial spines on their upper jaw during each breeding season, which fall off at the end of the breeding season. This feature is likely result of the reversal of sexual dimorphism in body size, with males being larger than females. A high-quality reference genome for the mustache toad would be invaluable to investigate the genetic mechanism underlying these repeatedly developing keratinized spines.
Findings
To construct the mustache toad genome, we generated 225 Gb of short reads and 277 Gb of long reads using Illumina and Pacific Biosciences (PacBio) sequencing technologies, respectively. Sequencing data were assembled into a 3.53-Gb genome assembly, with a contig N50 length of 821 kb. We also used high-throughput chromosome conformation capture (Hi-C) technology to identify contacts between contigs, then assembled contigs into scaffolds and assembled a genome with 13 chromosomes and a scaffold N50 length of 412.42 Mb. Based on the 26,227 protein-coding genes annotated in the genome, we analyzed phylogenetic relationships between the mustache toad and other chordate species. The mustache toad has a relatively higher evolutionary rate and separated from a common ancestor of the marine toad, bullfrog, and Tibetan frog 206.1 million years ago. Furthermore, we identified 201 expanded gene families in the mustache toad, which were mainly enriched in immune pathway, keratin filament, and metabolic processes.
Conclusions
Using Illumina, PacBio, and Hi-C technologies, we constructed the first high-quality chromosome-level mustache toad genome. This work not only offers a valuable reference genome for functional studies of mustache toad traits but also provides important chromosomal information for wider genome comparisons.
Keywords: mustache toad, genome assembly, evolution, PacBio, Hi-C
Data Description
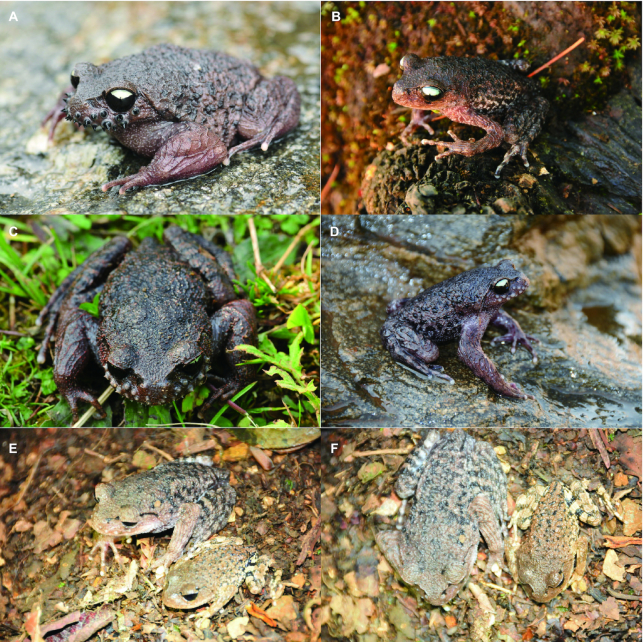
The mustache toad, Vibrissaphora ailaonica (NCBI:txid428466), is an amphibian belonging to the Megophryidae family that is endemic to China (including the China–Vietnam border) [1–3]. This mustache toad species exhibits many interesting features, including unique keratinized spines along the upper jaw [1, 4–6]. These spines grow repeatedly in sexually mature males during the breeding season, and fall off at the end of this process [5–8] (Fig. 1). This morphological difference between males and females is further highlighted by their sexual dimorphism in body size (males are significantly larger than females). The spines (and body size) may be used as a weapon for sexually mature individuals to compete for nests and mating opportunities [7, 9, 10]. Another unique aspect of the mustache toad is that breeding occurs during the cold season, whereas most frogs and toads breed in the warmer months [1]. However, despite the importance of the mustache toad in terms of dynamic spine development and sexual dimorphism in body size, few genomic resources exist for this species. In fact, to date, no next-generation sequencing data have been reported in the Vibrissaphora genus. The lack of genome sequence and transcriptome data for V. ailaonica has hindered identification of functional genes related to their attractive and dynamic appearance (e.g., spine and body size). The shortage of amphibian genomes represented in the Genome 10K/Vertebrate Genomes Projects makes it necessary to analyze other important genomes to study phylogenetic relationships in amphibians on a larger scale [11].
Figure 1:
The mustache toad, Vibrissaphora ailaonica. (A) The adult male individual with spines in the upper jaw. (B) The adult female individual. (C) The adult male individual during the process of spines shedding from the upper jaw. (D) The adult male individual without spines (after spine have been shed) in the upper jaw. (E) The body size of the mustache toad, side view: male (left) and female (right). (F) The body size of mustache toad, top view: male (left) and female (right).
In the present study, we combined genomic sequencing data from Illumina short reads, Pacific Biosciences (PacBio) long reads, and Hi-C data to generate the first chromosome-level reference genome for the mustache toad. The completeness and continuity of the genome were comparable with those of other important amphibian species. The high-quality reference genome generated in this study will facilitate research on population genetic traits and functional gene identification related to important characteristics of the mustache toad.
Analyses and Methods
Sampling and sequencing
During the breeding season (in February), a male mustache toad (V. ailaonica) with keratinized nuptial spines on its upper jaw was caught for sequencing from Ailao Mountain (Fig. 1). To obtain sufficient high-quality DNA for the PacBio Sequel platform (Pacific Biosciences, USA), the mustache toad was dissected, and fresh liver tissue was used for DNA extraction using phenol/chloroform extraction. DNA quality was checked by agarose gel electrophoresis, and high-integrity DNA molecules were obtained. Other tissues, including spines, brain, stomach, intestine, liver, lung, spleen, blood, and tongue, were snap-frozen in liquid nitrogen for 10 min. These 9 organs/tissues were stored at −80°C for RNA-sequencing (RNA-seq) analysis. Isolated total RNA was used to isolate intact poly (A) + RNA using the NEBnext Ultra-Directional RNA Library Prep kit (NEB, protocol B) for library construction. The messenger RNA (mRNA) was further fragmented and randomly primed during first-strand synthesis by reverse transcription. This procedure was followed by second-strand synthesis with DNA polymerase I to create double-stranded complementary DNA fragments using Transcriptor First Strand cDNA Synthesis Kit (Roche).
For the Hi-C experiments, collected blood was used for library construction. The blood sample (150 µL) was cross-linked for 10 min with formaldehyde (1% final concentration), after which glycine (0.2 M final concentration) was added for 5 min to stop the cross-linking process. The sample was then stored until required for further analysis.
Extracted DNA was sequenced using the Illumina and PacBio Sequel platforms. Short reads generated from the Illumina platform were used to estimate genome size and to correct errors in the assembled genome, and the PacBio long reads were used for genome assembly. To this end, 5 libraries with insertion lengths of 220 or 500 bp were sequenced on an Illumina HiSeq 2500 platform, generating 150-bp paired-end reads. A 20-kb library was constructed using the PacBio platform, according to the manufacturer's protocols. Finally, we obtained 225.03 Gb of Illumina short reads and 277.15 Gb of PacBio long reads (Table 1, Additional Tables S1 and S2). The mean N50 length of subreads was 14.78 kb, providing ultra-long genomic sequences for the following assembly and analysis (Additional Table S2).
Table 1:
Sequencing data used for mustache toad genome assembly and annotation
| Sequencing type | Platform | Library size (bp) | Clean data (Gb) | Application |
|---|---|---|---|---|
| Genome long reads | PacBio Sequel | 20,000 | 277.15 | Contig assembly |
| Genome short reads | Illumina HiSeq 2500 | 250 | 225.03 | Genome survey, genome base correction, and genome assessment |
| Genome Hi-C reads | Illumina HiSeq X-Ten | 250 | 378.78 | Chromosome construction |
| Transcriptome short reads | Illumina HiSeq 4000 | 250 | 14.18 | Genome annotation and assessment |
RNA-seq samples were obtained by mixing an equal amount of RNA extracted from each tissue that had been stored and used for library construction. After sequencing on the Illumina HiSeq 4000 platform, we obtained 14.18 Gb of sequencing data (Table 1, Additional Table S3). Four Hi-C libraries were constructed using the same sample with same parameters, and sequenced on the Illumina Hiseq X-ten platform, which generated 378.78 Gb of clean data (Table 1, Additional Table S4).
Genome characteristic estimation
Illumina short reads were filtered for quality as follows. First, adaptors were removed from the sequencing reads. Then, read pairs were excluded if any 1 read had >10% “N,” and read pairs with >50% low-quality bases were removed. Finally, PCR duplicates produced during library construction were removed.
Filtered reads were used to estimate genome size and other characteristics. Using the k-mer method, we calculated the 17-mer depth frequency distribution in the mustache toad. Genome size was estimated as follows:
 |
where TKN17-mer is the total k-mer number and PKFD17-mer is the peak k-mer frequency depth of 17-mer. We estimated a genome size of 3.52 Gb (peak = 54) and found heterozygous, repeated sequence peaks, suggesting that the mustache toad genome exhibits complex genome assembly (Fig. 2).
Figure 2:
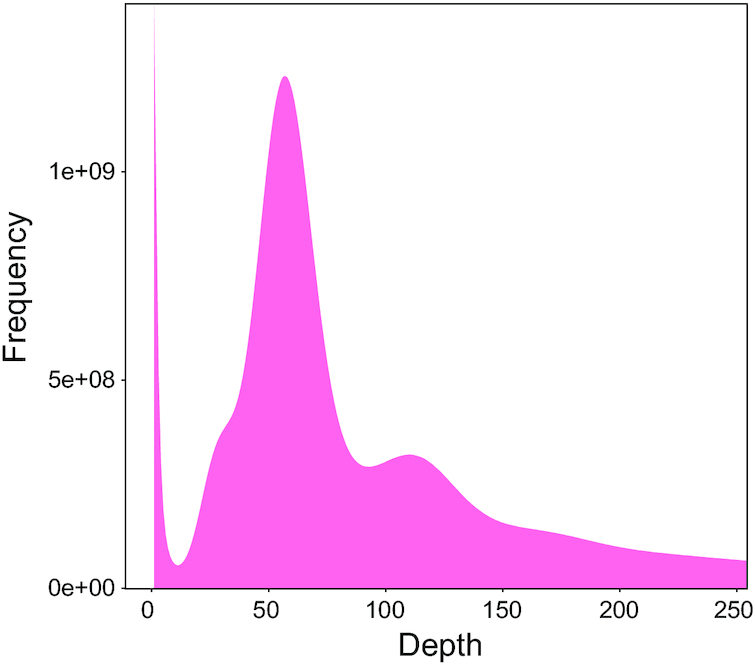
17-mer analysis of Vibrissaphora ailaonica genome characteristics.
Genome assembly using PacBio long reads and Hi-C data
Based on 38 single-molecule real-time cells, and using the PacBio Sequel platform, we generated 277.15 Gb of subreads (Table 1, Additional Table S2). The mean and N50 length of subreads was 9.65 and 14.78 kb, respectively (Additional Table S2). All long reads were assembled using wtdbg software [12] (WTDBG, RRID: SCR_01 7225). As a result, we obtained a 3.95-Gb genome assembly, with a contig N50 length of 739.54 kb. However, although the size of the genome assembly was comparable to the estimated k-mer result, the end result was a slightly larger. This may be associated with the complexity of the mustache toad genome (which has a high rate of heterozygosity and repetitive sequences). Redundancy in the genome assembly was removed using Redundans software (v0.13c) [13], with an identity of 0.7 and overlap of 0.7. This resulted in a genome assembly of 3.58 Gb and a contig N50 length of 834.90 kb. To ensure that all contigs removed were not real sequences, we used BUSCO [14] and the mapping ratio of Illumina reads in both the raw genome and the redundancy-filtered genome. Results of these checks indicated that the parameters used in the redundancy-filtered step were appropriate for this study (Additional Table S5). To further improve the quality and accuracy of our genome assembly, Illumina short reads were used to polish the genome using Pilon software (Pilon, RRID: SCR_01 4731, v1.21) [15] at the single-base level.
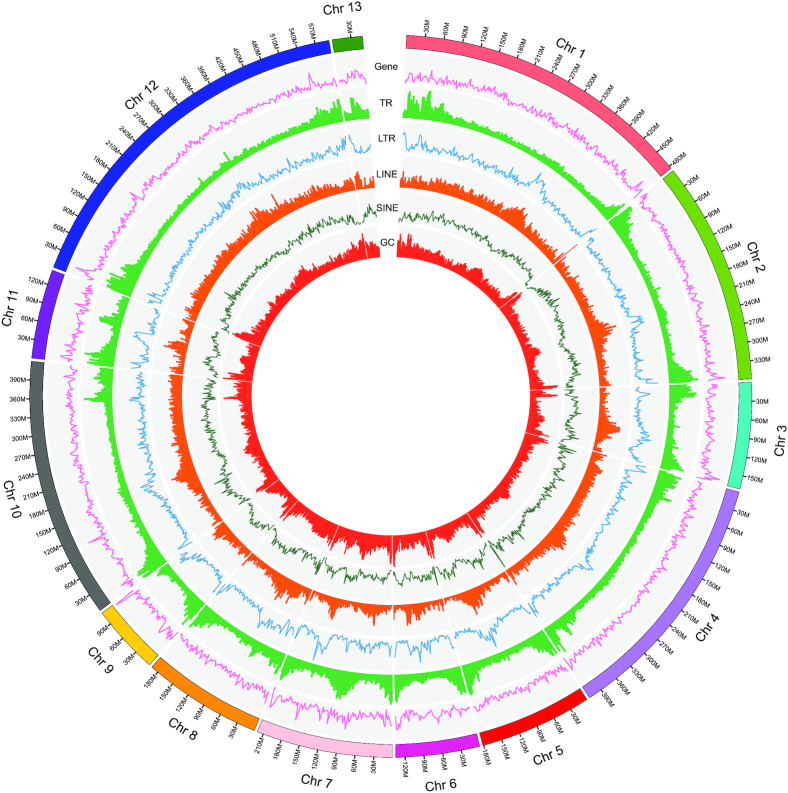
Hi-C data were used to improve the connection integrity of the contigs (15,899 contigs). We obtained 378.78 Gb of Hi-C sequencing data, which was first filtered using Hic-Pro (v2.10.0) [16] (Table 1, Additional Table S4) and then mapped to the polished mustache toad genome [17]. The locations and directions of the contigs were determined by 3D de novo assembly (3d-DNA) software (v180419) [18], with default parameters. Most contigs were then successfully clustered and anchored in 13 groups (Fig. 3) [19]. Finally, we obtained the first chromosome-level, high-quality mustache toad assembly (3.53 Gb) with a scaffold N50 length of 412.42 Mb, which provides a solid genomic resource to assist further study of the mustache toad (Table 2).
Figure 3:
Circos graph showing characteristics of the mustache toad genome. From outer circle to inner ring: gene distribution, tandem repeats (TR), long tandem repeats (LTR), long interspersed nuclear elements (LINE), short interspersed nuclear elements (SINE), and guanine-cytosine (GC) content.
Table 2:
Assembly data for the mustache toad genome
| Term | Wtdbg contig | Hi-C scaffold | ||
|---|---|---|---|---|
| Size (bp) | No. | Size (bp) | No. | |
| N90 | 153,029 | 4,866 | 134,864,763 | 11 |
| N80 | 301,658 | 3,285 | 181,461,513 | 8 |
| N70 | 456,829 | 2,334 | 220,042,448 | 6 |
| N60 | 624,716 | 1,671 | 359,321,214 | 5 |
| N50 | 821,125 | 1,180 | 412,424,790 | 4 |
| Maximum length (bp) | 9,978,207 | 592,710,058 | ||
| Total size (bp) | 3,530,531,046 | 3,535,795,546 | ||
| Total No. (>100 bp) | 15,899 | 5,370 | ||
Note: These data pertain to genome assembly. Wtdbg contig was the genome assembled by wtdbg and 2-round pilon error correction. Hi-C scaffold was the genome finished by Hi-C assembly.
Genome assembly evaluation
The quality of a genome assembly is directly related to the accuracy and completeness of protein-coding gene prediction. Therefore, we evaluated the assembled mustache toad genome using 3 methods. First, the assembled genome was compared against the core gene set in BUSCO (BUSCO, RRID:SCR_015008, v2.0) [14]. We found 245 (80.8%) and 833 (85.1%) conserved core genes in the mustache toad genome using the eukaryote and metazoan databases, respectively (Table 3). When we further considered the fragmented BUSCO genes found in the genome, there were 272 (89.7%) and 881 (90.1%) conserved core genes in the eukaryote and metazoan databases, respectively. These results indicated that the assembled mustache toad genome is comparable with published amphibian genomes (Table 3).
Table 3:
Assessment of genome assembly and annotation completeness of the mustache toad and other amphibian genomes, using BUSCO
| Library | V. ailaonica (eukaryota) | V. ailaonica (metazoa) | Nanorana parkeri (eukaryota) | Xenopus tropicalis (eukaryota) | Rhinella marina (eukaryota) | Rana catesbeiana (eukaryota) | Ambystoma mexicanum (eukaryota) |
|---|---|---|---|---|---|---|---|
| Complete genes (%) | 80.8 | 85.1 | 90.1 | 90.1 | 90.4 | 58.0 | 24.4 |
| Complete and single-copy genes (%) | 78.2 | 83.6 | 87.8 | 88.1 | 86.1 | 55.4 | 23.4 |
| Complete and duplicated genes (%) | 2.6 | 1.5 | 2.3 | 2.0 | 4.3 | 2.6 | 1.0 |
| Fragmented genes (%) | 8.9 | 4.9 | 3.6 | 2.0 | 3.3 | 20.8 | 24.4 |
| Missing genes (%) | 10.3 | 10.0 | 6.3 | 7.9 | 6.3 | 21.2 | 51.2 |
Note: Both “eukaryote” and “metazoan” are 2 core gene sets in the BUSCO database.
Second, all filtered short reads generated from the Illumina platform were aligned to the genome using BWA software (BWA, RRID:SCR_010910, v0.7.12) [20]; 1,778 million clean reads could be mapped to the genome, accounting for 97.78% of total clean reads (Additional Table S6).
Third, RNA-seq reads were de novo assembled using Bridger software (Bridger, RRID:SCR_017039, version: r2014–12-01) [21], with redundant transcripts removed by TGICL [22]. This resulted in 19,876 transcripts (Additional Table S7). These transcripts were then aligned to the genome, with 17,878 transcripts (89.95%) found in the assembled genome, and 94.52% of transcripts being longer than 1 kb (Additional Table S8). Analysis of N50 length and BUSCO results revealed that the mustache toad genome was comparable to that of other published amphibian genomes (Tables 2–4), indicating that our assembled mustache toad genome exhibited high completeness and accuracy.
Table 4:
Quality data for several published amphibian genomes
| Species | Contig N50 (bp) | Scaffold N50 (bp) | Genome size (bp) | Genome BUSCO (eukaryota) (%) |
|---|---|---|---|---|
| Nanorana parkeri | 32,798 | 1,069,101 | 2,053,867,363 | 90.1 |
| Xenopus tropicalis | 71,041 | 135,134,832 | 1,440,398,454 | 90.1 |
| Rhinella marina | 166,489 | 167,498 | 2,551,759,918 | 90.4 |
| Rana catesbeiana | 5,415 | 39,363 | 6,250,353,185 | 58.0 |
| Ambystoma mexicanum | 216,366 | 3,052,786 | 32,393,605,577 | 24.4 |
The GC distribution of the mustache toad genome, and that of other vertebrate species, was calculated using the slide window method. GC distributions were similar, with a mean GC content of 43.68% in the mustache toad, and 36.60–44.49% in other species (Additional Figure S1).
Genome annotation
Tandem Repeats Finder (TRF, v4.04) [23] was used to identify repetitive elements, and RepeatModeler software (RepeatModeler, RRID:SCR_015027, v1.0.4) was used to detect transposable elements (TEs) in the mustache toad genome. Then, the de novo library of repeats produced by RepeatModeler analysis and the repbase (RepBase16.02) database were used for RepeatMasker (RepeatMasker, RRID:SCR_012954, version: open-4.0) [24] analysis to identify homologous repeats. RepeatProteinMask was used to query the TE protein database at the protein level. Last, we identified 2.45 Gb of repeat sequences, accounting for 69.48% of the estimated genome size (Additional Table S9). Among these repeat sequences, 60.87% (2.15 Gb) was predicted by the de novo method (Table 5).
Table 5:
De novo–annotated repeat sequences in the mustache toad genome
| Type | Length (bp) | Percentage in genome (%) |
|---|---|---|
| DNA | 350,793,270 | 9.94 |
| LINE | 297,954,803 | 8.45 |
| SINE | 11,009,363 | 0.31 |
| LTR | 307,317,539 | 8.71 |
| Other | 43,867,330 | 1.24 |
| Satellite | 9,696,790 | 0.27 |
| Simple repeat | 125,397,072 | 3.55 |
| Unknown | 1,114,326,962 | 31.59 |
| Total | 2,147,505,764 | 60.87 |
After repeat sequence annotation, we masked all repeats, except for the tandem repeat sequences, for protein-coding gene annotation. Augustus software (Augustus, RRID:SCR_008417, v2.5.5) [25] was used to de novo–predict coding genes using a zebrafish (Danio rerio) dataset as the training species. For the homology-based method, protein sequences of chordate species, including D. rerio (GCF_0 00002035.6) [26], Nanorana parkeri (GCF_000 935625.1) [27], Homo sapiens (GCF_0 00001405.38) [28], Gallus gallus (GCF_0 00002315.5) [29], Pelodiscus sinensis (GCF_000 230535.1) [30], Xenopus laevis (GCF_0 016 63975.1) [31], and Petromyzon marinus [32], were downloaded and aligned against the mustache toad genome using the TBLASTN module (TBLASTN, RRID:SCR_011822, BLAST version: 2.3.0). The transcripts assembled by RNA-seq reads were first translated into amino acids and then aligned to the genome using TBLASTN software for gene annotation. EVidenceModeler (EVidenceModeler, RRID:SCR_014659, version: r2012–06-25) [33] was used to integrate results from the 3 methods, and genes with poor transcriptome evidence support were filtered out. Finally, 26,227 high-quality protein-coding genes were predicted in the mustache toad genome. The distributions of mRNA, coding sequences, and exon and intron lengths were comparable to those of closely related species (Fig. 4).
Figure 4:
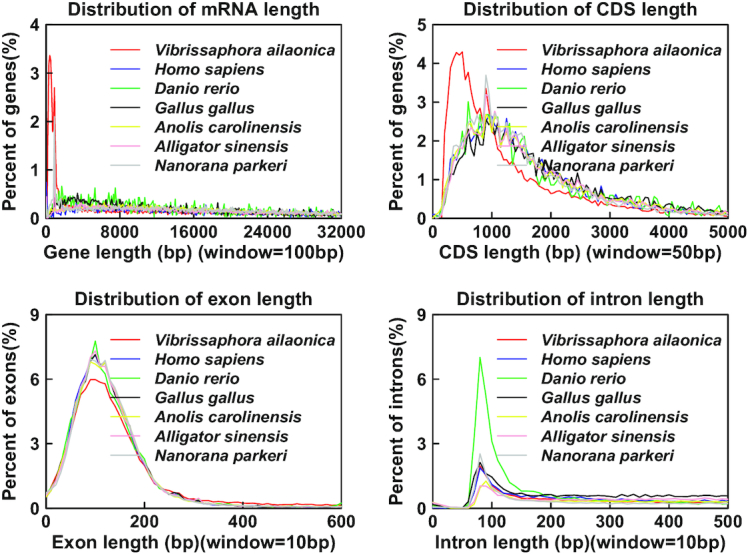
Length distributions of annotated protein-coding genes in Vibrissaphora ailaonica, Homo sapiens, Danio rerio, Gallus gallus, Anolis carolinensis, Alligator sinensis, and Nanorana parkeri.
Gene functional annotation can help to elucidate gene function. Thus, we aligned all 26,227 protein-coding genes to protein databases, including InterProScan, KEGG, SwissProt, and TrEMBL. Results showed that most of the genes obtained could be annotated from these functional databases (Table 6).
Table 6:
Functional annotation for protein-coding genes in the mustache toad genome
| Database | Annotated gene No. (%) |
|---|---|
| Interpro | 12,997 (49.56) |
| KEGG | 10,035 (38.26) |
| SwissProt | 12,410 (47.32) |
| Trembl | 17,916 (68.31) |
Phylogenetic tree and divergence time analysis
To reveal phylogenetic relationships between the mustache toad and other closely related species, we identified the single-copy genes among these species. First, protein sequences, including those of D. rerio (GCF_0 00002035.6) [26], N. parkeri (GCF_000 935625.1) [27], H. sapiens (GCF_0 00001405.38) [28], G. gallus (GCF_0 00002315.5) [29], Anolis carolinensis (GCF_00 0090745.1) [34], Xenopus tropicalis (GCF_0 00004195.3) [31], Rhinella marina (GigaDB) [35], Rana catesbeiana (GCA_0 022 84835.2) [36], Ambystoma mexicanum [37, 38], and Alligator sinensis (GCF_000 455745.1) [39], were downloaded from the NCBI. The longest transcript of each gene in each species was selected. BLASTP (BLASTP, RRID:SCR_001010, BLAST version: 2.2.24) was then used to align these protein sequences from the 11 species (including the mustache toad), with an e-value of 1e−5. Homology relationships (including orthologs and paralogs) were then determined using OrthoMCL software (v1.4) [40]. Genes with only 1 copy in the species were identified as single-copy genes. In total, 238 genes were identified (Fig. 5). Detailed statistics about gene families are shown in Additional Table S10.
Figure 5:
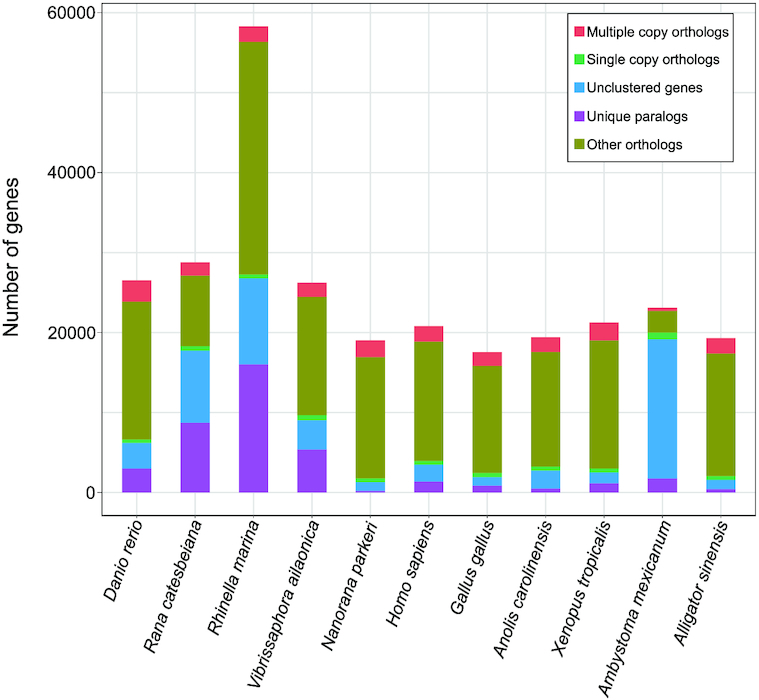
The statistics of gene family among 11 species including Danio rerio, Rana catesbeiana, Rhinella marina, Vibrissaphora ailaonica, Nanorana parkeri, Homo sapiens, Gallus gallus, Anolis carolinensis, Xenopus tropicalis, Ambystoma mexicanum, and Alligator sinensis.
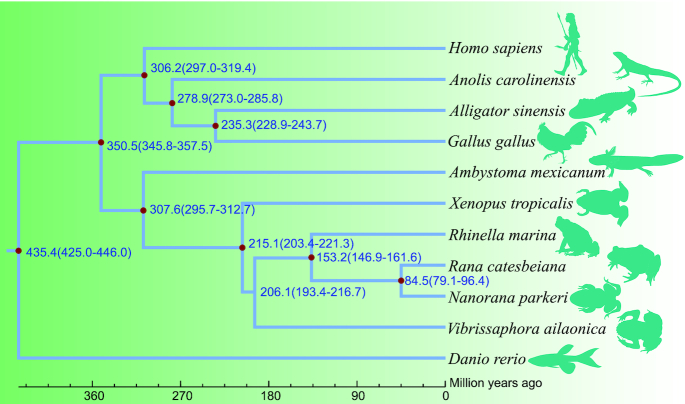
The 238 single-copy genes were aligned using MUSCLE software (MUSCLE, RRID:SCR_011812, v3.8.31) [41, 42] and concatenated to supergenes for maximum-likelihood–based phylogenetic analyses. We performed phylogenetic analysis, with zebrafish as the outgroup, using RAxML software (RAxML, RRID:SCR_006086, v8.2.3) [43], with the parameter “-m” for PROTGAMMAAUTO. Results indicated that the mustache toad has a close relationship with the ancestor of the marine toad (R. marina), bullfrog (R. catesbeiana), and Tibetan frog (N. parkeri), with topological relationships in other clades found to be the same as reported previously (Fig. 6). To further investigate the divergence time of these species, especially toads and frogs, the MCMCTREE model (part of the PAML software package; PAML, RRID:SCR_014932, v4.8) [44] was used with 3 datasets (4-fold degenerate sites [4dTVs], first-codon sites, and second-codon sites) extracted from the single-copy genes as the input file. Fossil records were downloaded from the TIMETREE website [45] and used to calibrate the results. Results from the 3 different datasets were very similar, showing that the mustache toad diverged from the common ancestor of the marine toad, bullfrog, and Tibetan frog ∼206.1 million years ago (Fig. 6; Additional Figs S2 and S3).
Figure 6:
The phylogenetic relationships among these species. The species including Danio rerio, Rana catesbeiana, Rhinella marina, Vibrissaphora ailaonica, Nanorana parkeri, Homo sapiens, Gallus gallus, Anolis carolinensis, Xenopus tropicalis, Ambystoma mexicanum, and Alligator sinensis. Blue numbers represent divergence time with 95% confidence interval. The red dot represents the fossil record used in the node.
Gene family expansion and contraction
We performed gene family expansion and contraction analysis using CAFÉ software (CAFÉ, RRID:SCR_005983, v4.0) [46] and found 201 and 326 expanded and contracted gene families in the mustache toad (P < 0.05), respectively. Using the Gene Ontology (GO) and KEGG databases, functional enrichment analysis of expanded gene families revealed 210 GO terms (adjusted P < 0.05) and 9 KEGG pathways (q < 0.05) to be significantly enriched (Additional Tables S11 and S12). The expanded gene families were mainly related to metabolic processes, intermediate filament terms, enzyme activities, and immune terms. For example, cellular metabolic process (adjusted P = 6.06E−14), intermediate filament (adjusted P = 3.42E−15), keratin filament (adjusted P = 2.94E−13), endoribonuclease activity (adjusted P = 9.19E−08), and immune response (q = 8.36E−03) were enriched (Additional Tables S11 and S12). In addition, for the contracted gene families, 220 GO terms (adjusted P < 0.05) and 9 KEGG pathways (q < 0.05) were enriched, respectively (Additional Tables S13 and S14). These enriched terms were mainly involved in ion binding and transporter activity, including neurotransmitter transporter activity (adjusted P = 1.89E−11), sodium ion transmembrane transporter activity (adjusted P = 3.33E−06), and secondary active transmembrane transporter activity (adjusted P = 1.86E−08) (Additional Tables S13 and S14). Thus, these biological processes may be related to the special characteristics of the mustache toad.
Relative evolutionary rate of species
The evolutionary rate of species can reflect its evolutionary history and status. The relative evolutionary rate of the mustache toad to other closely related species was analyzed using LINTRE [47] and MEGA (MEGA, RRID:SCR_000667, v7.0.26) software. Two-cluster analysis was applied to test the molecular evolution of multiple sequences in a phylogenetic context, based on concatenated supergenes (protein sequences) using "tpcv" (a module in LINTRE software). Concatenated supergenes were also used for Tajima's relative rate test. We used zebrafish as the outgroup in both methods and found that, except for the axolotl, the mustache toad had a relatively faster evolutionary rate than its closely related species (e.g., X. tropicalis, R. marina, R. catesbeiana, and N. parkeri) (Additional Tables S15 and S16). The crocodile had a slower evolutionary rate, relative to its closely related species, which is consistent with previous work [48] (Additional Tables S15 and S16).
Discussion
Using Illumina, PacBio, and Hi-C sequencing technologies, we report the first chromosome-level genome assembly of the mustache toad. We successfully annotated the high-quality protein-coding genes by integrating results from 3 different methods. Phylogenetic analysis indicated that the mustache toad is closely related to the marine toad, bullfrog, and Tibetan frog. Analysis showed that the mustache toad had a faster evolutionary rate, relative to most other closely related species studied. Analysis of the expansion and contraction of gene families identified several biological processes and pathways, such as metabolism and intermediate filaments, suggesting that these terms may relate to the special adaptations of the mustache toad to its habitat. This work not only offers a valuable chromosome-level genomic data for comparative genomics analysis but also provides important genomic data for studying the mustache toad traits.
Supplementary Material
Michael Hiller -- 5/4/2019 Reviewed
Michael Hiller -- 6/19/2019 Reviewed
Taejoon Kwon -- 5/6/2019 Reviewed
Availability of supporting data and materials
Raw sequencing data were deposited in the NCBI database under accession number PRJNA523649. Genome assembly and annotation results are available via the GigaScience repository, GigaDB [49].
Additional files
Additional Figure S1: The GC content in these genomes. The species include Gallus gallus, Vibrissaphora ailaonica, Alligator sinensis, Nanorana parkeri, Homo sapiens, Anolis carolinensis, Xenopus tropicalis, and Danio rerio.
Additional Figure S2: The divergence time of these species (using first-codon sites). The species include Danio rerio, Rana catesbeiana, Rhinella marina, Vibrissaphora ailaonica, Nanorana parkeri, Homo sapiens, Gallus gallus, Anolis carolinensis, Xenopus tropicalis, Ambystoma mexicanum, and Alligator sinensis.
Additional Figure S3: The divergence time of these species (using second-codon sites). The species include Danio rerio, Rana catesbeiana, Rhinella marina, Vibrissaphora ailaonica, Nanorana parkeri, Homo sapiens, Gallus gallus, Anolis carolinensis, Xenopus tropicalis, Ambystoma mexicanum, and Alligator sinensis.
Additional Table S1: Illumina sequencing clean data.
Additional Table S2: PacBio Sequel sequencing data.
Additional Table S3: RNA-sequencing clean data.
Additional Table S4: Hi-C sequencing clean data.
Additional Table S5: Comparison of the BUSCO and Illumina read mapping results between the raw genome and redundancy-filtered genome.
Additional Table S6: Illumina read mapping ratio to the assembled genome.
Additional Table S7: The statistics of assembled transcripts by Bridger software. The redundant transcripts were removed by TGICL software.
Additional Table S8: Transcript mapping ratio to the assembled genome.
Additional Table S9: Annotated repeat sequences in our assembled genome.
Additional Table S10: Gene families among these species. The species include Danio rerio, Rana catesbeiana, Rhinella marina, Vibrissaphora ailaonica, Nanorana parkeri, Homo sapiens, Gallus gallus, Anolis carolinensis, Xenopus tropicalis, Ambystoma mexicanum, and Alligator sinensis.
Additional Table S11: Gene Ontology (GO) enrichment analysis of expanded gene families.
Additional Table S12: KEGG enrichment analysis of expanded gene families.
Additional Table S13: Gene Ontology (GO) enrichment analysis of contracted gene families.
Additional Table S14: KEGG enrichment analysis of contracted gene families.
Additional Table S15: Two-cluster analysis of mustache toad and other species.
Additional Table S16: The relative evolutionary rate of mustache toad and other species analyzed by Tajima's test.
Abbreviations
BLAST: Basic Local Alignment Search Tool; bp: base pairs; BUSCO: Benchmarking Universal Single-Copy Orthologs; BWA: Burrows–Wheeler Aligner; Gb: gigabase pairs; GC: guanine-cytosine; GO: Gene Ontology; Hi-C: high-throughput chromosome conformation capture; kb: kilobase pairs; KEGG: Kyoto Encyclopedia of Genes and Genomes; LINE: long interspersed nuclear element; LTR: long tandem repeat; Mb: megabase pairs; mRNA: messenger RNA; NCBI: National Center for Biotechnology Information; PAML: Phylogenetic Analysis by Maximum Likelihood; RAxML: Randomized Axelerated Maximum Likelihood; RNA-seq: RNA-sequencing; SINE: short interspersed nuclear element; TR: tandem repeat; TrEMBL: Translation of European Molecular Biology Laboratory.
Competing interests
The authors declare that they have no competing interests.
Funding
This work was supported by the National Key Research and Development Program of China (grant number 2017YFC0505202) and the National Natural Science Foundation of China (grant numbers NSFC-30 270 175, NSFC-30 870 278, and NSFC-31 372 165).
Authors’ contributions
D.R. designed the project; D.R. and D.Z. collected the samples; Y.L. and Y.R. estimated the genome size and assembled the genome; Y.L. polished the assembled genome and analyzed Hi-C data; H.J. performed the genome annotation; Y.L. and Z.W. assessed the quality of the genome assembly; Y.L. and Y.R. constructed the phylogenetic tree and determined divergence time, relative evolutionary rate of species, and expansion and contraction of gene families. Y.L., D.R., Y.R., and X.L. wrote the manuscript. All authors read and approved the final version of the manuscript.
References
- 1. Liang F, Changyuan Y. Amphibians of China. Beijing: Science Press; 2016;466-485. [Google Scholar]
- 2. Matsui M, Hamidy A, Murphy RW, et al.. Phylogenetic relationships of megophryid frogs of the genus Leptobrachium (Amphibia, Anura) as revealed by mtDNA gene sequences. Mol Phylogenet Evol. 2010;56(1):259–72. [DOI] [PubMed] [Google Scholar]
- 3. Matsui M. A newLeptobrachium (Vibrissaphora) from Laos (Anura: Megophryidae). Curr Herpetol. 2013;32(2):182–9. [Google Scholar]
- 4. Liu C-C, Hu S-Q, Zhao EM. Preliminary study of genus Vibrissaphora (Amphibia: Salientia) and discussion on problems of amphibian classification [in Chinese]. Acta Herpetologica Sinica. 1980;31:1–9. [Google Scholar]
- 5. Rao DQ, Wilkinson JA. Phylogenetic relationships of the mustache toads inferred from mtDNA sequences. Mol Phyl Evol. 2008;46(1):61–73. [DOI] [PubMed] [Google Scholar]
- 6. Zheng Y, Li S, Fu J. A phylogenetic analysis of the frog genera Vibrissaphoraand Leptobrachium, and the correlated evolution of nuptial spine and reversed sexual size dimorphism. Mol Phylogenet Evol. 2008;46(2):695–707. [DOI] [PubMed] [Google Scholar]
- 7. Zheng Y, Deng D, Li S, et al.. Aspects of the breeding biology of the Omei mustache toad (Leptobrachium boringii): polygamy and paternal care. Amphibia-Reptilia. 2010;31(2):183–94. [Google Scholar]
- 8. Zhang W, Guo Y, Li J, et al.. Transcriptome analysis reveals the genetic basis underlying the seasonal development of keratinized nuptial spines in Leptobrachium boringii. BMC Genomics. 2016;17(1):978. [DOI] [PMC free article] [PubMed] [Google Scholar]
- 9. Zheng Y, Rao D, Murphy RW, et al.. Reproductive behavior and underwater calls in the Emei mustache toad, Leptobrachium boringii. Asian Herpetol Res. 2011;2(4):199–215. [Google Scholar]
- 10. Hudson CM, Xianjin HE, Jinzhong FU. Keratinized nuptial spines are used for male combat in the Emei moustache toad (Leptobrachium boringii). Asian Herpetol Res. 2011;2(3):142–8. [Google Scholar]
- 11. Genome 10K Community of Scientists . Genome 10K: a proposal to obtain whole-genome sequence for 10,000 vertebrate species. J Hered. 2009;100(6):659–74. [DOI] [PMC free article] [PubMed] [Google Scholar]
- 12. WTDBG. https://github.com/ruanjue/wtdbg-1.2.8. Accessed 30 August 2019.
- 13. Pryszcz LP, Gabaldón T. Redundans: an assembly pipeline for highly heterozygous genomes. Nucleic Acids Res. 2016;44(12):e113. [DOI] [PMC free article] [PubMed] [Google Scholar]
- 14. Simão FA, Waterhouse RM, Panagiotis I, et al.. BUSCO: assessing genome assembly and annotation completeness with single-copy orthologs. Bioinformatics. 2015;31(19):3210–2. [DOI] [PubMed] [Google Scholar]
- 15. Walker BJ, Abeel T, Shea T, et al.. Pilon: an integrated tool for comprehensive microbial variant detection and genome assembly improvement. PLoS One. 2014;9(11):e112963. [DOI] [PMC free article] [PubMed] [Google Scholar]
- 16. Servant N, Varoquaux N, Lajoie BR, et al.. HiC-Pro: an optimized and flexible pipeline for Hi-C data processing. Genome Biol. 2015;16(1):259. [DOI] [PMC free article] [PubMed] [Google Scholar]
- 17. Durand N, Shamim M, Machol I, et al.. Juicer provides a one-click system for analyzing loop-resolution Hi-C experiments. Cell Syst. 2016;3(1):95–8. [DOI] [PMC free article] [PubMed] [Google Scholar]
- 18. Dudchenko O, Batra SS, Omer AD, et al.. De novo assembly of the Aedes aegypti genome using Hi-C yields chromosome-length scaffolds. Science. 2017;356(6333):92. [DOI] [PMC free article] [PubMed] [Google Scholar]
- 19. Wilkinson JA. A new species of the genus Vibrissaphora(Anura: Megophryidae) from Yunnan Province, China. Herpetologica. 2006;62(1):90–5. [Google Scholar]
- 20. Li H, Durbin R. Fast and accurate short read alignment with Burrows-Wheeler transform. Bioinformatics. 2009;25(14):1754–60. [DOI] [PMC free article] [PubMed] [Google Scholar]
- 21. Chang Z, Li G, Liu J, et al.. Bridger: a new framework for de novo transcriptome assembly using RNA-seq data. Genome Biol. 2015;16(1):30. [DOI] [PMC free article] [PubMed] [Google Scholar]
- 22. Pertea G, Huang X, Liang F, et al.. TIGR Gene Indices clustering tools (TGICL): a software system for fast clustering of large EST datasets. Bioinformatics. 2003;19(5):651–2. [DOI] [PubMed] [Google Scholar]
- 23. Benson G. Tandem Repeats Finder: a program to analyze DNA sequences. Nucleic Acids Res. 1999;27(2):573–80. [DOI] [PMC free article] [PubMed] [Google Scholar]
- 24. Bedell JA, Korf I, Gish W. MaskerAid: a performance enhancement to RepeatMasker. Bioinformatics. 2000;16(11):1040–1. [DOI] [PubMed] [Google Scholar]
- 25. Stanke M, Waack S. Gene prediction with a hidden Markov model and a new intron submodel. Bioinformatics. 2003;19(suppl 2):215–25. [DOI] [PubMed] [Google Scholar]
- 26. Kerstin H, Clark MD, Torroja CF, et al.. The zebrafish reference genome sequence and its relationship to the human genome. Nature. 2013;496(7446):498–503. [DOI] [PMC free article] [PubMed] [Google Scholar]
- 27. Yan-Bo S, Zi-Jun X, Xue-Yan X, et al.. Whole-genome sequence of the Tibetan frog Nanorana parkeri and the comparative evolution of tetrapod genomes. Proc Natl Acad Sci U S A. 2015;11(112):E1257–E62. [DOI] [PMC free article] [PubMed] [Google Scholar]
- 28. Lander ES, Linton LM, Birren B, et al.. Initial sequencing and analysis of the human genome. Nature. 2001;409(6822):860–921. [DOI] [PubMed] [Google Scholar]
- 29. International Chicken Genome Sequencing Consortium. Sequence and comparative analysis of the chicken genome provide unique perspectives on vertebrate evolution. Nature. 2004;432(7018):695–716. [DOI] [PubMed] [Google Scholar]
- 30. Wang Z, Pascual-Anaya J, Zadissa A, et al.. The draft genomes of soft-shell turtle and green sea turtle yield insights into the development and evolution of the turtle-specific body plan. Nat Genet. 2013;45(6):701–6. [DOI] [PMC free article] [PubMed] [Google Scholar]
- 31. Session AM, Uno Y, Kwon T, et al.. Genome evolution in the allotetraploid frog Xenopus laevis. Nature. 2016;538(7625):336–43. [DOI] [PMC free article] [PubMed] [Google Scholar]
- 32. Smith JJ, Timoshevskaya N. The sea lamprey germline genome provides insights into programmed genome rearrangement and vertebrate evolution. 2018;50(2):270–7. [DOI] [PMC free article] [PubMed] [Google Scholar]
- 33. Haas BJ, Salzberg SL, Zhu W, et al.. Automated eukaryotic gene structure annotation using EVidenceModeler and the Program to Assemble Spliced Alignments. Genome Biol. 2008;9(1):R7. [DOI] [PMC free article] [PubMed] [Google Scholar]
- 34. Aföldi J, Di Palma F, Grabherr M, et al.. The genome of the green anole lizard and a comparative analysis with birds and mammals. Nature. 2011;477(7366):587–91. [DOI] [PMC free article] [PubMed] [Google Scholar]
- 35. Edwards RJ, Tuipulotu DE, Amos TG, et al.. Draft genome assembly of the invasive cane toad, Rhinella marina. Gigascience. 2018;7(9), doi: 10.1093/gigascience/giy095. [DOI] [PMC free article] [PubMed] [Google Scholar]
- 36. Hammond SA, Warren RL, Vandervalk BP, et al.. The North American bullfrog draft genome provides insight into hormonal regulation of long noncoding RNA. 2017;8(1):1433. [DOI] [PMC free article] [PubMed] [Google Scholar]
- 37. Smith JJ, Timoshevskaya N, Timoshevskiy VA, et al.. A chromosome-scale assembly of the axolotl genome. Genome Res. 2019;29(2):317–24. [DOI] [PMC free article] [PubMed] [Google Scholar]
- 38. Nowoshilow S, Schloissnig S, Fei JF, et al.. The axolotl genome and the evolution of key tissue formation regulators. Nature. 2018;554:7690. [DOI] [PubMed] [Google Scholar]
- 39. Wan QH, Pan SK, Hu L, et al.. Genome analysis and signature discovery for diving and sensory properties of the endangered Chinese alligator. Cell Res. 2013;23(9):1091–105. [DOI] [PMC free article] [PubMed] [Google Scholar]
- 40. Li L, Stoeckert CJ Jr, Roos DS. OrthoMCL: identification of ortholog groups for eukaryotic genomes. Genome Res. 2003;13(9):2178–89. [DOI] [PMC free article] [PubMed] [Google Scholar]
- 41. Edgar RC. MUSCLE: multiple sequence alignment with high accuracy and high throughput. Nucleic Acids Res. 2004;32(5):1792–7. [DOI] [PMC free article] [PubMed] [Google Scholar]
- 42. Edgar RC. MUSCLE: a multiple sequence alignment method with reduced time and space complexity. BMC Bioinformatics. 2004;5:113. [DOI] [PMC free article] [PubMed] [Google Scholar]
- 43. Alexandros S. RAxML version 8: a tool for phylogenetic analysis and post-analysis of large phylogenies. Bioinformatics. 2014;30(9):1312–3. [DOI] [PMC free article] [PubMed] [Google Scholar]
- 44. Yang Z. PAML 4: phylogenetic analysis by maximum likelihood. Mol Biol Evol. 2007;24(8):1586–91. [DOI] [PubMed] [Google Scholar]
- 45. TimeTree. www.timetree.org. Accessed 30 August 2019.
- 46. Tijl DB, Nello C, Demuth JP, et al.. CAFE: a computational tool for the study of gene family evolution. Bioinformatics. 2006;22(10):1269–71. [DOI] [PubMed] [Google Scholar]
- 47. Takezaki N, Rzhetsky A, Nei M. Phylogenetic test of the molecular clock and linearized trees. Mol Biol Evol. 1995;12(5):823–33. [DOI] [PubMed] [Google Scholar]
- 48. Green RE, Braun EL, Joel A, et al.. Three crocodilian genomes reveal ancestral patterns of evolution among archosaurs. Science. 2014;346(6215):1254449. [DOI] [PMC free article] [PubMed] [Google Scholar]
- 49. Li Y, Ren Y, Zhang D, et al.. Supporting data for “Chromosome-level assembly of the mustache toad genome using third-generation DNA sequencing and Hi-C analysis.”. GigaScience. 2019. 10.5524/100624. [DOI] [PMC free article] [PubMed] [Google Scholar]
Associated Data
This section collects any data citations, data availability statements, or supplementary materials included in this article.
Supplementary Materials
Michael Hiller -- 5/4/2019 Reviewed
Michael Hiller -- 6/19/2019 Reviewed
Taejoon Kwon -- 5/6/2019 Reviewed


