

Abstract
Formation of neurofibrillary tangles (NFTs) is a common neuropathological feature found in several neurodegenerative diseases, including Alzheimer's disease. We have developed a transgenic (Tg) mouse expressing mutant human tau (V337M), derived from frontotemporal dementia parkinsonism-17. V337M Tg mice revealed tau aggregations in the hippocampus, which fulfills the histological criteria for NFTs in human neurodegenerative diseases. Concurrent with the accumulation of RNA and phosphorylated tau, neurons exhibited morphological characteristics of degenerating neurons, which include a loss of microtubules, accumulation of ribosomes, plasma and nuclear membrane ruffling, and swelling of the Golgi network. Thus, mutant tau induces neuronal degeneration associated with the accumulation of RNA and phosphorylated tau. The functional consequences of this neuronal degeneration was evidenced by the reduction of hippocampal neural activity and behavioral abnormality in Tg mice.
Keywords: neurodegeneration, phosphorylated tau, RNA, NFT, Tg mouse, FTDP-17
Neurofibrillary tangles (NFTs) are neuronal inclusions of microtubule-binding protein tau and are composed of phosphorylated and ubiquitinated tau, which aggregate to form a β-pleated sheet structure. NFT formation is a key marker of neurodegenerative pathologies, which is the most common pathway leading to degeneration of neurons in several neurodegenerative diseases, including Alzheimer's disease (AD) (Lee and Trojanowski, 1999). In the case of AD, NFTs occur in CA1 of hippocampus, entorhinal and association cortices, and some restricted subcortical nuclei, where neuronal loss also occurs. The loss of neurons is responsible for dementia in AD. However, a direct causal connection between NFT formation and neuronal loss is still a matter of debate, because neurons are lost at a rate several times greater than what would be extrapolated from the numbers of NFT-bearing neurons present (Gomez-Isla et al., 1997). Thus, the initial steps of NFT formation begin, and some surviving neurons may exhibit NFTs in the cytoplasm, whereas the rest of the neurons are dead before forming complete, mature NFTs.
The discovery of frontotemporal dementia parkinsonism (FTDP)-17, which results from mutations of the tau gene, provides a striking example of a mechanism of neuronal death caused by tau dysfunction. In FTDP, tau mutations cause both neuronal death and NFTs (Clark et al., 1998;Goedert, 1998; Hutton et al., 1998; Poorkaj et al., 1998; Spillantini et al., 1998; D'Souza et al., 1999; Iijima et al., 1999). All exonic mutations are localized to the microtubule (MT)-binding domain and its proximal region, and these mutant tau proteins lose the ability of MT assembly-promoting activity compared with wild-type tau (Hong et al., 1998). This deficit may lead to neuronal death and NFT formation.
The production of transgenic (Tg) mice expressing mutant tau has been reported (Lewis et al., 2000; Gotz et al., 2001). One example involves the P301L mutation, which results in an especially deleterious defect in MT assembly-promoting activity (Yen, 1999; Barghorn et al., 2000). Tg mice expressing the P301L mutation exhibit NFTs and neuronal loss in the anterior horn of the spinal cord (Lewis et al., 2000). The actual mechanism of neuron death through mutant tau expression, however, remains unsettled because the mutant tau in this P301L mutant may be so strong that neurons quickly degenerate and die. These limitations of this mutant prompted us to investigate Tg mice expressing another, less potent mutant tau, V337M. The V337M mutation of tau is relatively weaker than the P301L mutation with respect to defects affecting MT assembly-promoting activity. Our Tg mice showed degenerating neurons in the hippocampal region. These neurons contained phosphorylated and ubiquitinated tau aggregations with a β-sheet structure, as was also reported for the P301L Tg mice (Lewis et al., 2000; Gotz et al., 2001). In this study, we investigated the mechanism and effects of neuronal degeneration in Tg mice expressing V337M mutant tau.
MATERIALS AND METHODS
Generation of Tg mice expressing V337M human tau.cDNA construct of the V337M human longest tau with myc and FLAG epitope tags at the N- and C-terminal ends was generated by PCR-based site-directed mutagenesis. This cDNA was inserted into the PDGF-β chain expression vector at the XhoI and NotI sites. A 4.3 kb BglII fragment and NaeI fragment containing the PDGF-β promoter, V337M human longest tau cDNA, and a 3′ untranslated sequence were used as the transgene to create the mutant tau Tg mice on a B6SJL background. Microinjection of the transgene and generation of Tg mice were performed at DNX Transgenic Sciences (Cranbury, NJ).
Western blot analysis of tau expression in Tg mice. To estimate tau expression and solubility in different buffers, brains of Tg mice and non-Tg littermates were carefully extracted after killing with anesthesia. Each brain was carefully parted midsagittally. The right hemisphere was used for immunohistochemistry (see below), and the hippocampus dissected from the left hemisphere was used for Western blot analysis. Tissue was homogenized in 400 μl of reassembly buffer (RAB) (0.1 m2(N-morpholino)ethane sulfonic acid, 1 mm EGTA, 0.5 mmMgSO4, 0.75 m NaCl, 0.02m NaF, 1 mmphenylmethylsulfonyl fluoride, and protease inhibitor cocktail, pH 7.0) and centrifuged at 50,000 × g for 40 min at 4°C in an Optima TL ultracentrifuge (Beckman Instruments, Fullerton, CA). The pellet was rehomogenized with 1 m sucrose–RAB and centrifuged at 50,000 × g for 20 min at 4°C. The resulting pellet was extracted with 400 μl of radioimmunoprecipitation buffer (RIPA) buffer (50 mm Tris, 150 mm NaCl, 1% NP-40, 5 mm EDTA, 0.5% sodium deoxycholate, and 0.1% SDS, pH 8.0) and centrifuged at 100,000 × g for 20 min at 4°C. The RIPA-insoluble pellet was solubilized in 70% formic acid (FA) and reconstituted in 50 μl Laemmli SDS-PAGE sample buffer after lyophilization. The protein concentration of each fraction was determined using Coomassie brilliant blue dye (Nacalai Tesque, North Kyoto, Japan). The separated protein was blotted onto Immobilon-P membrane (Millipore, Molsheim, France). After blocking the membrane with a solution of 10% skimmed milk and 0.1% Tween 20 in PBS, the membrane was incubated with anti-tau antibody JM (1:10,000) or phosphorylated dependent anti-tau antibody PS396 (1:400) diluted in a solution of 5% skimmed milk, 0.05% Tween 20, and PBS. The membranes were then incubated in a secondary antibody solution containing polyclonal HRP-conjugated anti-rabbit IgG antibody. Chemiluminescent detection (ECL; Amersham Biosciences, Arlington Heights, IL) was used for visualization.
Quantitation and visual analysis of immunoreactivity were performed with a computer-linked LAS-1000 Bio-Imaging Analyzer System (Fujifilm, Tokyo, Japan) using the software program Image Gauge 3.0 (Fujifilm).
Antibodies. The following antibodies were used: mouse monoclonal anti-myc (clone 9E10; Babco, Richmond, CA), rabbit polyclonal anti-myc (MBL), phosphorylation-independent rabbit polyclonal anti-tau JM (Takashima et al., 1998), rabbit polyclonal anti-ubiquitin (Dako, Carpinteria, CA), and phosphorylation-dependent mouse monoclonal anti-tau AT8 (Biernat et al., 1992), which recognizes phosphorylated tau at Ser202 and Ser205. Phosphorylation-dependent rabbit polyclonal anti-tau antibodies PS199 and PS396 (Michel et al., 1998), which recognize phosphorylation of tau at Ser199 or Ser396, were also used (generously donated by K. Ishiguro, Mitsubishi Kasei, Institute of Life Science, Tokyo, Japan). Mouse monoclonal anti-tau antibody Alz50 (Wolozin et al., 1986), which recognizes the conformational epitope found in paired helical filaments, was also used (generously donated by P. Davies, Albert Einstein College of Medicine, Bronx, NY).
Immunocytochemical and histochemical studies. Brains were immersion-fixed with 10% buffered formalin, and paraffin-embedded sections (2–10 μm) were prepared for either light or confocal microscopic analyses. Deparaffinized sections were treated in either 0.1% Triton X-100 in PBS for 20 min or Target Retrieval Solution (Dako). Anti-myc, JM, PS199, AT8, and Alz50 were used as primary antibodies. Incubation in primary antibody solution occurred overnight at 4°C. Sections (2 μm) intended for light microscopic observations were incubated with mouse monoclonal anti-myc antibody as the primary antibody and HRP-conjugated goat anti-mouse IgG antibody as the secondary antibody. Visualization of immunoreactive elements was accomplished with a peroxidase stain DAB kit (Nacalai Tesque).
Sections intended for confocal laser microscopy were first incubated with either anti-myc, JM, PS199, AT8, or Alz50 antibodies and then incubated with either Alexa488/568-conjugated anti-mouse IgG or Alexa488/568-conjugated anti-rabbit IgG. Subsequent nuclear counterstaining with propidium iodide (PI), a nucleic acid-specific stain, was performed after treatment with RNase. Sections were then examined with a Radiance 2000 KR3 confocal microscope (Bio-Rad). Some sections were reacted in 0.05% thioflavin-Sfor 5 min and similarly examined. For the double-labeling experiments several of these sections were subsequently stained with Congo Red after confocal microscopic analysis. These double-stained sections were then examined with a light-microscope using crossed polarizing filters (Olympus Optical, Tokyo, Japan).
Methyl green-pyronin staining was performed according to the method ofHayer et al. (1986). Sections prepared with these stains were examined under the light microscope.
Ultrastructural studies. Tg mice were deeply anesthetized with pentobarbital (5 mg/100 gm body weight, i.p.), and then intracardially perfused with 25 ml of Ringer's solution followed by a fixative of 4% paraformaldehyde and 0.25% glutaraldehyde in 0.1m phosphate buffer. After several PBS washes, brain slices (300 μm) were prepared with a microslicer. Slices intended for ultrastructural study were post-fixed in 1% osmium tetroxide, dehydrated in a graded series of ethanols, infiltrated with propylene oxide, and then embedded in Araldite. Ultrathin sections were cut with an ultramicrotome, stained with uranyl acetate and lead citrate, and examined with a LEO912AB transmission electron microscope (Carl Zeiss, Oberkochen, Germany) at 100 kV.
Optical recording of neural activity. Hippocampal slices (400-μm-thick) prepared from adult mice (age 15 months) were collected and kept in oxygenated artificial CSF (aCSF; in mm: 124 NaCl, 2.5 KCl, 2 CaCl2, 1.25 MgSO4, 1.25 NaH2PO4, 26 NaHCO3, and 10 glucose, pH 7.4) equilibrated with 95% O2 and 5% CO2 gas. Slices were subsequently incubated in a solution containing the voltage-sensitive dye (VSD) Di-4-ANEPPS (0.2 mm) (D-1199; Molecular Probes, Eugene, OR) (Loew et al., 1992) and 2.7% ethanol, 0.13% Cremophor EL (Sigma, St. Louis, MO), 50% fetal bovine serum (Sigma), and 50% aCSF for 25 min. The slices were then transferred to an immersion-type recording chamber. The slices were monitored with an epifluorescence optical system mounted above the slice chamber. The epifluorescent optics of this system consisted of two principal lenses, an f = 50 mm F/1.4 Nikon objective and a 1.0× Leica projection lens, a dichroic mirror (575 nm), and absorption (530 nm) and excitation (590 nm) filters. A high-speed digital CCD camera (MiCAM01; BrainVision Inc., Tsukuba, Japan) for acquiring fluorescent signals was attached to the microscope and was to linked to a personal computer (PC).
A microcapillary stimulating electrode (∼1 MΩ) filled with aCSF was placed in the middle of stratum radiatum at the border between area CA1 and CA2 to optimally stimulate (<0.05 Hz, 400 μsec) the Schaffer collateral–commissural pathways. In addition to optical recording of CA1 evoked neural activity, field potentials were also monitored through a glass microcapillary recording electrode (∼1 MΩ) filled with aCSF positioned in the middle of stratum radiatum of CA1. Before taking optical measurements, the stimulus intensity was adjusted to elicit a just supramaximal field potential; stimulation intensity ranged between 200 and 250 μA. Optical recording commenced after obtaining a stable baseline response that persisted for at least 10 min. The average of 16–32 responses (i.e., changes in VSD fluorescence caused by membrane potential change) was collected as an optical signal and was subjected to off-line analysis. The optical recording system was controlled by a PC-compatible computer, and the electrophysiological recording system was controlled by a Macintosh. Off-line analysis of optical signals was performed with a laboratory-developed Macro set on the IgorPro analysis system (WaveMetrics Inc., Lake Oswego, OR). More details of the optical and electrophysiological recording technique can be found in another publication (Tominaga et al., 2000).
Behavioral tests. The elevated plus maze was set at a height of 65 cm and consisted of four gray Plexiglas arms, each 8-cm-wide × 25-cm-long with 15-cm-high walls. Two arms were open, and two were enclosed. Individual mice were placed in the center of the maze, and the total distance and time spent on each arm were measured by computer and analyzed with the public domain NIH Image program (developed at the United States National Institutes of Health and available on the Internet at http://rsb.info.nih.gov/nih-image). The test was repeated for 3 d, and the data were analyzed by ANOVA (Student'st tests).
The apparatus for the open field test consisted of a white, 50-cm-wide × 50-cm-long × 50-cm-high acrylamide box, with an open top. Individual mice were placed in the center of the box, and the total distance of each period was measured and analyzed by computer with the program described above.
The water maze apparatus consisted of a circular pool (1.2 m in diameter and 0.47-m-high) made of white plastic. The pool was filled to the depth of 20 cm with water (24–25°C). An escape platform, 10 cm in diameter, made of clear plastic was submerged 0.5 cm under the water level. During the probe trials, the platform was removed from the pool. The position of a mouse in the pool was recorded by a video camera suspended 2.5 m above the center of the pool. The video camera was linked to a computer. All data were measured and analyzed by computer with the program described above.
RESULTS
Identification of neurons that accumulate phosphorylated tau in V337M Tg mice
The expression of V337M human tau was mediated by the PDGF promoter and detected immunocytochemcially using an antibody for the myc epitope tag linked to the N terminus of the V337M human tau cDNA (Fig. 1a). The expression of V337M human tau was observed in the cell bodies and proximal dendrites of hippocampal CA1, CA2, and CA3 neurons of 11-month-old Tg mice. These same cellular elements were also immunoreactive for phosphorylated tau as visualized by PS199 (Fig. 1b) and AT8 (Fig.1c), and immunoreactive for paired helical filament-associated tau (PHF-tau) as visualized by Alz50 (Fig.1d). Hippocampal neurons of non-Tg littermates did not exhibit these immunoreactivities (Fig. 1e–h).
Fig. 1.
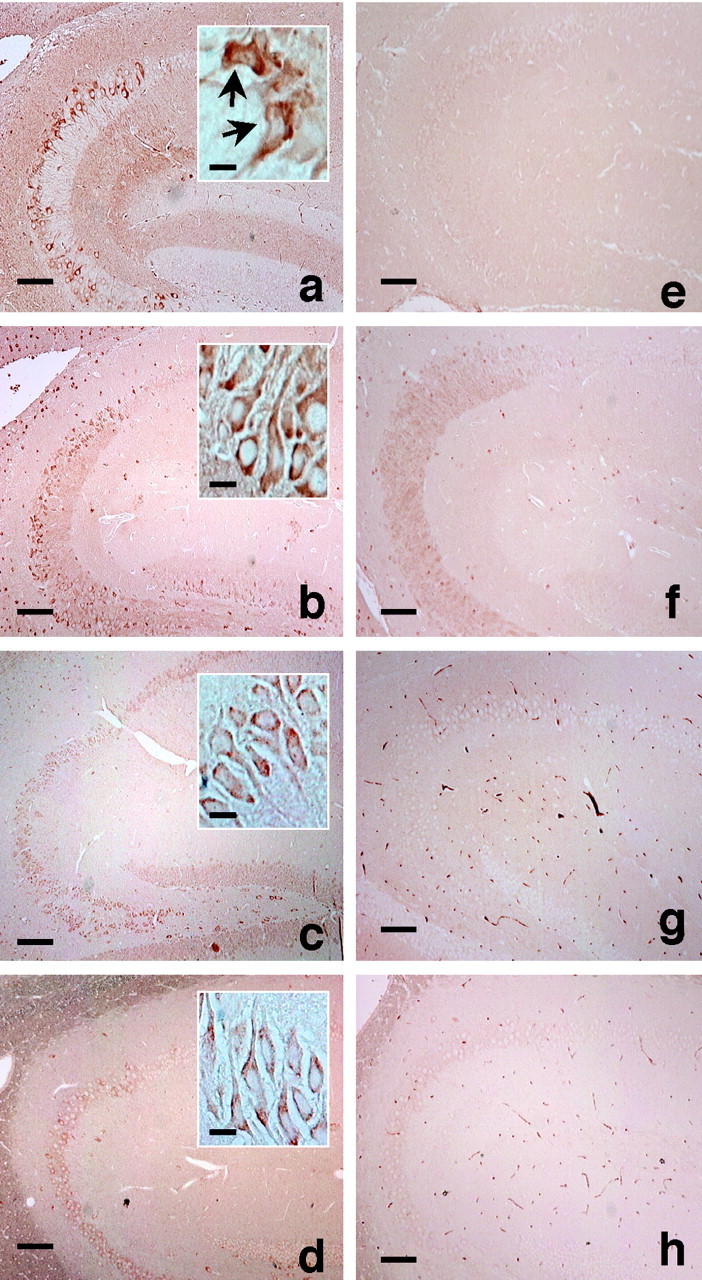
Location and distribution of mutant human (V337M) and phosphorylated tau-containing hippocampal neurons of 14-month-old Tg mice and non-Tg littermates. a, e,Photomicrographs of anti-myc immunostained sections of hippocampus showing mutant tau-containing cells in Tg mice (a), and non-Tg littermates (e). Arrows ininset show irregularly shaped neurons. b,f, Photomicrographs of phosphorylation-dependent anti-tau PS199-immunostained sections of hippocampus showing mutant tau-containing cells in Tg mice (b), and non-Tg littermates (f). c,g, Photomicrographs of phosphorylation-dependent anti-tau AT8-immunostained sections of hippocampus showing mutant tau-containing cells in Tg mice (c), and non-Tg littermates (g). d,h, Photomicrographs of Alz50-immunostained sections of hippocampus showing mutant tau-containing cells in Tg mice (d), and non-Tg littermates (h). The Alz50 antibody specifically recognizes conformational changes exhibited by PHF-tau. a–d, Insets, Hippocampal neurons from the Tg mice displayed myc, PS199, AT8, and Alz50 immunoreactivity, but such immunoreactivity was not observed in neurons from non-Tg littermates. Immunoreactivity was visualized with HRP. Anti-myc, PS199, and AT8 antibodies recognized both normal and irregularly shaped neurons, but Alz50 only recognized irregularly shaped neurons. Higher magnification of image is shown ininset. Scale bars: 100 μm; insets, 10 μm.
Anti-myc-immunoreactive neurons were divided into two categories on the basis of shape and then designated as either normal or irregular (Fig.1a, inset, arrow). Whereas both types of neurons displayed AT8 and PS199 immunoreactivity, only the irregularly shaped neurons displayed Alz50 immunoreactivity. Double immunostaining experiments revealed that both PS199-immunoreactive (Fig.2a–c) and Alz50-immunoreactive (Fig. 2d–f) neurons were positively stained by the anti-myc antibody. The same sample did not show any positive immunostainings without primary antibody (Fig.2g,h). Thus, this observation indicates that some of the V337M human tau-expressing neurons, specifically those located in the hippocampus and having irregular shape, acquired the PHF-tau epitopes, including Alz50. The neurons bearing these characters appeared in aged Tg mice (>11-month-old) but not in younger mice.
Fig. 2.
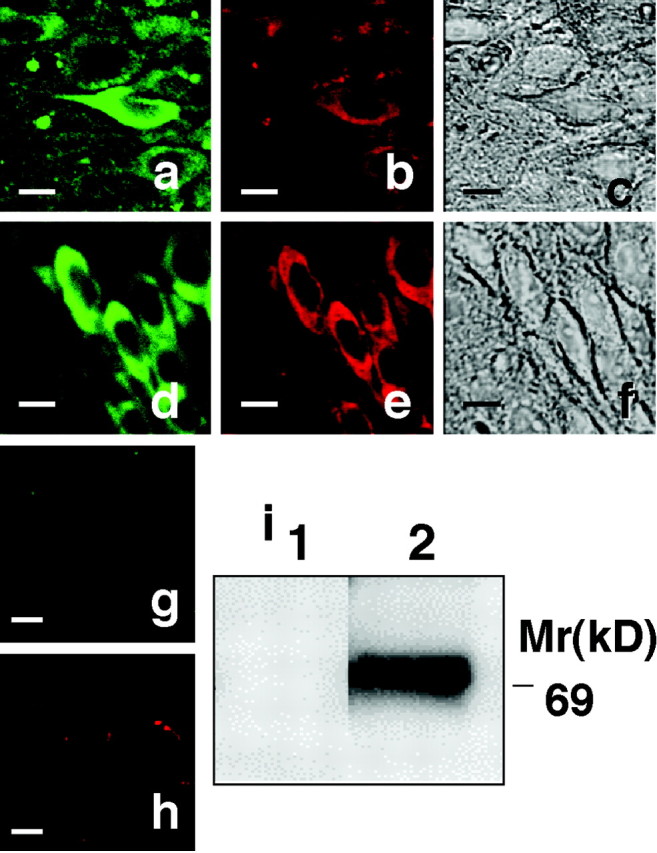
Double-immunostaining of hippocampal section from Tg mice with anti-myc and either PS199 or Alz50. a,d, Images of anti-myc-immunostained cells (green). b, Image of phosphorylation-dependent anti-tau PS199-immunostained cells (red). c, Phase-contrast photomicrograph of the myc–PS199 double-immunostained cells shown in aand b. e, Image of Alz50-immunostained cells (red). f, Phase-contrast photomicrograph of the myc–Alz50 double-immunostained cells shown ind and e. g,h, Images of hippocampal immunostaining without primary antibody. g, Alexa 488-conjugated anti-mouse IgG staining. h, Alexa 568-conjugated anti-rabbit IgG staining. i, Western blot confirming the expression of mutant human tau in the brains of Tg214 mice (14-month-old). Separated proteins were blotted and immunostained with anti-myc antibody, which specifically recognized the mutant human tau (V337M) at 70 kDa. Scale bars, 10 μm.
Accumulation of SDS-insoluble tau in the hippocampus of Tg mice
Additional biochemical analyses were performed to determine whether SDS-insoluble tau was present in the hippocampus of Tg mice. Hippocampi taken from Tg mice and non-Tg littermates were homogenized and extracted sequentially in RAB, RIPA buffer containing 1% SDS, and 70% FA. Western blotting of samples from the Tg mice revealed a 70 kDa, tau-immunoreactive band, thereby confirming the expression of V337M mutant human tau in the brains of these Tg mice (Fig.2i). In whole-brain lysates, the expression of V337M mutant human tau was approximately <10% of the expression of endogenous mouse tau. In the hippocampal region, on the other hand, the expression of mutant tau was 70% of the expression of endogenous mouse tau. The expression levels of mutant human tau remained the same in 4- to 15-month-old mice. In samples from Tg (lane 1) and non-Tg littermates (lane 2), equal amounts of endogenous mouse tau were recovered in extracts collected in the RAB and RIPA fractions (Fig. 3a,b). However, in the FA fraction containing SDS-insoluble materials, a greater amount of both endogenous mouse and mutant human tau was recovered from the Tg mice, as compared with non-Tg littermates (Fig. 3c). The extent of tau phosphorylation was determined through Western blots and the phosphorylation-dependent anti-tau antibody, PS396. In both RAB and RIPA fractions, the phosphorylation of tau in Tg mice showed an increase as compared with that in non-Tg mice (Fig. 3d,e). Tau in the FA fraction from Tg mice brains was immunoreactive for phosphorylation-dependent anti-tau antibody (Fig.3f), thus indicating that tau present in the hippocampus of these mice was phosphorylated and that the phosphorylated tau accumulated in the SDS-insoluble fraction (i.e., FA fraction).
Fig. 3.
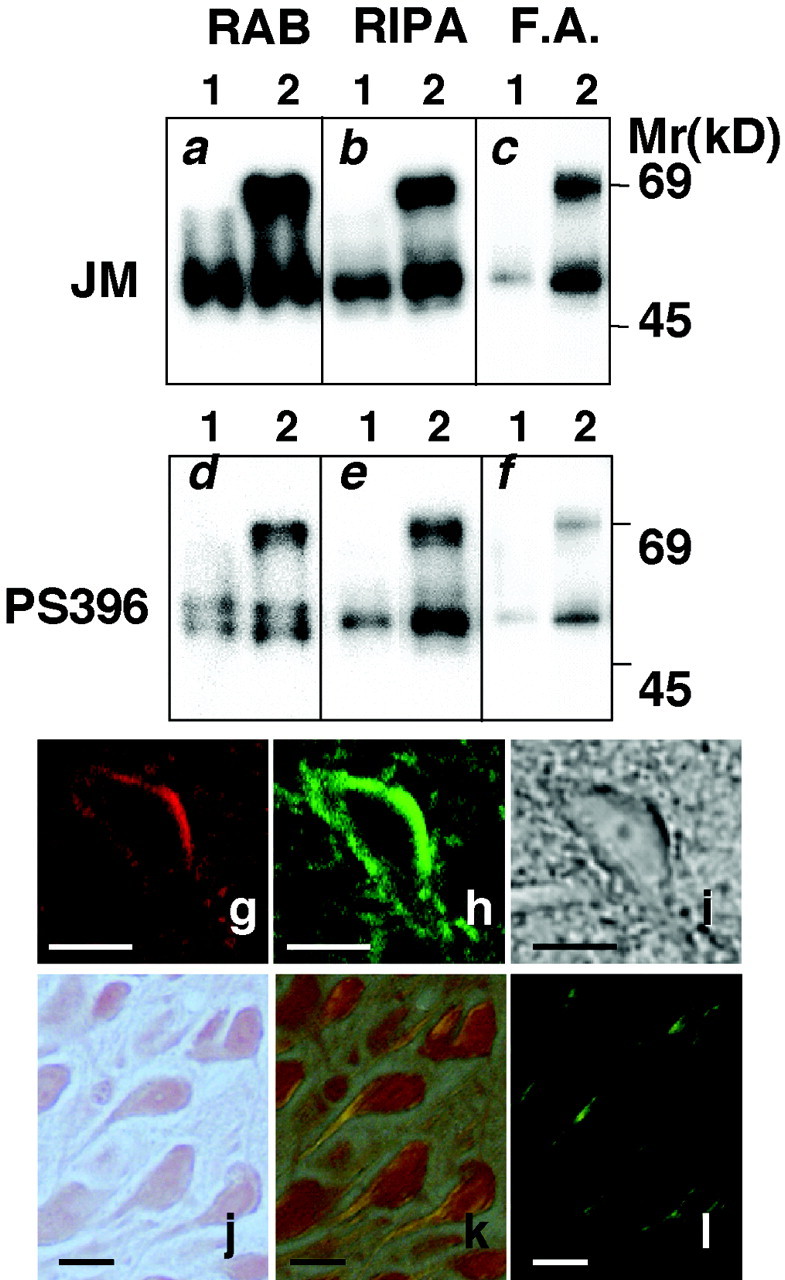
Biochemical analysis of tau from the hippocampus of Tg214 mice. Hippocampi from non-Tg littermates (lane 1), and Tg214 (lane 2) were used for analysis. The same amount of protein (20 μg/4 μl) collected in the RAB and RIPA fractions was pipetted into each well, and the same volume (4 μl) of samples collected in the FA fraction was used. Separated proteins were transferred to a membrane, incubated with either anti-tau antibody JM or phosphorylation-dependent anti-tau antibody PS396 as the primary antibody, and visualized by ECL. a,d, RAB fraction. b, e,RIPA fraction. c, f, FA fraction.g–l, Histological characterization of irregularly shaped neurons using Congo Red staining and double staining with Alz50 and thioflavin-S. g, Image of an Alz50-immunostained neuron. h, Image of the same neuron stained with thioflavin-S. i, Phase-contrast photomicrograph of the Alz50–thioflavin-S-stained neuron shown ing and h. j–l, Light photomicrographs of Congo Red-stained sections. Photomicrographs shown in j were photographed without a polarizing filter. Photomicrographs shown in k and l were photographed with a polarizing filter set at different angles. The irregularly shaped neurons showed Congo Red birefringent fibrils that appear orange (k) and apple green (l) in color. Scale bars, 10 μm.
Characterization of the irregularly shaped neurons
The irregularly shaped category of neurons bearing PHF epitopes were easily differentiable from healthy neurons (Figs. 1, 2). When examined with phase-contrast microscopy, healthy neurons were larger and flat in appearance. In contrast, irregularly shaped neurons were smaller and convex in appearance. These latter neurons also stained positively for thioflavin-S (Fig. 3g–i) and exhibited Congo Red birefringence (Fig. 3j–l). The histological features of these irregularly shaped neurons resemble those of NFT-bearing neurons that are commonly observed in human neurodegenerative diseases.
The irregularly shaped neurons in these Tg mice exhibited other histopathological features of human degenerating neurons in AD (Fig.4). The cytoplasm of irregularly shaped neurons was stained with the nucleic acid counterstain PI. Because PI stains both DNA and RNA, this cytoplasmic staining may be attributable to the leakage of DNA from the nucleus or to the accumulation of RNA. RNase treatment diminished cytoplasmic PI staining (Fig.4a,b), thereby confirming that RNA accumulation did indeed contribute, at least in part, to cytoplasmic PI staining. Overlapping of PI- and thioflavin-S-staining in the same neurons (Fig.4c) shows that RNA accumulates in the thioflavin-S-stained cells. This observation is consistent with the finding that RNA-accumulating neurons in CA1, CA2, and CA3 of the hippocampus also expressed mutant human tau (Fig.4e,f).
Fig. 4.
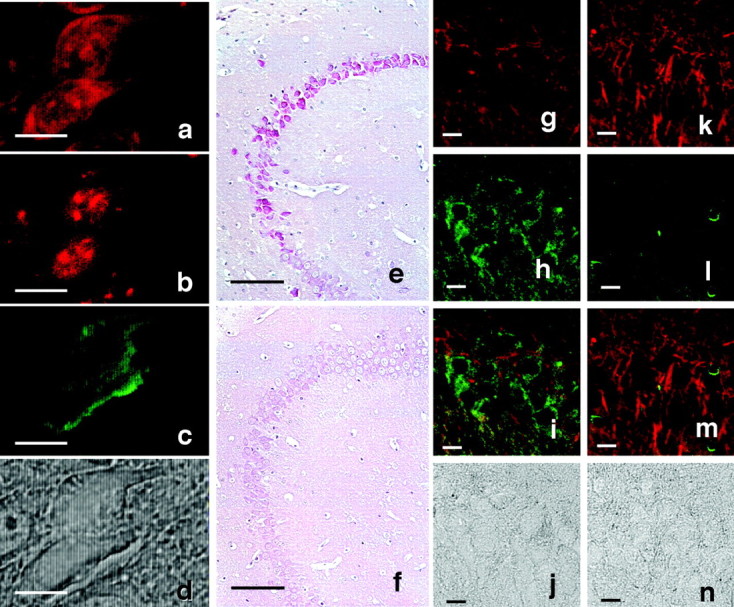
RNA accumulation and lack of microtubules in irregularly shaped neurons. a–d, Image of a thioflavin-S–PI-labeled neuron from the hippocampus of a 10-month-old Tg214 mouse. a, b, PI labeling (red); c, thioflavin-S (green); PI staining without RNase pretreatment (a) and with RNase pretreatment (b). In b andc note that in the same sections shown ina pretreated with RNase, PI stained only nuclei, and only thioflavin-S staining was observed in the cytoplasm.e, f, RNA accumulation in hippocampal neurons of 11-month-old Tg mice and non-Tg littermates. Methyl green–pyronin staining was performed using brain sections from Tg214 mice (e), and non-Tg littermates (f). RNA accumulation was detected in Tg214 neurons located in identical locations where Congo Red birefringent neurons were observed. g–n, Lack of microtubules in irregularly shaped neurons. g–j, Tg214 mouse (11 month). k–n, Non-Tg littermate (11 month).g, k, Image of anti-α tubulin-immunostained neurons (red). h,l, Image of phosphorylation-dependent anti-tau PS199-immunostained neurons (green).i, m, Merged image of gand h showing a nonoverlap of phosphorylation-dependent tau immunoreactivity (green) with α tubulin immunoreactivity (red). j,n, Phase-contrast photomicrograph of the same area shown in g–i and k–m. Irregularly shaped neurons lose tubulin immunoreactivity, but retain phosphorylated tau immunoreactivity. Scale bars: a–d, 10 μm;e, f, 100 μm; g–n, 10 μm.
Cytoplasmic PI staining (i.e., RNA accumulation) is present in the irregularly shaped neurons that also exhibited histological features characteristic of NFT-bearing neurons. Thus, it is clear that RNA accumulation is a marker characteristically found in these phosphorylated tau accumulating neurons. The finding that RNA accumulation is also found in the irregularly shaped neurons, which also exhibited all the histological criteria of NFT-bearing neurons, is consistent with previous studies from AD brains (Ginsberg et al., 1997). Moreover, the irregularly shaped neurons displayed phosphorylated tau immunoreactivity but lacked α-tubulin immunoreactivity (Fig. 4g–j), although the same region of non-Tg showed the clear immunoreactivity for α-tubulin (Fig.4k–n). This suggests that normal microtubules were absent in these irregularly shaped neurons of Tg mice. Thus, the irregularly shaped neuron might lose neuronal function through the loss of microtubules, leading to neuron death. None of these features were observed in non-Tg littermates.
Ultrastructural analysis of phosphorylated tau-immunoreactive neurons
At the light microscopic level, irregularly shaped neurons displayed characteristics of NFT-bearing neurons commonly found in human neurodegenerative disease: PHF-tau immunoreactivity, Congo Red birefringence, and RNA accumulation. To analyze these neurons in more detail, ultrathin sections were prepared and examined with the electron microscope. Toluidine blue, which delineates both nucleoli and proximal dendrites, strongly stained atrophied neurons located in a similar area as the irregularly shaped neurons (Fig.5a). These neurons exhibited nuclear and cytoplasmic condensation and were electron-dense (Fig.5b). Ribosomes were condensed and packed, and lipofuscin was frequently observed within the cytoplasm (Fig. 5c). Mitochondria appeared to be intact, but the Golgi network appeared swollen before exhibiting condensation in the final stages of cell death (Fig. 5e). Plasma and nuclear membranes were ruffled (Fig. 5b,e). The cytoplasm of irregularly shaped cells contained straight fibrils (Fig. 5d,f). Higher magnification (Fig. 5f) of these straight fibrils revealed the same structure and diameter (15 nm) as the straight fibrils associated with the NFTs of human neurodegenerative diseases. Thus, irregularly shaped neurons from V337M Tg mice appear to undergo cell death after the accumulation of phosphorylated tau and RNA. However, the characteristic signs of apoptotic cell death were never observed. Fragmentation and blebbing of both the nucleus and cytoplasm, morphological criteria of apoptosis, were not present. TUNEL staining was not significantly different between Tg mice and non-Tg littermates (data not shown).
Fig. 5.
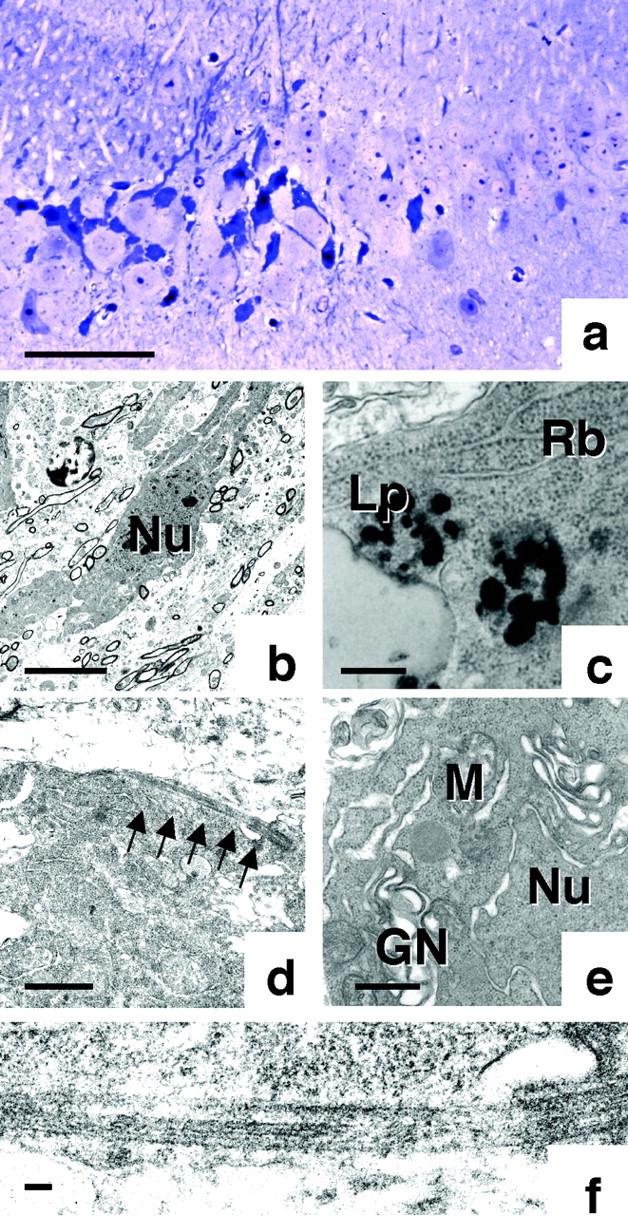
Ultrastructural analysis of irregularly shaped neurons. a, Light photomicrograph of a toluidine blue-stained ultrathin section from the hippocampus of a Tg mouse, showing irregularly shaped neurons. b, Low-power electron photomicrograph of hippocampal neurons from a Tg214 mouse, showing an example in the center of dark cell degeneration.c, Examination of this electron-dense cell at a higher magnification clearly shows the accumulation of ribosomes (Rb) and lipofuscin (Lp).d, The presence of bundles of straight tubules in the cytoplasm of this neuron is also evident at higher magnifications. Further examination of these tubules at a higher magnification (f) confirms that the diameter of these bundles is ∼15 nm. e, Higher magnification reveals the swelling of Golgi network (GN) and the ruffling of nuclear (Nu) membrane. Scale bars: a, 60 μm; b, 5 μm; c, 350 nm;d, 1 μm; e, 160 nm; f, 100 nm.
Analysis of neural activity in the hippocampus of V337M Tg mice
To test whether the morphological deficiency of hippocampus in V337M Tg mouse affects hippocampal function, we examined neural activity in hippocampal slices prepared from Tg mice and non-Tg littermates (15-month-old). We used the VSD Di-4-ANEPPS combined with optical recording of evoked activity because this method allowed us to assess the function of many cells simultaneously and measure how it evolved over time. The overall optical recording area covered 1.3 × 2 mm (i.e., field of view of the CCD camera), and the spatial resolution within this analysis area was 20 μm2 (i.e., area of an individual pixel). This method has recently been shown to have comparable reliability with conventional electrophysiological methods (Tominaga et al., 2000).
Representative propagation patterns of neural activity evoked by a stimulus delivered to the Schaffer collateral–commissural pathway (Stim, inset) are shown in Figure 8A. In a normal slice from a non-Tg littermate control (Fig.6Aa), the depolarizing response started at the tip of the stimulating electrode and propagated distally along the Schaffer collateral pathway, transmitting depolarization toward both the stratum pyramidale and stratum lacunosum-moleculare of CA1. Although the spatial pattern of neural activity toward and through CA1 of a V337M Tg mouse (Fig.6Ab) was similar to that of the control mouse, the response was distinctly weaker, producing less voltage spread and amplitude. A more detailed analysis of a subset of representative pixel values acquired through stratum pyramidale (pyr) and stratum radiatum (rad) of CA1 (Fig. 6B) confirmed this attenuated response and additionally revealed that, in contrast, the time course of the depolarizing response was very similar between non-Tg littermates (a) and Tg mice (b). These results suggest that there is an attenuation of the amplitude of evoked hippocampal depolarization in V337M Tg mice compared with non-Tg littermates, but that the response develops similarly over time.
Fig. 6.

Decreased hippocampal neural activity in V337M Tg mice (15-months-old). Control mice were non-Tg littermates. Evoked CA1 field potentials were recorded optically in both spatial and time domains using the fluorescent, voltage-sensitive dye Di-4-ANEPPS inin vitro hippocampal slices. Changes in evoked field voltage were calculated as the fractional change over baseline fluorescence and were pseudocolored for display. Redrepresents greater voltage, and progressively more greenrepresents lower voltages in the optical signal (0.7 msec/frame). Gray box superimposed over schematic of hippocampal slice represents area over which fluorescent voltage signals were measured at each of the time points. The image acquired by the CCD camera covered the proximodistal axis from CA3 to distal CA1 and transversely across all lamina of CA1 [stratum oriens-alveus (SO-A), stratum pyramidale (SP), stratum radiatum (SR), and stratum lacunosum-moleculare (SL-M)] to the dentate gyrus. A,Propagation of neural activity in CA1 from control (a) and V337M Tg mice (b) at specified times (1.4–6 sec) after electrical stimulation of the Schaffer collaterals at the CA1–CA2 border. B,Representative traces of optical signals obtained from a subset of pixels through mid proximodistal stratum pyramidal (pyr) and stratum radiatum (rad) of CA1 from the control (a) and the V337M Tg (b) mice. C, Three-dimensional graphs of evoked peak fluorescent values at each pixel in the field of view of the CCD camera in the control (a) and the V337M Tg (b) mice. D, Bar graphs summarize the maximum value of each peak (a) and the number of pixels that exhibited a response greater than an arbitrary threshold level (0.5 × 10⁻³) (b) of peak values of the responses in the view. The measurements were obtained from slices of two control mice (slices = 8) and a V337M Tg mouse (slices = 3). Theasterisk in b indicates significant difference assessed at p ≤ 0.05 by one-way ANOVA and Dunett's test. Error bars indicate SEM.
We next examined the amplitude of the response by plotting the peak value of the optical signal measured at each pixel over the entire analysis area (i.e., CCD camera field of view, represented asgray box in Fig. 6A, inset). As is clear in the three-dimensional graph in Figure 6C, the amplitude of the peak voltage response in the control (a) mouse was greater than that of the Tg mouse (b). It is also notable that the profile slope of the peak response was steeper in hippocampal slices from non-Tg littermates than that from Tg mice.
We also quantified the observed decrease in amplitude in terms of the maximum amplitude of the overall response (Fig. 6Da) and in terms of the area (i.e., numbers of pixels) over which an appreciable suprathreshold response occurred (Fig.6Db). This latter measure might be thought of as the number of hippocampal neurons that contributed to the response. As is clear in Figure 6D, both measures of the V337M Tg mouse were considerably smaller than those of non-Tg littermates. Taken together with the morphological results, these results suggest that the attenuation of the Schaffer collateral-evoked neural response in hippocampal slices of V337M Tg mice is attributable to the decrease in number of the functional neurons in the circuit.
Behavioral abnormalities of Tg mice
Because 30–70% of the neurons in the hippocampus of Tg mice were irregularly shaped (Table 1) and because the neural responses recorded from hippocampal slices from Tg mice were diminished significantly, presumably because of a reduced number of functional neurons, it was of interest to test our Tg mice on standard rodent behavioral tests. Eleven-month-old Tg214 (line 214 of V337M mutant) mice and non-Tg littermates were tested on an elevated plus maze. The time spent in the open arms and extent of locomotor activity were significantly different in the Tg214 mice and non-Tg littermates (Fig. 7a,b). After 2 min into the testing period, the overall spontaneous locomotion measures were considerably lower for non-Tg littermates compared with Tg214 mice (Fig. 7a). Non-Tg littermates appeared to recognize their location and tended to remain within the closed arm of the maze, whereas Tg214 mice appeared to forget their location and tended to move about within both the closed and open arms of the maze (Fig.7b,c). Spontaneous locomotion of the Tg214 mice remained high throughout the testing period (Fig. 7a–c). Tg mice also showed elevated spontaneous locomotion in the open field test. Tg214 mice covered more distance in the second half of the test period compared with the first half, whereas non-Tg littermates displayed the opposite phenomenon. During the second half, Tg214 mice traveled 110 ± 22% of the distance traveled during the first half. The comparable value for non-Tg littermates was 65 ± 10% (i.e., a reduction in activity in the second half). However, there was no significant difference in a Morris water maze test (data not shown), suggesting that Tg mice retain the ability of spatial recognition. During both an open field test and the plus maze test Tg214 mice defecated and urinated excessively during the testing period compared with non-Tg littermates. Taken together, these results suggest that the mutant tau Tg mice display behavioral abnormalities that are concurrent with hippocampal neurodegeneration.
Table 1.
Quantitation of Congo Red birefringent neurons in Tg mice
| CA1 | CA2 | CA3 | |
|---|---|---|---|
| Tg214 (11 month) | 22.5 ± 18.7% | 77.0 ± 5.0% | 37.5 ± 9.1% |
| Non-Tg littermate (11 month) | ND | ND | ND |
Percentage of total neurons in hippocampal subregions that were Congo Red-positive. Total number of neurons and Congo Red birefringent neurons were counted in each region under light microscopy with or without polarizing filter. Counting was performed using three different mice, and data were expressed as mean ± SD. ND, None detected.
Fig. 7.
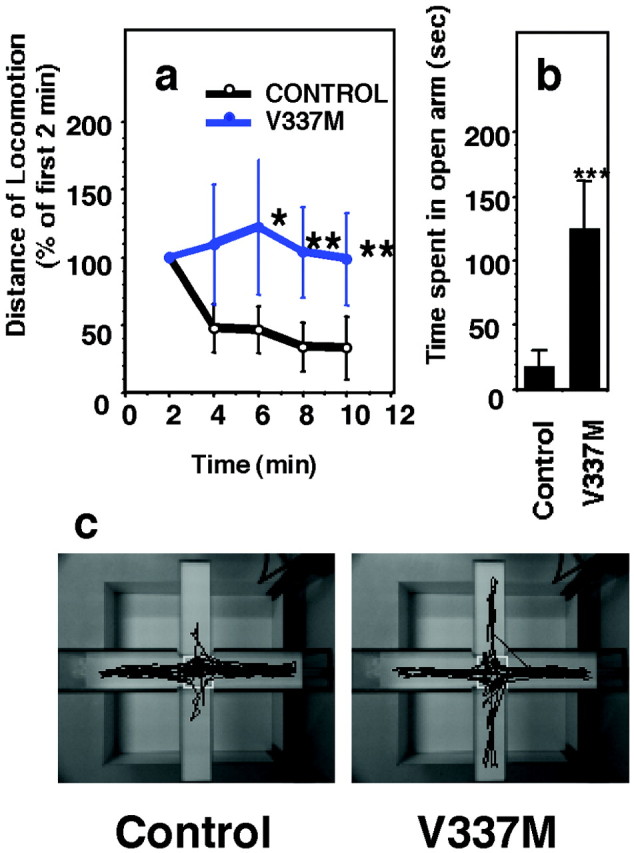
Elevated plus maze performance. a, Tg mice lacked maze habituation (open circle, non-Tg littermate; closed circle, Tg mice; *p < 0.01; **p < 0.005). Locomotion distances were normalized by the distance traveled during the first 2 min and were expressed as the percentage of average distance traveled ± SEM (n = 9).b, Time spent by Tg mice (V337M) and non-Tg littermates in the open arm was measured for the 10 min test period. Data were expressed as the average time spent ± SEM (n= 6) during the second and third test days (***p < 0.001). c, Locomotion traces of non-Tg littermate (Control) and representative Tg mouse (V337M) on the elevated plus maze on the second day.
DISCUSSION
NFTs are the neuropathological hallmarks of neurological disorders, including AD, Down's syndrome, and several other tauopathies (Spillantini and Goedert, 1998). Individuals carrying the FTDP-17 tau gene mutation that results in NFT formation invariably develop neurological disorder (Clark et al., 1998; Hutton et al., 1998;Poorkaj et al., 1998; Spillantini et al., 1998; Spillantini and Goedert, 1998). The discovery of the tau gene mutation in FTDP-17 kindreds, therefore, sheds light on understanding the mechanism or mechanisms that underlie pathogenesis in NFT-associated neurodegenerative diseases. As described in the present report, Tg mice expressing mutant tau V337M derived from FTDP-17 exhibit neuronal degeneration accompanied by the accumulation of phosphorylated tau, reduction of neural activity in the hippocampus, and behavioral abnormalities.
Specific morphological features of degenerative neurons in Tg mice
Degenerative neurons (i.e., irregularly shaped neurons) from the brains of Tg mice were characterized by atrophy of both nucleus and cytoplasm. The characteristics of apoptotic cell death were never observed. On the contrary, these neurons, which accumulated phosphorylated tau, undergo nonapoptotic, atrophic neuronal degeneration. This nonapoptotic, atrophic neuronal degeneration, also termed dark cell degeneration, has also been reported to occur in a mouse model of Huntington's disease (Turmaine et al., 2000). In this model dystrophic neurons bear nuclear inclusions, a key pathological feature of Huntington's disease (Turmaine et al., 2000). The brains of our Tg mice exhibited atrophic neurons containing accumulations of phosphorylated tau, a key pathological feature of tauopathy. The formation of disease-specific inclusions may be one feature characterizing this type of neuronal degeneration. In transient ischemia models, dark cell degeneration occurs in area CA1 of the hippocampus, and such dystrophic neurons are specifically stained by toluidine blue (Deshpande et al., 1992). Ultrastructural features of neurons undergoing dark cell degeneration include polysome disaggregation and deposition of dark, as of yet unidentified, material in the cytoplasm. The dystrophic neurons exhibited by our Tg mice similarly displayed an increase in the number of ribosomes, in addition to the disappearance of microtubules, deposition of tau fibrils, and RNA accumulation. These latter features have not been reported to occur in either the transient ischemia or the Huntington's disease model. Thus, the increased number of ribosomes, disappearance of microtubules, deposition of tau fibrils, and RNA accumulation observed in the brains of our Tg mice may be uniquely related to specific events that underlie neuronal degeneration associated with the accumulation of phosphorylated tau.
Mechanism of neuronal degeneration through phosphorylated tau accumulation
In the AD brain, NFT-bearing neurons commonly exhibit cytoplasmic RNA accumulations. Similarly, in the brains of our Tg mice, dystrophic neurons commonly exhibited cytoplasmic RNA accumulations. RNA accumulation may be a common phenomenon that occurs during neurodegeneration associated with the accumulation of phosphorylated tau. Because mutant tau-expressing neurons display both phosphorylated tau immunoreactivity and RNA accumulations, mutant tau may be involved in both tau phosphorylation and the abnormal accumulation of RNA. The observation that these degenerating neurons also exhibit atrophy, immunoreactivity for PHF-tau epitopes, including Alz50, and loss of microtubules supports the hypothesis that accumulations of RNA and PHF-tau may induce neuronal degeneration through the destabilization of microtubules. Thus, neurodegeneration occurred in aged Tg mice might be a consequence of RNA and tau accumulation, although it is unclear in this study how long this event takes. Consistent with this hypothesis are findings from in vitro studies showing that RNA does indeed inhibit microtubule assembly via a tau-associated mechanism (Bryan et al., 1975) and that RNA also enhances PHF assembly (Kampers et al., 1996; Friedhoff et al., 1998).
Tau can associate with the C-terminus of tubulin, which is unusually acidic, as well as with other polyanionic molecules (Littauer et al., 1986). Because of its acidic properties, tubulin competes with RNA or other polyanions for binding to tau. The effect of polyanions on microtubule stability has been previously reported (Goedert et al., 1996). Heparin sulfate, a polyanionic compound like RNA, depolymerizes microtubule assembly initiated by tau in vitro. In a similar manner, therefore, the accumulation of RNA in the cytoplasm of a neuron can induce the depolymerization of microtubules, resulting in neurodegeneration and the formation of tau fibrils. Consistent with this idea is our finding that the irregularly shaped neurons of the Tg mice displayed neuronal dystrophy accompanied by the accumulation of RNA and PHF-tau and the loss of microtubules.
The observation that some of the mutant tau-expressing neurons in our study only displayed phosphorylated tau immunoreactivity and cytoplasmic RNA accumulations and no microtubule loss suggests that the accumulation of mutant tau, and subsequent accumulations of RNA and phosphorylated tau, precedes microtubule depolymerization. RNA competes with tubulin by binding to tau, which ultimately leads to the depolymerization of microtubules and the aggregation of tau. Neuronal dystrophy subsequently follows the loss of microtubules. The exact biochemical sequence of this cascade is yet to be determined.
Behavioral abnormality
Tg (V337M) mice displayed a striking behavioral impairment in the elevated plus maze compared with the non-Tg mice. These behavioral observations are consistent with both histological findings that hippocampal neurons from Tg mice exhibit signs of neuronal degeneration and physiological findings that neural activity of hippocampal slices from these mice is reduced. Normal, non-Tg mice did not remain in open spaces, which in previous studies has been interpreted as avoidance of a fear-producing state. In the present study, however, 11-month-old Tg214 mice remained in the open arm significantly longer than their non-Tg littermates and left excessive amounts of feces and urine in both arms. This suggests the presence of a cognitive deficit in which Tg mice may not be able to discriminate fearful conditions from fearless ones. Supporting this interpretation, 11-month-old Tg mice showed little habituation to the elevated plus maze and open field apparatus, whereas non-Tg littermates habituated to them considerably. These phenomena persisted on the second and the third testing days. Tg mice showed similar locomotion traces during every test period on the elevated plus maze, whereas non-Tg littermates clearly reduced their locomotion and time spent in the open arm on the second and the third testing days. These results suggest that Tg (V337M) mice may be impaired in cognition of their environmental state, but not in spatial recognition, because they did not show significant performance impairments in the Morris water maze. These behavioral impairments are most likely attributable to the reduced neural activity in the hippocampus.
Because V337M Tg mice exhibit both neuropathological and behavioral features similar to those observed in human neurodegenerative disorders like AD, these Tg mice provide a valuable preclinical model for testing therapeutic drugs for the treatment of neurodegenerative disorders that exhibit NFTs.
Footnotes
This work is partly supported by Core Research for Evolutional Science and Technology (Japan Science and Technology), and a grant-in-aid for Scientific Research (11680746, from the Japanese Ministry of Education, Science and Culture).We thank Naomi Kikuchi, Jung-Mi Park, Keiko Matsuda, and Shinobu Nakao, for technical assistance, Ohoshi Murayama, Yuji Yoshiike, Xiaoyan Sun, and Shinji Sato for helpful suggestions, J. Kobayashi for manuscript preparation, and C. L. Dolorfo for manuscript editing (Exact Science Communications).
Correspondence should be addressed to Akihiko Takashima at the above address. E-mail: kenneth@brain.riken.go.jp.
REFERENCES
- 1.Barghorn S, Zheng-Fischhofer Q, Ackmann M, Biernat J, von Bergen M, Mandelkow E, Mandelkow E. Structure, microtubule interactions, and paired helical filament aggregation by tau mutants of frontotemporal dementias. Biochemistry. 2000;39:11714–11720. doi: 10.1021/bi000850r. [DOI] [PubMed] [Google Scholar]
- 2.Biernat J, Mandelkow EM, Schroter C, Lichtenberg-Kraag B, Steiner B, Berling B, Meyer H, Mercken M, Vandermeeren A, Goedert M. The switch of tau protein to an Alzheimer-like state includes the phosphorylation of two serine-proline motifs upstream of the microtubule binding region. EMBO J. 1992;11:1593–1597. doi: 10.1002/j.1460-2075.1992.tb05204.x. [DOI] [PMC free article] [PubMed] [Google Scholar]
- 3.Bryan JB, Nagle BW, Doenges KH. Inhibition of tubulin assembly by RNA and other polyanions: evidence for a required protein. Proc Natl Acad Sci USA. 1975;72:3570–3574. doi: 10.1073/pnas.72.9.3570. [DOI] [PMC free article] [PubMed] [Google Scholar]
- 4.Clark LN, Poorkaj P, Wszolek Z, Geschwind DH, Nasreddine ZS, Miller B, Li D, Payami H, Awert F, Markopoulou K, Andreadis A, D'Souza I, Lee VM, Reed L, Trojanowski JQ, Zhukareva V, Bird T, Schellenberg G, Wilhelmsen KC. Pathogenic implications of mutations in the tau gene in pallido-ponto-nigral degeneration and related neurodegenerative disorders linked to chromosome 17. Proc Natl Acad Sci USA. 1998;95:13103–13107. doi: 10.1073/pnas.95.22.13103. [DOI] [PMC free article] [PubMed] [Google Scholar]
- 5.Deshpande J, Bergstedt K, Linden T, Kalimo H, Wieloch T. Ultrastructural changes in the hippocampal CA1 region following transient cerebral ischemia: evidence against programmed cell death. Exp Brain Res. 1992;88:91–105. doi: 10.1007/BF02259131. [DOI] [PubMed] [Google Scholar]
- 6.D'Souza I, Poorkaj P, Hong M, Nochlin D, Lee VM, Bird TD, Schellenberg GD. Missense and silent tau gene mutations cause frontotemporal dementia with parkinsonism-chromosome 17 type, by affecting multiple alternative RNA splicing regulatory elements. Proc Natl Acad Sci USA. 1999;96:5598–5603. doi: 10.1073/pnas.96.10.5598. [DOI] [PMC free article] [PubMed] [Google Scholar]
- 7.Friedhoff P, von Bergen M, Mandelkow EM, Davies P, Mandelkow E. A nucleated assembly mechanism of Alzheimer paired helical filaments. Proc Natl Acad Sci USA. 1998;95:15712–15717. doi: 10.1073/pnas.95.26.15712. [DOI] [PMC free article] [PubMed] [Google Scholar]
- 8.Ginsberg SD, Crino PB, Lee VM, Eberwine JH, Trojanowski JQ. Sequestration of RNA in Alzheimer's disease neurofibrillary tangles and senile plaques. Ann Neurol. 1997;41:200–209. doi: 10.1002/ana.410410211. [DOI] [PubMed] [Google Scholar]
- 9.Goedert M, Jakes R, Spillantini MG, Hasegawa M, Smith MJ, Crowther RA. Assembly of microtubule-associated protein tau into Alzheimer-like filaments induced by sulphated glycosaminoglycans. Nature. 1996;383:550–553. doi: 10.1038/383550a0. [DOI] [PubMed] [Google Scholar]
- 10.Goedert M, Crowther RA, Spillantini MG. Tau mutations cause frontotemporal dementias. Neuron. 1998;21:955–958. doi: 10.1016/s0896-6273(00)80615-7. [DOI] [PubMed] [Google Scholar]
- 11.Gomez-Isla T, Hollister R, West H, Mui S, Growdon JH, Petersen RC, Parisi JE, Hyman BT. Neuronal loss correlates with but exceeds neurofibrillary tangles in Alzheimer's disease. Ann Neurol. 1997;41:17–24. doi: 10.1002/ana.410410106. [DOI] [PubMed] [Google Scholar]
- 12.Gotz J, Chen F, Barmettler R, Nitsch RM. Tau filament formation in transgenic mice expressing P301L tau. J Biol Chem. 2001;276:529–534. doi: 10.1074/jbc.M006531200. [DOI] [PubMed] [Google Scholar]
- 13.Hayer PE, Lyon H, Jakobsen P, Andersen PE. Standardized methyl green-pyronin Y procedures using pure dyes. Histochem J. 1986;2–3:90–94. doi: 10.1007/BF01675361. [DOI] [PubMed] [Google Scholar]
- 14.Hong M, Zhukareva V, Vogelsberg-Ragaglia V, Wszolek Z, Reed L, Miller BI, Geschwind DH, Bird TD, McKeel D, Goate A, Morris JC, Wilhelmsen KC, Schellenberg GD, Trojanowski JQ, Lee VM-Y. Mutation-specific functional impairments in distinct tau isoforms of hereditary FTDP-17. Science. 1998;282:1914–19147. doi: 10.1126/science.282.5395.1914. [DOI] [PubMed] [Google Scholar]
- 15.Hutton M, Lendon CL, Rizzu P, Baker M, Froelich S, Houlden H, Pickering-Brown S, Chakraverty S, Isaacs A, Grover A, Hackett J, Adamson J, Lincoln S, Dickson D, Davies P, Petersen RC, Stevens M, de Graaff E, Wauters E, van Baren J. Association of missense and 5′-splice-site mutations in tau with the inherited dementia FTDP-17. Nature. 1998;393:702–705. doi: 10.1038/31508. [DOI] [PubMed] [Google Scholar]
- 16.Ihara Y. Massive somatodendritic sprouting of cortical neurons in Alzheimer's disease. Brain Res. 1988;459:138–144. doi: 10.1016/0006-8993(88)90293-4. [DOI] [PubMed] [Google Scholar]
- 17.Iijima M, Tabira T, Poorkaj P, Schellenberg GD, Trojanowski JQ, Lee VM, Schmidt ML, Takahashi K, Nabika T, Matsumoto T, Yamashita Y, Yoshioka S, Ishino H. A distinct familial presenile dementia with a novel missense mutation in the tau gene. NeuroReport. 1999;10:497–501. doi: 10.1097/00001756-199902250-00010. [DOI] [PubMed] [Google Scholar]
- 18.Kampers T, Friedhoff P, Biernat J, Mandelkow EM, Mandelkow E. RNA stimulates aggregation of microtubule-associated protein tau into Alzheimer-like paired helical filaments. FEBS Lett. 1996;399:344–349. doi: 10.1016/s0014-5793(96)01386-5. [DOI] [PubMed] [Google Scholar]
- 19.Lee VM, Trojanowski JQ. Neurodegenerative tauopathies: human disease and transgenic mouse models. Neuron. 1999;24:507–510. doi: 10.1016/s0896-6273(00)81106-x. [DOI] [PubMed] [Google Scholar]
- 20.Lewis J, McGowan E, Rockwood J, Melrose H, Nacharaju P, Van Slegenhorst M, Gwinn-Hardy K, Murphy MP, Baker M, Yu X, Duff K, Hardy J, Corral A, Lin W-L, Yen S-H, Dickson DW, Davies P, Hutton M. Neurofibrillary tangles, amyotrophy and progressive motor disturbance in mice expressing mutant (P301L) tau protein. Nat Genet. 2000;25:402–405. doi: 10.1038/78078. [DOI] [PubMed] [Google Scholar]
- 21.Littauer UZ, Giveon D, Thierauf M, Ginzburg I, Ponstingl H. Common and distinct tubulin binding sites for microtubule-associated proteins. Proc Natl Acad Sci USA. 1986;83:7162–7166. doi: 10.1073/pnas.83.19.7162. [DOI] [PMC free article] [PubMed] [Google Scholar]
- 22.Loew LM, Cohen LB, Dix J, Fluhler EN, Montana V, Salama G, Wu JY. A naphthyl analog of the aminostyryl pyridinium class of potentiometric membrane dyes shows consistent sensitivity in a variety of tissue, cell, and model membrane preparations. J Membr Biol. 1992;130:1–10. doi: 10.1007/BF00233734. [DOI] [PubMed] [Google Scholar]
- 23.Michel G, Mercken M, Murayama M, Noguchi K, Ishiguro K, Imahori K, Takashima A. Characterization of tau phosphorylation in glycogen synthase kinase-3beta and cyclin dependent kinase-5 activator (p23) transfected cells. Biochim Biophys Acta. 1998;1380:177–182. doi: 10.1016/s0304-4165(97)00139-6. [DOI] [PubMed] [Google Scholar]
- 24.Poorkaj P, Bird TD, Wijsman E, Nemens E, Garruto RM, Anderson L, Andreadis A, Wiederholt WC, Raskind M, Schellenberg GD. Tau is a candidate gene for chromosome 17 frontotemporal dementia. Ann Neurol. 1998;43:815–825. doi: 10.1002/ana.410430617. [DOI] [PubMed] [Google Scholar]
- 25.Spillantini MG, Goedert M. Tau protein pathology in neurodegenerative diseases. Trends Neurosci. 1998;21:428–433. doi: 10.1016/s0166-2236(98)01337-x. [DOI] [PubMed] [Google Scholar]
- 26.Spillantini MG, Murrell JR, Goedert M, Farlow MR, Klug A, Ghetti B. Mutation in the tau gene in familial multiple system tauopathy with presenile dementia. Proc Natl Acad Sci USA. 1998;95:7737–7741. doi: 10.1073/pnas.95.13.7737. [DOI] [PMC free article] [PubMed] [Google Scholar]
- 27.Takashima A, Murayama M, Murayama O, Kohno T, Honda T, Yasutake K, Nihonmatsu N, Mercken M, Yamaguchi H, Sugihara S, Wolozin B. Presenilin 1 associates with glycogen synthase kinase-3beta and its substrate tau. Proc Natl Acad Sci USA. 1998;95:9637–9641. doi: 10.1073/pnas.95.16.9637. [DOI] [PMC free article] [PubMed] [Google Scholar]
- 28.Tominaga T, Tominaga Y, Yamada H, Matsumoto G, Ichikawa M. Quantification of optical signals with electrophysiological signals in neural activities of Di-4-ANEPPS stained rat hippocampal slices. J Neurosci Methods. 2000;102:11–23. doi: 10.1016/s0165-0270(00)00270-3. [DOI] [PubMed] [Google Scholar]
- 29.Turmaine M, Raza A, Mahal A, Mangiarini L, Bates GP, Davies SW. Nonapoptotic neurodegeneration in a transgenic mouse model of Huntington's disease. Proc Natl Acad Sci USA. 2000;97:8093–8097. doi: 10.1073/pnas.110078997. [DOI] [PMC free article] [PubMed] [Google Scholar]
- 30.Wolozin BL, Pruchnicki A, Dickson DW, Davies P. A neuronal antigen in the brains of Alzheimer patients. Science. 1986;232:648–650. doi: 10.1126/science.3083509. [DOI] [PubMed] [Google Scholar]
- 31.Yen SH, Hutton M, DeTure M, Ko LW, Nacharaju P. Fibrillogenesis of tau: insights from tau missense mutations in FTDP-17. Brain Pathol. 1999;9:695–705. doi: 10.1111/j.1750-3639.1999.tb00551.x. [DOI] [PMC free article] [PubMed] [Google Scholar]