

Abstract
Neural transmission of complex sounds demands fast and sustained rates of synaptic release from the primary cochlear receptors, the inner hair cells (IHCs). The cells therefore require efficient membrane recycling. Using two-photon imaging of the membrane marker FM1-43 in the intact sensory epithelium within the cochlear bone of the adult guinea pig, we show that IHCs possess fast calcium-dependent membrane uptake at their apical pole. FM1-43 did not permeate through the stereocilial mechanotransducer channel because uptake kinetics were neither changed by the blockers dihydrostreptomycin andd-tubocurarine nor by treatment of the apical membrane with BAPTA, known to disrupt mechanotransduction. Moreover, the fluid phase marker Lucifer Yellow produced a similar labeling pattern to FM1-43, consistent with FM1-43 uptake via endocytosis. We estimate the membrane retrieval rate at ∼0.5% of the surface area of the cell per second. Labeled membrane was rapidly transported to the base of IHCs by kinesin-dependent trafficking and accumulated in structures that resembled synaptic release sites. Using confocal imaging of FM1-43 in excised strips of the organ of Corti, we show that the time constants of fluorescence decay at the basolateral pole of IHCs and apical endocytosis were increased after depolarization of IHCs with 40 mm potassium, a stimulus that triggers calcium influx and increases synaptic release. Blocking calcium channels with either cadmium or nimodipine during depolarization abolished the rate increase of apical endocytosis. We suggest that IHCs use fast calcium-dependent apical endocytosis for activity-associated replenishment of synaptic membrane.
Keywords: hair cells, cochlea, membrane recycling, endocytosis, FM1-43, two-photon imaging
Incoming acoustic information in the mammalian auditory system is encoded by the inner hair cells (IHCs) of the cochlea. IHCs are polarized neuroepithelial cells that have mechanosensory stereocilia at their apical surface and, as determined for the cat, ∼20 synaptic release sites around their basolateral membrane (Merchan-Perez and Liberman, 1996). Sound-induced deflection of the stereocilia depolarizes IHCs, leading to calcium-dependent release of neurotransmitter from their base. Remarkably, the IHC synapse allows the postsynaptic fibers to be phase-locked to the stimulus up to frequencies of 6 kHz (Palmer and Russell, 1986) and exhibits sustained activity during tone bursts of long duration (Rhode and Smith, 1985). According to anatomical studies, each release site of mammalian IHCs contains only ∼250 vesicles (Merchan-Perez and Liberman, 1996). Capacitance measurements have further suggested that the readily releasable pool contains only ∼280 vesicles per IHC. (Moser and Beutner, 2000). These figures imply that IHCs recycle vesicular membrane very efficiently to replenish synaptic vesicle pools and maintain high rates of release.
Endocytotic activity in the basolateral membrane and base-to-apex transport and transcytosis of a fluid-phase marker have been demonstrated by electron microscopy of IHCs from guinea pig, chinchilla (Siegel and Brownell, 1986), and cat (Leake and Snyder, 1987). Studies using the fluorescent membrane marker FM1-43 (Betz and Bewick, 1993) have shown that guinea pig (Kilner and Ashmore, 1997; Meyer et al., 2001), mouse (Self et al., 1999), and zebrafish (Seiler and Nicolson, 1999) hair cells can also take up membrane from their apical surface. However, there is contradicting evidence fromXenopus hair cells (Nishikawa and Sasaki, 1996) and developing outer hair cells of mouse cochlear cultures (Gale et al., 2001), suggesting that FM1-43 permeates through the mechanotransducer channel.
In this paper we have specifically addressed the following questions: first, whether adult IHCs take up FM1-43 by apical endocytosis or via the mechanotransducer channel; second, whether apically internalized membrane is confined to the apical receptor compartment of IHCs or whether it contributes to the basolateral membrane pool of the synaptic zone; third, whether apical endocytosis is coupled to the activity of IHCs.
To address these issues in a near-physiological situation, we used two-photon laser-scanning microscopy of fluorescent signals of membrane and endocytosis markers in an in situ preparation of the organ of Corti, where the tissue remains completely undissected within the cochlear bone, and only the apical membrane of IHCs is exposed to the bath solution. This preparation allowed us to quantify selectively the rate of membrane retrieval from the apical plasma membrane. In a complementary series of experiments, we used strips of organ of Corti dissected out of the cochlear bone to study basolateral membrane retrieval and to investigate a possible physiological role of apical endocytosis. In contrast to the in situ preparation, the basolateral membranes of IHCs were accessible to bath solution. This enabled us to manipulate the activity of IHCs to study the activity dependence of both FM1-43 uptake and release reflecting rates of endocytosis and exocytosis.
MATERIALS AND METHODS
Tissue. Temporal bones were dissected from young adult guinea pigs (300–350 gm) killed by rapid cervical dislocation according to United Kingdom animal care guidelines. Tissue was kept cool during dissection. Two distinct preparations were used. For anin situ preparation of the organ of Corti (Fig.1), the whole temporal bone was fixed to the bottom of a plastic dish with the apex of the cochlea topmost and covered with artificial perilymph or endolymph (Fig.1A). Scala vestibuli was exposed by removing the bone at the tip of the cochlea. Care was taken not to damage the lateral bony walls. Scala media was opened by carefully removing Reissner's membrane with a fine needle (Fig. 1B). This allowed exchange of extracellular solution contacting the apical surface of organ of Corti while preserving normal cochlear cytoarchitecture so that basolateral membranes were not readily accessible to bath solution. Evidence for retention of a tight barrier is presented in Figure 2. The data presented here is based on 57 in situ preparations.
Fig. 1.
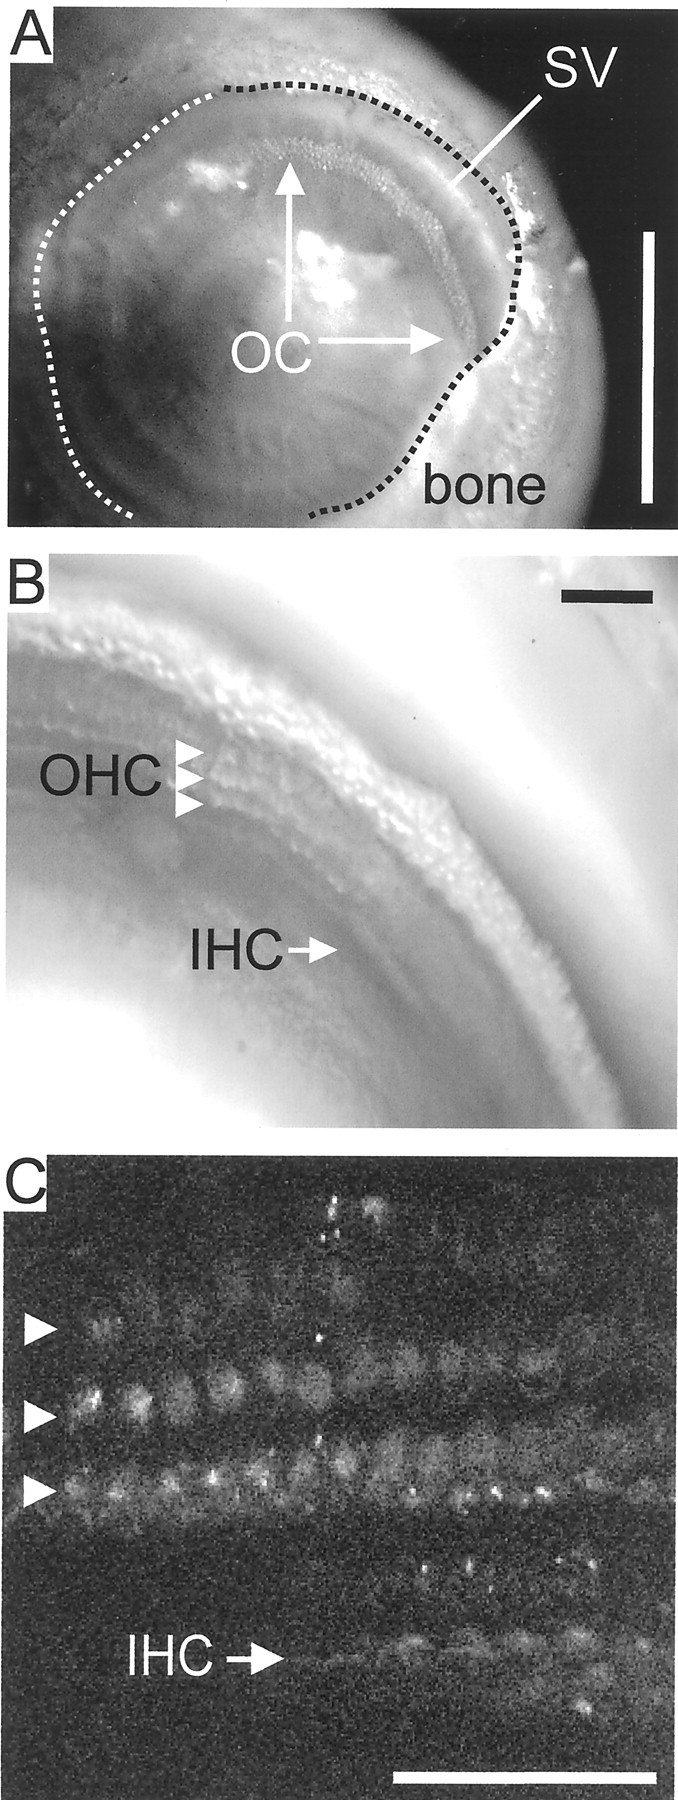
An in situ preparation of the organ of Corti allows studying apical endocytosis in hair cells.A, The cochlear bone was opened at the helicotrema to expose the organ of Corti (OC) within the fourth turn of the cochlea. The dashed line delineates the edge of the cochlear bone. SV, Stria vascularis. Scale bar, 0.5 mm.B, After removal of Reissner's membrane, three rows of outer hair cells (OHC) and one row of inner hair cells (IHC) can be discerned. C, Signal obtained from the second harmonic generation. The OHCs (arrowheads) and the stereocilia of the IHCs can be seen. This image allowed alignment of the imaging window before application of the dye so that the time course of uptake could be studied in distinct structures of the cells. Scale bars:B, C, 50 μm.
Fig. 2.
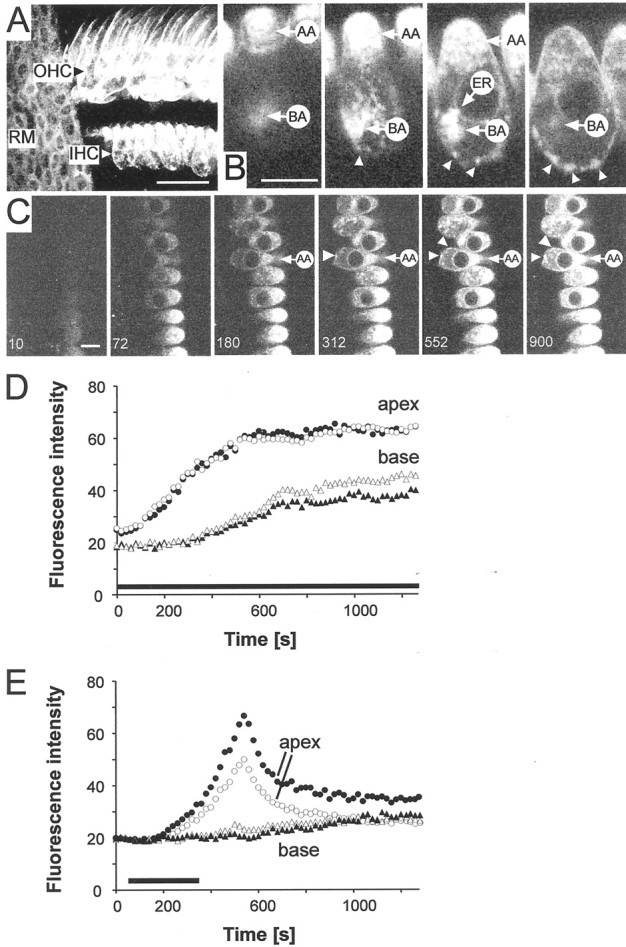
FM1-43 is taken up apically by cochlear hair cells. Two-photon images of the organ of Corti and hair cellsin situ. A, 3-D reconstruction of the organ of Corti showing uptake of FM1-43 from the scala media. Exposure time to FM1-43 20 min, producing labeling of three rows of OHCs and one row of IHCs. No uptake into supporting cells is apparent. Reissner's membrane is seen as a sheet of cells that also took up FM1-43. Scale bar, 40 μm. B, A series of confocal sections (in 1.2 μm intervals) through an IHC showing structures taking up dye: AA, apical aggregate; BA, basal aggregate; ER, perinuclear endoplasmic reticulum. Arrowheads indicate punctate staining (hotspots) around the basolateral pole. Scale bar, 10 μm.C, Progressive uptake and appearance of FM1-43 in basal structures. Scale bar, 10 μm. Hotspots marked byarrowheads. D, Time course of fluorescent signal. FM1-43 was applied at t = 0 sec with no washout (solid bar). Average fluorescence values for apex (circles) and base (triangles). The fluorescence increased to a steady state. Data from two adjacent cells are shown as open and closed symbols.E, Time course of fluorescence development in two adjacent cells when FM1-43 was bath applied for 300 sec (solid bar) and then washed out.
To study effects of different ionic solutions and drugs on exocytosis and endocytosis, strips of organ of Corti from the two apical turns were dissected out of the cochlear bone and kept in ice-cold artificial perilymph. For imaging, strips were placed in a perfusion chamber with either their apical or their basal sides topmost and held down by a nylon grid to minimize movement during imaging. The chamber volume (2 ml) could be completely changed within 30 sec, but during imaging cells were superfused at a rate of 1 ml/min.
Solutions. Artificial perilymph contained (in mm): NaCl 144, KCl 4.6, glucose 23, HEPES 4.9, CaCl2 1, and MgCl2 1.5. Artificial endolymph contained (in mm, based on formula weights): KCl 132, K-gluconate 25, CaCl20.023, NaHCO3 1.3, and glucose 0.6. BAPTA-buffered extracellular solution for disruption of tip links (Assad et al., 1991) was identical to artificial perilymph, except that CaCl2 was 0.1 mm, and BAPTA was present at 5 mm. Ca2+ was buffered to ∼10−9 M. For all solutions osmolarity and pH were adjusted to 330 and 7.4 mOsm/l, respectively. For thein situ preparation, FM1-43 (Molecular Probes, Leiden, The Netherlands) was bath applied at (5 μm). Solution changes in the chamber took 5 sec. For strips of organ of Corti, application pipettes (diameter 2–3 μm; pressure 70 Pa) containing FM1-43 were used. The dye was diluted in artificial perilymph of the same composition. In experiments where potassium was increased to 40 mm and NaCl was reduced to 109 mm (to depolarize IHCs), the pipette solution was changed accordingly. FM1-43 was applied as pulses of either 60 or 90 sec duration. All experiments were performed at room temperature.
To block hair cell mechanotransducer channels, 50 μmdihydrostreptomycin (Sigma, Poole, UK) or 100 μmd-tubocurarine (Sigma) was added to the bathing solution. Before application of FM1-43, the tissue was preincubated for 20 min with one or the other of these drugs, which remained throughout the experiment. Monastrol (Calbiochem, San Diego, CA) was used to inhibit kinesins. In these experiments the tissue was preincubated in artificial perilymph containing 50 μmmonastrol for 40 min before the experimental run. Voltage-dependent calcium channels of IHCs were blocked by 100 μm cadmium or 10 μm nimodipine. The efficacy of both drugs in reducing or blocking the L-type current in adult IHCs was tested using conventional whole-cell voltage clamp methods (Griesinger and Ashmore, 2001). All data are given as mean ± SD unless otherwise stated.
Imaging of FM1-43 uptake. In situ, hair cells from the fourth turn of the cochlea were imaged with a two-photon confocal laser-scanning microscope that consisted of an MRC 1024 scan head (Bio-Rad, Hemel-Hempstead, UK) mounted on a Nikon FN 600 upright microscope. Fluorescence excitation was achieved with a 5 W Millennia V pump laser coupled to a Tsunami Ti-Sapphire pulsed laser (Spectra-Physics, Fremont, CA) tuned to a wavelength of 835 nm. The intensity of the excitation light was regulated by a series of infrared neutral density filters. Emitted fluorescence was imaged via a 60× long working distance (LWD) water immersion (WI) objective [Nikon; numerical aperture (NA), 1.0] and collected by an external detector. The photomultiplier gain and offset were kept constant during any one experimental run. In experiments in which two dyes were used, the beam was split by a dual FITC–rhodamine optimized dichroic mirror before collection by two separate photomultipliers. Before applying the dye, the imaging window was aligned on the tissue using the image signal obtained from second harmonic generation (Moreaux et al., 2001) (Fig. 1C).
In strips of organ of Corti, hair cells were imaged by conventional laser-scanning confocal microscopy using a Zeiss LSM 510 confocal microscope using a 63× LWD WI objective. Confocal parameters were held constant for the time series. Optical sectioning and three-dimensional (3-D) reconstruction was performed with proprietary software. Analysis of signals over time and trace analysis were performed using the Zeiss LSM 510 software (Zeiss, Oberkochen, Germany) and Lucida 4.0 (Kinetic Imaging, Liverpool, UK). Quantitative data of fluorescence intensity were obtained from regions of interest (ROIs). Where necessary, background fluorescence was subtracted. The dimensions of ROIs ranged from 8 × 8 μm to up to 10 × 20 μm for analysis of signal kinetic in the apical and basal compartment of IHCs. To analyze the decay of fluorescent signal close to the basolateral membrane, ROIs of 2 × 4 μm were used.
Estimation of the apical membrane retrieval rate. To estimate the area of membrane labeled with FM1-43, we used spherical membranes extruded from the apical hair cell surface after cells had been kept for >2 hr in the bath. The strongest signal was obtained when the sphere was sectioned across a diameter with the membrane sheet being oriented vertically within the optical section. Minimal fluorescence was collected from tangentially oriented membrane. On average, signals were half that of vertically oriented membrane. Because two-photon excitation is strongly localized, we used the excitation of such a membrane band to equate each imaged voxel with an equivalent membrane area. The estimate of the excitation depth was theoretically derived from the z-transfer of the objective NA (1.0) and confirmed by measuring the z point spread function of 210 nm calcium fluorite crystals, which showed that membrane-bound fluorophore was excited to a depth of 1.1 μm. In the membrane circumference, each x–y pixel (81 × 81 nm) was found to have fluorescence, fm in arbitrary units. A fluorescence, fm, could be associated with a 1.1 μm × 81 nm = 0.089 μm2 area of FM1-43-labeled membrane. At low signal levels, the dark noise of the photomultiplier was thresholded, improving the apparent z-resolution by a factor of 3.5. Allowance for this factor was made in the estimate of the unit fluorescence, fm. In any other section, each pixel, at position x, with a fluorescence ϕx could therefore be associated with a membrane area 0.089 ϕx/fmμm2. In the absence of information about the preferred orientation of membrane within the cell, we assumed that we imaged randomly oriented membrane. Because the membrane to area calibration was obtained from a vertically oriented sheet of membrane, the membrane area would be underestimated by a factor of 2. To compensate, each voxel value was multiplied by a factor of 2. The fluorescent intensity of summed voxels in any plane of the hair cell could thus be converted into an equivalent labeled membrane area 0.185Sa/fmμm2.
Transepithelial stimulation. Transepithelial stimulation was performed by placing a stimulus pipette (diameter 5–10 μm) pipette 40 μm above the inner hair cells (Mammano and Ashmore, 1993). Anodal current (100–250 μA 1 msec pulses at 20 Hz) was used to depolarize the basolateral membrane. A silver wire in the modiolus acted as an indifferent earth. After hotspots were sufficiently stained, monastrol (50 μm) was bath-applied and present throughout the experiment to retard apex-to-base transport of membrane. FM1-43-labeled hotspots were placed in the center of az-stack that extended ∼2 μm upward and downward to ensure that they could be tracked at all times. Only hotspots of the cell located directly under the pipette and of the neighboring two cells on either side of the central cell were included in the analysis.
Imaging of fluid phase markers. The fluid phase endocytosis marker Lucifer Yellow (Molecular Probes) was added to the bath at 20 mm final concentration (Mundigl et al., 1993). The tissue was incubated in the dark at room temperature for 1 hr before imaging.
To test whether the tight junctions of the reticular lamina were still intact in the in situ preparation and thus to corroborate that we were selectively studying membrane retrieval from the apical side, Alexa 488 (Molecular Probes) was added to the bath at 100 μm. This dye shows strong fluorescence even at relatively low concentrations and does not bleach as readily as Lucifer Yellow. It therefore enabled us to perform double-labeling experiments with FM1-43.
RESULTS
Time course and labeling pattern resulting from apical uptake of FM1-43 into IHCs
When presented exclusively to the apical surface using thein situ preparation, where the tight junctions between cells were maintained, FM1-43 (5 μm) was taken up into both IHCs and outer hair cells (OHCs) of the organ of Corti (Fig. 2A). This paper focuses on IHCs. Figure2B shows that IHCs showed dye uptake into specific structures, an apical one (“apical aggregate”), the perinuclear endoplasmic reticulum, and a basal structure (“basal aggregate”) (apical and basal aggregate are labeled “AA” and “BA” in this and subsequent figures). The characteristics of the dye indicate that they correspond to internal membrane-dense regions. Electron microscopy has revealed extensive membrane structures within IHCs (Spicer et al., 1999). According to these data, the apical aggregate presumably corresponded to a large endosomal network (Kachar et al., 1997), a dense network of presumptive smooth endoplasmic reticulum (“canalicular reticulum”), and numerous Golgi complexes (Spicer et al., 1999). The basal aggregate might correspond to a large pool of small vesicles that is located in the cytosol of the basal synaptic half of IHCs (Spicer et al., 1999). During labeling, bright fluorescent “hotspots” became apparent (Fig. 2B). These were associated with the basolateral membrane and corresponded spatially to the regions of IHC synaptic specialization.
Prolonged FM1-43 application produced an initial rise of fluorescence at the cell apex (Fig. 2C). Within 180 sec, the signal rose in the basal aggregate and in the basolateral hotspots, indicating apex-to-base trafficking of membrane. The time course of these signals depended on how FM1-43 was applied (Fig. 2D,E). If FM1-43 was applied continuously, fluorescence reached a steady state in 500 sec in the apex and within 800 sec in the basal structures (Fig.2D). When a pulse of FM1-43 was given, the apical fluorescence initially increased but subsequently declined when the external dye was removed (Fig. 2E). Even after removal of extracellular dye, the fluorescence of the basal aggregate continued to increase. This suggests that membrane was being trafficked from apex to base. At the start of the dye washout period, the rate of decay of apical fluorescence was more rapid than the rise in basal fluorescence. Because FM1-43 is incorporated only into the outer leaflet of the plasma membrane, dye washout indicated the fusion of internalized membrane with the plasma membrane so that dye could de-partition from it. We deduce that some (but not all) of membrane taken up at the apex was transported to the base, but a considerable proportion was recycled in the apical compartment.
The most economical scheme that describes uptake kinetics and the distribution of dye is a “bottleneck” model. This model represents the fluorescence, F, measured in and transferred between apical and basal compartments. The model will be described fully below (see Fig. 12 and ). Because of the two compartments, fluorescence rise (and decay) is described by two time constants. For control data (Fig. 2D), the fluorescence rise was fitted by the sum of two exponential time constants of 140 and 440 sec (n = 4 cells). The effective equilibration time required for FM1-43 fluorescence to reach a steady state was 850 ± 120 sec in the apex and 1020 ± 130 sec in the base in controls (n = 17). A further parameter to describe the data is the ratio of steady-state fluorescence measured in the basal (Fb) and apical (Fa) compartments. In the control cells, the ratioFb/Fa= 0.67 ± 0.12 (n = 17). These experimental parameters can be inferred from the data (see below).
Fig. 12.
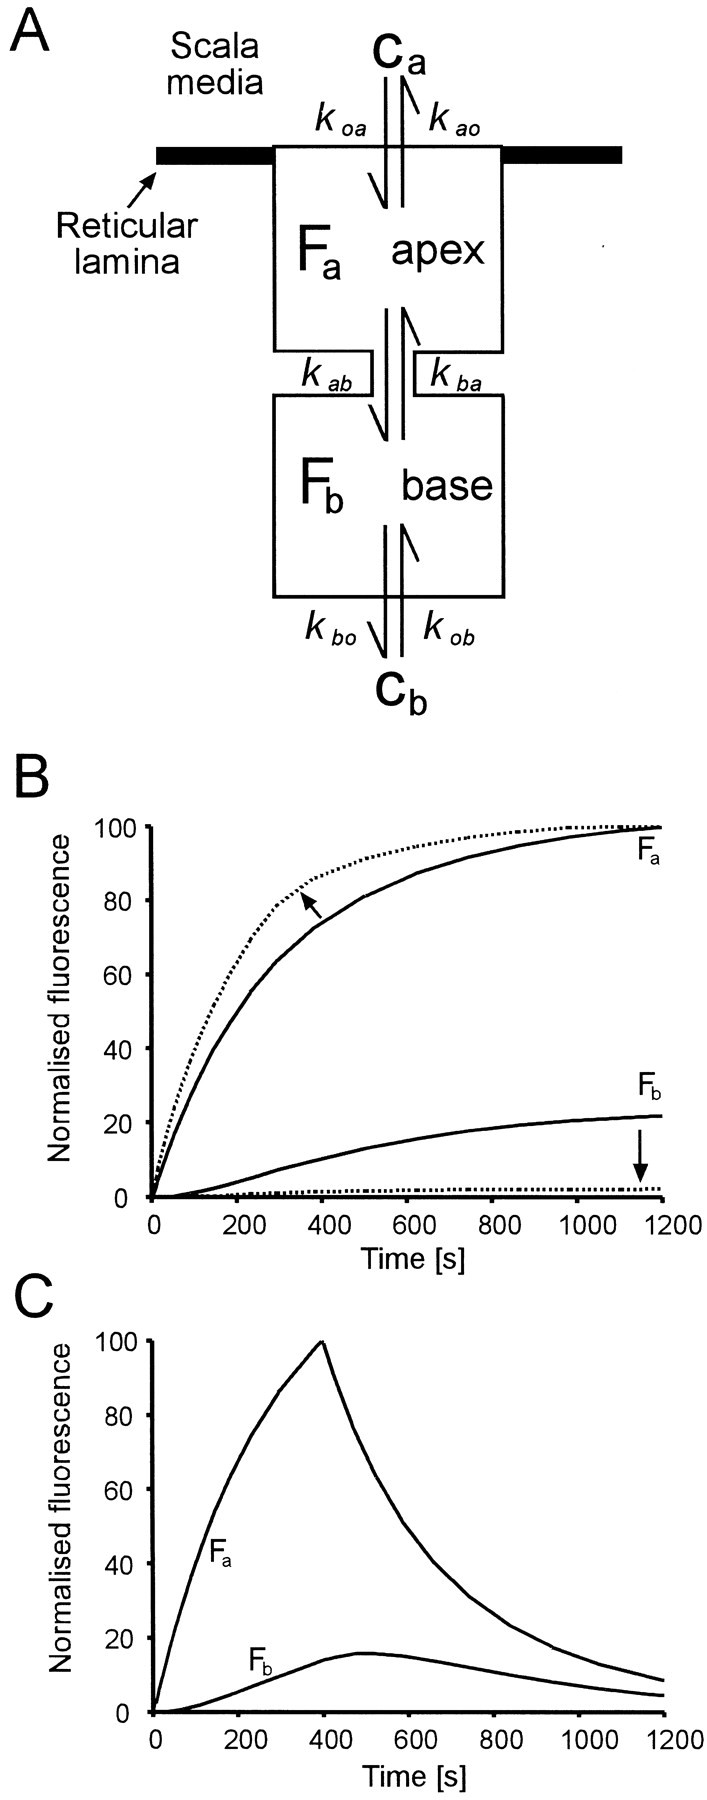
A simple model of the IHC can explain the observed time course of fluorescent signal and the relative strength of label in the apical receptor compartment Faand the basal synaptic compartment Fb.A, Uptake and transfer between extracellular space and two internal compartments (apical and basal) of the IHC is determined by first order kinetics with six free rate constants, as shown. The external marker (FM1-43), Ca orCb is applied at the apex or base, respectively. The rate constants kxx are reaction rate constants. B, Simulation of the uptake rates when FM1-43 is continuously applied to the apex of an IHC as in Figure 1D. The dashed lines are a simulation of the experiment of Figure 5C, in which the transfer rate of dye from apex to base (kab) is reduced by inhibiting kinesin, which mediates apex-to-base membrane trafficking. Note that the basal signal is decreased (arrow) and that the slope of the apical signal gets steeper (arrow) because of accumulation of dye in the apical compartment. C, Simulation of the FM1-43 uptake and decay when the IHC is presented with a 400 sec pulse as in Figure1E. Kinetic parameters chosen for the figure are in the ratio ka0:kab:kba:kbo= 0.3:1:2:2 andCa.koa=3ka0. The responses scale linearly with the applied marker concentrations Ca,b
Fluid phase markers of endocytosis produce a labeling pattern comparable with FM1-43
If FM1-43 uptake at the apical membrane of IHCs was mediated by endocytosis, fluid phase markers of endocytosis should label distinct structures representing endocytotic organelles such as endosomes. Lucifer Yellow has been successfully used as a fluid phase marker of endocytosis in mammalian neurons (Mundigl et al., 1993; Lewis and Lentz, 1998), epithelial cells (Mamdouh et al., 1996), and in yeast (Wiederkehr et al., 2001). We therefore used Lucifer Yellow in thein situ preparation to investigate whether IHCs have fluid phase endocytosis at their apical membrane (Fig.3A–C). Lucifer Yellow, when applied to scala media, remained excluded from the lumen of the stereocilia (Fig. 3A), but after 1 hr incubation, was found in distinct structures at the level of the apical aggregate, as defined by FM1-43 staining (Fig. 3B). Remarkably, the labeled structures (Fig. 3C) corresponded spatially to those labeled with FM1-43 (Fig. 3D). Both markers produced signal in apical and basal aggregates in (Fig. 3, compare C, D). The data therefore are consistent with the view that FM1-43 uptake is mediated by endocytosis, internalizing both fluid phase and membrane.
Fig. 3.
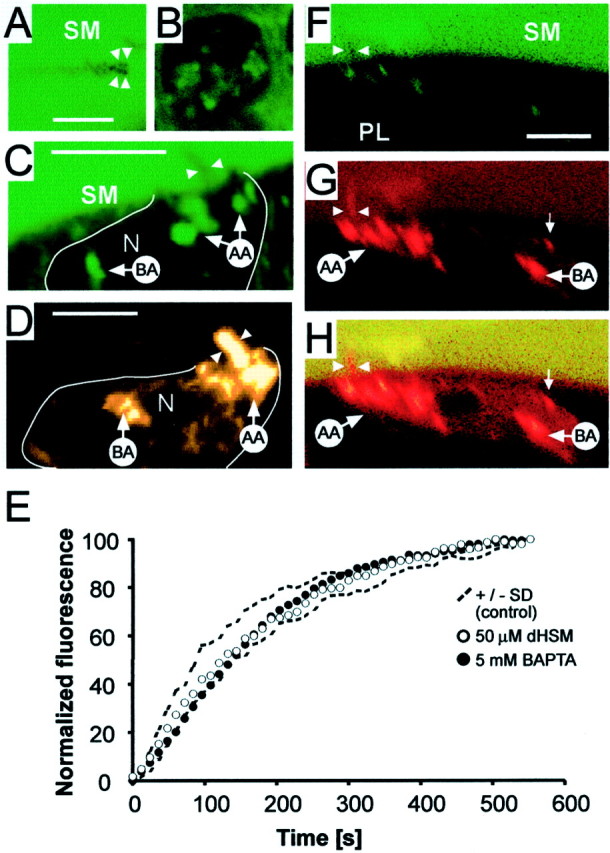
IHCs exhibit fluid phase uptake at their apical membrane. A, The fluid-phase endocytosis marker Lucifer Yellow applied to scala media was excluded from the stereocilia (arrowheads). Scale bar, 5 μm. B, Same cell as in A, with optical section 4 μm deeper into the cell. Lucifer Yellow was detectable in distinct internal structures which correspond to the apical aggregate seen after FM1-43 labeling.C, z-reconstruction of a cell labeled with Lucifer Yellow showing uptake into AA and BA structures.N, Nucleus. Scale bar, 10 μm. D,z-reconstruction of a FM1-43-labeled cell demonstrates that structures labeled with Lucifer Yellow correspond to AA and BA aggregates labeled by FM1-43. Scale bar, 10 μm. E, The rate of FM1-43 uptake into the apex was not influenced by pharmacological block of the mechanotransducer channel or destruction of the tip links. Comparison of normalized fluorescence uptake in the cuticular plate region in control cells (n = 6,dotted lines show SDs), in cells whose apical membrane was exposed to 5 mm BAPTA for 5 min before imaging (filled circles, n = 4), or 50 μm streptomycin (open circles,n = 4) before and during imaging. F, The reticular lamina was not compromised in the in situpreparation. Alexa 488 (100 μm), applied to scala media (SM), was not detected in the perilymphatic space (PL) beneath the reticular lamina. Arrowsshow position of the stereocilia. The signal in the cell originated from cross-talk of an FM1-43 signal in the Alexa 488 channel. Scale bar, 10 μm. G, The same cell showing the FM1-43 labeling pattern. The signal in SM originates from cross talk in the Alexa 488 channel. The labeling pattern with AA and BA aggregates and basolateral hotspots (small arrow) is as found in Figure1. FM1-43 labeled the stereocilial membrane (arrows).H, Combined image.
FM1-43 does not permeate through the mechanotransducer channel
To determine whether FM1-43 was entering through hair cell mechanotransducer channels on the apical stereocilia, as suggested in developing cultured outer hair cells (Gale et al., 2001), we examined the effect of known mechanotransducer channel blockers on the labeling kinetics. Neither dihydrostreptomycin (dHSM; 50 μm) (Kimitsuki and Ohmori, 1993) nor d-tubocurarine (100 μm) (Glowatzki et al., 1997) altered the initial kinetics of FM1-43 uptake (Fig. 3E). The steady-state time constants were unchanged (data not shown): steady state was reached in 830 ± 90 sec in the apex and in 940 ± 40 sec in the base of dHSM-treated cells (n = 4) and in 950 ± 50 sec (apex) and 1060 ± 40 sec (base) ind-tubocurarine-treated cells (n = 4). In addition, steady-state fluorescence ratios were unaffected by both dHSM (Fb/Fa= 0.58 ± 0.1; n = 4) and d-tubocurare (Fb/Fa = 0.61 ± 0.12; n = 4) (data not shown).
In two additional experiments, we investigated whether destruction of the mechanotransducer tip links with BAPTA influenced FM1-43 internalization. Destruction of tip links is known to abolish the transducer currents (Assad et al., 1991). We pretreated the apical membrane with 5 mm BAPTA in the bath solution for 5 min to break tip links before applying FM1-43 in normal solution. Both FM1-43 uptake rate (Fig. 3E) and basal to apical fluorescence ratio were unaffected (Fb/Fa= 0.69 ± 0.11; n = 4 cells; data not shown).
The in situ preparation allows the selective study of apical FM1-43 uptake
To ensure that our in situ preparation allowed the selective study of apical endocytosis, we had to exclude the possibility of FM1-43 penetrating through the tight junctions of the reticular lamina. We applied FM1-43 (5 μm) and the fluid phase marker Alexa 488 (100 μm) to scala media simultaneously (Fig. 3F–H).Z-reconstructions of a cross section of the organ of Corti showed that the Alexa 488 signal was confined to the scala media (Fig. 3F). The presence of signal in the scala media and its absence in the perilymphatic space demonstrate that the reticular lamina was not compromised in the in situ preparation. Some apparent uptake of Alexa 488 into IHCs could be accounted for by FM1-43 fluorescence being detected in the Alexa measurement channel. In contrast to Alexa 488, FM1-43 was taken up into IHCs, resulting in the distinctive labeling pattern (Fig.3G), indicating that the observed pattern resulted from exclusive uptake of FM1-43 at the apex. The combined image of the double-labeling experiment is shown in Figure 3H.
Apical endocytosis is fast and has a high membrane internalization rate
Recent evidence suggests that there are at least two different cellular mechanisms for endocytosis: slow clathrin-mediated endocytosis operating within minutes and so-called “rapid endocytosis”, operating on a time scale of seconds (for review, see Henkel and Almers, 1996). To investigate the speed of apical endocytosis we used the fact that, because of the spiral shape of the organ of Corti, an optical section of defined focal depth will cut through different structures of neighboring IHCs. A typical example using a strip of organ of Corti is shown in Figure 4. The section was centered so that it cut through the stereocilia of one cell and the apical aggregate of a neighboring cell. The strong fluorescent signal in the stereocilia marked the arrival of the dye. This allowed us to measure the delay between arrival of the dye at the apical membrane and its internalization to give a signal in the apical endosome. The delay between stereocilial and endosomal signal was 20 sec (Fig. 4B,C). These figures imply that apical uptake operates on a time scale less than expected for clathrin-mediated endocytosis. To quantify the internalization rate in membrane area per second, we analyzed the increase in voxel intensity in a cross section of the apical endosome in three cells (two in situ experiments) during the dynamic phase of the apical signal (see Materials and Methods). The slope of this increase was calibrated against the voxel intensity produced by a known area of membrane (in square micrometers), allowing the calculation of the internalization rate in square micrometers per second. The data indicate that the membrane uptake rate was 5.6 ± 1.0 μm2/sec (n = 3) under conditions when the apical membrane was bathed in perilymph. Based on an estimated total surface area of an IHC of 1100 μm2, we estimate that the apical uptake rate corresponds to ∼0.15% of the entire surface being recycled every second. By summing all fluorescent voxels in IHCs, we calculate that, during steady state, the membrane area internalized is ∼5000 μm2 or 4.5 times the surface area of the cell.
Fig. 4.
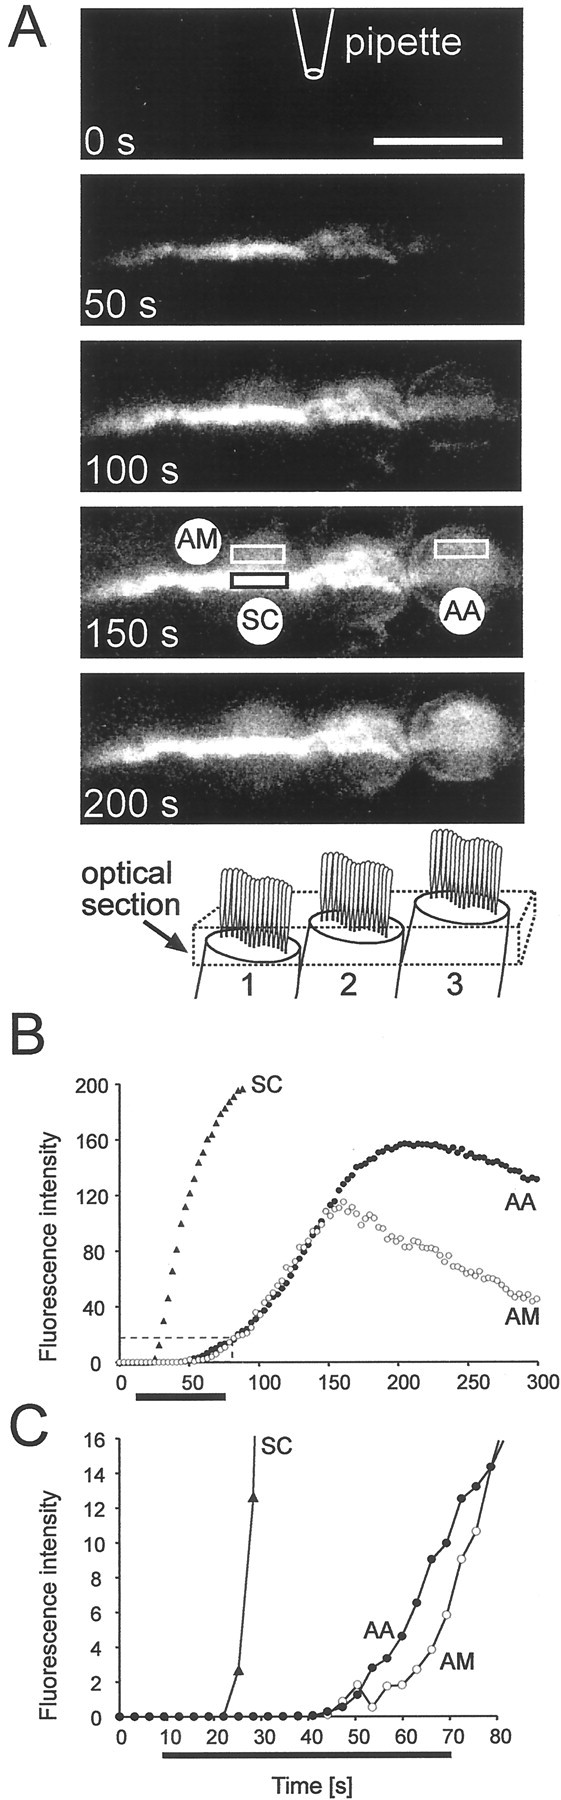
Apical endocytosis is fast. A, A time series of images of three IHCs in a strip preparation of the organ of Corti. The optical section is shown in the schematic (not drawn to scale). In cells 1 and 2, both external and internal structures are visible. In cell 1, the stereocilia (SC) and part of the apical aggregate (AM) are visible. In cell 3, the sections cuts only through the apical aggregate (AA).Boxes indicate the dimension of ROIs for B and C. The application pipette was located 40 μm above the apical membrane.B, Time course of fluorescence intensity of the ROIs depicted in A. FM1-43 is applied for 60 sec starting att = 10 sec. The SC fluoresced intensely because of their large membrane surface and served as a time marker for the dye arrival. After a delay of ∼20 sec, the apical aggregate of cell 2 showed signal, indicating internalization of FM1-43. The signal of AA is not caused by signal spillover from the stereocilia because the time course of AA is similar to that in area AM of cell 1, located adjacent to the stereocilia. C, Extended representation of the first 80 sec, as indicated by the dashed box inB. Identical experiments were performed in the in situ preparation.
Apical uptake depends on calcium
In the intact cochlea in vivo, the apical membrane of hair cells faces endolymph. To determine whether the dye uptake was influenced by the ionic composition of the apical bathing medium, we compared the uptake in the in situ preparation in endolymph (i.e., 140 mm K+ and 23 μm Ca2+) and in perilymph (i.e., 4.6 mmK+ and 1.5 mmCa2+). The fluorescent steady state was enhanced in perilymph with signals in both apex and base increased by a factor of 3 (Fig. 5A). Changing Ca2+ alone from endolymph levels (23 μm) to perilymph levels (1.5 mm) at constant K+concentration (4.6 mm) also increased both apical and basal fluorescence by a factor of 3 (Fig. 5B). Reducing the K+ from 140 to 4.6 mm at constant extracellular Ca2+ (1.5 mm) increased FM1-43 uptake by a factor of only 1.3 (data not shown). Thus, apical endocytosis was dependent mainly on external calcium levels.
Fig. 5.
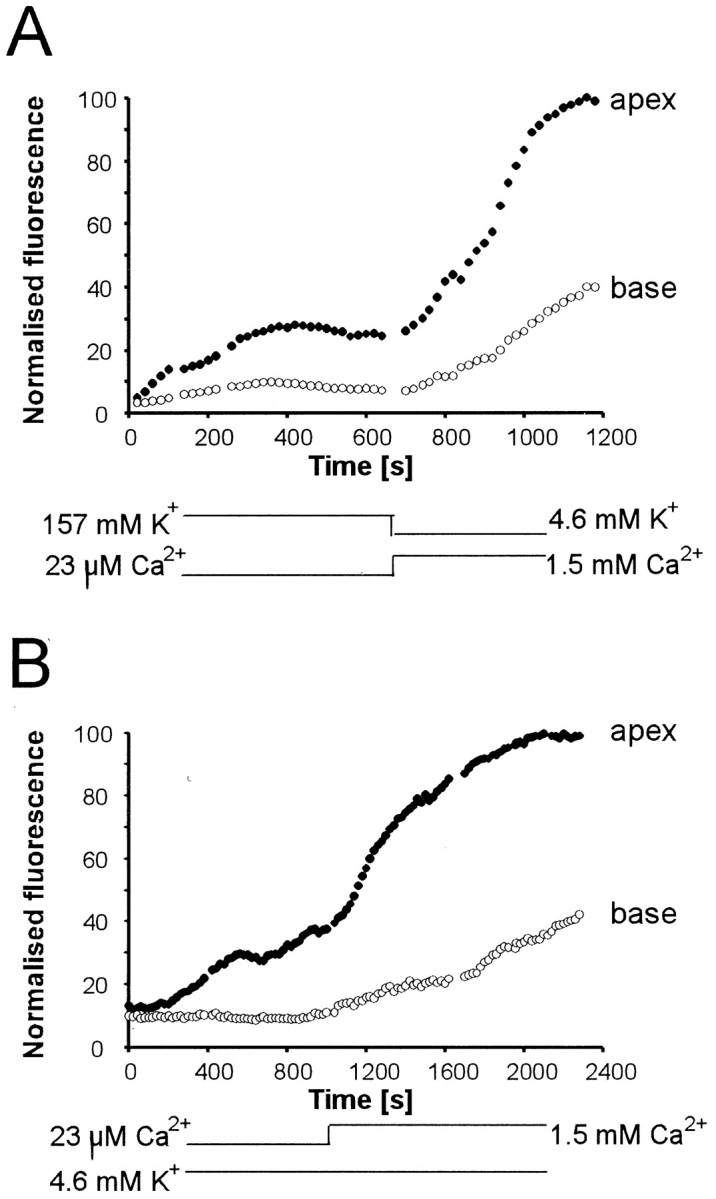
Apical endocytosis depends on external calcium. Two-photon imaging of IHCs in the in situ preparation show fluorescence from an ROI at the apex (solid circles) and base (open circles) of IHCs. FM1-43 is applied to scala media compartment at t = −50 sec (A) and t = 0 sec (B) and present throughout the rest of the experiment. A, Uptake was greater in perilymph than in endolymph. Increase in Ca2+ indicated below.B, The enhancement was caused by the relative increase of Ca2+ in perilymph. The experiment also shows that apical endocytosis is not an artifact produced by perilymph surrounding the apical membrane.
Apex-to-base shift of fluorescence depends on kinesin-mediated trafficking
Transport of vesicles along microtubules is achieved by molecular motors such as kinesins (Goldstein and Yang, 2000). Because IHCs have an extensive network of microtubules stretching from the apex to the base (Steyger et al., 1989; Furness et al., 1990), kinesins are potential candidates for the observed apex-to-base trafficking of labeled membrane. At high magnification, threadlike structures were apparent, which connected the apical or perinuclear region with the basal aggregate (Fig.6A). As the signal increased with time in the basal region (Fig. 2), we wondered how apically internalized membrane gets trafficked to the base. We tested whether kinesins were involved in this trafficking by using monastrol, a membrane-permeable inhibitor of kinesin Eg5 (Mayer et al., 1999). In comparison with controls, monastrol (50 μm)-treated IHCs showed reduced fluorescence intensities in their basal synaptic zone, including the basolateral hotspots (Fig. 6B–D). Whereas the steady-state base-to-apex fluorescence intensity ratioFb/Fain controls was 0.72 ± 0.09 (SD; n = 5) (Fig.6B), the average ratio in monastrol-treated cells was 0.20 ± 0.03 (n = 7) (Fig. 6C). The absolute fluorescence intensities in the apex in the steady state were increased slightly after monastrol treatment, consistent with less signal being transferred out of the apical region to the basal region. Consequently, the kinetics of signal rise in the apex were accelerated compared with controls (Fig. 6B,C). A clear reduction in the fluorescence of the basal compartment could be seen by reconstructing the cell profile from z-sections of the two-photon experiments (Fig. 6E).
Fig. 6.
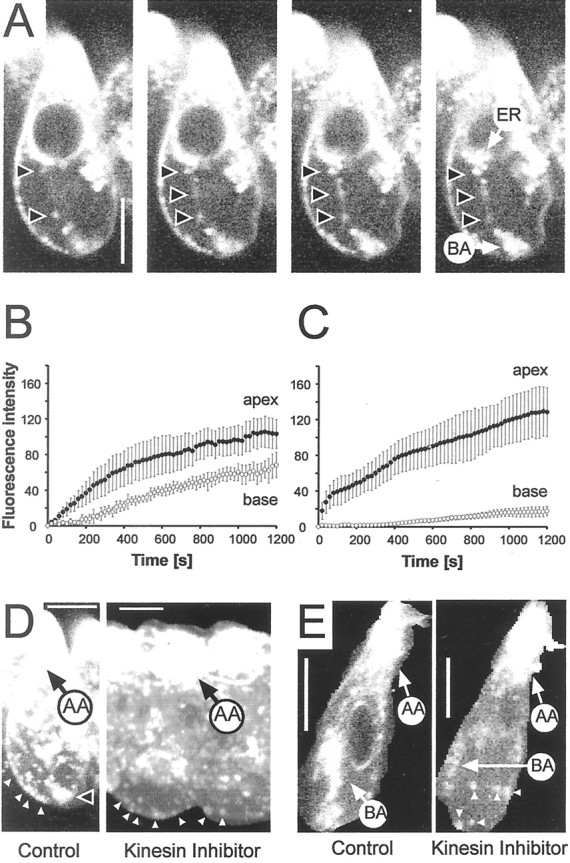
Apex-to-base trafficking of internalized membrane is inhibited by monastrol, a kinesin inhibitor. A, Four consecutive z-sections of an IHC in the in situ preparation taken by two-photon imaging.Arrows show particle structures extending from the perinuclear region to the basal aggregate. Scale bar, 10 μm.B, Controls show the normal rise of apical and basal signals during continuous application of FM1-43. Data from six cells were averaged; error bars show SD. C, Averaged fluorescence intensity over time for seven cells that had been treated with 50 μm monastrol, a kinesin inhibitor, in the bath. Imaging parameters were identical to those in controls. The increase in the basal signal was strongly attenuated. In the steady state the apical signal was increased compared with controls. D, 3-D reconstruction of IHCs shows the hotspots (arrows) at the basal pole remained in the presence of monastrol, although the region between the nucleus and the basal region was largely devoid of fluorescent signal. In contrast, fluorescence intensity of the apex (AA) was increased. E, Single sections through the midnuclear level of control and monastrol-treated IHCs show a strong signal in the apex (AA) and basal aggregate (BA), whereas the basal aggregate was only weakly labeled in a monastrol-treated cell.
Net apical uptake exceeds basolateral uptake
To investigate the time course of relative apical and basolateral uptake rates, we used strips of isolated intact organ of Corti. In this preparation, both apical and basolateral membranes were accessible to FM1-43. The signal increase therefore resulted from the combined effects of apical and basolateral uptake. To distinguish between the two uptake rates, strips were placed with either their apical or their basal side up in a perfusion chamber (Fig.7). FM1-43 was applied for 90 sec with a puffer pipette above the apical (Fig. 7A,C) or basolateral plasma membrane (Fig. 7B,D).
Fig. 7.
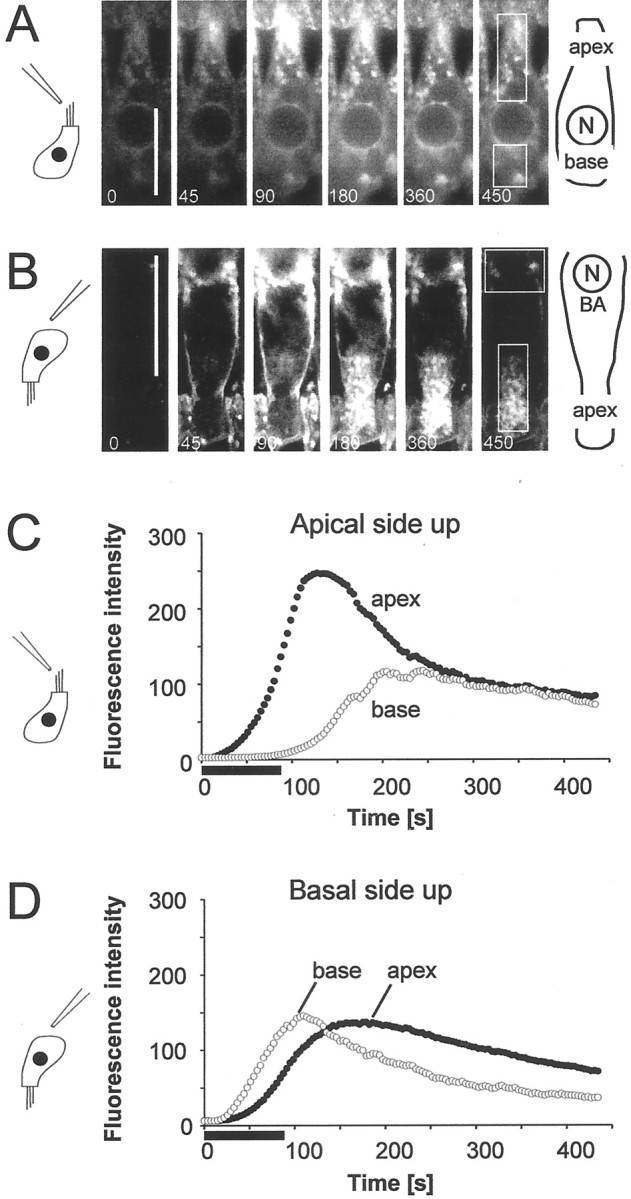
FM1-43 is taken up through the basolateral membrane. Using IHCs in a strip of organ of Corti, FM1-43 was applied as a 90 sec pulse either from the apical side (A, C) or from the basal (B, D) side of the tissue. Cells were visualized by conventional confocal microscopy. The ROIs for the apical and basal regions are shown in the image sequence (A, B). Applied from the apical side, the signal increased in the apical structures (filled circles) before it appeared in the basal structures (open circles). When applied from the basal side, signal appeared first in the basal compartment but increased rapidly in the apex because of fast apical endocytosis. Scale bars, 20 μm.
When dye was applied from the apical side, the fluorescent signal first appeared in the apical region and then, with a marked delay, increased in basal structures (Fig. 7A,C). The delay between apical and basal fluorescence was 50 ± 19 sec (SD; n = 9). The delay was measured between the half peaks of apical and basal fluorescence. When dye was applied on the basal surface, signal was first visible in the basolateral membrane and then spread from the base to the apex (Fig. 7B,D). In this case the delay between basal and apical signal was 23 ± 16 sec (SD; n = 18). The significant difference shows that, although apical uptake produced a larger fluorescent signal, FM1-43 was also taken up across the basolateral membrane.
An estimate of relative IHC basolateral uptake rate can be made by comparing the data from two types of experiment (Fig.8). In the in situpreparation, the FM1-43 signal increased first in the apical aggregate, then in the perinuclear endoplasmic reticulum, and finally in basal structures (Fig. 8A,B). In contrast, in organ of Corti strips, the signal increased more nearly simultaneously in spatially separated structures along the cell axis (Fig.8C,D), indicating access and uptake from both apical and basolateral membranes. By normalizing the rate of rise the apical fluorescent signal in the two cases, the relative contribution of uptake from the basolateral membrane alone can be calculated. Uptake from the basolateral membrane significantly accelerated the onset of the basal signal (Fig. 8E). By solving the bottleneck model (see ) for the fluorescence solutionsFa(t),Fb(t), we estimate that the ratio of basal to apical uptake rates (kob/koa) was not >0.15. Thus apical uptake was at least seven times greater than basal uptake.
Fig. 8.
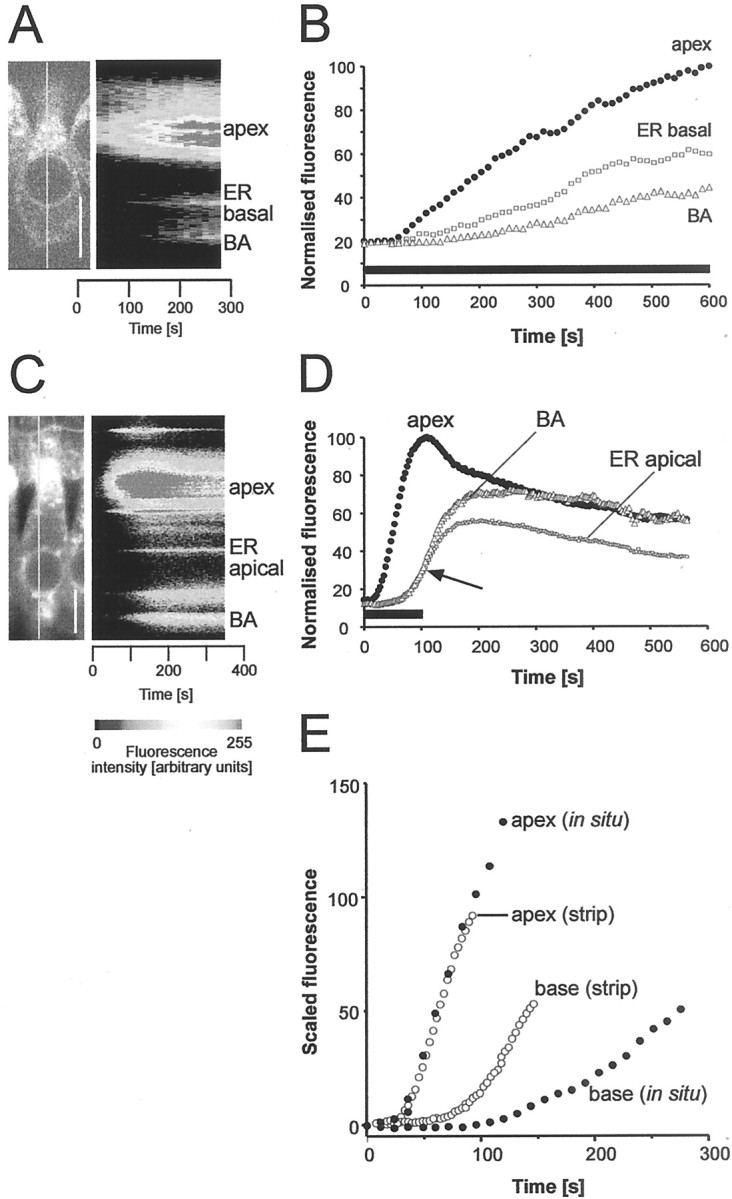
Comparison of in situ and strip preparations reveals basolateral endocytosis. Uptake rates of IHCs ofin situ (A, B) organ of Corti and excised strips (C, D). A, Two-photon image of an IHC in the intact organ of Corti during application of FM1-43 (start,t = 0). Line indicates position of line for line image shown to the right.B, Time series of ROI fluorescence. The rise of the signal in the basal aggregate was delayed relative to that of the apex.C, Confocal image of IHC in strip preparation during 100 sec exposure to dye. The intensity along the line shown is displayed as a pseudocolored line scan on the right.D, Time series of the intensities for the associated ROIs. The arrow indicates simultaneous rise of fluorescence signal in spatially separated structures along the apex-to-base axis of the IHC. E, Comparison of data shown in B and D with apical signals scaled to the same initial slope. Time axis is that ofD. Solid circles, FM1-43 applied to apical membrane only (from B); open circles, FM1-43 signal (from D) with apical and basolateral membrane accessible to dye. Scale bars: A, C, 10 μm.
In experiments using strips of the organ of Corti in which dye had access to both apical and basolateral membranes, supporting cells such as Deiter's cells and inner and outer pillar cells also took up dye (Fig. 7A,B). In the in situ experiments, in which only apical membranes were accessible to the dye, no such uptake was apparent (Fig. 2). Therefore, supporting cells retrieve membrane mainly from the membranes that do not face scala media.
Decay of basolateral fluorescence is accelerated by potassium-induced depolarization
To investigate whether apical endocytosis was dependent on depolarization of the IHC, we first analyzed whether depolarization with 40 mm K+ altered the rate of fluorescence decay. This K+concentration depolarized IHCs by 40 mV under patch clamp (data not shown). From rest, the membrane potential attained was sufficient to open L-type calcium channels, which activate at approximately −45 mV in adult guinea pig IHCs (Griesinger and Ashmore, 2001). It might be expected that the consequent exocytosis should have resulted in increased loss of fluorescence in the synaptic compartment of IHCs. IHCs in strips were labeled with a pulse of FM1-43 before (1), during (2), and after (3) stimulation with 40 mm K+ containing external solution (Fig. 9A). The decay of fluorescence in both control solutions (prestimulus control and washout) had exponential decay time constants of 150 sec, compared with 80 sec during depolarization. Depolarization accelerated the loss of basolateral fluorescence. The decay time constants, calculated by fitting the decay of the fluorescence signal with a single exponential function, were on average 152 ± 30 sec (SEM;n = 6) for controls and 97.8 ± 8.1 during depolarization. Washout controls had slightly longer time constants (187 ± 7.8 sec) than prestimulation controls, presumably because of an accelerated apical uptake after K+depolarization (see below).
Fig. 9.
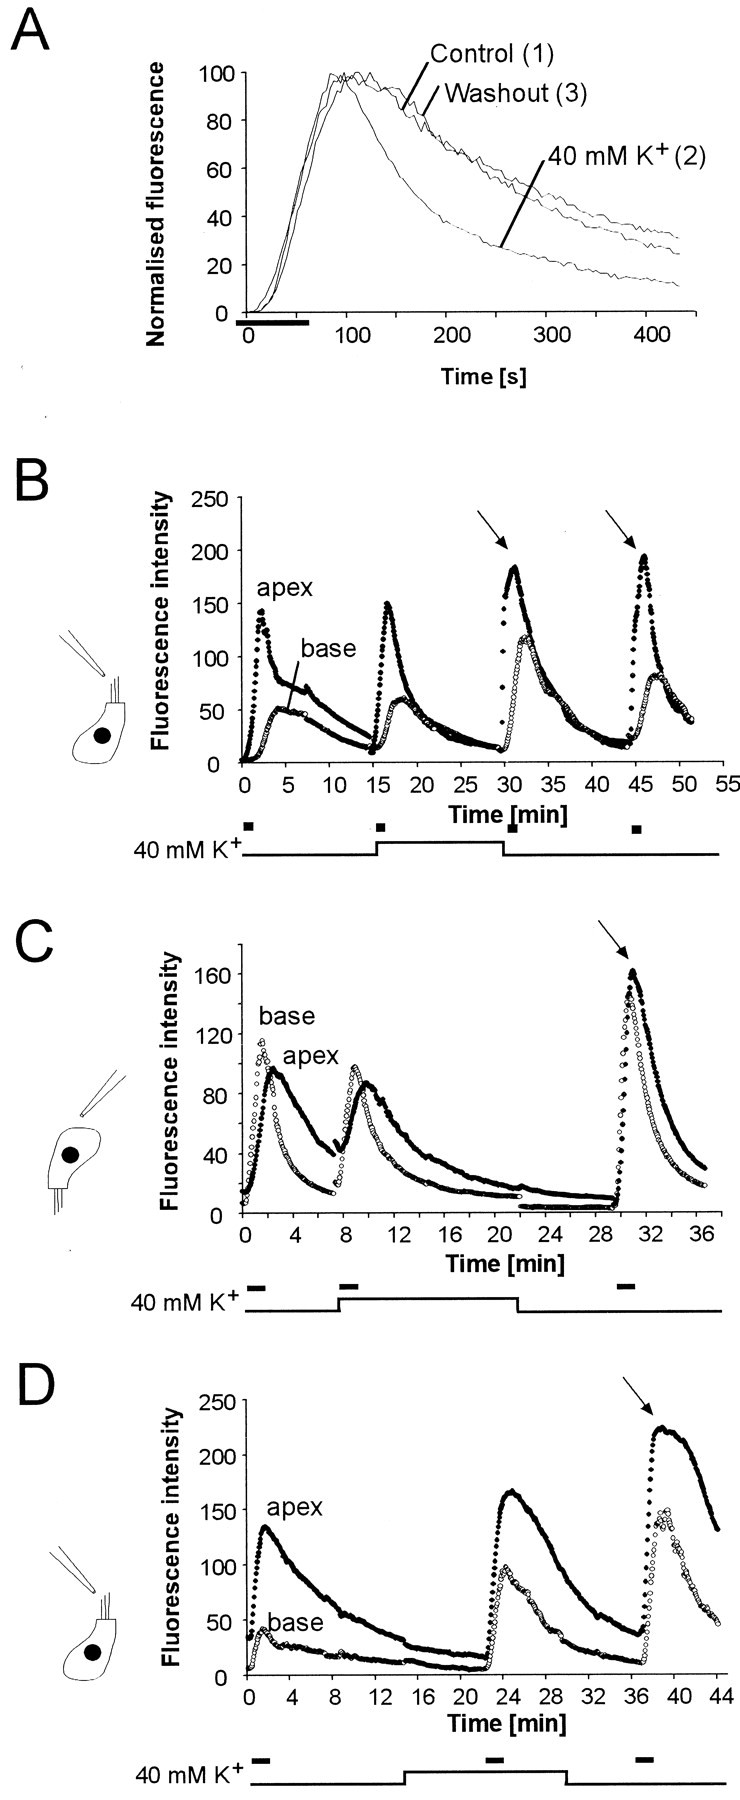
K+ depolarization accelerates loss of fluorescence from the base of IHCs and increases apical endocytosis. A, Fluorescence signals in IHC before, during, and after depolarization with 40 mmK+. Data are from three consecutive experiments performed in a strip of the organ of Corti. FM1-43 is applied att = 10 sec for 70 sec first in normal extracellular solution (1), then in depolarizing solution containing 40 mm K+(2), followed by dye application in control solution after washout (3). The fluorescence of each trace was normalized. The decay rate of basolateral fluorescence was accelerated compared with the pre- and post-K+ controls.B–D, K+ depolarization accelerates apical endocytosis. Confocal imaging of IHCs used to measure fluorescence signals at apex (filled circles) and base (open circles). FM1-43 was applied for 60 sec (B) or 90 sec (C, D), as indicated by the stimulus bar. Time course of fluorescence when FM1-43 was applied apically (B, D) and basally (C). The endocytosis rate during potassium stimulation was unchanged (B), decreased (C), or increased (D). In all experiments performed (9 cells), there was a marked increase of apical endocytosis on return to control solution containing 4.6 mm K+ (Fig. 10C).
Apical endocytosis is increased after depolarization of IHCs
We determined whether the rate of apical endocytosis, reflected in the fluorescence intensity produced by a precisely timed pulse of the dye, was altered by depolarization of IHCs (Fig. 9B–D). Endocytosis in IHCs of strips of organ of Corti was studied before, during, and after depolarization of the cells with 40 mm K+. In all experiments we observed a significant increase in FM1-43 uptake when K+ was returned to normal extracellular levels (4.6 mm) (Fig. 9B–D, arrows). In some cases the enhancement of apical endocytosis lasted for >10 min (Fig. 9B, two pulses after depolarization). The increase of apical endocytosis was observed irrespective of whether the dye was applied to the base or to the apex of the cells. After K+ depolarization, the subsequent apical FM1-43 signal increased by a factor of 1.93 ± 0.3 (SEM;n = 9; p < 0.01). The basal fluorescence increased by 1.32 ± 0.16. Surprisingly, during K+ depolarization there was no consistent change in the apical and basal signals.
Blocking calcium channels during depolarization blocks the acceleration of apical endocytosis
To determine whether the observed increase in apical endocytosis (Fig. 9) was linked to the increased exocytosis during K+ depolarization (Fig. 8), we blocked the voltage-gated calcium channels of IHCs with either 100 μmcadmium (Cd2+ ions) (Fig.10A) or 10 μm nimodipine (Fig. 10B) during the depolarizing K+ stimulus. The decay of fluorescence in the basal compartment was blocked in the presence of Cd2+ and slowed by nimodipine. However, both Cd2+ (n = 3) and nimodipine (n = 7) abolished the enhancement in apical uptake. The increase in the apical uptake rate was completely eliminated by Cd2+ and markedly reduced by nimodipine. The results of the experiments are summarized in Figure10C. Because both drugs at the stated concentrations lead to a block of L-type calcium channels in adult IHCs (Griesinger and Ashmore, 2001), the data are consistent with the hypothesis that activity-dependent exocytosis of synaptic membranes triggers increases uptake at the apex of the cell.
Fig. 10.
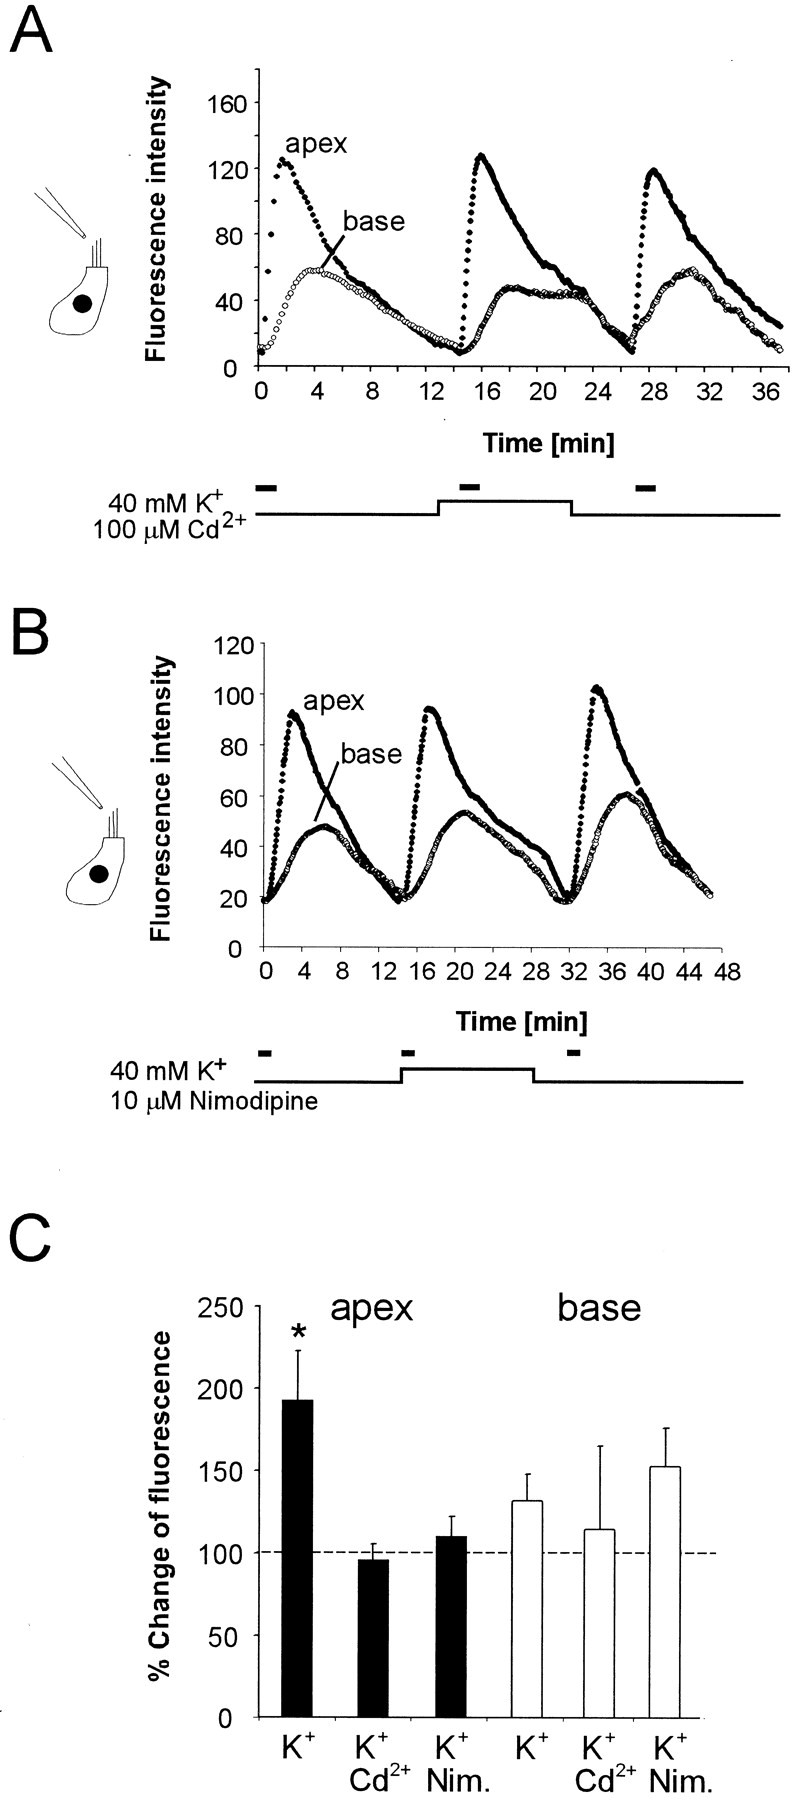
Increase of apical endocytosis is sensitive to L-type Ca2+ channel blockers. The experimental design was the same as in Figure 9 but with 100 μmCd2+ (A) and 10 μm nimodipine (B) in the bath during stimulation of the cells with extracellular solution containing 40 mm K+. In both experiments, FM1-43 was applied on the apical surface for 90 sec (solid bar). A, Average fluorescence intensity for three cells. The washout of signal from the basal compartment was slower when cells were bathed in depolarizing solution containing 100 μm Cd2+. Inclusion of Cd2+ abolished the delayed increase of the apical endocytosis. B, Average fluorescence intensity of seven cells, stimulated with high K+ external solution containing 100 μm nimodipine. Presence of nimodipine abolished the delayed increase of the apical endocytosis.C, Bar graph showing the increase of apical (solid bars) and basal (open bars) fluorescence signals after K+ depolarization and the reduction of the enhancement to control levels in the presence of Cd2+ and nimodipine during K+-induced depolarization. Peak fluorescence intensity of the FM1-43 signal is normalized to the peak fluorescence of the FM1-43 signal before depolarization.
Depolarizing the basolateral membrane in situinduces loss of hotspot fluorescence
To test whether the basolateral hotspots (Figs.2B, 6D) represented pools of vesicles associated with synaptic release sites, we electrically stimulated IHCs in situ by passing current across the epithelium. The configuration of the stimulus pipette is shown schematically in Figure11A. At the beginning of this experiment FM1-43 (5 μm) was bath-applied for a period appropriate to yield labeling of basolateral hotspots, typically for ∼200 sec. A 50 μmconcentration of monastrol was then applied to the bath to retard further membrane trafficking from apex to base. Without stimulation, the signal in the hotspots decreased only slightly (Fig.11B, first two frames), and this could be attributed to photo bleaching. Current passed across the partition produced by a rapid loss of fluorescence immediately after the onset of stimulation. There was a further decrease of fluorescence during stimulation (Fig.11B). The maximum loss of fluorescence was 20% of prestimulus level (Fig. 11C) (n = 8 cells). Other structures such as the apical aggregate did not show de-staining on electrical stimulation. Electrical stimulation therefore induced a loss of fluorescence signal selectively in basolateral hotspots.
Fig. 11.
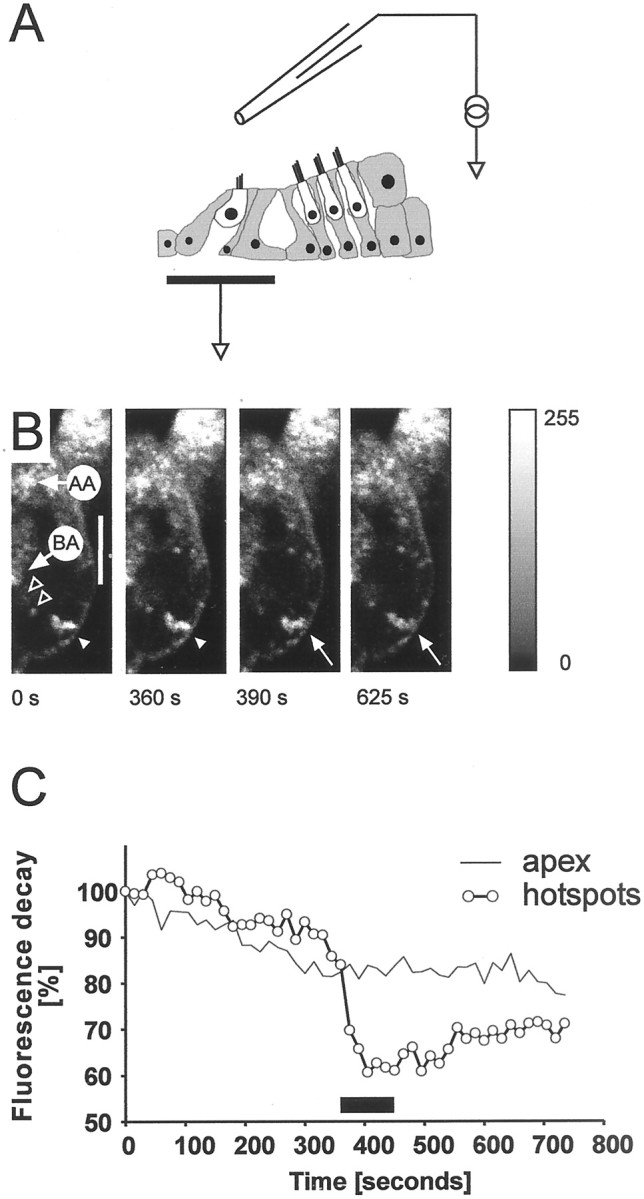
Transepithelial stimulation selectively destains FM1-43-labeled hotspots. A, Diagram showing position of the stimulating pipette. B, Series of images through an inner hair cell labeled with FM1-43. Dye was applied for 30 min before the start of the imaging and 50 μm monastrol for 20 min before the start. The IHC shows the distinctive FM1-43 labeling pattern with AA and hotspots (white arrowhead). With no transepithelial stimulation (from t = 0–375 sec), hotspot fluorescence did change. With anodal pulses (250 μA at 20 Hz from 375–450 sec), fluorescence in the hotspots decreased (arrow). Fluorescence in the AA was unaffected. Scale bar, 10 μm. C, Decay of fluorescence in hotspots and apex after transepithelial stimulation. Average of eight cells (2 experiments). Stimulation (same parameters as in B) leads to a significant decay in fluorescence in the hotspots within 15 sec after onset of the electrical pulses. AA showed only bleaching caused by repeated scanning. Interval between scans, 15 sec.
A simple model can simulate the data
A simple two compartment bottleneck model provides an economical description of many features of the data. Although it ignores as a first approximation the uptake delays described in Figure 3 on a scale of 10 sec, it provides an good quantitative description of the data on the time scale of 100 sec. The model and simulations based on it are shown in Figure 11. In the model, a concentration of FM1-43 is applied extracellularly at the apex (Ca) or base (Cb) of the cell. The concentration (and, by assumption, the fluorescence) of the dye in the apical and basal compartments is signified byFa(t) andFb(t), respectively. Comparing the simulations with the experimental data (Fig.2D,E) shows that the model gives a reasonable fit to both stepped and pulsed applications of FM1-43 (Fig.12B,C). Reduction of the apex-to-base transfer rate correctly predicts the time course and steady-stateFb/Faratio of fluorescence for the experiments (Fig. 5) in which apex-to-base trafficking was retarded by blocking kinesins (Fig.12B, dashed lines).
This model contains six rate constants of which four are independent. In this model, dye entering the apical surface characterized by a ratekoa is transferred to the base with a first order rate constant kab. The data below show that in all cases the apical uptake ratekoa is at least an order of magnitude larger than the other rate constants of the system. The computational details of the model are given in the .
When dye is applied continuously to the apical surface, the ratio of basal to apical fluorescence at steady state (i.e., att = ∞) is given by:
| Equation 1 |
The data in Figure 1 shows thatFb/Fa= 0.6. Thus, the apex-to-base transfer rate (kab) is smaller than the combined rates of base-to-apex transfer (kba) and basolateral exocytosis (kbo) by a factor of 1/0.6 = 1.7. The data presented in Figure 8 show that the basal exocytosis rate kbo can be independently manipulated. At short times (i.e., as t→0),
| Equation 2 |
and hence the rate constant of transfer from the apical to the basal compartment can be determined. From the data of Figures 1 and 7, we estimate the transfer rate kab = 0.035 sec−1. The apical uptake rate constant koa (Fig. 12) was therefore 6.3 × 10⁴m−1 s−1.
DISCUSSION
Using two-photon imaging of the membrane marker FM1-43, we find that adult mammalian IHCs rapidly internalize membrane at their apical pole. Because a fluid phase marker of endocytosis produces a similar pattern of labeling, the data are consistent with FM1-43 labeling the endocytotic membrane retrieval. In IHCs, membrane is rapidly internalized at a rate of ∼1.6 μm2/sec, accumulates first in an apical endosome, and is subsequently trafficked to the synaptic zone. Depolarization accelerates the decay of fluorescence in the synaptic basal zone of the hair cell. This activity-dependent exocytosis triggers increased apical endocytosis. Blocking calcium channels inhibits exocytosis and abolishes the enhancement of apical endocytosis. Apical endocytosis is therefore regulated by basolateral exocytosis. It might represent a form of “rapid endocytosis” that compensates for phases of high activity, as described in neurons (Klingauf et al., 1998) and in endocrine cells (Henkel and Almers, 1996; Smith and Neher, 1997).
Why should IHCs use apical endocytosis for activity-dependent retrieval of membrane? It has long been appreciated that IHCs feature high release rates even in absence of acoustic stimulation (Sewell, 1984). To avoid depletion of membrane pools and disruption of presynaptic architecture, IHCs require efficient membrane recycling. Evidence for basolateral recycling has been obtained by electron microscopy of horseradish peroxidase uptake in vivo (Siegel and Brownell 1986; Leake and Snyder, 1987). The marker was internalized, transported to the apex, and exocytosed there (Leake and Snyder, 1987). Additionally, endocytotic compartments and synaptic vesicles were labeled. Even after prolonged acoustic stimulation, few synaptic vesicles per release site were labeled (Siegel and Brownell, 1986). Thus, a high proportion of synaptic vesicles in IHCs are not derived from basolaterally recycled membrane but from precursor vesicles. Precursor vesicles help maintain adequate vesicle pools at the synapse (Calakos and Scheller, 1996). They are produced by the Golgi complex (Bauerfeind and Huttner, 1993), which is located in the apical zone of IHCs. There is, however, no Golgi complex in the basal synaptic zone of IHCs where their cytoplasm is filled with an abundance of vesicles of the size of synaptic vesicles (Spicer et al., 1999). The likely source of precursor vesicles for IHC release sites is therefore the apical Golgi complex. We propose that adult IHCs use fast apical membrane retrieval and trafficking to refill vesicular membrane pools in their basal synaptic zone. Several lines of evidence support this hypothesis.
Electron microscopic studies have described an abundance of endocytotic pits and vesicles at the apical membrane of hair cells (Forge and Richardson, 1993; Hasson et al., 1997; Kachar et al., 1997; Richardson et al., 1997; Seiler and Nicolson, 1999). Although some of the vesicles and pits are coated, many are not (Kachar et al., 1997), indicating that conventional clathrin-mediated and other forms of endocytosis co-exist. Our data are consistent with apical endocytosis in IHCs being rapid and non-clathrin-mediated (Fig. 3).
Changes of cell capacitance associated with synaptic activity in frog saccular hair cells have suggested that hair cells are specialized for rapid replenishment of vesicles because these cells can sustain release rates of 10,000 vesicles/sec for up to 2 sec (Parsons et al., 1994). Using the same method, a maximal rate of 28,000 vesicles/sec was estimated in mouse IHCs (Moser and Beutner, 2000). However, even after sustained potassium depolarization, hair cell vesicular pools are not depleted (Lenzi et al., 1999). Hair cells, therefore, must have fast replenishment rates, in turn necessitating fast rates of membrane recycling. By exploiting the restricted focal volume of two-photon microscopy, we estimate that the apical uptake rate is ∼5.6 μm2/sec, which is equivalent to 700 vesicles/sec of 50 nm diameter or 2100 vesicles/sec of 30 nm. Both of these vesicle populations have been reported in hair cells (Kachar et al., 1997). Hair cell synaptic vesicles have a diameter of ∼30 nm. After stimulation, the synaptic vesicle pool in IHCs recovers at a maximal rate of 1200 vesicles/sec (Moser and Beutner, 2000). The internalization of 2100 vesicles/sec, suggested by our data, would therefore be sufficient to account for phases of high vesicular release because both apical internalization and apex-to-base transport are continuous and might ensure supply of maturing and eventually releasable vesicles on long time scales. These estimates therefore suggest that, by apical endocytosis alone, IHCs recycle their surface membrane every 3 min and their apical membrane every 35 sec. This figure exceeds the membrane turnover in bipolar cells, which recycle the membrane at their synaptic terminal every 2 min (Rouze and Schwartz, 1998). We note that such high rates of apical endocytosis must be matched by a comparable rate of exocytosis at the apical membrane. The data of Figures 1 and 6 are consistent with apical exocytosis.
We find that apically internalized membrane is actively trafficked to the base of IHCs by kinesins, which are involved in endocytotic vesicle sorting (Bananis et al., 2000) and trafficking of endocytotic vesicles in epithelial cells (Bomsel et al., 1990). Here, inhibition of kinesins did not impair endocytotic uptake at the apex but reduced apex-to-base trafficking. Such apex-to-base transport is reminiscent of vesicular transport in neurons along microtubules. Moreover, vesicles in the apical zone of hair cells from frog, chicken, and guinea pig have been found attached to microtubules, suggesting that vesicular trafficking does originate from the apical zone (Kachar et al., 1997). The target of this trafficking appear to be the basolateral hotspots (Fig. 5), which correspond spatially to the release sites of IHCs. Basolateral hotspots were not observed in outer hair cells, which possess far fewer synaptic contacts and synaptic vesicles than IHCs (Siegel and Brownell, 1981; Liberman et al., 1990). We have also shown that electrical stimulation of IHCs in situ results in a specific loss of fluorescence in the hotspots (Fig. 11). A loss of FM1-43 fluorescence suggests an exocytotic event. As synaptic release involves exocytotic fusion of vesicles with the plasma membrane, the stimulation-induced loss in signal specifically in hotspots is likely to represent activity-dependent exocytosis in the course of synaptic release.
The rate of apical endocytosis appears to be tightly regulated by basal synaptic exocytosis (Figs. 8, 9). As depolarization of IHCs increased apical endocytosis (Fig. 9), IHCs may adjust apical endocytosis to higher retrieval rates to meet the demands of increased synaptic activity (Fig. 8) and thus compensate for periods of increased exocytotic activity. The increase in apical endocytosis after depolarization was reduced or abolished when Cd2+ or nimodipine, blockers of voltage-gated calcium channels, were present during depolarization (Fig. 10), i.e., increased phases of exocytosis (Fig. 9). This is consistent with data from capacitance measurements demonstrating that L-type Ca2+ channels, blocked by Cd2+ and nimodipine (Griesinger and Ashmore, 2001), mediate exocytosis in chick (Spassova et al., 2001) and mouse hair cells (Moser and Beutner, 2000).
Two studies have proposed that FM1-43 enters through the mechanotransducer channel of hair cell stereocilia (Nishikawa and Sasaki, 1996; Gale et al., 2001). Our data from adult mammalian IHCs, in contrast, indicate that FM1-43 uptake occurs via a fast endocytotic pathway for the following reasons. First, uptake was not affected by blockers of the transducer channel; second, treatment of the apical membrane with BAPTA, which breaks tip links and abolishes mechanotransducer currents (Assad et al., 1991), did not influence uptake kinetics; third, dye uptake is reduced when external Ca2+ is lowered. If FM1-43 permeated through the channel, it would compete with Ca2+ so that lowering Ca2+ should increase FM1-43 permeation; fourth, the uptake of the fluid phase endocytosis marker Lucifer Yellow is clear evidence that IHCs have endocytotic activity at their apical pole. This is consistent with FM1-43 internalization by endocytosis; fifth, we show that the apex-to-base distribution of FM1-43 is dependent on kinesins. This is difficult to reconcile with the hypothesis of FM1-43 permeating through the channel. Finally, the decay of fluorescence in preparations in which the basolateral membranes are superfused with bath solution and the activity dependency of that decay cannot be explained by passive permeation. It is also worth noting that the uptake kinetics of Gale et al., (2001) for developing cultured outer hair cells were much faster then those for IHCs presented here. On the basis of our data, we conclude that in adult IHCs FM1-43 uptake indicates endocytosis, and decay of FM1-43 fluorescence represents exocytosis.
We conclude that membrane retrieved from the apical pole of IHCs contributes to the membrane pools of the basal synaptic zone of IHCs. We suggest that IHCs regulate apical retrieval to maintain adequate vesicle populations at their synaptic zone. This would require cross talk between the base and the apex of the cells that might require a soluble factor to trigger endocytosis, as previously suggested on the basis of capacitance measurements (Parsons et al., 1994). Such a mechanism might be necessary in IHCs as the precise representation of timing and duration of sound stimuli requires extraordinary high transmission rates at synaptic release sites which are, unlike in neurons, not compartmentalized, but all concentrated in the relatively small soma of the hair cell.
The model shown in Figure 11 can be described quantitatively by a set of two coupled differential first order equations for the fluorescence values. F = (Fa,, Fb) in the apex and base compartments:
| Equation A1 |
where E = (Ea,, Eb) are the applied drug concentrations. The matrices H, G are given by:
| Equation A2 |
and the initial conditions are F = (0,0), corresponding to no fluorescence in the cells. For step applications of the drugs, the solution can be given explicitly as a sum of exponentials. We note that when the dye is applied only at the apical surface E =(Ea,0), there are only four independent variables. If the dye is applied continuously at the apex, the solutions for Fa andFb are characterized by two exponential rate constants, λ+(λ-) that are the solutions of the quadratic eigenvalue equation:
| Equation A3 |
Alternatively, the results can be graphed by direct numerical integration of A1. The most instructive limiting cases arise whent→∞ or at early times, t→0. The asymptotic solutions can be derived by taking the Laplace transform of A1 and then solving for F in the limits s→0 ors→∞ of the transform variable, s. The results are given as Equations 1 and 2 in the text.
Footnotes
This work was supported by the Medical Research Council and a Biotechnology and Biological Sciences Research Council Bioimaging Initiative Grant (C.D.R.). We thank Drs. M. Catsicas, D. McAlpine, and P. Mobbs for comments on this manuscript, and Dr. T. Kimitsuki for early discussions.
Correspondence should be addressed to Jonathan Ashmore or Claudius Griesinger, Department of Physiology, University College London, Gower Street, London WC1E 6BT, UK. E-mail: j.ashmore@ucl.ac.uk orc.griesinger@ucl.ac.uk.
REFERENCES
- 1.Assad JA, Shepard MG, Corey DP. Tip-link integrity and mechanical transduction in vertebrate hair cells. Neuron. 1991;7:985–994. doi: 10.1016/0896-6273(91)90343-x. [DOI] [PubMed] [Google Scholar]
- 2.Bananis E, Murray JW, Stockert RJ, Satir P, Wolkoff AW. Microtubule and motor-dependent endocytotic vesicle sorting in vitro. Cell Biol. 2000;151:179–186. doi: 10.1083/jcb.151.1.179. [DOI] [PMC free article] [PubMed] [Google Scholar]
- 3.Bauerfeind R, Huttner WB. Biogenesis of constitutive secretory vesicles, secretory granules and synaptic vesicles. Curr Opin Cell Biol. 1993;5:628–635. doi: 10.1016/0955-0674(93)90132-a. [DOI] [PubMed] [Google Scholar]
- 4.Betz WJ, Bewick GS. Optical monitoring of transmitter release and synaptic vesicle recycling at the frog neuromuscular junction. J Physiol (Lond) 1993;460:287–309. doi: 10.1113/jphysiol.1993.sp019472. [DOI] [PMC free article] [PubMed] [Google Scholar]
- 5.Bomsel M, Parton R, Kuznetsov SA, Schroer TA, Gruenberg J. Microtubule- and motor-dependent fusion in vitro between apical and basolateral endocytotic vesicles from MDCK cells. Cell. 1990;62:719–731. doi: 10.1016/0092-8674(90)90117-w. [DOI] [PubMed] [Google Scholar]
- 6.Calakos N, Scheller RH. Synaptic vesicle biogenesis, docking, and fusion: a molecular description. Physiol Rev. 1996;76:1–29. doi: 10.1152/physrev.1996.76.1.1. [DOI] [PubMed] [Google Scholar]
- 7.Forge A, Richardson G. Freeze fracture analysis of apical membranes in cochlear cultures: differences between basal and apical-coil outer hair cells and effects of neomycin. J Neurocytol. 1993;22:854–867. doi: 10.1007/BF01186357. [DOI] [PubMed] [Google Scholar]
- 8.Furness DN, Hackney CM, Steyger P. Organization of mictrotubules in cochlear hair cells. J Electron Microsc Tech. 1990;15:261–279. doi: 10.1002/jemt.1060150306. [DOI] [PubMed] [Google Scholar]
- 9.Gale JE, Marcotti W, Kennedy HJ, Kros CJ, Richardson GP. FM1-43 dye behaves as a permeant blocker of the hair-cell mechanotransducer channel. J Neurosci. 2001;21:7013–7025. doi: 10.1523/JNEUROSCI.21-18-07013.2001. [DOI] [PMC free article] [PubMed] [Google Scholar]
- 10.Glowatzki E, Ruppersberg JP, Zenner HP, Rüsch A. Mechanically and ATP-induced currents of mouse outer hair cells are independent and differentially blocked by d-tubocurarine. Neuropharmacology. 1997;36:1269–1275. doi: 10.1016/s0028-3908(97)00108-1. [DOI] [PubMed] [Google Scholar]
- 11.Goldstein LS, Yang Z. Microtubule-based transport systems in neurons: the roles of kinesins and dyneins. Annu Rev Neurosci. 2000;23:39–71. doi: 10.1146/annurev.neuro.23.1.39. [DOI] [PubMed] [Google Scholar]
- 12.Griesinger CB, Ashmore JF. The calcium current in inner hair cells of the adult guinea pig organ of Corti. Assoc Res Otolaryngol Abstr. 2001;24:237. [Google Scholar]
- 13.Hasson T, Gillespie P, Carcia J, Macdonald R, Zhao Y, Yee A, Mooseker M, Corey D. Unconventional myosins in inner-ear sensory epithelia. J Cell Biol. 1997;137:1287–1307. doi: 10.1083/jcb.137.6.1287. [DOI] [PMC free article] [PubMed] [Google Scholar]
- 14.Henkel A, Almers W. Fast steps in exocytosis and endocytosis studied by capacitance measurements in endocrine cells. Curr Opin Neurobiol. 1996;6:350–357. doi: 10.1016/s0959-4388(96)80119-x. [DOI] [PubMed] [Google Scholar]
- 15.Kachar B, Battaglia A, Fex J. Compartmentalized vesicular traffic around the hair cell cuticular plate. Hear Res. 1997;107:102–112. doi: 10.1016/s0378-5955(97)00027-0. [DOI] [PubMed] [Google Scholar]
- 16.Kilner JM, Ashmore JF. Staining pattern of isolated inner hair cells of he guinea pig cochlea using the fluorescent probe FM1-43. J Physiol (Lond) 1997;504P:P30–P31. [Google Scholar]
- 17.Kimitsuki T, Ohmori H. Dihydrostreptomycin modifies adaptation and blocks the mechano-electric transducer in chick cochlear hair cells. Brain Res. 1993;624:142–150. doi: 10.1016/0006-8993(93)90072-u. [DOI] [PubMed] [Google Scholar]
- 18.Klingauf J, Kavalali ET, Tsien RW. Kinetics and regulation of fast endocytosis at hippocampal synapses. Nature. 1998;394:581–585. doi: 10.1038/29079. [DOI] [PubMed] [Google Scholar]
- 19.Leake P, Snyder R. Uptake of horse radish peroxidase from perilymph by cochlear hair cells. Hear Res. 1987;25:153–171. doi: 10.1016/0378-5955(87)90088-8. [DOI] [PubMed] [Google Scholar]
- 20.Lenzi D, Runyeon JW, Crum J, Ellisman MH, Roberts WM. Synaptic vesicle population in saccular hair cells reconstructed by electron tomography. J Neurosci. 1999;19:119–132. doi: 10.1523/JNEUROSCI.19-01-00119.1999. [DOI] [PMC free article] [PubMed] [Google Scholar]
- 21.Lewis P, Lentz TL. Rabies virus entry into cultured rat hippocampal neurons. J Neurocytol. 1998;27:559–573. doi: 10.1023/a:1006912610044. [DOI] [PubMed] [Google Scholar]
- 22.Liberman MC, Dodds LW, Pierce S. Afferent and efferent innervation of the cat cochlea: quantitative analysis with light and electron microscopy. J Comp Neurol. 1990;301:443–460. doi: 10.1002/cne.903010309. [DOI] [PubMed] [Google Scholar]
- 23.Mamdouh Z, Giocondi M, Laprade R, Le Grimellec C. Temperature dependence of endocytosis in renal epithelial cells in culture. Biochim Biophys Acta. 1996;1282:171–173. doi: 10.1016/0005-2736(96)00077-6. [DOI] [PubMed] [Google Scholar]
- 24.Mammano F, Ashmore JF. Reverse transduction measured in the isolated cochlea by laser Michelson interferometry. Nature. 1993;365:838–841. doi: 10.1038/365838a0. [DOI] [PubMed] [Google Scholar]
- 25.Mayer TU, Kapoor TM, Haggarty SJ, King RW, Schreiber SL, Mitchison TJ. Small molecule inhibitor of mitotic spindle bipolarity identified in a phenotype-based screen. Science. 1999;286:971–974. doi: 10.1126/science.286.5441.971. [DOI] [PubMed] [Google Scholar]
- 26.Merchan-Perez A, Liberman MC. Ultrastructure differences among afferent synapses on cochlear hair cells: correlations with spontaneous discharge rate. J Comp Neurol. 1996;371:208–221. doi: 10.1002/(SICI)1096-9861(19960722)371:2<208::AID-CNE2>3.0.CO;2-6. [DOI] [PubMed] [Google Scholar]
- 27.Meyer J, Mack AF, Gummer AW. Pronounced infracuticular endocytosis in mammalian outer hair cells. Hear Res. 2001;161:10–22. doi: 10.1016/s0378-5955(01)00338-0. [DOI] [PubMed] [Google Scholar]
- 28.Moreaux L, Sandre O, Charpak S, Banchard-Desce M, Mertz J. Coherent scattering in multi-harmonic light microscopy. Biophys J. 2001;80:1568–1574. doi: 10.1016/S0006-3495(01)76129-2. [DOI] [PMC free article] [PubMed] [Google Scholar]
- 29.Moser T, Beutner D. Kinetics of exocytosis and endocytosis at the cochlear inner hair cell afferent synapse of the mouse. Proc Natl Acad Sci USA. 2000;97:883–888. doi: 10.1073/pnas.97.2.883. [DOI] [PMC free article] [PubMed] [Google Scholar]
- 30.Mundigl O, Matteoli M, Daniell L, Thomas-Reetz A, Metcalf A, Jahn R, De Camilli P. Synaptic vesicle proteins and early endosomes in cultured hippocampal neurons: differential effects of Brefeldin A in axon and dendrites. J Cell Biol. 1993;122:1207–1221. doi: 10.1083/jcb.122.6.1207. [DOI] [PMC free article] [PubMed] [Google Scholar]
- 31.Nishikawa S, Sasaki F. Internalization of styryl dye FM1-43 in the hair cells of lateral line organs in Xenopus larvae. J Histochem Cytochem. 1996;44:733–741. doi: 10.1177/44.7.8675994. [DOI] [PubMed] [Google Scholar]
- 32.Palmer AR, Russell IJ. Phase-locking in the cochlear nerve of the guinea-pig and its relation to the receptor potential of inner hair-cells. Hear Res. 1986;24:1–15. doi: 10.1016/0378-5955(86)90002-x. [DOI] [PubMed] [Google Scholar]
- 33.Parsons TD, Lenzi D, Almers W, Roberts WM. Calcium-Triggered exocytosis and endocytosis in an isolated presynaptic cell: capacitance measurements in saccular hair cells. Neuron. 1994;13:875–883. doi: 10.1016/0896-6273(94)90253-4. [DOI] [PubMed] [Google Scholar]
- 34.Rhode WS, Smith PH. Characteristics of tone-pip response patterns in relationship to spontaneous rate in cat auditory nerve fibers. Hear Res. 1985;18:159–168. doi: 10.1016/0378-5955(85)90008-5. [DOI] [PubMed] [Google Scholar]
- 35.Richardson GP, Forge A, Kros CJ, Fleming J, Brown SDM, Steel KP. Myosin VII is required for aminoglycoside accumulation in cochlear hair cells. J Neurosci. 1997;17:9506–9519. doi: 10.1523/JNEUROSCI.17-24-09506.1997. [DOI] [PMC free article] [PubMed] [Google Scholar]
- 36.Rouze NC, Schwartz EA. Continuous and transient vesicle cycling at a ribbon synapse. J Neurosci. 1998;18:8614–8624. doi: 10.1523/JNEUROSCI.18-21-08614.1998. [DOI] [PMC free article] [PubMed] [Google Scholar]
- 37.Seiler C, Nicolson T. Defective calmodulin-dependent rapid apical endocytosis in zebrafish sensory hair cell mutants. J Neurobiol. 1999;41:424–434. [PubMed] [Google Scholar]
- 38.Self T, Sobe T, Copeland NG, Jenkins NA, Avraham KB, Steel KP. Role of myosin VI in the differentiation of cochlear hair cells. Dev Biol. 1999;214:331–341. doi: 10.1006/dbio.1999.9424. [DOI] [PubMed] [Google Scholar]
- 39.Sewell WF. The relation between the endocochlear potential and spontaneous activity in auditory nerve fibers of the cat. J Physiol (Lond) 1984;347:685–696. doi: 10.1113/jphysiol.1984.sp015090. [DOI] [PMC free article] [PubMed] [Google Scholar]
- 40.Siegel JH, Brownell WE. Presynaptic bodies in outer hair cells of the chinchilla organ of Corti. Brain Res. 1981;220:188–193. doi: 10.1016/0006-8993(81)90224-9. [DOI] [PubMed] [Google Scholar]
- 41.Siegel JH, Brownell WE. Synaptic and Golgi membrane recycling in cochlear hair cells. J Neurocytol. 1986;15:311–328. doi: 10.1007/BF01611434. [DOI] [PubMed] [Google Scholar]
- 42.Smith C, Neher E. Multiple forms of endocytosis in bovine adrenal chromaffin cells. J Cell Biol. 1997;139:885–894. doi: 10.1083/jcb.139.4.885. [DOI] [PMC free article] [PubMed] [Google Scholar]
- 43.Spassova M, Eisen MD, Saunders JC, Parsons TD. Chick cochlear hair cell exocytosis mediated by dihydropyridine-sensitive calcium channels. J Physiol (Lond) 2001;535:689–696. doi: 10.1111/j.1469-7793.2001.00689.x. [DOI] [PMC free article] [PubMed] [Google Scholar]
- 44.Spicer SS, Thomopoulos GN, Schulte BA. Novel membranous structures in apical and basal compartments of inner hair cells. J Comp Neurol. 1999;409:424–437. [PubMed] [Google Scholar]
- 45.Steyger P, Furness DN, Hackney CM, Richardson G. Tubulin and microtubules in cochlear hair cells: comparative immunocytochemistry and ultrastructure. Hear Res. 1989;42:1–16. doi: 10.1016/0378-5955(89)90113-5. [DOI] [PubMed] [Google Scholar]
- 46.Wiederkehr A, Meier KD, Riezmann H. Identification and characterization of Saccaromyces cerevisiae mutants defective in fluid-phase endocytosis. Yeast. 2001;18:759–773. doi: 10.1002/yea.726. [DOI] [PubMed] [Google Scholar]