

Abstract
The hyperpolarization-activated excitatory currentIh shapes rhythmic firing and other components of excitability in differentiating neurons, and may thus influence activity-dependent CNS development. We therefore studied developmental changes in Ih and underlying hyperpolarization-activated cyclic nucleotide-gated (HCN) channel subunits in pyramidal neurons of neonatal mouse hippocampus using electrophysiological and immunofluorescence approaches.Ih conductance (at −80 mV) tripled in CA3 neurons and quintupled in CA1 neurons between postnatal day 1 (P1) and P20; parallel changes in membrane area resulted in current density maxima at P5 in CA3 and P10 in CA1. Concurrently,Ih activation times fell sevenfold in CA3 and 10-fold in CA1. A computational model indicates that a decrease inIh activation time will increase the rhythmic firing rate. Two mechanisms contributed to more rapidIh activation at P20 in CA3 and CA1 neurons: a fall in the intrinsic time constants of two kinetic components, τfast and τslow, to 35–40% (at −90 mV) of their P1 values, and a preferential increase in fast component amplitude and contribution to Ih(from ∼35% to ∼74% of total). HCN1, HCN2, and HCN4 immunoreactivities showed independent temporal and spatial developmental patterns. HCN1 immunoreactivity was low at P1 and P5 and increased by P20. HCN2 immunoreactivity was detected at P1 and increased steadily up to P20. HCN4 immunoreactivity was initially low and showed a small increase by P20. We suggest that developmental increases in Ih amplitude and activation rate reflect changes in the number and underlying structure ofIh channels, and thatIh maturation may shape rhythmic activity important for hippocampal circuit maturation.
Keywords: Ih, hyperpolarization-activated current, HCN channels, hippocampus, pyramidal neurons, development, immunofluorescence, patch clamp, whole-cell recording
Action potential activity emerges early in neural differentiation (Spitzer, 1979, 1994). As neurons mature, the character of these embryonic and neonatal action potentials changes (Spitzer and Lamborghini, 1976; Baccaglini and Spitzer, 1977), reflecting progressive maturation of underlying ionic currents (Barish, 1986; O'Dowd et al., 1988; Fedulova et al., 1998; Moody, 1998; Ribera, 1999; Spitzer, 2002). Later in development, intrinsic excitability together with emerging connectivity drives early patterned activity (Ben-Ari et al., 1989; Cherubini et al., 1991; O'Donovan, 1999;Garaschuk et al., 2000; Ben-Ari, 2001), which is intimately involved with synaptogenesis and circuit maturation (Goodman and Shatz, 1993;Desai et al., 1999; Zhang and Poo, 2001; Spitzer, 2002).
The generation of patterned electrical activity involves complex interactions between currents active near the resting potential (Hutcheon and Yarom, 2000), among which is the excitatory hyperpolarization-activated cationic currentIh (Pape, 1996). An increasing number of studies suggest that rhythmicity linked toIh activation contributes to the establishment and stabilization of neural circuits in the developing brain (Bayliss et al., 1994; Richter et al., 1997; Strata et al., 1997;Washio et al., 1999).
These observations suggest the importance of understandingIh differentiation during early CNS development. In the mature hippocampus,Ih is expressed in pyramidal (Halliwell and Adams, 1982; Maccaferri et al., 1993) and nonpyramidal (Maccaferri and McBain, 1996; Richter et al., 2000) neurons, where it contributes to the resting membrane potential and shapes hyperpolarizing events and rebound excitation (McCormick and Pape, 1990; Pape, 1996; Lüthi and McCormick, 1998; Magee, 1998, 1999;Doan and Kunze, 1999; Dickson et al., 2000; Williams and Stuart, 2000), thus regulating rhythmic electrical activity. It is also linked to pathological hyperexcitability (Di Pasquale et al., 1997; K. Chen et al., 2001).
The channels underlying Ih have the four subunit motif of many voltage-gated ion channels (Santoro and Tibbs, 1999), and four hyperpolarization-activated cyclic nucleotide-gated channel subunits have been identified: HCN1, HCN2, HCN3, and HCN4 (Ludwig et al., 1998; Biel et al., 1999; Santoro and Tibbs, 1999; Gauss and Seifert, 2000; Monteggia et al., 2000; Kaupp and Seifert, 2001). In the mature brain, HCN subunit transcripts show characteristic distributions (Santoro et al., 1997, 1998, 2000; Ludwig et al., 1998; Moosmang et al., 1999; Monteggia et al., 2000; Bender et al., 2001); in the hippocampus, both HCN1 and HCN2 mRNAs are strongly expressed in subsets of principal neurons and interneurons, whereas HCN4 is found at lower levels (Santoro et al., 2000; Bender et al., 2001). These transcripts display differing spatial and temporal developmental patterns (Santoro et al., 2000; Bender et al., 2001).
The ensuing changes in distributions of HCN subunit proteins, the molecular nature of the Ih channels synthesized, and variations in the functional properties ofIh during development are not well understood. In the present work we describe postnatal maturation ofIh and its underlying subunits in the mouse hippocampus and present, based on a computational model, some potential consequences for rhythmic activity. A preliminary account of some of these data has been published previously in abstract form (Vasilyev and Barish, 2001).
MATERIALS AND METHODS
Slice preparation. Acute brain slice preparations from Swiss–Webster mice at postnatal day 1 (P1) (where birth is at P0), P5, P9–P10, and P19–P20 were used for electrophysiological recordings and immunofluorescence studies. To prepare hippocampal slices, pups were anesthetized with halothane and decapitated; brains were removed, placed on an agar block, covered with agarose (5% in PBS, type IX-A; Sigma, St. Louis, MO), and cooled on ice. Coronal 400 μm slices were cut in ice-cold artificial CSF (ACSF) using a Vibratome, transferred to carbogen-bubbled ACSF, and left to recover for at least for 1 hr at 33.5°C. Slices were then kept in bubbled ACSF at room temperature until they were used. ACSF contained (in mm): 140 NaCl, 3 KCl, 26.5 NaHCO3, 1.25 NaH2PO4, 2 CaCl2, 2 MgCl2, and 20 glucose, bubbled with carbogen (5% CO2/95% O2). All procedures involving animals were in accordance with National Institutes of Health guidelines and were approved by the City of Hope Research Animal Care Committee.
Electrophysiology. Ih was recorded from visually identified hippocampal CA3 and CA1 pyramidal neurons in acute hippocampal slices using standard whole-cell techniques. Electrodes were pulled from borosilicate glass capillaries (TW150F; World Precision Instruments, Sarasota, FL). Pipette resistances for voltage-clamp experiments were 2–3 MΩ when filled with the intracellular solution and 15–20 MΩ for current-clamp experiments. The intracellular solution consisted of (in mm): 100 K-gluconate, 50 KCl, 5 MgCl2, 1 CaCl2, 5 EGTA, and 20 HEPES, pH adjusted to 7.4 with Tris-Cl. The extracellular solution for voltage-clamp experiments was ACSF as described above, except that the KCl concentration was increased to 10 mm to enhance Ih, TTX (1 μm) was added to suppress action potentials, and, in most experiments, AP-5 (20 μm), CNQX (20 μm) and bicuculline (10 μm) were added to block spontaneous synaptic events. To isolate Ih, BaCl2 (0.5 mm) was added to block inward-rectifier potassium currents (IK(ir)). For current-clamp experiments, TTX, AP-5, CNQX, bicuculline, or BaCl2 were not added to external solutions. Data were collected using an Axopatch 200B amplifier and digitized using a DigiData 1200 interface and pClamp8 software (all from Axon Instruments, Foster City, CA). Current traces were filtered at 1–2 kHz and digitized at 10 kHz. Series resistance was compensated by 50–70%. After calculation of whole-cell capacitance (discussed below), transients and leakage currents were partially electronically compensated during acquisition, subsequently subtracted using a trace acquired during a 5 or 10 mV hyperpolarization from −50 mV, and scaled as appropriate. Recordings were made at room temperature (22–24°C).
Whole-cell capacitance was estimated by integrating the current derived from a 5 or 10 mV negative-going step from −50 mV; within this range, all currents are linear with voltage. We used a consistent procedure to reduce errors that could derive from uncompensated leakage current and from long-lasting current tails reflecting distributed membrane capacitance. Briefly, we first averaged four traces, computed and removed leakage components, reset the current baseline, and then integrated the capacitance transient between the peak and a time approximately three times longer than that required for current to relax to 98% of the peak value, ∼10 msec for P1, 50 msec for P5, 100 msec for P10, and 120 msec for P20 neurons. In practice we did not observe long-lasting capacitative currents, and capacitance measurements did not show significant sensitivity to the duration of the integration period.
Data were analyzed using pClamp8 and Origin 6 (OriginLab, Northampton, MA). Statistical significance was evaluated by Student's t test or (as indicated) using Instat (GraphPad Software, San Diego, CA). Ihactivation kinetics and steady-state activation were analyzed as described in Results.
Immunofluorescence. Affinity-purified rabbit anti-HCN1 (AB5884), anti-HCN2 (AB5378), and anti-HCN4 (AB5808) antibodies were purchased from Chemicon (Temecula, CA). Brains from Swiss–Webster mice of appropriate ages were fresh frozen (−20°C on dry ice) in optimal cutting temperature compound (Sakura Finetek, Tokyo, Japan) and 20 μm horizontal sections were cut on a cryostat (Leica, Nussloch, Germany). Sections were fixed with 4% paraformaldehyde in 0.137m PBS, pH 7.4, for 20–30 min at 4°C, and then rinsed (three times, 15 min each) in PBS. Sections were permeabilized with 0.1% Triton X-100 (Sigma) in PBS containing 3% BSA and 5% normal goat serum for 1 hr at room temperature. Brain slices were then incubated for 12–14 hr at 4°C in primary antibody diluted at appropriate concentrations (1.5 μg/ml for anti-HCN1, 2.0 μg/ml for anti-HCN2, and 5.0 μg/ml for anti-HCN4 antibodies) in PBS with 3% BSA. After rinsing in PBS (three times, 20 min each), sections were incubated in fluorescein-conjugated goat anti-rabbit IgG (Zymed, South San Francisco, CA; diluted 1:100 in PBS containing 5% normal goat serum) for 1 hr at room temperature. Finally, sections were rinsed in PBS (three times, 20 min each) and mounted in Vectashield (Vector Laboratories, Burlingame, CA). Controls included omission of primary antibody and preincubation of primary antibody with appropriate antigen (4:1 μg of peptide per microgram of antibody) in PBS containing 3% BSA for 2 hr at room temperature.
Images were collected on a Zeiss (Thornwood, NY) 310 laser scanning confocal microscope using 10× air and 40× oil-immersion objectives. Montage acquisition software (written locally) was used to scan large brain areas. Each developmental series for a particular antigen was processed identically, and images were acquired using the same microscope acquisition parameters.
Computational model. The model CA1 neuron was implemented using software written locally in Visual Basic 6 (Microsoft, Seattle, WA). All currents except Ih were described using parameters published by Warman et al. (1994) for a single voltage-gated sodium current, two voltage-gated potassium currents (IA and a delayed rectifier), two Ca2+-dependent potassium currents (underlying slow and fast afterhyperpolarizations) and an M-type potassium current, in a 10 pF spherical cell. We added a voltage-gated hyperpolarization-activated current,Ih, incorporating fast and slow activation components. Ih was described by the equation Ih =Gmax m2(Vm −Eh), with the following age-varying parameters:
P1, fast component:
P1, slow component:
P20, fast component:
P20, slow component:
RESULTS
Contributions of Ih to intrinsic excitability
We used current-clamp recordings to examine two classical manifestations of the contributions ofIh to intrinsic excitability: the voltage sag seen during hyperpolarizing current injections and the subsequent rebound excitation.
A comparison of voltage behaviors in CA1 neurons of different ages is shown in Figure 1A. In P20 neurons, voltage sag was more pronounced and had faster onset than in P1 cells, and in older neurons, rebound excitation after hyperpolarization to identical membrane potentials was more pronounced. Note that in comparison with P1 neurons, ∼10 times as much current was required at P20 to produce a similar shift in membrane potential. The enhanced voltage sag and presence of rebound firing at P20 suggest greater contributions of Ih to membrane excitability in more mature neurons.
Fig. 1.

A, Developmental changes in responses to hyperpolarizing current injections and in posthyperpolarization rebound firing. These current-clamp recordings show voltage responses in response to 1-sec-long current injections calibrated to yield similar steady-state hyperpolarizations. Current injections are as follows: 10 pA (left), 20 pA (middle), and 30 pA (right) for P1 (gray traces) and 140 pA (left), 200 pA (middle), and 300 pA (right) for P20 (black traces). B, Comparison of voltage sag during hyperpolarizing current injections, and subsequent rebound firing, in representative P20 CA3 (left) and CA1 (right) neurons. Top, Controltraces. Bottom, Tracesrecorded during exposure to the Ih blocker ZD7288 (100 μm, 20 min).
To compare mature (P20) CA3 and CA1 neurons, we delivered hyperpolarizing current injections and examined the effects of a selective Ih blocker, 4-ethylphenylamino-1,2-dimethyl-6-methylaminopyrimidinium chloride (ZD7288) (100 μm) (Gasparini and DiFrancesco, 1997) (Fig. 1B). CA1 neurons required approximately twice as much hyperpolarizing current to achieve approximately one-half the steady-state voltage deflection seen in CA3 neurons. In addition, the onset of voltage sag was slower in CA3 neurons, and only CA1 neurons showed action potentials on rebound. Application of ZD7288 increased whole-cell resistance in both CA3 and CA1 neurons, and the effect was more pronounced in CA1 neurons. Rebound excitation was completely blocked in CA1 neurons, and in CA3 neurons a small voltage rebound, evident in the control traces, was also sensitive. Thus Ih contributes to intrinsic excitability in CA3 neurons and to a much greater extent in CA1 neurons.
We subsequently turned to voltage clamp and immunofluorescence to explicitly examine Ih and its underlying HCN channel subunits.
Ih functional expression
We recorded Ih from somata of CA3 and CA1 pyramidal neurons at four postnatal ages spanning immediate postnatal to mature stages: P1, P5, P10, and P20. Hyperpolarizing 12-sec-long voltage steps were delivered from a holding potential of −50 mV to voltages between −60 and −130 mV in steps of −10 mV.Ih was isolated from the inward-rectifier potassium current (IK(ir)) on the basis of the differential sensitivity of IK(ir) to extracellular Ba2+; all recordings presented here were made in the presence of 0.5 mm Ba2+. Control experiments (data not shown) established that this Ba2+ concentration was sufficient to blockIK(ir) without affectingIh, which when isolated in this way was >90% blocked by 100 μm ZD7288 (data not shown). In these recordings, currents probably reflect channel activity in somatic and proximal apical dendritic membrane (Brown and Johnston, 1983). Within this compartment, membrane voltage appeared to be adequately controlled, because records were devoid of rapid transients indicative of regenerative escapes (note that sodium currents were blocked using TTX), and capacity transients relaxed monotonically.
Representative recordings of Ih from CA3 and CA1 pyramidal neurons at P1, P5, and P20 are presented in Figure2A,B. At P1, Ih was already present in both CA3 and CA1 pyramidal neurons, and, as described in detail below,Ih increased in amplitude and in activation rate with development in both types of pyramidal neurons. Because membrane area of pyramidal neurons also increases substantially during this period (see below), these increases in current amplitude will reflect absolute numbers of Ihchannels, their gating and conductance characteristics, and their density and distribution in the surface membrane. As will be evident, current amplitude and current density need not change in parallel.
Fig. 2.

Ih recorded under whole-cell voltage clamp from CA3 (A) and CA1 (B) hippocampal pyramidal neurons at three stages of development: P1, P5, and P20. Currents were elicited by 12-sec-long hyperpolarizations from −60 to −120 mV (in steps of −10 mV) from a holding potential of −50 mV, followed by a step to −65 mV to record tail currents. All recordings were made in the presence of Ba2+ (0.5 mm; to blockIK(ir)), TTX, CNQX, AP-5, and bicuculline. A Ba2+-insensitive instantaneous current was seen in some older neurons; it was not studied further.
Current–voltage relationships for Ihin CA3 and CA1 pyramidal neurons are presented in Figure3A. Throughout this study we have tried to make quantitative comparisons at voltages within or close to the physiological range within whichIh will shape excitability. In this instance, mean amplitudes (at −80 mV) showed different temporal patterns of development, with Ih in CA3 neurons doubling or tripling during the intervals P1–P5, P5–P10, and P10–P20 and Ih in CA1 neurons tripling during the intervals P1–P5 and P5–P10 but showing a smaller change (1.3 times increase) during the interval P10–P20. Maximal conductance (Gmax) showed a similar developmental pattern, with CA3 neurons increasing throughout the period and CA1 neurons reaching a plateau near P10 (Fig.4A). Note that the relative difference in Ih amplitude between CA3 and CA1 neurons varied with age, with the maximum favoring CA1 neurons seen at P5–P10. Ratios ofIh amplitudes, CA1/CA3 at −80 mV, were 2.5 at P1, 3.9 at P5, 4.0 at P10, and 2.5 at P20.
Fig. 3.
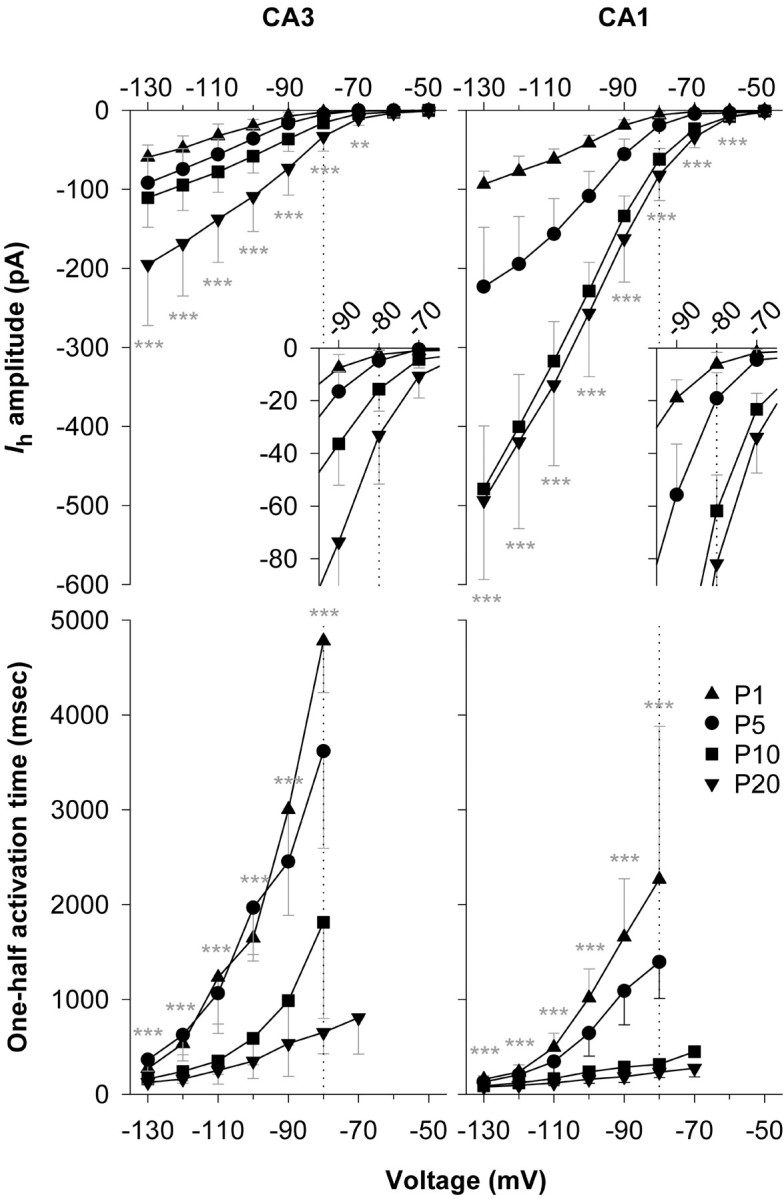
Top, Summary data illustrating an increase in Ih amplitude in CA3 and CA1 pyramidal neurons over four stages of postnatal development: P1, P5, P10, and P20. Ih amplitude was measured at the end of 12-sec-long voltage steps. Averaged I–Vrelationships for the full voltage range are shown. Theinsets show the region surrounding −80 mV (dotted lines), a voltage chosen because it is within the physiological range of afterhyperpolarizations seen in the hippocampus. Bottom, Summary data for the same population of neurons showing a decrease in the time required to reach half-maximum amplitude. Note the pronounced change in this parameter when measured at −80 mV. For CA3 neurons, n = 7 for P1, n = 9 for P5, n = 14 for P10, and n = 11 for P20. For CA1 neurons,n = 9 for P1, n = 8 for P5,n = 9 for P10, and n = 14 for P20. Significance was evaluated by comparison of P1 and P20 values. Data in this and subsequent figures are presented as mean ± SD. Statistical significance is indicated as follows: *p < 0.05; **p < 0.01; ***p < 0.001.
Fig. 4.

Changes in whole-cell measures ofIh over the period P1–P20 for the same population of CA3 and CA1 neurons as in the previous figure.A, Progressive increases in maximal conductance (Gmax) computed from current amplitudes at −130 mV (the maximum of the G–V curve) (Fig. 7) as Gmax =Ih (at −130 mV)/(Vm −Erev), where the reversal potential was −27.4 mV [extrapolated for [K+]out of 10 mm fromLudwig et al. (1998)]. B, Increases in whole-cell capacitance (Cm) reflecting the larger soma-proximal dendrite size of CA3 neurons. C, Changes in Ih density over the same period, computed as Ih (at −120 mV)/Cm. Note thatIh density does not increase monotonically but rather displays peaks (at P5 for CA3 neurons and P10 for CA1 neurons) before declining to reach at P20 approximately the same levels seen at P1. Significance in A and B was evaluated by comparison of CA1 and CA3 values; significance inC was evaluated by comparison between stages as indicated by the markers (arrows). Asterisksindicate statistical significance, as described in the legend to Figure3.
Ih activation also varied during development; rates were compared using the time to reach half-maximum amplitude, t1/2, as a model-independent index (Fig. 3B). During the immediate postnatal period t1/2 fell substantially, reaching (at −80 mV) 14% of its P1 value by P20 in CA3 neurons and 12% of its initial value in CA1 neurons.Ih in CA3 neurons always activated more slowly than in CA1 neurons, and the difference was also maximal at P10. Ratios of t1/2 values, CA3/CA1 at −80 mV, were 2.1 at P1, 2.6 at P5, 5.8 at P10, and 2.5 at P20.
Both CA3 and CA1 pyramidal neurons increased in size over the period P1–P20. Whole-cell capacitance, an index of somatic and proximal dendritic membrane area, increased ∼3.3-fold in CA3 neurons and approximately fourfold in CA1 neurons, with the capacitance of CA3 neurons ultimately becoming ∼1.6 times larger than that of their CA1 counterparts (Fig. 4B). As a consequence,Ih density (current amplitude normalized to capacitance) (Fig. 4C) was always smaller in CA3 neurons, ranging from 0.8 to 1.3 pA/pF throughout the initial postnatal interval. During this same period,Ih density in CA1 neurons was between 3.2 and 4.3 pA/pF. The patterns observed, withIh density in CA3 neurons showing a peak at P5 and a drop between P5 and P10, and in CA1 neurons a later peak at P10, could influence the waxing and waning of spontaneous activity during the initial postnatal period (see Discussion). Pyramidal neurons of the entorhinal cortex show a similar postnatal transient enhancement of Ih (Richter et al., 1997).
Maturation of Ihactivation kinetics
Figure 5A1 shows representative traces from CA1 pyramidal neurons recorded at P1, P5, P10, and P20; in Figure 5A2, the same traces are shown scaled to maximum amplitude. As is evident and expected from measures of t1/2,Ih activation became progressively more rapid as its amplitude increased over the interval P1–P20.
Fig. 5.
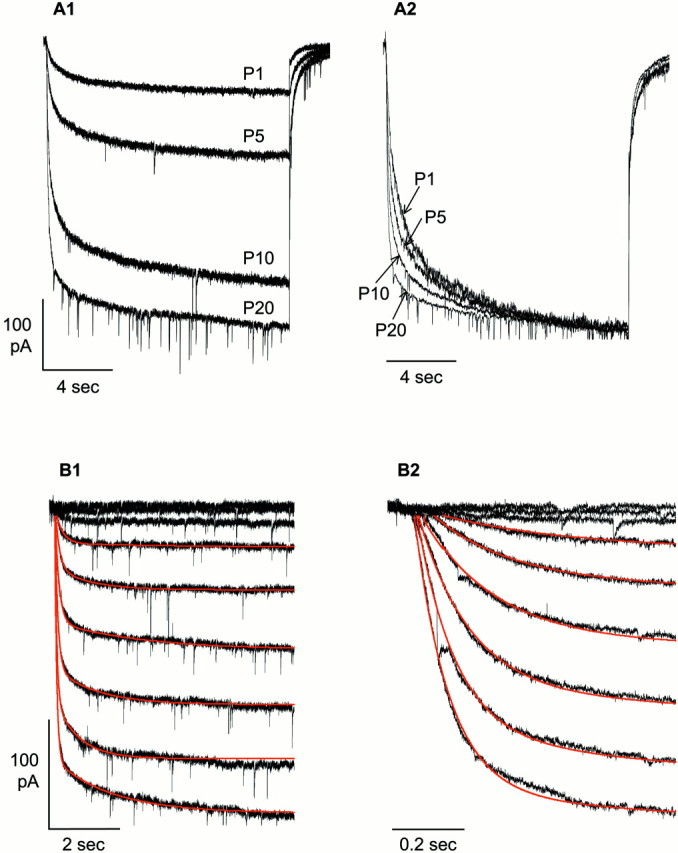
Acceleration of Ihactivation over the period P1–P20. A1, Representative recordings of Ih(Vstep = −130 mV) in CA1 pyramidal neurons at P1, P5, P10, and P20. Traces were capacity- and linear-current subtracted as described in Materials and Methods.A2, These same traces normalized to steady-state amplitude to illustrate the progressive acceleration of current activation. B1, Ih waveforms were well fit by the sum of two exponential functions, shown superimposed on the traces in red; this example is from a P20 CA1 pyramidal neuron. B2, The initial portion of each trace on a 10 times faster time scale. The rapid inward transients in this figure are synaptic events recorded because only TTX, but not CNQX, AP-5, or bicuculline, was present in the external solution.
To characterize Ih activation kinetics in greater detail, the first 8 sec of each trace (excluding an initial delay of 10–30 msec) was fit with the sum of two exponential functions as illustrated in Figure 5B1 (and on an expanded time scale in Fig. 5B2). The fitted functions are shown in red superimposed on the original data, and, as can be seen, describe well the time course of Ih activation.
The results of this analysis are summarized in Figure6 for CA3 (left) and CA1 (right) pyramidal neurons. Shown at the top of Figure 6 are the derived fast and slow time constants (τfast and τslow). At all ages, values of τfast and τslow were voltage dependent (in P20 CA1 pyramidal neurons, τfast was 147 msec at −90 mV and 62 msec at −120 mV), and differed by more than an order of magnitude (in P20 CA1 pyramidal neurons at −90 mV, τfast was 147 msec and τslow was 1971 msec). These time constants were similar but consistently slower in CA3 compared with CA1 neurons (for comparison, in P20 CA3 pyramidal neurons, τfastwas 412 msec and τslow was 5007 msec at −90 mV). Surprisingly, τfast and τslow became progressively more rapid, and by similar percentages, during development. In both CA3 and CA1 neurons, by P20 τfast and τslow(at −100 mV) were ∼35 and 41% of their initial P1 values, respectively. This similarity may be relevant for evaluation of possible mechanisms of Ih maturation (see Discussion).
Fig. 6.

Analysis of Ihactivation kinetics in CA3 (left) and CA1 (right) neurons over the period P1–P20. The first 8–10 sec of capacity- and linear current-subtracted traces(excluding an initial delay) at each voltage were fit with the sum of two exponential functions: Ih =Afastexp(−t/τfast) +Aslowexp(−t/τslow). Top, Voltage dependence of τfast and τslow and their progressive acceleration in older neurons. Note that the time constants were always somewhat faster in CA1 neurons.Bottom, Contributions of fast and slow activation components to total Ih, presented asI–V relationships. Note the larger increases in fast-component amplitudes. Statistical comparisons are between values for P1 and P20. For CA3 cells, n = 3 at P1,n = 7 at P5, n = 12 at P10, andn = 8 at P20. For CA1 cells, n= 8 at P1, n = 5 at P5, n = 9 at P10, and n = 11 at P20. Asterisksindicate statistical significance, as described in the legend to Figure3.
Most significantly, the amplitudes of both fast and slow activation components also changed during development (Fig. 6, bottom). Between P1 and P20, fast component amplitude in CA1 neurons increased ∼12-fold (from 9 to 105 pA at −90 mV) and slow component amplitude increased ∼2.5-fold (from 15 to 37 pA). Thus the relative contribution of the fast component to totalIh increased from ∼37% at P1 to ∼74% at P20. In CA3 neurons the pattern was similar, with fast and slow component amplitudes (at −100 mV) increasing approximately ninefold and ∼1.5-fold, respectively, over this same period, with the contribution of the fast component to the total increasing from 33 to 72%. Note that the absolute amplitude of the fast component is always larger in CA1 neurons, but in both regions the fast component contributes approximately the same percentage of current to totalIh.
Therefore, in both CA3 and CA1 neurons, an increase in the absolute amplitude and thus dominance of a fast kinetic component, together with acceleration of intrinsic time constants (both τfast and τslow), are responsible for the acceleration of Ihactivation seen during development.
Changes in steady-state activation
A shift in the voltage dependence ofIh activation toward positive potentials could in principle contribute to or underlie an increase inIh amplitude and acceleration of its activation. To look for a possible change, we analyzed steady-state activation in CA3 and CA1 pyramidal neurons of different ages (Fig.7). Because deactivation ofIh is relatively slow, the conductance ratio G/Gmax was determined from tail current amplitudes measured 20–30 msec after repolarization (Fig. 7A, inset).
Fig. 7.

Changes in voltage dependence ofIhG–V relationships during development. Conductance was computed from the average amplitude of tail currents measured during the 20–30 msec interval after repolarization to −65 mV after 12-sec-long steps to the voltages indicated (A, inset). Shown is the relative conductance (G/Gmax) for CA3 (A) and CA1 (B) pyramidal neurons measured at P1, P5, P10, and P20. Curves were fitted with Boltzman relationships of the formG/Gmax = 1/{1 + exp[(V −V1/2)/k]}, whereV is the activation voltage,V1/2 is the half-activation voltage, andk is the slope factor. Fitting parameters, particularlyV1/2, are summarized in Table 1. Thehorizontal dotted lines indicate one-half activation (G/Gmax = 0.05).
Conductance–voltage (G–V) relationships forIh steady-state activation in CA3 and CA1 pyramidal neurons are shown in Figure 7A,B; superimposed are the fitted Boltzman relationships. Between P1 and P20, the voltage of half-maximum activation, V1/2, shifted +7.7 mV in CA3 neurons and +2.0 mV in CA1 neurons (Table1). Thus these changes will also contribute to developmental increases inIh amplitude and activation rate, with the largest contributions at voltages near the resting potential (see Fig. 12).
Table 1.
Comparison of Ih steady-state activation in CA3 and CA1 pyramidal neurons of different ages
| CA3 | CA1 | p1-a | |||||||
|---|---|---|---|---|---|---|---|---|---|
| V1/2 | k | n | V1/2 | k | n | V1/2 | k | ||
| Age | P1 | −93.4 ± 0.9 | 10.3 ± 0.9 | 4 | −94.0 ± 0.5 | 7.9 ± 0.5 | 6 | NS | *** |
| P5 | −92.2 ± 0.8 | 9.2 ± 0.7 | 12 | −91.8 ± 0.6 | 8.4 ± 0.5 | 11 | NS | ** | |
| P10 | −88.1 ± 0.4 | 8.9 ± 0.3 | 9 | −92.6 ± 0.5 | 10.3 ± 0.4 | 9 | *** | *** | |
| P20 | −85.7 ± 0.5 | 8.5 ± 0.4 | 7 | −92.0 ± 0.6 | 10.4 ± 0.5 | 10 | *** | *** | |
| p1-b | (P1 vs P5) | ** | ** | ** | NS | ||||
| (P1 vs P10) | ** | ** | ** | ** | |||||
| (P1 vs P20) | ** | ** | ** | ** | |||||
| Linearity | *** | *** | *** | *** | |||||
A summary of parameters derived from fits of the Boltzman relationship G/Gmax = 1/{1 + exp[(V −V1/2)/k]} to theG/Gmax data presented in Figure 7 is shown. Statistical comparisons are as indicated. Asterisks indicate statistical significance, as described in the legend to Figure 3.
Student's t test.
Dunnett multiple comparisons test.
Fig. 12.

Evaluation of the contribution of accelerating activation kinetics to repetitive firing, using a computational model of action potentials in CA1 neurons as described in Materials and Methods. Vm and action potentials are shown at the top, and Ihconductance (Gh) during these action potentials is shown at the bottom. G–Vcurves appropriate for Ih kinetics and fit to the experimental data in Figure 7 are shown in theinset and illustrate the greater proportion ofGmax active at voltages near the resting potential of P20 neurons (vertical dotted line).
Interestingly, although Ih activation shifted toward positive voltages in both CA3 and CA1 neurons, the magnitude of the V1/2 shift in CA3 neurons was almost four times larger than that of CA1 neurons, and the changes in slope factor k were in opposite directions (becoming steeper in CA3 neurons and more shallow in CA1 neurons). These details suggest that the underlying changes in channel subunits may differ in some way that is not obvious at present.
It is not likely that the differences in activation kinetics or steady-state activation between CA3 and CA1 pyramidal neurons, or the changes in these parameters during development, reflect kinase-independent actions of cAMP on HCN channels (DiFrancesco and Tortora, 1991; Pedarzani and Storm, 1995; Wainger et al., 2001). All recordings were made 7–10 min after establishing the whole-cell configuration and allowing time for stabilization of pipette solutions and the cytoplasm, and there was no ATP or cAMP present in the pipette solutions.
In addition, inaccuracies potentially introduced by noncompensated series resistance or increased distributed capacitance to measurements of V1/2 and k do not appear to be significant. CA3 neurons between P1 and P20 did show the positive shift in V1/2 and flattening of the slope constant k that might be expected were these factors distorting the measurements, but in CA1 neurons over this same period, in which whole-cell capacitance increased fourfold (vs 3.3-fold for CA3 neurons), V1/2 showed only a small positive shift and k became steeper.
HCN subunit expression
We used subunit-selective antisera and immunofluorescence to characterize changes in the magnitude and distribution of HCN subunit immunoreactivity over the same P1–P20 interval. Expression patterns in the soma/proximal dendrite compartment accessible to voltage clamp (substantial and increasing HCN1 and HCN2, less HCN4) were broadly consistent with the patterns ofIhmaturation observed, given the present understanding of HCN channel activation rates in heterologous systems (HCN1 > HCN2 > HCN4). However, as is evident from the immunofluorescence images of Figures 8-11, the variations of HCN subunit immunoreactivity in dendritic and axonal compartments indicate strong localized differences in Ihmaturation patterns that we would not have detected in somatic voltage-clamp recordings.
Fig. 8.
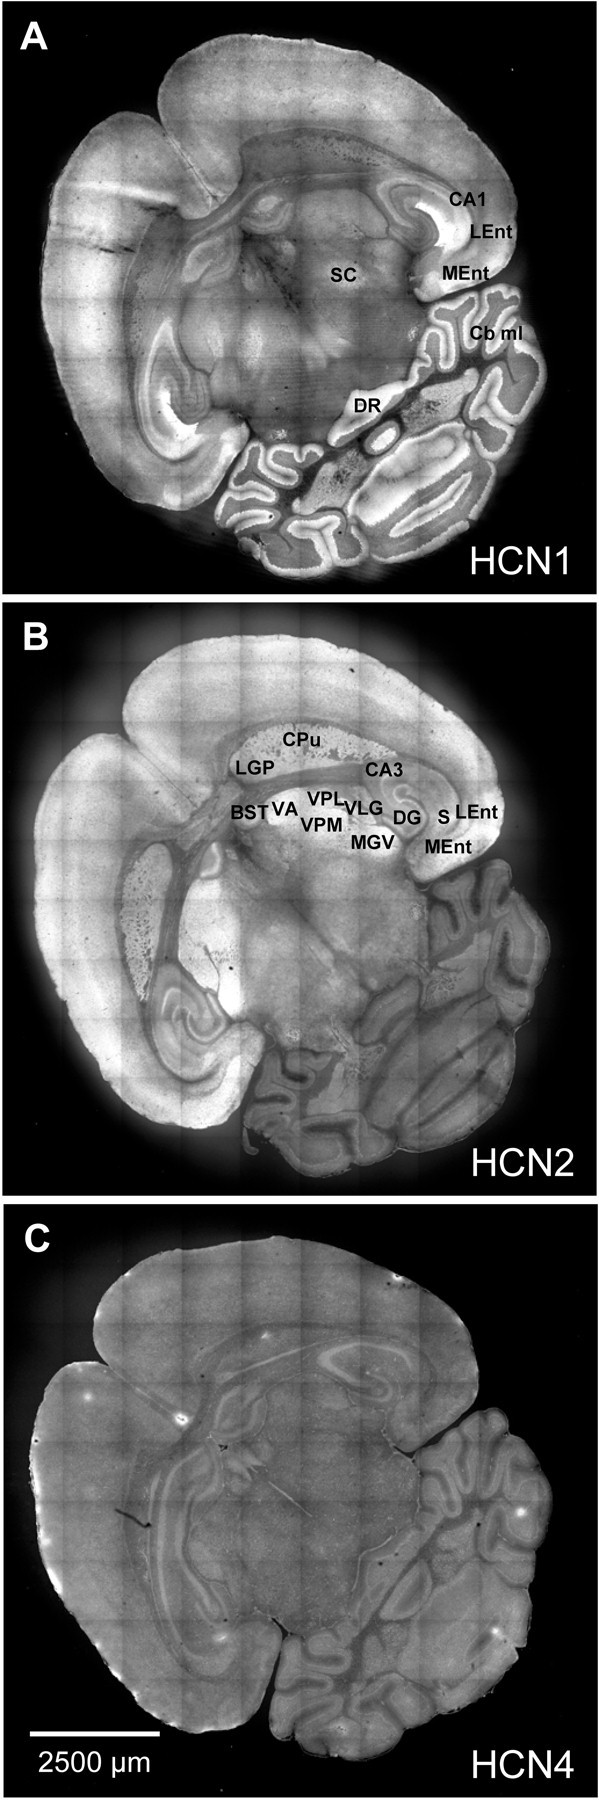
HCN1 (A), HCN2 (B), and HCN4 (C) immunoreactivity in a P20 brain. Shown are 10 × 10 montages of images collected from 20 μm cryostat sections of fresh frozen tissue; control images are presented in the following figures. In this and subsequent figures, brain nuclei and regions were identified using diagrams and images from Blackstad (1956), Sidman et al. (1971), andRosen et al. (2000). BST, Bed nucleus of the stria terminalis; CA1, CA1 field of the hippocampus;CA3, CA3 field of the hippocampus; Cb ml, cerebellar molecular layer; CPu, caudate putamen (striatum); DG, dentate gyrus of the hippocampus;DR, dorsal raphe nucleus; LEnt, lateral entorhinal cortex; LGP, lateral globus pallidus;MEnt, medial entorhinal cortex; MGV, medial geniculate nucleus, ventral part; S, subiculum;SC, superior colliculus; VA, ventral anterior thalamic nucleus; VLG, ventrolateral geniculate nucleus; VPL, ventral posterolateral thalamic nucleus;VPM, ventral posteromedial thalamic nucleus.
Fig. 9.
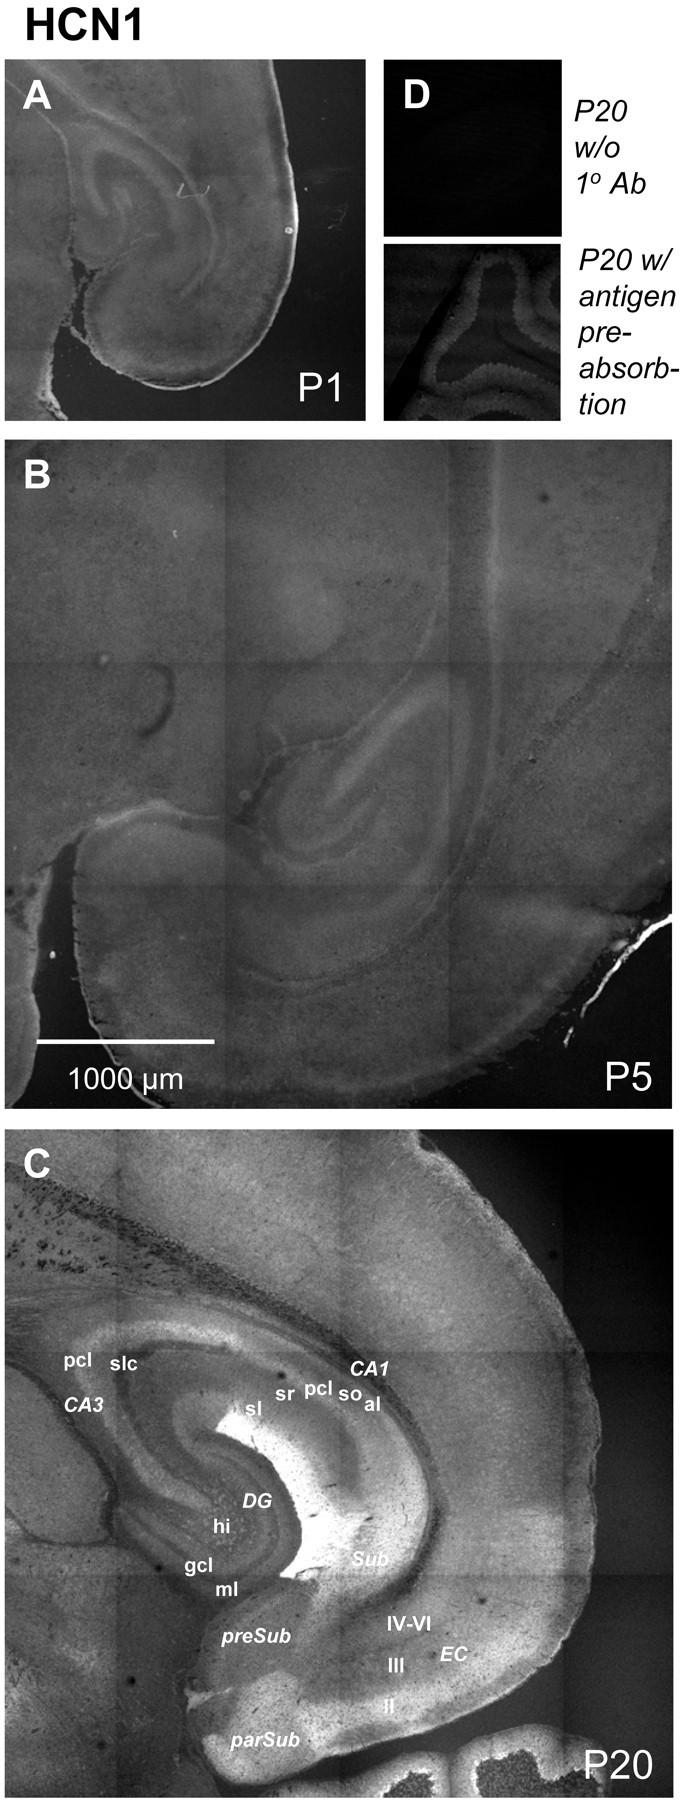
Developmental changes in HCN1 immunoreactivity. Shown are horizontal sections illustrating HCN1 immunoreactivity at P1 (A), P5 (B), and P20 (C). To facilitate qualitative comparisons of immunoreactivity, tissues of different ages were stained simultaneously using an identical protocol, and images were acquired using the same confocal microscope parameters. Negative controls included omission of 1o antibody (Ab) (D,top) and preincubation of antibody with the relevant peptide antigen (D, bottom). Abbreviations are as in Table 2. II, Entorhinal cortex layer II; III, entorhinal cortex layer III;IV-VI, entorhinal cortex layer IV-VI; al, alveus; CA1, CA1 field of the hippocampus;CA3, CA3 field of the hippocampus; DG, dentate gyrus; EC, entorhinal cortex;gcl, granule cell layer; hi, hilus;ml, molecular layer; parSub, parasubiculum; pcl, pyramidal cell layer;preSub, presubiculum; sl, stratum lancosum; slc, stratum lucidum; sm, stratum moleculare; so, stratum oriens;sr, stratum radiatum; Sub, subiculum.
Fig. 10.
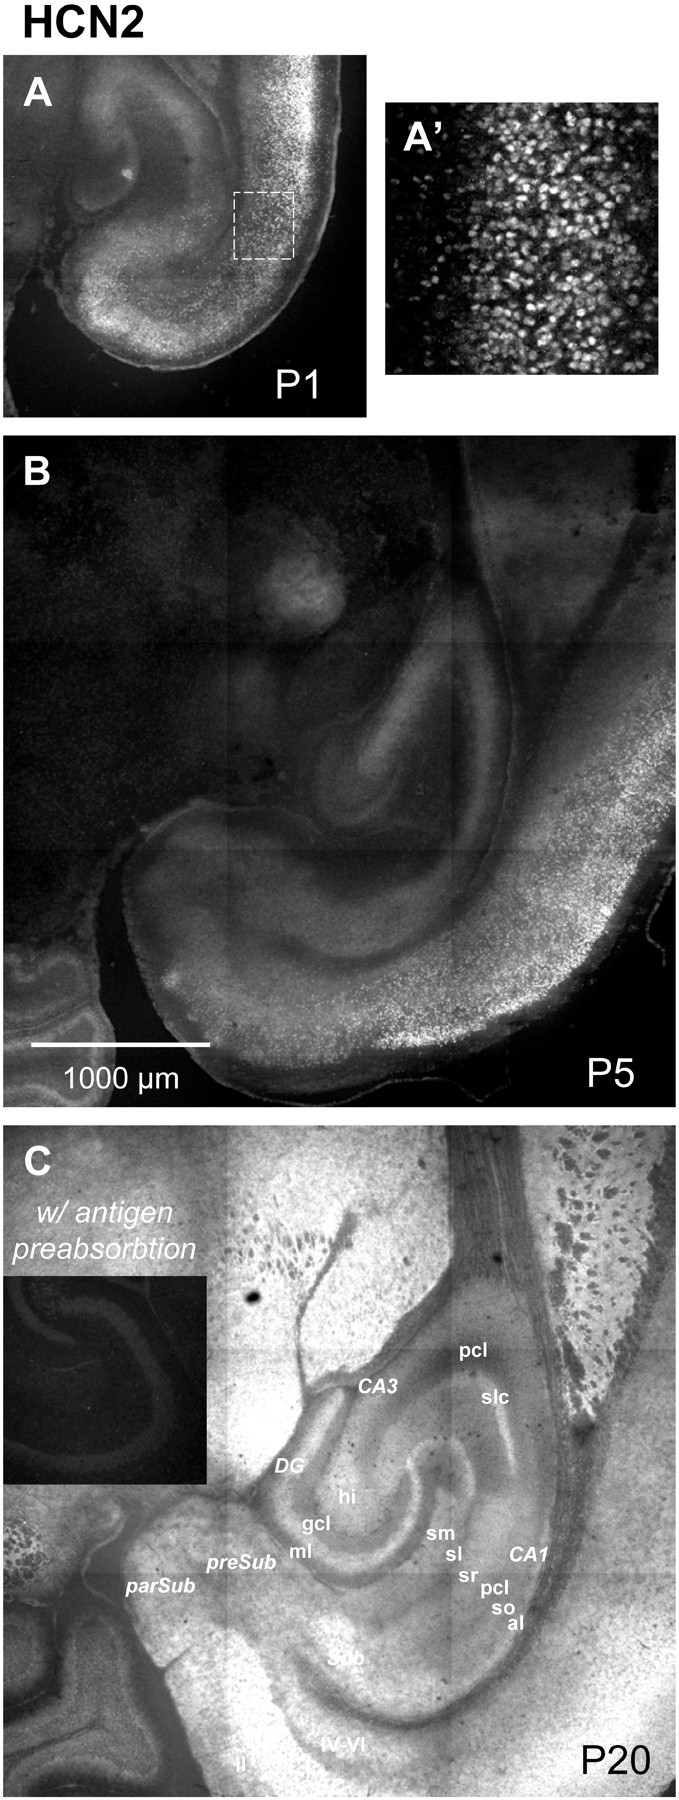
Developmental changes in HCN2 immunoreactivity. Shown are horizontal sections illustrating HCN2 immunofluorescence at P1 (A; A′ shows a higher magnification view of the area enclosed by the dashed line), P5 (B), and P20 (C). Negative controls included omission of 1o antibody (data not shown) and preincubation of antibody with the relevant antigen (C, inset). Abbreviations are as for Figure 9.
Fig. 11.
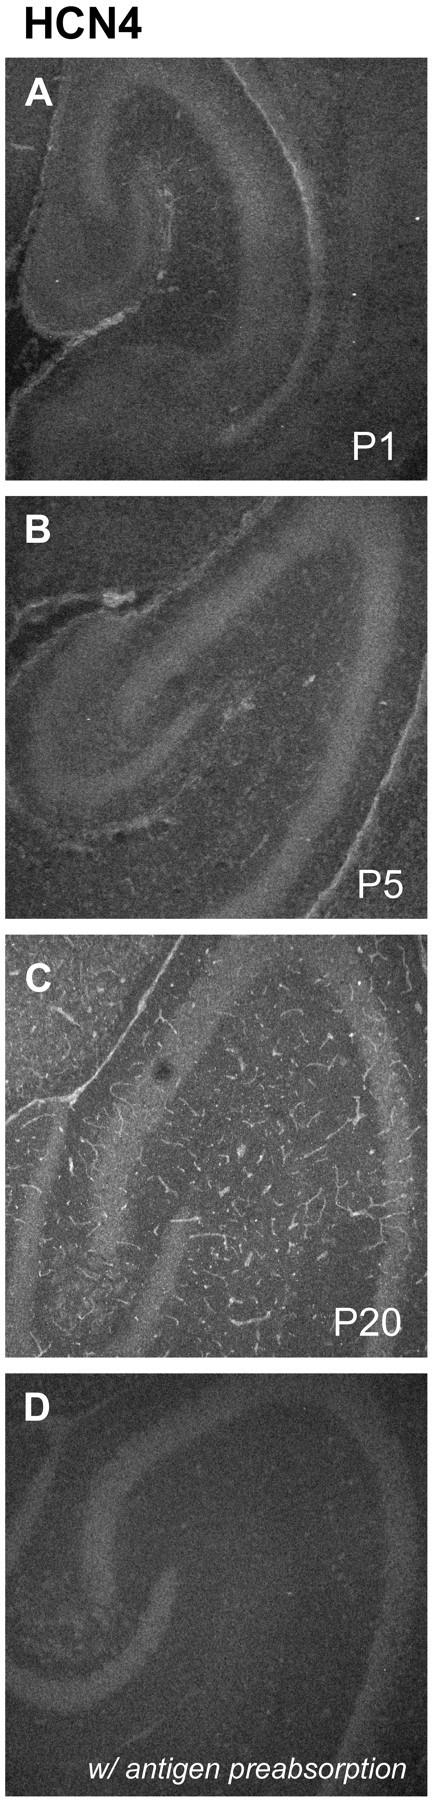
Developmental changes in HCN4 immunoreactivity. Shown are horizontal sections illustrating HCN4 immunofluorescence at P1 (A), P5 (B), and P20 (C). The tubular structures evident at P20 appear to be blood vessels. Negative controls included omission of 1o antibody (data not shown) and preincubation of antibody with the relevant antigen (D).
Mature (P20) brains displayed characteristic patterns of HCN1, HCN2, and HCN4 immunoreactivity. In sections encompassing the entire brain (Fig. 8), high levels of HCN1 immunoreactivity were observed in restricted regions of the hippocampus, cortex, and cerebellum (Santoro et al., 1997). HCN2 immunoreactivity was more broadly distributed, appearing in the thalamus and basal ganglia and regions of the hippocampus and cortex but not in the cerebellum. HCN4 immunoreactivity was present at low levels throughout the brain, with noticeable immunoreactivity in the hippocampus, portions of the cortex, and the cerebellum. HCN3 is minimally expressed in the hippocampus (Bender et al., 2001) and was not examined here.
Within P20 hippocampus and adjacent entorhinal cortex, HCN1 immunoreactivity was restricted to a few areas, whereas HCN2 immunoreactivity was more evenly and broadly distributed, thus creating regions in which expression of the two subunits overlapped and others in which one or the other dominated (Figs. 9C and10C, Table 2). The highest levels of HCN1 immunoreactivity were observed in the stratum moleculare of CA1, with significant immunofluorescence signal also present in somata of Ammon's horn, the subiculum, the parasubiculum, and layer II of the entorhinal cortex. In the hilus of the dentate gyrus, only a scattered and restricted population of cells were HCN1 immunoreactive, possibly conferring distinct physiological properties on these as yet unidentified cells. HCN2 immunoreactivity was most evident in the hilus and molecular layer of the dentate gyrus, the stratum lucidum of CA3, the subiculum, and layer III of entorhinal cortex.
Table 2.
HCN subunit expression in P20 hippocampus
| Region | HCN1 | HCN2 | |
|---|---|---|---|
| Entorhinal cortex | |||
| II | Layer II | +++ | ++ |
| III | Layer III | ++ | ++++ |
| IV–VI | Layer IV–VI | ++ | +++ |
| Sub | Subiculum | +++ | +++ |
| preSub | Presubiculum | ++ | ++ |
| parSub | Parasubiculum | +++ | ++ |
| Dentate gyrus | |||
| hi | Hilus | +++/−2-a | +++ |
| gcl | Granule cell body layer | + | + |
| ml | Molecular layer | ++ | ++++ |
| CA3 | |||
| pcl | Pyramidal cell layer | +++ | + |
| slc | Stratum lucidum | − | ++++ |
| CA1 | |||
| al | Alveus | ++ | +++ |
| so | Stratum oriens | + | ++ |
| pcl | Pyramidal cell body layer | +++ | ++ |
| sr | Stratum radiatum | ++ | +++ |
| sl | Stratum lancosum | ++ | ++ |
| sm | Stratum moleculare | ++++ | +++ |
Distributions of HCN1 and HCN2 immunoreactivity in mature (P20) hippocampal and retrohippocampal formations, evaluated from images such as those in Figures 8-11. Relative immunofluorescence levels were determined by eye and are indicated as follows: ++++, very strong; +++, strong; ++, moderate; +, low but above background; −, not detectable.
Strongly immunoreactive cells scattered in a field of low immunoreactivity.
Developmental patterns of HCN1 and HCN2 immunoreactivity were also distinctive. At P1, low HCN1 immunoreactivity (Fig. 9) was found primarily in pyramidal cell body layers, and this increased moderately by P5. By P20, HCN1 immunoreactivity had increased substantially in CA1–CA3 somata and was also found in distinct regions within the neuropil. In contrast, at P1 HCN2 immunoreactivity (Fig. 10) was clearly detectable in somata of the hippocampus and cortex (Fig.10A,A′). By P5 there was a moderate increase in HCN2 immunoreactivity, the majority of which remained somatic. However, by P20, without loss of somatic immunoreactivity, there was a large and broadly distributed increase in HCN2 immunoreactivity in the neuropil presumably reflecting expression in axonal (presynaptic) and/or dendritic (postsynaptic) processes.
HCN4 immunoreactivity (Fig. 11), although low throughout the period P1–P20, did show a developmental progression from barely above background at earlier times to clearly present in somata of mature pyramidal neurons around Ammon's horn.
Contributions of density and kinetic changes to excitability
Using a computational model of CA1 pyramidal neuron excitability, and P1 and P20 as start and end points, we evaluated the effects of changes in Ih kinetics and density on repetitive firing (Fig. 12, top panels). Kinetics were adjusted for both time constants and the relative contributions of fast and slow components to totalIh. Action potentials were stimulated by a single 0.5-msec-long, 300 pA current injection at the very beginning of the interval. In the absence ofIh, only a single spike was generated (Fig. 12, first panel). As expected, a cell withIh density and kinetics appropriate for P1 generated fewer action potentials (three in 350 msec) (Fig. 12,second panel) than a cell with parameters appropriate for P20 (seven in 350 msec) (Fig. 12, fifth panel). A cell with P20 density and P1 kinetics (Fig. 12, third panel) behaved almost identically to one with P1 density, which might be expected because Ihdensity in CA1 neurons is similar at P1 and P20 (Fig.4B). In contrast, a cell with P1 density but P20 kinetics (Fig. 12, fourth panel) fired rapidly (seven in 350 msec). Thus an increase in the speed ofIh activation, in the absence of a significant change in Ih density, exerted a strong influence on pyramidal neuron firing patterns.
Model neurons with P20 kinetics fired more rapidly becauseIh reactivated more rapidly during post-action potential afterhyperpolarizations and because restingGh was more than three times larger (Fig. 10, bottom panels). The enhanced reactivation ofIh is illustrated by comparison of theGh reactivation time courses in P1 and P20 neurons (Fig. 10, arrows) and is attributable to the more rapid activation kinetics seen in older neurons. The increase in resting Gh emerges both from the larger Gmax characteristic of P20 neurons and from consideration of G–V curve shapes for P1 and P20 neurons (Fig. 10, inset at top). Between P1 and P20, V1/2 forGh in CA1 neurons became 2 mV more positive (from approximately −94 at P1 to approximately −92 mV at P20), and the slope factor became more shallow (k shifts from ∼7.9–10.4) (Fig. 7, Table 1). As computed from the Boltzman relationships derived from experimental data and incorporated into the model, these changes increase relative resting conductance from ∼0.15–0.25 of maximum near the resting potential (evaluated as −80 mV).
DISCUSSION
Ih in CA3 and CA1 hippocampal pyramidal neurons displays characteristic changes during the first 3 weeks of mouse postnatal development. These changes include increases in current amplitude and density, shifts in the voltage dependence of steady-state activation, and acceleration of activation kinetics. This last process reflects both a reduction in the time constants characteristic of fast- and slow-activating components and an increase in the relative contribution of the fast-activating component to totalIh. During this same period, HCN1, HCN2, and HCN4 immunoreactivities exhibit differential increases and distribution changes. Evaluation of a computational model suggests that maturation of Ih could shape episodes of spontaneous rhythmic firing characteristic of the developing hippocampus.
Properties of Ih in CA3 and CA1 pyramidal neurons
Ih in P20 CA1 pyramidal neurons was very similar to the current reported in previous studies on rat and mouse hippocampus (Maccaferri et al., 1993; Santoro et al., 2000);Ih in P20 CA3 pyramidal neurons was qualitatively similar but displayed quantitative differences (but seeSantoro et al., 2000). Mean current amplitude in CA1 neurons at P20 was 2.5 times larger than in CA3 neurons (at −80 mV), giving rise to a more than fourfold difference in density. Smaller hyperpolarizations were also required to activate Ih in CA1 neurons; its threshold was between −50 and −60 mV versus approximately −70 mV in CA3 neurons. Half-maximal activation was reached at approximately −86 mV in CA3 neurons and approximately −92 mV in CA1 neurons. In addition, Ihactivation was consistently slower in CA3 neurons. When approximated by the sum of two exponential functions, values for τfast and τslow in mature CA1 pyramidal neurons (∼121 and ∼1597 msec at −100 mV) were approximately one-half those of CA3 neurons (∼280 and ∼3248 msec). Consistent with these observations, voltage sag during hyperpolarization and the ensuing rebound excitation were faster and larger in CA1 neurons.
Systematic variations between homologous currents of CA1 and CA3 pyramidal neurons are common (Klee et al., 1995). These are most likely to reflect divergent differentiation of intrinsic neuron properties rather than maturational differences, because terminal division of pyramidal neuron precursors occurs at similar times [embryonic day 10 (E10)–E18 for CA1 and E12–E18 for CA3] (Angevine, 1975) and region-specific molecular markers appear soon thereafter (Tole et al., 1997).
Differences in Ih density and activation kinetics between mature CA3 and CA1 pyramidal neurons could contribute to variations in intrinsic membrane resonance (Pike et al., 2000; Suckling et al., 2000) that are important for frequency tuning of network oscillations (Hutcheon and Yarom, 2000). In the hippocampus, these are categorized based on frequency (Draguhn et al., 1998) as theta (4–10 Hz), gamma (20–80 Hz), and high frequency (100–200 Hz). Our data indicating more rapid Ihactivation in CA1 neurons are consistent with observations of Csicsvari et al. (1999), who found that in the absence of theta activity, fast (140–200 Hz) network oscillations were observed in CA1 pyramidal neurons of the behaving rat, whereas slow (100–130 Hz) oscillatory patterns were generated in the CA3 region.
Function of Ih in developing brain
Ih may play a role in triggering and pacing a variety of intrinsic and network oscillations seen only during embryonic and postnatal periods in the developing CNS. One example is the giant depolarizing potential (GDP) of the rodent hippocampus that appears transiently during the initial postnatal period (Ben-Ari et al., 1989; Cherubini et al., 1991; Ben-Ari, 2001). GDPs are dependent on Ih activation (Strata et al., 1997), and their appearance correlates with the peak ofIh density in CA3 neurons at approximately P5. HCN2 immunoreactivity in CA3 pyramidal neuron somata shows a similar pattern, being prominent at P1 and P5 and reduced relative to the neuropil by P20. Conceivably, developmentally regulated HCN2 channel expression by CA3 neurons could promote and then abrogate GDP generation in the immature hippocampus. Another example is the early network oscillation observed at P1–P4 in the CA1 region (Garaschuk et al., 1998) consisting of bursts that gradually transform into regular events and disappear after P15–P16.Ih development in CA1 neurons appears to parallel the transient appearance of this oscillation, gradually increasing to a density maximum at P10 and subsequently decreasing by P20.
Immunofluorescence patterns and HCN subunits of native channels
Although four Ih channel subunits have been identified (HCN1, HCN2, HCN3, and HCN4) (Ludwig et al., 1998;Biel et al., 1999; Santoro and Tibbs, 1999; Gauss and Seifer, 2000;Monteggia et al., 2000; Kaupp and Seifert, 2001) and expressed in heterologous systems, it remains unresolved whether nativeIh channels exist as homomeric or heteromeric assemblies of HCN subunits or whether both forms are generated. Results of in situ hybridization studies of numerous brain areas including the hippocampus indicate considerable overlap of HCN1 and HCN2 mRNA (Monteggia et al., 2000; Santoro et al., 2000; Bender et al., 2001), an observation consistent with the existence of heteromeric channels. However, our immunochemical studies showing independent development and distributions of HCN1 and HCN2 subunit proteins do not suggest the exclusive presence of heteromeric channels but are consistent with the possibility of both homomeric and heteromeric associations.
Mechanisms underlying developmental changes inIh properties
The increase in Ih activation rate in both CA3 and CA1 pyramidal neurons was attributable in large part to an increase in the contribution of the more rapidly activating component to total Ih. How might this occur? Two likely and nonexclusive mechanisms are a change in the relative proportions of the various HCN subunits contributing to totalIh and/or increased association of an accessory or β subunit with pore-forming HCN α subunits. Both of these mechanisms would be consistent with the strikingly similar percentage changes in τfast and τslow seen as neurons matured.
Because HCN channels expressed in heterologous systems show characteristic widely separated intrinsic activation time constants, in the ranges of tens, hundreds, and thousands of milliseconds for homomeric HCN1, HCN2, and HCN4 channels, respectively (Ludwig et al., 1998, 1999; Santoro et al., 1998, 2000; Ishii et al., 1999; Seifert et al., 1999; Franz et al., 2000; Moroni et al., 2000; Ulens and Tytgat, 2001), increasing the contribution of the more rapidly activating HCN1 subunit to the total population ofIh-mediating channels should accelerate activation of Ih (Franz et al., 2000). The expected consequences on the intrinsic activation properties of Ih vary, however, depending on whether this is achieved by increasing the number of homomeric HCN1 channels or by changing the proportions of HCN1 subunits in a pool of heteromeric channels. In the absence of any other changes, addition of homomeric HCN1-containing channels would be expected to increase Ih amplitude without alteration of underlying activation time constants. However, an increased proportion of HCN1 subunits in heteromericIh channels might be expected to yield a macroscopic Ih with modified intrinsic activation properties. Indeed, when HCN1 and HCN2 are heterologously expressed in combination, either as individual cDNAs or as a tandem HCN1 plus HCN2 construct, they form heteromeric channels with intermediate activation properties that may be dominated (at background cAMP levels) by the presence of the HCN1 subunits (S. Chen et al., 2001; Ulens and Tytgat, 2001). The results of our experiments (association of an increase in Ihamplitude with a similar progressive decrease in values of τfast and τslow) are consistent with the second scenario in which heteromeric channels incorporate a larger proportion of HCN1 subunits. One possibility, therefore, is that developmental changes inIh of somata and proximal dendrites result from an increasingly dominant contribution of a rapidly activating subunit, possibly HCN1, to a growing population of heteromeric Ih channels. In addition, the nonoverlapping distributions of HCN subunit immunoreactivity suggest that other patterns of current maturation may emerge in other compartments.
Enhanced expression of additional accessory or β subunits (Isom et al., 1994), some of which are developmentally regulated (Butler et al., 1998), could also contribute both to a progressive increase inIh amplitude and to a parallel decrease in τfast and τslow. When associated with pore-forming α subunits in other channel families, β subunits affect channel kinetics as well insertion into the plasmalemma. Recently, minimal potassium channel protein (minK)-related peptide 1 (MiRP1) has been identified as a possible β subunit for HCN1 and HCN2 (Yu et al., 2001); MiRP1 is found in cardiac tissue along with multiple HCN subunits. In a heterologous system, coexpression of MiRP1 with HCN1 or HCN2 increases Ih amplitude and activation rate, and MiRP1 and HCN1 coimmunoprecipitate. Whether this or another peptide performs a similar function in neural tissue is not known at present.
An alternative but less likely possibility is modulation by cyclic nucleotides (Pape, 1996). Activation of HCN family subunits, particularly HCN2 and HCN4 but minimally HCN1, is modulated by direct binding of cAMP to a cytoplasmic domain (DiFrancesco and Tortora, 1991;Pedarzani and Storm, 1995; Wainger et al., 2001). Although developmental regulation of cAMP could contribute toIh maturation, at least in CA1 neurons this is not accompanied by the shift in G–V relationships toward positive voltages that is characteristic of cAMP modulation of HCN channels (Pape, 1996). Thus this mechanism is not favored.
Footnotes
This work was supported by March of Dimes Grant 1FY00328 and National Institutes of Health Grant R01NS23857. We thank Daniel Darcy for writing the software used to construct high-resolution montage images of developing brain, P. Elyse Schauwecker and Robert Barber for comments on hippocampal neuroanatomy, and M. Jill Brantley for assistance with this manuscript.
Correspondence should be addressed to Dr. Michael E. Barish, Division of Neurosciences, Beckman Research Institute of the City of Hope, 1450 East Duarte Road, Duarte, CA 91010. E-mail: mbarish@coh.org.
REFERENCES
- 1.Angevine JB., Jr . Development of the hippocampal region. In: Isaacson RL, Pribram KH, editors. The hippocampus, Vol 1, Structure and development. Plenum; New York: 1975. pp. 61–94. [Google Scholar]
- 2.Baccaglini PI, Spitzer NC. Developmental changes in the inward current of the action potential of Rohon-Beard neurones. J Physiol (Lond) 1977;271:93–117. doi: 10.1113/jphysiol.1977.sp011992. [DOI] [PMC free article] [PubMed] [Google Scholar]
- 3.Barish ME. Differentiation of voltage-gated potassium current and modulation of excitability in cultured amphibian spinal neurones. J Physiol (Lond) 1986;375:229–250. doi: 10.1113/jphysiol.1986.sp016114. [DOI] [PMC free article] [PubMed] [Google Scholar]
- 4.Bayliss DA, Viana F, Bellingham MC, Berger AJ. Characteristics and postnatal development of a hyperpolarization-activated inward current in rat hypoglossal motoneurons in vitro. J Neurophysiol. 1994;71:119–128. doi: 10.1152/jn.1994.71.1.119. [DOI] [PubMed] [Google Scholar]
- 5.Ben-Ari Y. Developing networks play a similar melody. Trends Neurosci. 2001;24:353–360. doi: 10.1016/s0166-2236(00)01813-0. [DOI] [PubMed] [Google Scholar]
- 6.Ben-Ari Y, Cherubini E, Corradetti R, Gaiarsa JL. Giant synaptic potentials in immature rat CA3 hippocampal neurones. J Physiol (Lond) 1989;416:303–325. doi: 10.1113/jphysiol.1989.sp017762. [DOI] [PMC free article] [PubMed] [Google Scholar]
- 7.Bender RA, Brewster A, Santoro B, Ludwig A, Hofmann F, Biel M, Baram TZ. Differential and age-dependent expression of hyperpolarization-activated, cyclic nucleotide-gated cation channel isoforms 1–4 suggests evolving roles in the developing rat hippocampus. Neuroscience. 2001;106:689–698. doi: 10.1016/s0306-4522(01)00314-1. [DOI] [PMC free article] [PubMed] [Google Scholar]
- 8.Biel M, Ludwig A, Zong X, Hofmann F. Hyperpolarization-activated cation channels: a multi-gene family. Rev Physiol Biochem Pharmacol. 1999;136:165–181. doi: 10.1007/BFb0032324. [DOI] [PubMed] [Google Scholar]
- 9.Blackstad TW. Commissural connections of the hippocampal region in the rat, with special reference to their mode of termination. J Comp Neurol. 1956;105:417–537. doi: 10.1002/cne.901050305. [DOI] [PubMed] [Google Scholar]
- 10.Brown TH, Johnston D. Voltage-clamp analysis of mossy fiber synaptic input to hippocampal neurons. J Neurophysiol. 1983;50:487–507. doi: 10.1152/jn.1983.50.2.487. [DOI] [PubMed] [Google Scholar]
- 11.Butler DM, Ono JK, Chang T, McCaman RE, Barish ME. Mouse brain potassium channel β1 subunit mRNA: cloning and distribution during development. J Neurobiol. 1998;34:135–150. [PubMed] [Google Scholar]
- 12.Chen K, Aradi I, Thon N, Eghbal-Ahmadi M, Baram TZ, Soltesz I. Persistently modified h-channels after complex febrile seizures convert the seizure-induced enhancement of inhibition to hyperexcitability. Nat Med. 2001;7:331–337. doi: 10.1038/85480. [DOI] [PMC free article] [PubMed] [Google Scholar]
- 13.Chen S, Wang J, Siegelbaum SA. Properties of hyperpolarization-activated pacemaker current defined by coassembly of HCN1 and HCN2 subunits and basal modulation by cyclic nucleotide. J Gen Physiol. 2001;117:491–504. doi: 10.1085/jgp.117.5.491. [DOI] [PMC free article] [PubMed] [Google Scholar]
- 14.Cherubini E, Gaiarsa JL, Ben-Ari Y. GABA: an excitatory transmitter in early postnatal life. Trends Neurosci. 1991;14:515–519. doi: 10.1016/0166-2236(91)90003-d. [DOI] [PubMed] [Google Scholar]
- 15. Csicsvari J, Hirase H, Czurko A, Mamiya A, Buzsaki G. Fast network oscillations in the hippocampal CA1 region of the behaving rat. J Neurosci 19 1999. RC20:1–8. [DOI] [PMC free article] [PubMed] [Google Scholar]
- 16.Desai NS, Rutherford LC, Turrigiano GG. Plasticity in the intrinsic excitability of cortical pyramidal neurons. Nat Neurosci. 1999;2:515–520. doi: 10.1038/9165. [DOI] [PubMed] [Google Scholar]
- 17.Dickson CT, Magistretti J, Shalinsky MH, Fransen E, Hasselmo ME, Alonso A. Properties and role of I(h) in the pacing of subthreshold oscillations in entorhinal cortex layer II neurons. J Neurophysiol. 2000;83:2562–2579. doi: 10.1152/jn.2000.83.5.2562. [DOI] [PubMed] [Google Scholar]
- 18.DiFrancesco D, Tortora P. Direct activation of cardiac pacemaker channels by intracellular cyclic AMP. Nature. 1991;351:145–147. doi: 10.1038/351145a0. [DOI] [PubMed] [Google Scholar]
- 19.Di Pasquale E, Keegan KD, Noebels JL. Increased excitability and inward rectification in layer V cortical pyramidal neurons in the epileptic mutant mouse Stargazer. J Neurophysiol. 1997;77:621–631. doi: 10.1152/jn.1997.77.2.621. [DOI] [PubMed] [Google Scholar]
- 20.Doan TN, Kunze DL. Contribution of the hyperpolarization-activated current to the resting membrane potential of rat nodose sensory neurons. J Physiol (Lond) 1999;514:125–138. doi: 10.1111/j.1469-7793.1999.125af.x. [DOI] [PMC free article] [PubMed] [Google Scholar]
- 21.Draguhn A, Traub RD, Schmitz D, Jefferys JG. Electrical coupling underlies high-frequency oscillations in the hippocampus in vitro. Nature. 1998;394:189–192. doi: 10.1038/28184. [DOI] [PubMed] [Google Scholar]
- 22.Fedulova SA, Vasilyev DV, Veselovsky NS. Voltage-operated potassium currents in the somatic membrane of rat dorsal root ganglion neurons: ontogenetic aspects. Neuroscience. 1998;85:497–508. doi: 10.1016/s0306-4522(97)00600-3. [DOI] [PubMed] [Google Scholar]
- 23.Franz O, Liss B, Neu A, Roeper J. Single-cell mRNA expression of HCN1 correlates with a fast gating phenotype of hyperpolarization-activated cyclic nucleotide-gated ion channels (Ih) in central neurons. Eur J Neurosci. 2000;12:2685–2693. doi: 10.1046/j.1460-9568.2000.00151.x. [DOI] [PubMed] [Google Scholar]
- 24.Garaschuk O, Hanse E, Konnerth A. Developmental profile and synaptic origin of early network oscillations in the CA1 region of rat neonatal hippocampus. J Physiol (Lond) 1998;507:219–236. doi: 10.1111/j.1469-7793.1998.219bu.x. [DOI] [PMC free article] [PubMed] [Google Scholar]
- 25.Garaschuk O, Linn J, Eilers J, Konnerth A. Large-scale oscillatory calcium waves in the immature cortex. Nat Neurosci. 2000;3:452–459. doi: 10.1038/74823. [DOI] [PubMed] [Google Scholar]
- 26.Gasparini S, DiFrancesco D. Action of the hyperpolarization-activated current (Ih) blocker ZD 7288 in hippocampal CA1 neurons. Pflügers Arch. 1997;435:99–106. doi: 10.1007/s004240050488. [DOI] [PubMed] [Google Scholar]
- 27.Gauss R, Seifert R. Pacemaker oscillations in heart and brain: a key role for hyperpolarization-activated cation channels. Chronobiol Int. 2000;17:453–469. doi: 10.1081/cbi-100101057. [DOI] [PubMed] [Google Scholar]
- 28.Goodman CS, Shatz CJ. Developmental mechanisms that generate precise patterns of neuronal connectivity. Cell [Suppl] 1993;72:77–98. doi: 10.1016/s0092-8674(05)80030-3. [DOI] [PubMed] [Google Scholar]
- 29.Halliwell JV, Adams PR. Voltage-clamp analysis of muscarinic excitation in hippocampal neurons. Brain Res. 1982;250:71–92. doi: 10.1016/0006-8993(82)90954-4. [DOI] [PubMed] [Google Scholar]
- 30.Hutcheon B, Yarom Y. Resonance, oscillation, and the intrinsic frequency preferences of neurons. Trends Neurosci. 2000;23:216–222. doi: 10.1016/s0166-2236(00)01547-2. [DOI] [PubMed] [Google Scholar]
- 31.Ishii TM, Takano M, Xie LH, Noma A, Ohmori H. Molecular characterization of the hyperpolarization-activated cation channel in rabbit heart sinoatrial node. J Biol Chem. 1999;274:12835–12839. doi: 10.1074/jbc.274.18.12835. [DOI] [PubMed] [Google Scholar]
- 32.Isom LL, De Jongh KS, Catterall WA. Auxiliary subunits of voltage-gated ion channels. Neuron. 1994;12:1183–1194. doi: 10.1016/0896-6273(94)90436-7. [DOI] [PubMed] [Google Scholar]
- 33.Kaupp UB, Seifert R. Molecular diversity of pacemaker ion channels. Annu Rev Physiol. 2001;63:235–257. doi: 10.1146/annurev.physiol.63.1.235. [DOI] [PubMed] [Google Scholar]
- 34.Klee R, Ficker E, Heinemann U. Comparison of voltage-dependent potassium currents in rat pyramidal neurons acutely isolated from hippocampal regions CA1 and CA3. J Neurophysiol. 1995;74:1982–1995. doi: 10.1152/jn.1995.74.5.1982. [DOI] [PubMed] [Google Scholar]
- 35.Ludwig A, Zong X, Jeglitsch M, Hofmann F, Biel M. A family of hyperpolarization-activated mammalian cation channels. Nature. 1998;393:587–591. doi: 10.1038/31255. [DOI] [PubMed] [Google Scholar]
- 36.Ludwig A, Zong X, Hofmann F, Biel M. Structure and function of cardiac pacemaker channels. Cell Physiol Biochem. 1999;9:179–186. doi: 10.1159/000016315. [DOI] [PubMed] [Google Scholar]
- 37.Lüthi A, McCormick DA. H-current: properties of a neuronal and network pacemaker. Neuron. 1998;21:9–12. doi: 10.1016/s0896-6273(00)80509-7. [DOI] [PubMed] [Google Scholar]
- 38.Maccaferri G, McBain CJ. The hyperpolarization-activated current (Ih) and its contribution to pacemaker activity in rat CA1 hippocampal stratum oriens-alveus interneurones. J Physiol (Lond) 1996;497:119–130. doi: 10.1113/jphysiol.1996.sp021754. [DOI] [PMC free article] [PubMed] [Google Scholar]
- 39.Maccaferri G, Mangoni M, Lazzari A, DiFrancesco D. Properties of the hyperpolarization-activated current in rat hippocampal CA1 pyramidal cells. J Neurophysiol. 1993;69:2129–2136. doi: 10.1152/jn.1993.69.6.2129. [DOI] [PubMed] [Google Scholar]
- 40.Magee JC. Dendritic hyperpolarization-activated currents modify the integrative properties of hippocampal CA1 pyramidal neurons. J Neurosci. 1998;18:7613–7624. doi: 10.1523/JNEUROSCI.18-19-07613.1998. [DOI] [PMC free article] [PubMed] [Google Scholar]
- 41.Magee JC. Dendritic Ih normalizes temporal summation in hippocampal CA1 neurons. Nat Neurosci. 1999;2:508–514. doi: 10.1038/12229. [DOI] [PubMed] [Google Scholar]
- 42.McCormick DA, Pape HC. Properties of a hyperpolarization-activated cation current and its role in rhythmic oscillation in thalamic relay neurones. J Physiol (Lond) 1990;431:291–318. doi: 10.1113/jphysiol.1990.sp018331. [DOI] [PMC free article] [PubMed] [Google Scholar]
- 43.Monteggia LM, Eisch AJ, Tang MD, Kaczmarek LK, Nestler EJ. Cloning and localization of the hyperpolarization-activated cyclic nucleotide-gated channel family in rat brain. Brain Res Mol Brain Res. 2000;81:129–139. doi: 10.1016/s0169-328x(00)00155-8. [DOI] [PubMed] [Google Scholar]
- 44.Moody WJ. The development of voltage-gated ion channels and its relation to activity-dependent development events. Curr Top Dev Biol. 1998;39:159–185. doi: 10.1016/s0070-2153(08)60455-x. [DOI] [PubMed] [Google Scholar]
- 45.Moosmang S, Biel M, Hofmann F, Ludwig A. Differential distribution of four hyperpolarization-activated cation channels in mouse brain. J Biol Chem. 1999;380:975–980. doi: 10.1515/BC.1999.121. [DOI] [PubMed] [Google Scholar]
- 46.Moroni A, Barbuti A, Altomare C, Viscomi C, Morgan J, Baruscotti M, DiFrancesco D. Kinetic and ionic properties of the human HCN2 pacemaker channel. Pflügers Arch. 2000;439:618–626. doi: 10.1007/s004249900225. [DOI] [PubMed] [Google Scholar]
- 47.O'Donovan MJ. The origin of spontaneous activity in developing networks of the vertebrate nervous system. Curr Opin Neurobiol. 1999;9:94–104. doi: 10.1016/s0959-4388(99)80012-9. [DOI] [PubMed] [Google Scholar]
- 48.O'Dowd DK, Ribera AB, Spitzer NC. Development of voltage-dependent calcium, sodium, and potassium currents in Xenopus spinal neurons. J Neurosci. 1988;8:792–805. doi: 10.1523/JNEUROSCI.08-03-00792.1988. [DOI] [PMC free article] [PubMed] [Google Scholar]
- 49.Pape HC. Queer current and pacemaker: the hyperpolarization-activated cation current in neurons. Annu Rev Physiol. 1996;58:299–327. doi: 10.1146/annurev.ph.58.030196.001503. [DOI] [PubMed] [Google Scholar]
- 50.Pedarzani P, Storm JF. Protein kinase A-independent modulation of ion channels in the brain by cyclic AMP. Proc Natl Acad Sci USA. 1995;92:11716–11720. doi: 10.1073/pnas.92.25.11716. [DOI] [PMC free article] [PubMed] [Google Scholar]
- 51.Pike FG, Goddard RS, Suckling JM, Ganter P, Kasthuri N, Paulsen O. Distinct frequency preferences of different types of rat hippocampal neurones in response to oscillatory input currents. J Physiol (Lond) 2000;529:205–213. doi: 10.1111/j.1469-7793.2000.00205.x. [DOI] [PMC free article] [PubMed] [Google Scholar]
- 52.Ribera AB. Potassium currents in developing neurons. Ann NY Acad Sci. 1999;868:399–405. doi: 10.1111/j.1749-6632.1999.tb11301.x. [DOI] [PubMed] [Google Scholar]
- 53.Richter H, Klee R, Heinemann U, Eder C. Developmental changes of inward rectifier currents in neurons of the rat entorhinal cortex. Neurosci Lett. 1997;228:139–141. doi: 10.1016/s0304-3940(97)00376-5. [DOI] [PubMed] [Google Scholar]
- 54.Richter H, Heinemann U, Eder C. Hyperpolarization-activated cation currents in stellate and pyramidal neurons of rat entorhinal cortex. Neurosci Lett. 2000;281:33–36. doi: 10.1016/s0304-3940(00)00794-1. [DOI] [PubMed] [Google Scholar]
- 55.Rosen GD, Williams AG, Capra JA, Connolly MT, Cruz B, Lu L, Airey DC, Kulkami K, Williams RW. The mouse brain library@www.mbl.org. International Mouse Genome Conference. 2000;14:166. [Google Scholar]
- 56.Santoro B, Tibbs GR. The HCN gene family: molecular basis of the hyperpolarization-activated pacemaker channels. Ann NY Acad Sci. 1999;868:741–764. doi: 10.1111/j.1749-6632.1999.tb11353.x. [DOI] [PubMed] [Google Scholar]
- 57.Santoro B, Grant SG, Bartsch D, Kandel ER. Interactive cloning with the SH3 domain of N-src identifies a new brain-specific ion channel protein, with homology to eag and cyclic nucleotide-gated channels. Proc Natl Acad Sci USA. 1997;94:14815–14820. doi: 10.1073/pnas.94.26.14815. [DOI] [PMC free article] [PubMed] [Google Scholar]
- 58.Santoro B, Liu DT, Yao H, Bartsch D, Kandel ER, Siegelbaum SA, Tibbs GR. Identification of a gene encoding a hyperpolarization-activated pacemaker channel of brain. Cell. 1998;93:717–729. doi: 10.1016/s0092-8674(00)81434-8. [DOI] [PubMed] [Google Scholar]
- 59.Santoro B, Chen S, Lüthi A, Pavlidis P, Shumyatsky GP, Tibbs GR, Siegelbaum SA. Molecular and functional heterogeneity of hyperpolarization-activated pacemaker channels in the mouse CNS. J Neurosci. 2000;20:5264–5275. doi: 10.1523/JNEUROSCI.20-14-05264.2000. [DOI] [PMC free article] [PubMed] [Google Scholar]
- 60.Seifert R, Scholten A, Gauss R, Mincheva A, Lichter P, Kaupp UB. Molecular characterization of a slowly gating human hyperpolarization-activated channel predominantly expressed in thalamus, heart, and testis. Proc Natl Acad Sci USA. 1999;96:9391–9396. doi: 10.1073/pnas.96.16.9391. [DOI] [PMC free article] [PubMed] [Google Scholar]
- 61.Sidman RL, Angevine JB, Jr, Pierce ET. Atlas of the mouse brain and spinal cord. Harvard UP; Cambridge, MA: 1971. [Google Scholar]
- 62.Spitzer NC. Ion channels in development. Annu Rev Neurosci. 1979;2:363–397. doi: 10.1146/annurev.ne.02.030179.002051. [DOI] [PubMed] [Google Scholar]
- 63.Spitzer NC. Spontaneous Ca2+ spikes and waves in embryonic neurons: signaling systems for differentiation. Trends Neurosci. 1994;17:115–118. doi: 10.1016/0166-2236(94)90120-1. [DOI] [PubMed] [Google Scholar]
- 64.Spitzer NC. Activity-dependent neuronal differentiation prior to synapse formation: the functions of calcium transients. J Physiol (Paris) 2002;96:73–80. doi: 10.1016/s0928-4257(01)00082-1. [DOI] [PubMed] [Google Scholar]
- 65.Spitzer NC, Lamborghini JE. The development of the action potential mechanism of amphibian neurons isolated in culture. Proc Natl Acad Sci USA. 1976;73:1641–1645. doi: 10.1073/pnas.73.5.1641. [DOI] [PMC free article] [PubMed] [Google Scholar]
- 66.Strata F, Atzori M, Molnar M, Ugolini G, Tempia F, Cherubini E. A pacemaker current in dye-coupled hilar interneurons contributes to the generation of giant GABAergic potentials in developing hippocampus. J Neurosci. 1997;17:1435–1446. doi: 10.1523/JNEUROSCI.17-04-01435.1997. [DOI] [PMC free article] [PubMed] [Google Scholar]
- 67.Suckling JM, Ganter P, Kasthuri N, Vik S, Paulsen O. The h-current underlies low frequency resonance in hippocampal CA1 pyramidal cells. Soc Neurosci Abstr. 2000;26:803–805. [Google Scholar]
- 68.Tole S, Christian C, Grove EA. Early specification and autonomous development of cortical fields in the mouse hippocampus. Development. 1997;124:4959–4970. doi: 10.1242/dev.124.24.4959. [DOI] [PubMed] [Google Scholar]
- 69.Ulens C, Tytgat J. Functional heteromerization of HCN1 and HCN2 pacemaker channels. J Biol Chem. 2001;276:6069–6072. doi: 10.1074/jbc.C000738200. [DOI] [PubMed] [Google Scholar]
- 70.Vasilyev DV, Barish ME. Development of the hyperpolarization-activated cationic current Ih in mouse hippocampus. Soc Neurosci Abstr. 2001;27:605–608. [Google Scholar]
- 71.Wainger BJ, DeGennaro M, Santoro B, Siegelbaum SA, Tibbs GR. Molecular mechanism of cAMP modulation of HCN pacemaker channels. Nature. 2001;411:805–810. doi: 10.1038/35081088. [DOI] [PubMed] [Google Scholar]
- 72.Warman EN, Durand DM, Yuen GL. Reconstruction of hippocampal CA1 pyramidal cell electrophysiology by computer simulation. J Neurophysiol. 1994;71:2033–2045. doi: 10.1152/jn.1994.71.6.2033. [DOI] [PubMed] [Google Scholar]
- 73.Washio H, Takigachi-Hayashi K, Konishi S. Early postnatal development of substantia nigra neurons in rat midbrain slices: hyperpolarization-activated inward current and dopamine-activated current. Neurosci Res. 1999;34:91–101. doi: 10.1016/s0168-0102(99)00039-5. [DOI] [PubMed] [Google Scholar]
- 74.Williams SR, Stuart GJ. Site independence of EPSP time course is mediated by dendritic I(h) in neocortical pyramidal neurons. J Neurophysiol. 2000;83:3177–3182. doi: 10.1152/jn.2000.83.5.3177. [DOI] [PubMed] [Google Scholar]
- 75.Yu H, Wu J, Potapova I, Wymore RT, Holmes B, Zuckerman J, Pan Z, Wang H, Shi W, Robinson RB, El-Maghrabi MR, Benjamin W, Dixon J, McKinnon D, Cohen IS, Wymore R. MinK-related peptide 1: a β subunit for the HCN ion channel subunit family enhances expression and speeds activation. Circ Res. 2001;88:E84–E87. doi: 10.1161/hh1201.093511. [DOI] [PubMed] [Google Scholar]
- 76.Zhang LI, Poo MM. Electrical activity and development of neural circuits. Nat Neurosci [Suppl] 2001;4:1207–1214. doi: 10.1038/nn753. [DOI] [PubMed] [Google Scholar]