Abstract
The cerebellar cortex contains huge numbers of synapses between granule cells and Purkinje cells. These synapses are thought to be a major storage site for information required to execute coordinated movements. To obtain a quantitative description of this connection, we recorded unitary synaptic responses between granule cell and Purkinje cell pairs in adult rat cerebellar slices. Our results are consistent with parallel fiber→Purkinje cell synapses having high release probabilities and modest paired pulse facilitation. However, a wide range of response amplitudes was observed. Indeed, we detected many fewer parallel fiber connections (7% of the granule cells that were screened) than expected (54%), leading us to suggest that up to 85% of parallel fiber→Purkinje cell synapses do not generate detectable electrical responses. We also investigated the possible role of granule cell ascending axons by recording granule cells near the Purkinje cell. A high proportion (up to 50%) of local granule cells generated detectable synaptic responses. However, most of these connections were indistinguishable from parallel fiber connections, suggesting that powerful ascending axon connections are rare. The existence of many very weak synapses would provide a mechanism for Purkinje cells to extract information selectively from the mass provided by parallel fibers.
Keywords: cerebellum, Purkinje cell, granule cell, synapse, glutamate, motor control
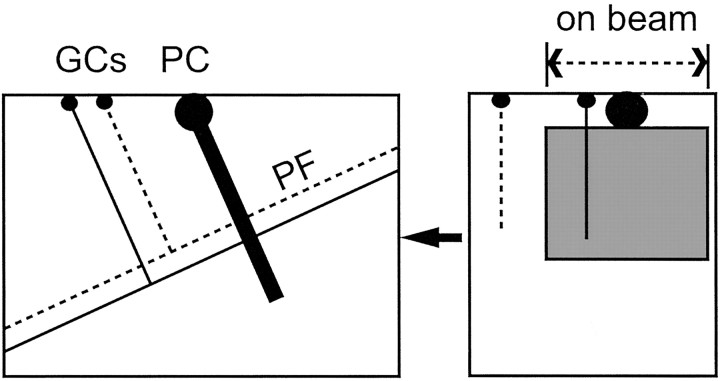
Mossy fibers, the most abundant input to the cerebellar cortex, carry multiple modalities of sensori-motor and contextual information in a complex somatotopic arrangement (Shambes et al., 1978; Oscarsson, 1979; Bower and Woolston, 1983; Brodal and Bjaalie, 1997). They excite granule cells, the axons of which ascend to the molecular layer and bifurcate once to form parallel fibers (see Fig. 1). Parallel fibers extend for 5 mm, making en passant excitatory synapses of one to two contacts (values for rat:Harvey and Napper, 1988, 1991; Napper and Harvey, 1988a,b) with the planar dendritic trees of several hundred Purkinje cells, to which parallel fibers are orthogonal. Each Purkinje cell receives some 170,000 parallel fiber inputs. These synapses are glutamatergic, and transmission can involve postsynaptic AMPA (Perkel et al., 1990; Llano et al., 1991) and metabotropic glutamate receptor (mGluR) (Batchelor et al., 1994; Takechi et al., 1998) receptors, but functional NMDA receptors are, surprisingly, present only on the presynaptic side of the synapse (Casado et al., 2000, 2002). These synapses also have been reported to have a particularly low release probability (<5%; Dittman et al., 2000). Despite the wealth of information regarding compound responses involving these synapses, understanding some aspects of cerebellar function requires a detailed study of unitary responses. In particular, the question of what synaptic properties can be modified as a result of learning is difficult to study by using compound responses, because it is the individual deviations from the average behavior that are important.
Fig. 1.
Slice orientation. The diagram shows the typical orientation of the cell pairs recorded in this study. Purkinje cells for which the soma was near the surface and for which the dendrites descended into the pseudo-transverse slice were whole-cell clamped. Granule cells within the connected beam were recorded in loose cell-attached mode. The thickness of our slices (450 μm) exceeds the combined depths of the molecular and granule cell layers (220 + 180 μm; Harvey and Napper, 1988), ensuring that parallel fibers (PF) between recorded granule cells (GCs) and Purkinje cells (PC) were not cut at the bottom surface of the slice.
The divergence of parallel fibers onto Purkinje cells is thought to underlie the coordination of multiple body parts by the cerebellum (Thach et al., 1992). The remarkable arrangement of parallel fibers and Purkinje cells means that many Purkinje cells along a parallel fiber “beam” will share large fractions of their inputs. This fact gave rise to theories of cerebellar function based on the activation of beams of parallel fibers (Braitenberg and Atwood, 1958; Eccles, 1973). However, although Purkinje cell activity along beams is demonstrated easily in vitro (Vranesic et al., 1994), in vivoobservations have proved to be more controversial (Bower and Woolston, 1983; Garwicz and Andersson, 1992; Cohen and Yarom, 1998), and Purkinje cells separated by more than ∼100 μm do not show the correlation of their activity that would be expected from a common input (Bell and Grimm, 1969; Ebner and Bloedel, 1981). Moreover, Purkinje cells have well defined receptive fields and modalities (Bower and Woolston, 1983;Fushiki and Barmack, 1997; Ekerot and Jorntell, 2001), which may reflect the origin of the subjacent mossy fibers (Shambes et al., 1978), rather than the diffuse, generalized responsiveness that parallel fibers might be expected to produce. The usual explanation for these observations invokes granule cell “ascending axons” (Llinas, 1982), which run in the plane of the Purkinje cell dendrites and potentially could form strong multicontact synaptic connections on Purkinje cells. However, no recordings of these synapses exist. For these reasons we set out to characterize the granule cell→Purkinje cell connection at the single synapse level.
This work has been presented in preliminary form (Isope and Barbour, 2000, 2001).
MATERIALS AND METHODS
Slice preparation. The following procedures were adopted to minimize hypoxic, ischemic, mechanical, and excitotoxic damage to the fragile adult cerebellar tissue. They conform to national and National Institutes of Health guidelines on animal experimentation. Adult male Wistar rats (2–3 months old, 250–450 gm) were anesthetized with ketamine/xylazine (75 and 10 mg/kg, respectively) intraperitoneally. Additional (half) doses were administered if required to ensure attainment of the surgical plane of anesthesia (total abolition of plantar withdrawal reflex to nocive stimuli). Adjuvant atropine sulfate (0.2 mg/kg) usually was given intraperitoneally also. A thermocouple was positioned to monitor tympanal temperature. A tracheal catheter was placed quickly, and the rat was ventilated (14 ml ventilator stroke × 72 breaths/min) without recourse to myorelaxants. Positive end-expiratory pressure (3 cm H2O) was used when the thorax was opened in preparation for cardiac perfusion. Some vigilance was required to ensure that the airways remained patent during the thorectomy. Transcardiac perfusion of the rat with two cold, bubbled (95%O2/5%CO2) solutions was established. The first solution (150 ml) contained (in mm): 115 NaCl, 26 NaHCO3, 3 KCl, 0.8 CaCl2, 8 MgCl2, 1.25 NaH2PO4, 10d-glucose, 1 lidocaine-HCl, 1 ketamine-HCl. The second solution (100 ml) was identical except that sucrose (230 mm) replaced the NaCl. As soon as perfusion was under way, the abdominal aorta and/or the inferior vena cava were/was clamped, and the head of the rat was packed with ice. The tympanal temperature of the rat would fall to 5–10°C during perfusion. After perfusion the rat was decapitated, and the head was chilled over ice while the entire cerebellum was dissected out. Care was taken to avoid cutting or deforming the cerebellum. The cerebellum was cooled and sliced in a solution containing (in mm): 30 kynurenic acid, 230 sucrose, 26 choline-HCO3, 0.8 CaCl2, 8 MgCl2, 10d-glucose, 30 NaOH, 1.25 NaH2PO4, 1 lidocaine, 1 ketamine, 0.05 d-APV, 0.01 gabazine, 0.1 picrotoxin, 0.005 strychnine hemisulphate.
Then 450 μm slices oriented at 20° to the transverse plane were prepared (the angle makes the slices asymmetric, facilitating correct orientation for recording) and were kept in a bubbled bicarbonate-buffered solution (BBS) to which lidocaine-HCl (1 mm), ketamine-HCl (1 mm), and Na-kynurenate (2 mm) had been added. Note that this solution should minimize any activity-dependent synaptic modifications. After slicing, the slices were maintained at 32°C for 0.5–1 hr and then allowed to cool to room temperature. Drugs were obtained from Sigma-Aldrich (Saint-Quentin Fallavier, France) or Tocris-Cookson (Bristol, UK).
Recording. For recording, the slices were held 1.5 mm above the chamber bottom between nylon meshes stretched over and glued to two concentric stainless steel rings to allow solution flow below as well as above the slice. The experimental bathing solution contained (in mm): 125 NaCl, 3 KCl, 26 NaHCO3, 1.25 NaH2PO4, 2 CaCl2, 2 MgCl2, 10d-glucose, 0.1 picrotoxin, and (sometimes) 0.002 gabazine. Slices were superfused (8 ml/min) at 32°C; recordings were begun only after at least 30 min, ensuring the washing of the lidocaine and kynurenate of the storage solution (data not shown). Cells were visualized with a Zeiss Axioskop [40×, 0.75 numerical aperture (NA) water immersion objective and 0.63 NA condenser; Oberkochen, Germany] by using red light (670 ± 40 nm) and video contrast enhancement (Hamamatsu C2400-07 camera and control unit; Hamamatsu Photonics France, Massy, France). Whole-cell patch-clamp recordings in both voltage-clamp and current-clamp modes were obtained by using an Optopatch amplifier (Cairn Research, Faversham, UK) and optimal series resistance compensation (50–70% of 4–8 MΩ, typically) or capacitance neutralization as appropriate. The pipette solution contained (in mm): 150 K-gluconate, 4 NaCl, 10 HEPES, 10 Mg-ATP, and 13 biocytin pH-adjusted to 7.3 with KOH at 300 mOsm. Recordings were corrected for a junction potential of 10 mV.
Loose cell-attached stimulation and recording of granule cells were performed with a purpose-built amplifier according to Barbour and Isope (2000), with the slight modification that the stimulus voltage sometimes was recorded and used to scale failures of excitation and improve stimulus–artifact subtraction. Synaptic currents in Purkinje cells were filtered at 1 kHz and other signals at 10 kHz; sampling was at 20–50 kHz. Despite the precautions taken during slicing and the significant improvement of slice quality we achieved (it became possible to record from interneurons and Golgi cells in adult cerebellar slices; >90% of granule cells tested in loose cell-attached mode were excitable), the holding current in Purkinje cells generally increased with time. We accepted recordings for which the inward current at −70 mV did not exceed 900 pA, because recordings of compound EPSCs during development of the leak showed that their amplitude was unaffected. In five cells in which the leak increased from 300 ± 60 to 880 ± 30 pA, EPSC amplitude increased 1 ± 17%, and the charge transfer was reduced by 12 ± 6%.
Granule cells in two different regions were tested. They were either in the immediate vicinity of the recorded Purkinje cell or some 300–500 μm distant from the Purkinje cell soma (measured in the parallel fiber direction). Local granule cells are those most likely to form connections to the Purkinje cell via their ascending axon; the properties of their connections will be described below. Distant granule cells, which constitute the great majority of granule cells contacting a given Purkinje cell, can make only parallel fiber connections. Inclusion of stimulated granule cells within the beam of granule cells for which the parallel fibers intersect with the Purkinje cell (see Fig. 1) was ensured by previous delineation of the connected beam by extracellular stimulation. Stimulation of granule cells was performed in the middle (±50 μm) of this beam.
Within selected regions the granule cells were tested at random. Only granule cells in which an action potential could be distinguished clearly and elicited reliably were analyzed. Only connections in which postsynaptic responses and presynaptic action potentials had the same threshold were retained. Stimulation was adjusted to be just suprathreshold so as to minimize the probability of stimulating other nearby granule cells or axons. In calculating the mean EPSCs, we averaged together all sweeps in which granule cell excitation was successful.
Histology. Slices were fixed in 3.7% formaldehyde/PBS, pH 6.8. After ∼5 min the pH was alkalinized (Berod et al., 1981) to near pH 9 by using 4 mm NaOH. Slices were kept at least overnight at 4°C in this fixative. Revelation of the biocytin was performed in 0.4% Triton X-100/PBS-based solutions. After quenching of endogenous peroxidase activity (10% methanol; 1% H2O2) and quenching of residual fixative (50 mm NH4Cl), the biocytin was revealed by incubation overnight with an avidin–peroxidase complex (Vectastain ABC kit; washed with 0.5m NaCl-PBS), preincubation with 2 mg/ml diaminobenzidine (in a Tris buffer), and reaction with 0.002% H2O2. Slices were clarified by washes in H2O, 50% H2O/50% DMSO, DMSO, and then left for at least 1 d in 75% glycerol/25% DMSO, in which they were mounted and observed; the mounting medium works best with oil immersion objectives.
For the experiments in which the plane of the Purkinje cell dendritic tree was reconstructed, the swelling (15 ± 23%;n = 30) of the slices during fixation and treatment was corrected for by comparing the distances between landmarks in the living and treated slices. Distances are corrected to unfixed tissue.
Analysis. Acquisition of data was performed with pClamp software (version 6 or 8). Analysis was performed in the IGOR graphing and analysis environment (Wavemetrics, Lake Oswego, OR), using home-developed macros. Means are reported with SD. On several occasions we applied the nonparametric “bootstrap” method described by Efron and Tibshirani (1993) for estimating the SE of complex parameters, in particular the release probability. (In their terminology a SE is the SD of a sample parameter; the best known is, of course, that of the sample mean.) Briefly, traces were selected randomly, with replacement, from those initially analyzed, until an equal number was accumulated. Then the original analysis simply was reapplied to this replicate data set, and “bootstrap replicates” of the desired parameter were produced. Repetition of this procedure 50 times generated sufficient replicates to estimate the SE of the parameter replicates. Despite the apparent circularity of reusing the sample data, the theory underpinning bootstrap methods has demonstrated that the SE that is obtained will be a good approximation to that of the underlying population.
RESULTS
Parallel fiber connections
We recorded unitary granule cell→Purkinje cell synaptic responses at 32°C in pseudo-transverse slices prepared from adult rats (Fig. 1). Purkinje cells were whole-cell clamped to −70 mV via a somatic patch pipette, and the EPSCs elicited by stimulating granule cells were recorded. Combined loose cell-attached stimulation and recording (Barbour and Isope, 2000) were applied to granule cells. Paired or triple pulse stimulation (40 msec intervals) was applied routinely.
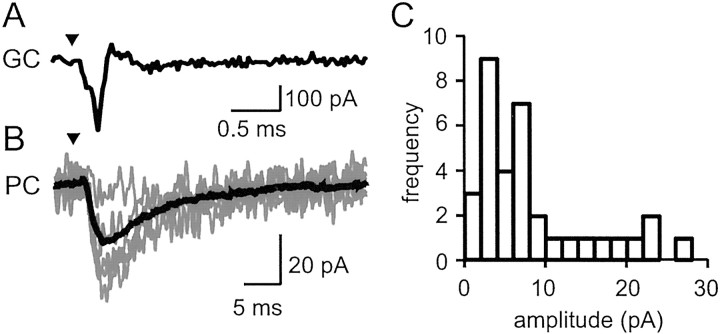
A specimen recording of a parallel fiber synaptic connection (Fig.2A,B) shows the granule cell action potential, recorded as a capacity current, and several EPSCs in the Purkinje cell. In all, 477 on-beam excitable granule cells in this distance range were screened. Of these, 34 generated detectable responses. The mean amplitude for these parallel fiber synapse responses was 8.4 ± 7.1 pA (Fig. 2C). The distribution of mean amplitudes was skewed toward larger values.
Fig. 2.
Unitary parallel fiber→Purkinje cell connections. A, A granule cell action potential evoked and recorded in loose cell-attached mode. Stimulus timing is indicated by the triangle. The stimulus artifact has been subtracted (see Materials and Methods). B, Several EPSCs recorded in the Purkinje cell (fine lines) plus the average EPSC (thick line; n = 116). Note the slower time base. C, Histogram of the mean amplitudes for all detected EPSCs (n = 34 of 477) of granule cells 300–500 μm from the recorded Purkinje cell. The distribution parameters are reported in Results.
To expedite screening of granule cells, the experimenter determined the identification of connected granule cells “by eye,” with off-line averaging in cases of doubt. Under these conditions the mean amplitude for the detected connections was usually >2–3 pA. Although the objection can be made that this method is subject to human error, the likely error introduced appears to be small, because off-line averaging of 50–100 sweeps of connections classified as undetectable (n = 13) did not unmask any further connections. For nearly all recordings in which no response was apparent, we elicited a train of action potentials by increasing the stimulation intensity. This eventually induces the granule cell to emit a train of action potentials at frequencies of a few hundred Hertz (possibly by causing partial membrane breakdown). In a few cases (n = 5 of 400+ apparently nonconnected granule cells) this train induced a postsynaptic current. Unfortunately, probably because of damage to the granule cell, it was difficult to apply such stimulation repetitively. We are uncertain as to the mechanisms generating these responses.
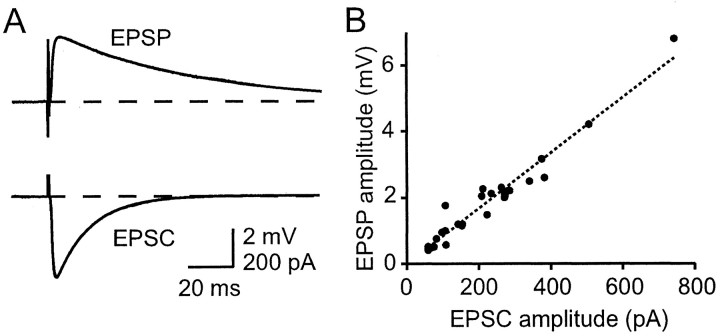
To estimate the size of the EPSP that would be generated by EPSCs of given sizes, we performed successive current-clamp and voltage-clamp recordings of compound responses to extracellular stimulation in the granule cell layer (Fig. 3A). The average compound EPSC kinetics values when fit by bi-exponential waveforms were τrise = 1.2 ± 0.7 msec and τdecay = 13.9 ± 2.3 msec (n = 5). The corresponding values for the EPSPs were τrise = 2.6 ± 1.2 msec and τdecay = 63 ± 29 msec. Responses to different stimulus intensities were used to construct a calibration curve, in fact a simple proportionality, relating peak EPSC and EPSP amplitudes (Fig. 3B). This allowed us to estimate synaptic weights, which we shall define as peak somatic depolarization, from the EPSC for each connection. Using the calibration of Figure 3, we deduce that the simultaneous activation of some 150 parallel fiber inputs of average size will excite a Purkinje cell from −70 mV (the threshold for a Purkinje cell is approximately −60 mV, measured in sagittal slices to preserve a greater length of axon). This represents a tiny fraction (∼0.1%) of the total number of parallel fiber inputs to a Purkinje cell.
Fig. 3.
Estimating synaptic weights. A, Subthreshold compound EPSCs and EPSPs evoked by the same extracellular stimulation in the granule cell layer. Both synaptic responses are averages of 20 sweeps. Both are fit with bi-exponential functions (superimposed). For the EPSP that is shown, τon = 0.93 msec and τoff = 62 msec; for the EPSC, τon = 0.72 msec and τoff = 15 msec. B, Data like that ofA (28 determinations in 10 cells) plotted to obtain an approximate factor of conversion from EPSC to EPSP peak amplitude. The slope of the line constrained to pass through the origin is 8.3 μV/pA.
We quantified unitary EPSC kinetics by using bi-exponential fits, one for the rising phase and one for the decay phase. These fits proved to be quite affected by the noise, and bootstrap estimation of the SEs of the derived time constants showed them to be rather unreliable. For this reason we excluded from the kinetics analysis all events for which the mean amplitude was below 5 pA. For these larger parallel fiber EPSCs the average time constants were τon = 1.0 ± 0.7 msec and τoff = 11.1 ± 5.7 msec (n = 24). Plots involving these kinetic parameters will be presented below for a larger data set.
Some unitary parallel fiber EPSCs appeared to display bi-exponential decays (data not shown). Because each connection normally involves just a single synaptic contact (or two in the same place on the dendritic tree), a mix of differentially filtered EPSCs is probably not the explanation for this time course. One possible explanation is that such synapses are quite proximal, and the first of the decay exponentials represents the redistribution of charge into the dendrites and pipette, with the second decay exponential reflecting recovery of the charge that had redistributed into more distal dendrites.
Generally, although identification of granule cell excitation was secure, the subtraction of the stimulus artifact was not always sufficiently good to permit precise alignment on the peak of the action potential signal. The averages therefore include the effects of jitter in action potential timing. This will lead to some lengthening of the EPSC rising phase. The EPSC decay phase was in most cases too slow for it (or the amplitude measurement) to be affected significantly by action potential timing jitter.
Probability of release
Based on an analysis of paired pulse facilitation at the parallel fiber→Purkinje cell synapse, it has been reported that the average probability of liberation at release sites at this synapse is particularly low (Dittman et al., 2000); an upper limit of 5% was given. Inspection of our paired recordings suggested that the overall release probability was rather high, in apparent contradiction with the literature value, so we set out to quantify this parameter.
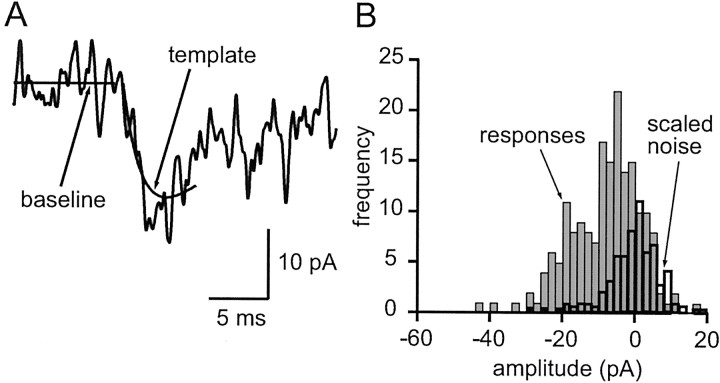
Our overall approach was to compare amplitude histograms, which contain a mixture of failures and successes of liberation, with measurements of noise, which have the same distribution as the response failures. To maximize the accuracy of the measurement of response amplitudes, we used a template-based method. The template for each connection was based on the bi-exponential fit of the corresponding average EPSC. So as to minimize disturbance of the measurement by spontaneous EPSCs, we used a relatively short template that covered the rising phase and peak of the EPSC but only a portion of its decay. The measurement stage simply involved adjusting the amplitude of the template to fit each sweep. A specimen trace fit by a template is shown in Figure4A. Simulations (data not shown) demonstrated that measurements were fairly insensitive to realistic jitter in EPSC onset (SD of <0.5 msec). Noise measurements were obtained by applying exactly the same procedure to portions of traces that contained no evoked responses.
Fig. 4.
Method of amplitude measurement for individual EPSCs. A, A truncated version of the bi-exponential fit of the average EPSC was scaled to each individual EPSC by using a least-squares criterion, yielding an automatic amplitude estimate for each sweep. The baseline and scaled template are shown superimposed on an EPSC. B, Amplitude distribution (light shaded histogram) for the same connection, constructed from amplitude measurements as in A. An equal number of identical measurements was performed on trace segments in which the granule cell was not stimulated (or active) to estimate the amplitude distribution expected for failures of transmission. This noise distribution was scaled (heavy open histogram) to fit the response distribution for amplitudes greater than (to right of) zero (shaded range). The scaling provides an estimate of the probability of failure, 0.36 in this case.
Once the EPSC amplitude and noise histograms had been obtained, the probability of failure was estimated by scaling (by the standard least-squares method) part of the noise distribution to fit the corresponding range of the EPSC amplitude distribution. We chose to scale the noise and EPSC amplitude distributions for values greater than zero (EPSCs having negative amplitudes by convention). Figure4B shows the EPSC amplitudes for the same connection as in Figure 4A and the scaled version of the noise distribution.
Figure 5A shows a scatter plot of the failure probability estimates against mean amplitudes. Although the estimated failure probability is quite low for the largest connections, there is a strong trend for the smaller connections to yield higher estimates of failure probability. We know, however, that the measurement method will always tend to overestimate the failure probability (because noise could cause small successes to have amplitudes greater than zero) and that this problem will be exacerbated for small amplitudes. A simple model (Fig. 5B) can be used to illustrate the expected behavior of our method of estimating release probability. We assumed EPSC amplitudes and noise were Gaussian and arbitrarily set the SD of the amplitudes of successful releases to be 40% of their mean. These assumptions are unlikely to be exact, but it would be difficult to obtain more detailed information. We set the SD of the noise to be 5.8 pA. The noise distributions have a mean SD of 7.3 pA, but they are slightly asymmetric. Because the histogram fitting uses the right-hand side of the noise distribution, we reflected that half of each noise distribution about zero and then recalculated the mean SD (i.e., 5.8 pA). For a given failure probability we then could calculate the proportion of failures that would be estimated by our method. The expected estimates are plotted as a function of mean amplitude in Figure 5A as a family of curves for different underlying failure proportions. Different values of the coefficient of variation of the successes were tested (Fig. 5, see legend), showing the low sensitivity of the model to this parameter.
Fig. 5.
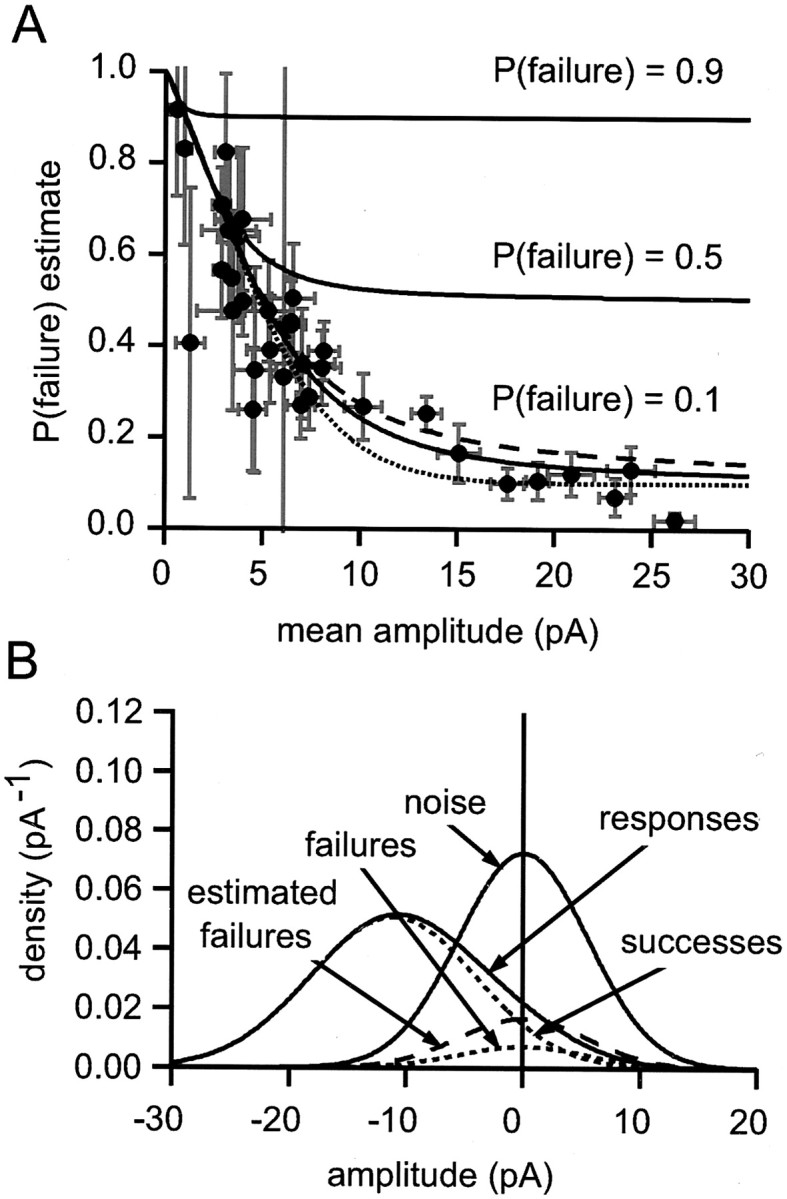
Distribution of failure probability estimates for parallel fiber synapses. A, The failure probability estimates are plotted as a function of mean amplitude with their bootstrap SE estimates. The smooth curves (solidlines) are relations obtained by using the model illustrated in B. Each theoretical relation is for a fixed underlying failure probability (labeled). B, Illustration of the model used to calculate the theoretical curves inA. A Gaussian noise distribution (SD of 5.8 pA;noise, shown by a solid line) was convolved with a Gaussian success amplitude distribution [probability of 0.9, amplitude of 11.11 pA, SD of 4.44 pA; therefore, coefficient of variation (CV) of 0.4] and failures (probability of 0.1, amplitude of 0). The resulting distribution components are labeledsuccesses and failures (dotted curves); their sum is the responses probability density function (solid line), which models the experimentally determined amplitude distribution. The best-fit scaled version of the noise distribution is shown also (estimated failures, shown by the dashed line). It overestimates the true failure probability by a factor of ∼2. Variation of the CV of successes had little effect on the overall shape of the amplitude-estimated P relations that were obtained. The dotted and dashed curves inA were obtained with CVs of 0.15 and 0.5, respectively.
The curves showing the estimated failure probability for a trueP(failure) of 0.1 give a remarkably good fit to the data. It is clear that a narrow range of failure probabilities (∼0.1) could account for all of our data, which thus provide no evidence for the existence of low release probability connections.
Paired pulse facilitation
The parallel fiber connections displayed modest paired pulse facilitation at the 40 msec interval that was tested. Using a method analogous to that of Kim and Alger (2001) to calculate the mean paired pulse ration for our connections, i.e., adding the mean amplitudes A1 for all connections and then dividing by the sum of all mean amplitudes A2, we obtained a value of 1.36 (n = 34 connections). In a separate series of recordings we applied triplet stimulation. The ratio A3/A2 calculated in the same way was 1.07 (n = 41).
We examined paired pulse facilitation of compound responses to extracellular stimulation in the molecular layer and in the granule cell layer (also at 40 msec intervals). Surprisingly, although stimulation in the granule cell layer produced similar facilitation (A2/A1, 1.37 ± 0.14; A3/A2, 1.08 ± 0.12; n= 8) to that reported above for unitary connections, stimulation in the molecular layer produced significantly greater facilitation (A2/A1, 1.70 ± 0.19; A3/A2, 1.30 ± 0.09; n = 8;p < 0.01 for the difference of A1/A2; Mann–WhitneyU Test). The similarity of the paired pulse ratios for the unitary connections and compound responses elicited by granule cell layer stimulation strongly suggest that our sample unitary connections are representative of the population.
Undetected connections
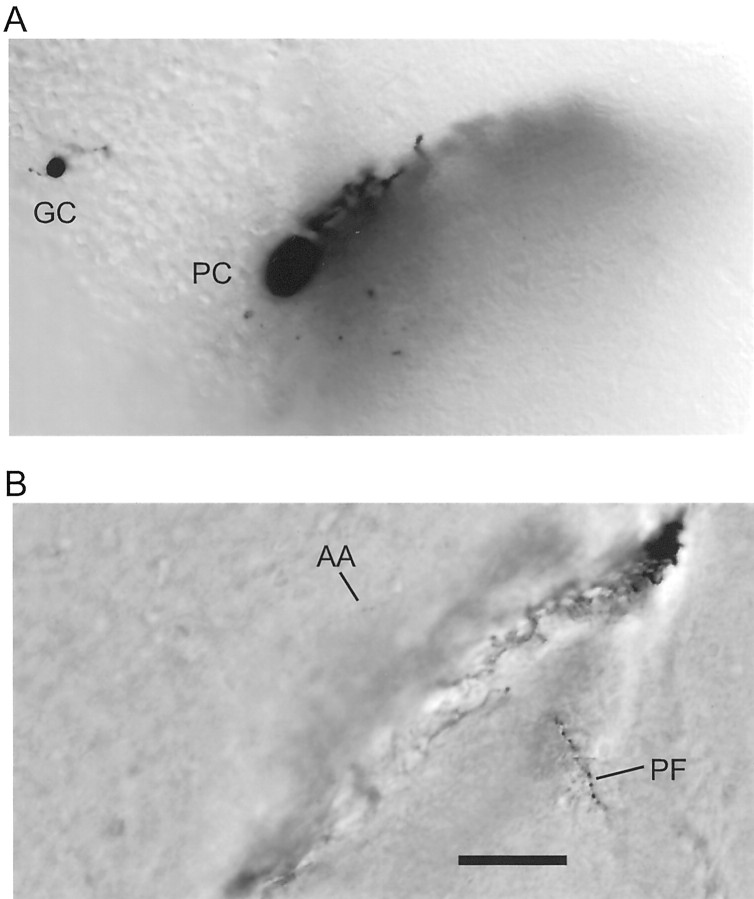
When selecting granule cells to screen, we ensured their location within the beam connecting the recorded Purkinje cell by previous extracellular stimulation. Under these circumstances most of the parallel fibers are expected to intersect with the dendritic tree of the Purkinje cell. We confirmed this with a series of paired whole-cell recordings in which both granule cell and Purkinje cell were labeled (Fig. 6; no responses were detected in these whole-cell pairs). The separation between the cell somata was 50–100 μm, and the granule cells were simply guessed by the experimenter to be on-beam. Even so, in 17 of 20 successfully labeled pairs the parallel fiber passed within the perimeter of the Purkinje cell dendritic tree; i.e., at the point of intersection with the dendritic plane, the parallel fiber had dendrite to its left, its right, and above and below it. Because it was rarely possible to distinguish the parallel fiber in the dendritic tree (because of shadowing by the dendrites), these criteria usually were applied to the parallel fiber just either side of the dendritic tree.
Fig. 6.
Morphology of a typical intersection of a parallel fiber and a Purkinje cell dendritic tree. Shown are a granule cell (GC) and Purkinje cell (PC) pair filled with biocytin during the whole-cell recording (without a detectable connection) and subsequently labeled. A, Somatic level. The plane of Purkinje cell dendritic tree extends down into the slice in a bottom left to top right plane.B, Near the level of intersection. The parallel fiber (PF) is seen shortly after it has traversed the dendritic tree near its middle. The parallel fiber is an enhanced montage of two images separated by 10 μm vertically. Only a tiny section of the ascending axon (AA) is captured in the image, although it could be followed easily when the focus is adjusted continuously. Scale bar, 50 μm.
We are therefore confident that the parallel fibers of most of the granule cells we screened would have intersected with the Purkinje cell dendritic tree. The careful anatomical work of Napper and Harvey (Harvey and Napper, 1988, 1991; Napper and Harvey, 1988a,b) provides an estimate of the probability of a synapse being formed for this situation: 54%. Our results stand in apparent contradiction to this prediction: for only 34 of 477 (7%) screened granule cells could we detect a synaptic response. We consider there to be three main hypotheses that could explain this difference. The first is that the action potential in the parallel fiber often fails to reach distant synapses; the second is that many connections have extremely low release probabilities, such as to remain undetectable by using the stimulation protocols described above; the third is that some synapses have few or no functional postsynaptic AMPA receptors. We test the first two possibilities in this section.
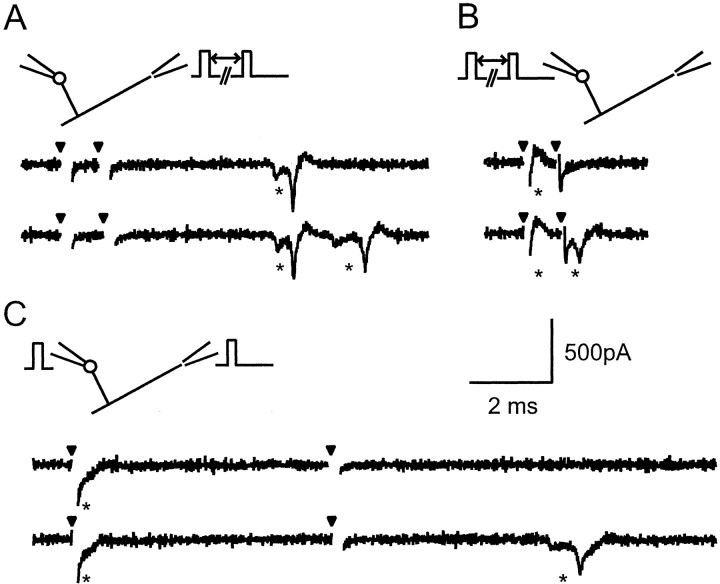
The possibility that action potentials in parallel fibers fail to propagate reliably is raised often. A favorite site for the block of propagation is the “T” at which the ascending granule cell axon bifurcates into the two halves of the parallel fiber. A more prosaic problem that also needs to be addressed in our experiments is the fraction of granule cells for which the axons are cut near the slice surface. We were able to rule out important contributions from either of these mechanisms by combining loose cell-attached recording with antidromic stimulation of parallel fibers at the exposed surface of the molecular layer. It was usually possible (11 of a series of 14 granule cells tested) to demonstrate the ability of the parallel fiber to support antidromic conduction and, moreover, to confirm collision between the antidromic action potentials and orthodromic action potentials elicited at the soma. This suggests that few granule cell axons are cut in our preparation and that most can conduct antidromic action potentials along their length and orthodromic action potentials along at least some of their length.
Using an extension of this approach, we were able to demonstrate that orthodromic action potentials are conducted very close to the site of stimulation in the molecular layer. This is illustrated in Figure7. By increasing the separation between the stimulation site and the granule cell, we recorded five further granule cells with long antidromic conduction times, ranging from 4 to 8 msec, to enable clear observation of the conduction process. The refractory period in all of these cells for both orthodromic and antidromic stimulation was of the order of 1 msec (the slightly surprising form of the antidromic actions potentials recorded in loose cell-attached mode is explained in the legend). We then performed a collision experiment to determine how long after orthodromic stimulation an antidromic action potential would still collide with the orthodromic action potential. In each cell the behavior shown in Figure7 was observed; a delay of one conduction time plus a refractory period had to elapse before the antidromic stimulation was successful. We conclude that orthodromic action potentials usually are able to propagate very near to the cut ends of the parallel fibers in the exposed molecular layer, beyond the sites of the synapses we expected to record.
Fig. 7.
Action potential propagation along parallel fibers is not compromised. A, Loose cell-attached recording of a granule cell soma during molecular layer stimulation. The latency between the stimulus and arrival of the antidromic action potential (mostly conduction) in this cell was 5.3 msec (top trace, from left triangle toasterisk marking the antidromic action potential). Paired stimuli show that the refractory period was ∼1 msec. The intervals between the two stimuli are 0.9 msec (top trace, one action potential) and 1.0 msec (bottom trace, two action potentials). B, Paired pulse somatic stimuli similarly reveal an orthodromic refractory period of 0.9 msec. The intervals between the two stimuli are 0.8 msec (top trace, one action potential) and 0.9 msec (bottom trace, two action potentials). C, So that annihilation by collision with the orthodromic action potential (somatic stimulation) can be avoided, an antidromic action potential (molecular layer stimulation) must be elicited >6.3 msec later. The intervals between the two stimuli in the panel are 6.3 msec (top trace, antidromic action potential absent) and 6.4 msec (bottom trace, antidromic action potential present). This interval indicates that the orthodromic action potential is conducted to the site of antidromic stimulation, beyond the point at which Purkinje cells would have been recorded. The surprising form of the loose cell-attached action potential signal (e.g., inA) corresponds to an intracellular action potential with an inflection on the rising phase. This is because the loose cell-attached signal is essentially a capacity current, proportional to the first derivative of the membrane potential (Barbour and Isope, 2000); as such, it is quite sensitive to changes of action potential shape. The inflection probably reflects a delay between the arrival of the axonal antidromic action potential and invasion of the soma. Most of the orthodromic action potentials elicited in the soma are obscured in part by the stimulus artifacts (which were not subtracted). All action potentials were identified with respect to known failures of excitation.
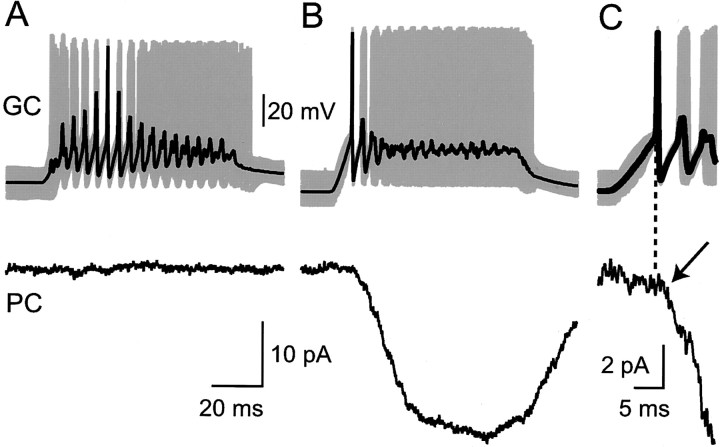
If connections had a very low release probability (Dittman et al., 2000; Gasparini et al., 2000), our stimulation might not have allowed for their detection in the paired recordings, and such connections may not have contributed to the compound responses. We therefore performed an additional test for the presence of such very-low-probability connections by averaging responses to high-frequency trains of action potentials. This was performed by using whole-cell recording of the granule cell, because the required stimulation in loose cell-attached mode usually damaged the granule cell rapidly and irreversibly. Fourteen granule cell→Purkinje cell pairs were recorded, in a similar anatomical arrangement to that illustrated in Figure 6 (except the somata were closer). At least 100 trains of action potentials at 150–250 Hz lasting 70 msec were averaged for each pair. We averaged without alignment on the action potentials, aligned with action potentials at the beginning of each train, aligned on an action potential ∼25 msec into the train (at approximately the fifth action potential), or aligned with the last action potential. In 11 cells no response at all could be detected (Fig.8A). Two of 14 pairs clearly were connected (Fig. 8B), and a small response (∼2 pA) was observed after the first action potential (Fig.8C). These connections therefore appear to be typical small connections of the sort already analyzed above, although they probably would have been near the limit of detection with our standard protocol. In the remaining cell, which was unfortunately a bit noisier, we were unable to decide whether a small response was present or not. However, the maximum average amplitude of response, aligned on any action potential in the train, was not >3 pA. These data argue against a significant proportion of strong connections in which no response is detected because of a very low release probability.
Fig. 8.
Whole-cell paired recordings reveal no strong parallel fiber connections with very low release probabilities. In each panel the toptraces represent the average (black line) of >100 high-frequency bursts of action potentials in a granule cell (gray lines). The bottom traces show the average responses recorded in a Purkinje cell. A, A pair showing no detectable response. The averages were formed after alignment on approximately the fifth action potential of the train (n = 191).B, Another pair in which a response was detected. In the panel the averages were calculated after alignment on the first action potential of the train (n = 137). Aand B share calibrations. C, A detail (expanded time and current scales) of the averages in Bshows that a clear response onset (arrow) can be observed some 2 msec after the first action potential (timing indicated by the dashed vertical line).
Proximal granule cells
A long-running controversy in cerebellar physiology concerns the role of granule cell ascending axons. Parallel fibers, because they run orthogonally to the planes of Purkinje cell dendritic trees, usually make zero, one, or two synaptic contacts with each Purkinje cell. The situation is more confused for the short segments of granule cell axon that rise vertically through the molecular layer. Because these can be parallel to the Purkinje cell dendritic planes, they potentially could make numerous contacts with a given Purkinje cell. This possibility has led a number of workers to suggest that ascending axons are an important, even the dominant, input from granule cells to Purkinje cells. However, a detailed comparison of parallel fiber and ascending axon synapses has not been performed.
We sought to record from granule cells making ascending axon connections. Because we have no method of identifying such cellsa priori and any difference in synaptic properties appeared to be subtle, we developed a method that allowed us to determinea posteriori which granule cells were those most likely to have made an ascending axon connection and to pool results from several experiments. During an experiment we would take a video still of each granule cell that was screened. The Purkinje cell was labeled. After fixation and treatment of the slice, the plane of the Purkinje cell dendritic tree was reconstructed by drawing the intersection of the dendrites with each of a z-series of images and calculating the “best-fit plane” to these line segments. Comparison of the video stills and the reconstructed Purkinje cell allowed us to determine the position of each recorded granule cell with respect to the Purkinje cell. We then calculated the orthogonal distance of each granule cell to the Purkinje cell dendritic plane. When significant portions of the Purkinje cell dendritic tree were on different planes (even double dendritic trees occasionally are observed), the distance to the nearest dendritic plane was calculated. In this way we could pool results from many experiments by examining synaptic properties as a function of distance from the dendritic plane. We assume that granule cells in this plane are those most likely to form ascending axon synapses.
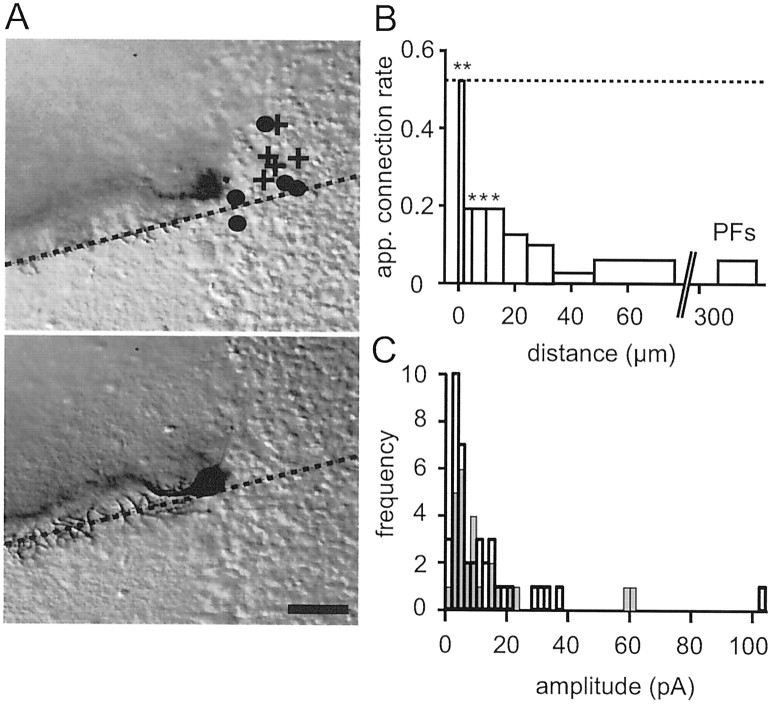
Figure 9A shows a reconstructed experiment. The positions of 10 screened granule cells are indicated on the surface plane. Most of those for which synaptic connections were detected appear to be clustered around the dendritic plane. Pooling the results from a number of Purkinje cells showed that this was not an accident (Fig. 9B). A remarkable peak, reaching ∼50%, in the probability of detecting a connection is observed in the dendritic plane. The probability of connection falls off fairly rapidly with distance from the dendritic plane, and beyond 20 μm it is not significantly different from the probability obtained for parallel fiber connections from distant (300–500 μm) granule cells.
Fig. 9.
Local granule cells constitute a privileged input, but powerful ascending axon connections are rare. A, Two image planes (top, slice surface; bottom, 10 μm below the surface) showing a labeled Purkinje cell. The intersections of the best-fit plane for the dendritic tree and the image planes are indicated by the dotted lines. The reconstructed positions of connected granule cells are indicated by afilled circle and nonconnected granule cells by across. Scale bar, 50 μm. B, Apparent connection rate (number of detectable responses/total number of granule cells tested) as a function of distance of the granule cell soma from the dendritic plane of the Purkinje cell. Each bin except the first and last represents 30 tested granule cells. The first (left-most) bin contains 15 granule cells and the last (for granule cells at 300–500 μm) contains 477. The significance of the differences between the apparent connection probabilities near to the Purkinje cell and that for parallel fibers is indicated over the relevant bins by asterisks (**p < 10−5; *p < 0.05; Fisher's Exact Test). The dotted horizontal line indicates the expected probability (0.54) of an anatomically defined synapse existing (see Results). C, Histogram of mean amplitudes for connections from granule cells within 35 μm of the dendritic plane of the Purkinje cell (light lines, shaded bars). Note two large responses of putative ascending axon connections. The distribution parameters were mean = 12.4 pA and SD = 15.7 pA (n = 28 of 166). A similar histogram of a series of connections for which reconstructions were not performed but the granule cell was close to the Purkinje cell is superimposed (heavy lines, open bars). Large responses were also infrequent in this sample. The distribution parameters were mean = 12.4 pA and SD = 14.1 pA (n = 40).
Synaptic connections made by ascending axons have been proposed to differ from parallel fiber synapses in a number of ways. First, they generally are thought to form relatively powerful connections by virtue of making multiple synaptic contacts on a Purkinje cell. Figure9C shows the amplitude distribution for granule cells located within 35 μm of the dendritic plane. Overall, the EPSC amplitude distributions of connections from proximal and distal granule cells were remarkably similar. Only two proximal granule cells gave amplitudes that were clearly greater than those attainable by parallel fiber connections (based on our small sample). However, even these two large connections, which presumably were from ascending axons making multiple contacts, were no more than approximately twice as large as the largest parallel fiber connections. A similar distribution was obtained when we attempted to record from granule cells on or near the dendritic plane but for which no reconstruction was available (Fig.9C). This suggests that even moderately large connections are quite rare.
Two other differences have been reported between parallel fiber and ascending axon synapses, based on electron microscopic reconstructions (Gundappa-Sulur et al., 1999). Varicosities of ascending axons contained greater numbers of synaptic vesicles than those formed by parallel fibers. Ascending axon connections therefore might be expected to have a higher release probability and lower paired pulse facilitation. The other difference, that the parent dendrites of spines contacted by ascending axons were thinner than those for parallel fibers, was interpreted as showing that ascending axon synapses are made preferentially on the termini of spiny branchlets. This might be expected to lead to greater filtering of EPSCs from the more distal ascending axon synapses. In fact, the modeling of Roth and Hausser (2001) suggests that only very subtle differences in EPSC kinetics are to be expected because synapse position is varied along a spiny branchlet, so this suggestion does not give rise to a prediction that can be tested with our electrical recordings.
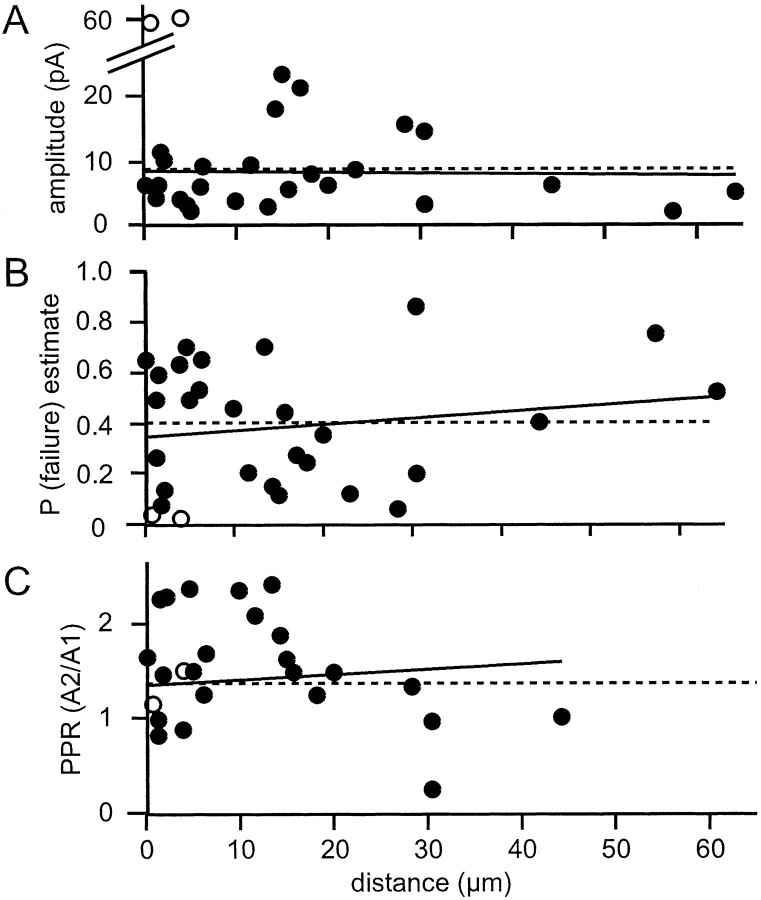
Although we could not identify granule cells making ascending axon connections, any such cells are likely to have been among those contributing to the high connection probability near the Purkinje cell dendritic plane. How do the synaptic properties of this population of granule cells “enriched” in ascending axon connections compare with those for pure parallel fiber synapses? Figure10 shows plots of connection properties expected to differ between ascending axons and parallel fibers as a function of distance from the dendritic plane. If the two strong connections were excluded, the amplitudes of the remaining proximal granule cell connections showed no trend toward greater values at the dendritic plane. Plots of estimated release probability and paired pulse facilitation against distance from the dendritic plane show a similar lack of any detectable trend (Fig. 10), and the average values were very close to those for more distal granule cells. Thus most proximal granule cell connections appear to be indistinguishable from those of parallel fibers. Note that the wide spread of individual paired pulse ratios results at least in part from the low signal-to-noise ratio of the amplitude measurements of the smaller connections.
Fig. 10.
The properties of connections from proximal connections are similar to those of parallel fiber connections. Shown are plots of connection amplitude (A), estimated failure probability (B), and paired pulse ratio (C) as a function of distance from the Purkinje cell dendritic plane. Dashed lines represent the mean values for parallel fiber connections, and the solid lines are the best-fit lines. The two large amplitude connections (open circles) were excluded from the regression calculation for the amplitudes. Note that the meanP(failure) estimate (B) represented by the dashed line is for the parallel fiber connections shown in Figure 5A.
Summary of granule cell→Purkinje cell connection kinetic properties
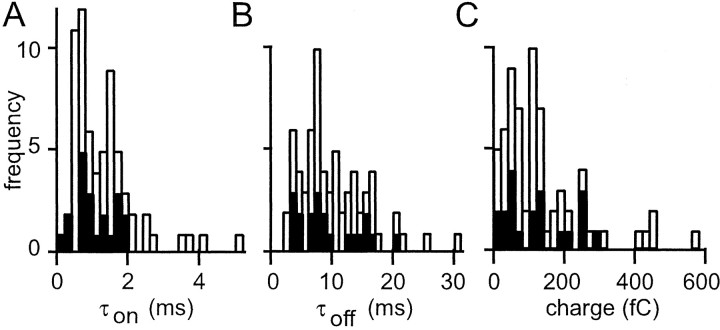
Figure 11 summarizes the kinetics analysis of the connections we recorded. Average EPSCs were fit with bi-exponential functions. Because of the sensitivity of the fits to the levels of noise, Figure 11 contains only the parameters of kinetics from connections for which the EPSC amplitude exceeded 5 pA. By integrating the (extrapolated) bi-exponential fits, we estimated the EPSC charge transfer. This is probably a reasonable estimate of the synaptic charge. This can be argued as follows. First, inspection of the EPSP kinetics of Figure 3 indicates that charge loss via the membrane conductance is relatively slow. Such loss is governed by the membrane time constant, which can be estimated from the decay of the EPSP. This is clearly too slow to affect the response peaks of the EPSC and EPSP. It is also fairly slow compared with the rate of EPSC charge recovery in voltage clamp, suggesting that integration of the EPSCs will provide a reasonable indication of the total synaptic charge (Carnevale and Johnston, 1982), in agreement with several studies showing the electrical compactness of Purkinje cells (Shelton, 1985;Rapp et al., 1994; Roth and Hausser, 2001). Despite the 5 pA amplitude threshold the analyzed EPSCs display a wide range of synaptic charges.
Fig. 11.
Kinetic properties for all granule cell→Purkinje cell pairs. A, Histogram of rising phase time constant for bi-exponential fits to average EPSCs with an amplitude >5 pA. The filled bars represent parallel fiber connections. B, Similar histogram for decay time constant. C, The bi-exponential fits were used to estimate the mean synaptic charge transfer for each connection (with an amplitude >5 pA).
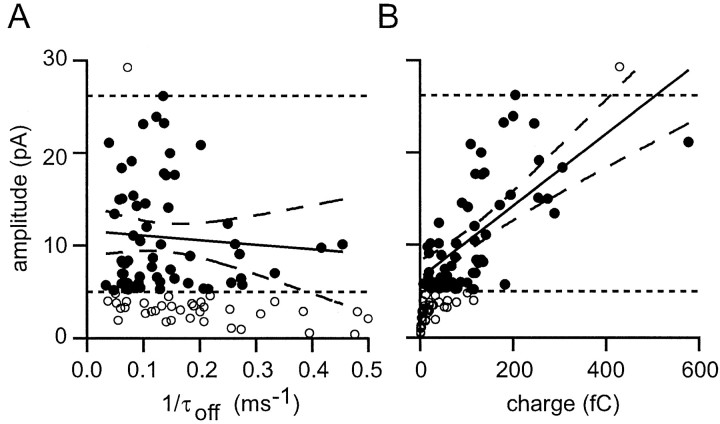
Varying synaptic charge naturally will cause a proportional variation of EPSC amplitude. Similarly, the stronger dendritic filtering of more distal synapses might be expected to attenuate their somatic responses more than occurs for proximal inputs. To compare the importance of these two factors, charge and filtering, we examined to what extent they were correlated with EPSC amplitude. If we assume that τon ≪ τoff in the bi-exponential fits of EPSC waveform, the synaptic charge (Q) can be approximated by Q = τoff × A, where A is the amplitude. Accepting this approximation, we can see that, for fixed charge, the amplitude is proportional to 1/τoff. For this reason we plotted amplitude against 1/τoff in Figure12A. Only connections with mean EPSCs >5 pA were analyzed, and connections stronger than the strongest parallel fiber connections also were excluded (because multicontact ascending axon connections necessarily will have large synaptic charges). Surprisingly, no correlation at all could be demonstrated between amplitude and 1/τoff(p > 0.5). In contrast, a very significant correlation (p < 0.001) was observed between amplitude and charge (Fig. 12B).
Fig. 12.
EPSC amplitude is correlated with synaptic charge, but not kinetics. A, Plot of mean EPSC amplitude against reciprocal of the decay time constant from the bi-exponential fit of the EPSC. Small and large EPSCs (open circlesbelow and above the dashed lines, respectively) were not included in the regression calculation (see Results). The best-fit regression (solid line) is shown with the 95% confidence limits (dashed curves). B, A similar analysis shows that a significant correlation exists between EPSC charge and amplitude.
DISCUSSION
Determinants of the synaptic weights of parallel fiber→Purkinje cell connections
The present recordings of parallel fiber connections, obtained at 32°C in slices from adult rats, have confirmed the existence of a wide range of unitary EPSC amplitudes (Barbour, 1993) and further suggest that a large fraction of these synapses is so weak as to produce no detectable somatic response. We postulate that this variability reflects synaptic modifications acquired during (motor) learning in the rat's life. Our data throw some light on the possible mechanisms of these modifications.
In general, presynaptic mechanisms are not favored by our data. Action potential propagation appears to be reliable. Our release probability estimates are consistent with overall release probabilities falling within a fairly narrow range of elevated values (∼0.9), and these values are accurate for the strongest connections. Our estimates of release probability for small connections, although consistent with a similar value of underlying probability, are more uncertain because of the experimental noise. Nevertheless, we still can conclude that connections >5 pA have failure probabilities below 0.5. We were unable to demonstrate the existence of very-low-probability connections by using action potential trains. It should be noted that, depending on synaptic parameters such as receptor saturation and the existence of multivesicular release, it is possible for small variations of a low failure probability to be associated with quite significant alterations of response amplitude. Our data are not of sufficient quality to rule out a contribution of release probability to determining the distribution of synaptic weights, but we derive no support for this hypothesis from our data.
The apparently high release probability in our recordings is awkward to reconcile with the conclusion that it is <5% (Dittman et al., 2000). Certainly, the 5% probability can be interpreted as corresponding to a single release site, whereas ours is the overall value for a connection that may involve several release sites. However, it would be necessary to combine some 45 release sites with a release probability of 5% to attain 90% overall; a recent determination of the numbers of docked vesicles would indicate a number nearer 7–8 (Xu-Friedman et al., 2001). The estimate of 5% release probability was derived from a model of paired pulse facilitation based on data from young animals in which a significantly greater facilitation was observed than in our unitary connections. This could be taken as showing that facilitation decreases (and release probability increases) with age, except that we reproduced strong paired pulse facilitation by using molecular layer stimulation. We suspect that compound responses evoked by molecular layer stimulation, as opposed to granule cell layer stimulation, in some way may be unrepresentative of unitary connections. Stimulation in the molecular layer activates a dense bundle of fibers that is unlikely to be physiological (Wang et al., 2000). Several mechanisms may contribute to the observed facilitation, including fiber recruitment (Merrill et al., 1978) via persistent depolarization or potassium build-up (Kocsis et al., 1983), glutamate spillover (Barbour et al., 1994), and voltage-dependent dendritic conductances.
Several postsynaptic mechanisms could contribute to the spread of synaptic weights. Somewhat surprisingly, the degree of filtering (estimated from the EPSC kinetics) had no predictive power for EPSC amplitude. This can be explained in part by the modest variations (less than ∼2.5-fold) of dendrite–soma attenuation of synaptic responses with dendritic location (Roth and Hausser, 2001). Nevertheless, the complete absence of any correlation may reflect the operation of compensatory mechanisms such as reported in hippocampal pyramidal cells (Magee and Cook, 2000).
Not only is a wide range of synaptic charges observed, but the synaptic charge was correlated strongly with EPSC amplitude. One obvious source of variable synaptic charge is the number of synaptic contacts involved: one and two contacts occur frequently (Harvey and Napper, 1988; Napper and Harvey, 1988a,b); it is not known how commonly more contacts can be made between a parallel fiber and Purkinje cell pair. Another plausible explanation for the wide variation of synaptic charges is different numbers or sensitivity of postsynaptic receptors. Labeling of AMPA receptor subunits (particularly GluR2) thought to be expressed at these synapses (Tempia et al., 1996; Hausser and Roth, 1997) revealed a wide range of receptor densities, with a significant fraction of synapses displaying no staining at all (Zhao et al., 1997). This would be consistent with our suggestion that many parallel fiber→Purkinje cell synapses generate only insignificant or no electrical responses.
Finally, Purkinje cells possess several voltage-dependent conductances (Llinas and Sugimori, 1980; Crepel and Penit-Soria, 1986) that might shape the synaptic responses. However, beyond the demonstrations that synaptically induced simple spikes are initiated in the axon hillock (Stuart and Hausser, 1994) and that calcium channels in spines and dendrites can open in response to synaptic input (Takechi et al., 1998), the extent of involvement of voltage-activated conductances in the synaptic responses is not known.
It has been postulated that only a small fraction of parallel fibers is active at a given time (Marr, 1969; Albus, 1971). For this to be so, a small fraction of parallel fibers must be capable of exciting a Purkinje cell, which we show here is possible. The difference between the present estimate (150) and that obtained in young animals (30) appears to result from a larger average EPSC in the young animals (some large ascending axon connections probably were included) and the much lower capacitance that must be charged to threshold in the young Purkinje cell: ∼300 pF compared with 1500 pF for the adult (Roth and Hausser, 2001). The estimate we obtain is approximate. It does not take account of the large fraction of very weak connections we believe are present, the variations of resting potential (if any; Hausser and Clark, 1997), or the effects of inhibition. It also presupposes synchronized parallel fiber activity. Finally, recent suggestions that Purkinje cells have a very much lower membrane resistance in vivo would lead to a quite different view of synaptic integration in these cells (Jorntell and Ekerot, 2002b).
Ascending axons
The importance of the ascending axon input to Purkinje cells has been a subject of long-running controversy in the field of cerebellar research. Overall, we found that proximal granule cells elicited EPSCs with very similar properties to connections mediated by parallel fibers, with one crucial difference: local granule cells had a much higher probability of generating a detectable EPSC. Proximal granule cells therefore constitute a privileged input to Purkinje cells, and this provides a mechanism that could explain the sensitivity of Purkinje cells to their subjacent mossy fiber inputs. However, the overall difference in granule cell efficacy appears to be less than some predictions, and the underlying mechanism is unexpected. If we calculate average granule cell efficacy within 35 μm of the dendritic plane and compare this with the efficacy for more distant granule cells, we obtain a factor of 3.2 greater effect for the proximal granule cells. Only a factor of 1.4 of this results from differences in EPSC amplitudes, whereas a factor of 2.3 results from the higher probability of generating a detectable response. The range of 35 μm was chosen because this corresponds to a recent estimate of the extent (in the parallel fiber direction) of a mossy fiber terminal field (Sultan, 2001). However, it is clear that some mossy fibers can have quite different termination patterns (Shinoda et al., 2000).
Although we do not know how many ascending axon connections we recorded, we sampled granule cells throughout the region near the Purkinje cell. Clearly, powerful ascending axon connections are uncommon. If numerous ascending axon connections are included within our sample, they appear to have similar properties to parallel fiber connections.
Undetected synapses
Our results, when compared with the careful and detailed stereological work of Napper and Harvey (Harvey and Napper, 1988, 1991;Napper and Harvey, 1988a,b), suggest that a large fraction, up to ∼85%, of parallel fiber synapses did not generate electrical responses that we could detect. Although this estimate may be reduced somewhat if we attempt to take into account cases in which axons did not traverse or reach the Purkinje cell dendritic tree, we still obtain a worst case of ∼80% undetectable connections. We believe this possibility and its consequences should be considered seriously. Additional support for this notion has been provided, independently, on the basis of experiments in vivo mapping the receptive fields of Purkinje cells (Ekerot and Jorntell, 2001; Jorntell and Ekerot, 2002a).
We propose that the potentially large fraction of very weak parallel fiber→Purkinje cell connections would cause a given pattern of parallel fiber activity to excite only selected Purkinje cells along a beam. Put another way, Purkinje cells may be able to select very precisely the parallel fiber inputs that should excite them, because the contrast of desirable inputs can be enhanced by strongly depressing distracting inputs. This would explain why uniform Purkinje cell activity along parallel fiber beams is not observed in vivo(Ekerot and Jorntell, 2001).
The existence of such weak synapses would raise questions about the processes of learning in the cerebellar cortex. Current theory holds that, during learning, parallel fiber inputs to Purkinje cells are depressed and nuclear cells are excited indirectly (Ito, 1989). It is evident that no change to the system and therefore no learning can occur if the parallel fiber synapses involved in a particular input are depressed already. In such cases, potentiation of parallel fiber synapses may be an important process during cerebellar learning (Salin et al., 1996; Jorntell and Ekerot, 2002a; Lev-Ram et al., 2002).
Footnotes
P.I. was supported by a Ministère de l'Éducation Nationale de la Recherche et de la Technologie fellowship and the Ecole Normale Supérieure. We thank Philippe Ascher and the Laboratoire de Neurobiologie (Centre National de la Recherche Scientifique UnitéMixte de Recherche 8544) for their generous support. We also thank Philippe Ascher, Mariano Casado, Stéphane Dieudonné, Régis Lambert, Jacques Neyton, and Stéphane Supplisson for helpful discussions.
Correspondence should be addressed to Boris Barbour, Laboratoire de Neurobiologie, Ecole Normale Supérieure, 46 rue d'Ulm, 75230 Paris Cedex 05, France. E-mail: barbour@ens.fr.
REFERENCES
- 1.Albus JS. A theory of cerebellar function. Math Biosci. 1971;10:26–51. [Google Scholar]
- 2.Barbour B. Synaptic currents evoked in Purkinje cells by stimulating individual granule cells. Neuron. 1993;11:759–769. doi: 10.1016/0896-6273(93)90085-6. [DOI] [PubMed] [Google Scholar]
- 3.Barbour B, Isope P. Combining loose cell-attached stimulation and recording. J Neurosci Methods. 2000;103:199–208. doi: 10.1016/s0165-0270(00)00318-6. [DOI] [PubMed] [Google Scholar]
- 4.Barbour B, Keller BU, Llano I, Marty A. Prolonged presence of glutamate during excitatory synaptic transmission to cerebellar Purkinje cells. Neuron. 1994;12:1331–1343. doi: 10.1016/0896-6273(94)90448-0. [DOI] [PubMed] [Google Scholar]
- 5.Batchelor AM, Madge DJ, Garthwaite J. Synaptic activation of metabotropic glutamate receptors in the parallel fibre–Purkinje cell pathway in rat cerebellar slices. Neuroscience. 1994;63:911–915. doi: 10.1016/0306-4522(94)90558-4. [DOI] [PubMed] [Google Scholar]
- 6.Bell CC, Grimm RJ. Discharge properties of Purkinje cells recorded on single and double microelectrodes. J Neurophysiol. 1969;32:1044–1055. doi: 10.1152/jn.1969.32.6.1044. [DOI] [PubMed] [Google Scholar]
- 7.Berod A, Hartman BK, Pujol JF. Importance of fixation in immunohistochemistry: use of formaldehyde solutions at variable pH for the localization of tyrosine hydroxylase. J Histochem Cytochem. 1981;29:844–850. doi: 10.1177/29.7.6167611. [DOI] [PubMed] [Google Scholar]
- 8.Bower JM, Woolston DC. Congruence of spatial organization of tactile projections to granule cell and Purkinje cell layers of cerebellar hemispheres of the albino rat: vertical organization of cerebellar cortex. J Neurophysiol. 1983;49:745–766. doi: 10.1152/jn.1983.49.3.745. [DOI] [PubMed] [Google Scholar]
- 9.Braitenberg V, Atwood RP. Morphological observations on the cerebellar cortex. J Comp Neurol. 1958;109:1–34. doi: 10.1002/cne.901090102. [DOI] [PubMed] [Google Scholar]
- 10.Brodal P, Bjaalie JG. Salient anatomic features of the cortico-ponto-cerebellar pathway. Prog Brain Res. 1997;114:227–249. doi: 10.1016/s0079-6123(08)63367-1. [DOI] [PubMed] [Google Scholar]
- 11.Carnevale NT, Johnston D. Electrophysiological characterization of remote chemical synapses. J Neurophysiol. 1982;47:606–621. doi: 10.1152/jn.1982.47.4.606. [DOI] [PubMed] [Google Scholar]
- 12.Casado M, Dieudonne S, Ascher P. Presynaptic N-methyl-d-aspartate receptors at the parallel fiber–Purkinje cell synapse. Proc Natl Acad Sci USA. 2000;97:11593–11597. doi: 10.1073/pnas.200354297. [DOI] [PMC free article] [PubMed] [Google Scholar]
- 13.Casado M, Isope P, Ascher P. Involvement of presynaptic N-methyl-d-aspartate receptors in cerebellar long-term depression. Neuron. 2002;33:123–130. doi: 10.1016/s0896-6273(01)00568-2. [DOI] [PubMed] [Google Scholar]
- 14.Cohen D, Yarom Y. Patches of synchronized activity in the cerebellar cortex evoked by mossy-fiber stimulation: questioning the role of parallel fibers. Proc Natl Acad Sci USA. 1998;95:15032–15036. doi: 10.1073/pnas.95.25.15032. [DOI] [PMC free article] [PubMed] [Google Scholar]
- 15.Crepel F, Penit-Soria J. Inward rectification and low threshold calcium conductance in rat cerebellar Purkinje cells. An in vitro study. J Physiol (Lond) 1986;372:1–23. doi: 10.1113/jphysiol.1986.sp015993. [DOI] [PMC free article] [PubMed] [Google Scholar]
- 16.Dittman JS, Kreitzer AC, Regehr WG. Interplay between facilitation, depression, and residual calcium at three presynaptic terminals. J Neurosci. 2000;20:1374–1385. doi: 10.1523/JNEUROSCI.20-04-01374.2000. [DOI] [PMC free article] [PubMed] [Google Scholar]
- 17.Ebner TJ, Bloedel JR. Correlation between activity of Purkinje cells and its modification by natural peripheral stimuli. J Neurophysiol. 1981;45:948–961. doi: 10.1152/jn.1981.45.5.948. [DOI] [PubMed] [Google Scholar]
- 18.Eccles JC. The cerebellum as a computer: patterns in space and time. J Physiol (Lond) 1973;229:1–32. doi: 10.1113/jphysiol.1973.sp010123. [DOI] [PMC free article] [PubMed] [Google Scholar]
- 19.Efron B, Tibshirani RJ. An introduction to the bootstrap. Chapman and Hall; London: 1993. [Google Scholar]
- 20.Ekerot CF, Jorntell H. Parallel fibre receptive fields of Purkinje cells and interneurons are climbing fibre-specific. Eur J Neurosci. 2001;13:1303–1310. doi: 10.1046/j.0953-816x.2001.01499.x. [DOI] [PubMed] [Google Scholar]
- 21.Fushiki H, Barmack NH. Topography and reciprocal activity of cerebellar Purkinje cells in the uvula-nodulus modulated by vestibular stimulation. J Neurophysiol. 1997;78:3083–3094. doi: 10.1152/jn.1997.78.6.3083. [DOI] [PubMed] [Google Scholar]
- 22.Garwicz M, Andersson G. Spread of synaptic activity along parallel fibres in cat cerebellar anterior lobe. Exp Brain Res. 1992;88:615–622. doi: 10.1007/BF00228190. [DOI] [PubMed] [Google Scholar]
- 23.Gasparini S, Saviane C, Voronin LL, Cherubini E. Silent synapses in the developing hippocampus: lack of functional AMPA receptors or low probability of glutamate release? Proc Natl Acad Sci USA. 2000;97:9741–9746. doi: 10.1073/pnas.170032297. [DOI] [PMC free article] [PubMed] [Google Scholar]
- 24.Gundappa-Sulur G, De Schutter E, Bower JM. Ascending granule cell axon: an important component of cerebellar cortical circuitry. J Comp Neurol. 1999;408:580–596. doi: 10.1002/(sici)1096-9861(19990614)408:4<580::aid-cne11>3.0.co;2-o. [DOI] [PubMed] [Google Scholar]
- 25.Harvey RJ, Napper RM. Quantitative study of granule and Purkinje cells in the cerebellar cortex of the rat. J Comp Neurol. 1988;274:151–157. doi: 10.1002/cne.902740202. [DOI] [PubMed] [Google Scholar]
- 26.Harvey RJ, Napper RM. Quantitative studies on the mammalian cerebellum. Prog Neurobiol. 1991;36:437–463. doi: 10.1016/0301-0082(91)90012-p. [DOI] [PubMed] [Google Scholar]
- 27.Hausser M, Clark BA. Tonic synaptic inhibition modulates neuronal output pattern and spatiotemporal synaptic integration. Neuron. 1997;19:665–678. doi: 10.1016/s0896-6273(00)80379-7. [DOI] [PubMed] [Google Scholar]
- 28.Hausser M, Roth A. Dendritic and somatic glutamate receptor channels in rat cerebellar Purkinje cells. J Physiol (Lond) 1997;501:77–95. doi: 10.1111/j.1469-7793.1997.077bo.x. [DOI] [PMC free article] [PubMed] [Google Scholar]
- 29.Isope P, Barbour B. Are there “silent” granule cell-Purkinje cell synapses? Eur J Neurosci. 2000;12 [Suppl 11]:198.4. [Google Scholar]
- 30.Isope P, Barbour B. The majority of granule cell-Purkinje cell synapses are silent. Soc Neurosci Abstr. 2001;27:713.5. [Google Scholar]
- 31.Ito M. Long-term depression. Annu Rev Neurosci. 1989;12:85–102. doi: 10.1146/annurev.ne.12.030189.000505. [DOI] [PubMed] [Google Scholar]
- 32.Jorntell H, Ekerot CF. Reciprocal bidirectional plasticity of parallel fiber receptive fields in cerebellar Purkinje cells and their afferent interneurons. Neuron. 2002a;34:797–806. doi: 10.1016/s0896-6273(02)00713-4. [DOI] [PubMed] [Google Scholar]
- 33.Jorntell H, Ekerot CF. Dendritic integration of peripheral input in cerebellar Purkinje cells in whole cell patch clamp recordings in vivo. FENS Abstr. 2002b;1:A081.3. [Google Scholar]
- 34.Kim J, Alger BE. Random response fluctuations lead to spurious paired pulse facilitation. J Neurosci. 2001;21:9608–9618. doi: 10.1523/JNEUROSCI.21-24-09608.2001. [DOI] [PMC free article] [PubMed] [Google Scholar]
- 35.Kocsis JD, Malenka RC, Waxman SG. Effects of extracellular potassium concentration on the excitability of the parallel fibres of the rat cerebellum. J Physiol (Lond) 1983;334:225–244. doi: 10.1113/jphysiol.1983.sp014491. [DOI] [PMC free article] [PubMed] [Google Scholar]
- 36.Lev-Ram V, Wong ST, Storm DR, Tsien RY. A new form of cerebellar long-term potentiation is postsynaptic and depends on nitric oxide, but not cAMP. Proc Natl Acad Sci USA. 2002;99:8389–8393. doi: 10.1073/pnas.122206399. [DOI] [PMC free article] [PubMed] [Google Scholar]
- 37.Llano I, Marty A, Armstrong CM, Konnerth A. Synaptic and agonist-induced currents of Purkinje cells in rat cerebellar slices. J Physiol (Lond) 1991;434:183–213. doi: 10.1113/jphysiol.1991.sp018465. [DOI] [PMC free article] [PubMed] [Google Scholar]
- 38.Llinas R. General discussion: radial connectivity in the cerebellar cortex. A novel view regarding the functional organization of the molecular layer. In: Palay SL, Chan-Palay V, editors. The cerebellum: new vistas. Springer; Berlin: 1982. pp. 189–194. [Google Scholar]
- 39.Llinas R, Sugimori M. Electrophysiological properties of in vitro Purkinje cell dendrites in mammalian cerebellar slices. J Physiol (Lond) 1980;305:197–213. doi: 10.1113/jphysiol.1980.sp013358. [DOI] [PMC free article] [PubMed] [Google Scholar]
- 40.Magee JC, Cook EP. Somatic EPSP amplitude is independent of synapse location in hippocampal pyramidal neurons. Nat Neurosci. 2000;3:895–903. doi: 10.1038/78800. [DOI] [PubMed] [Google Scholar]
- 41.Marr D. A theory of cerebellar cortex. J Physiol (Lond) 1969;202:437–470. doi: 10.1113/jphysiol.1969.sp008820. [DOI] [PMC free article] [PubMed] [Google Scholar]
- 42.Merrill EG, Wall PD, Yaksh TL. Properties of two unmyelinated fibre tracts of the central nervous system: lateral Lissauer tract and parallel fibres of the cerebellum. J Physiol (Lond) 1978;284:127–145. doi: 10.1113/jphysiol.1978.sp012531. [DOI] [PMC free article] [PubMed] [Google Scholar]
- 43.Napper RM, Harvey RJ. Quantitative study of the Purkinje cell dendritic spines in the rat cerebellum. J Comp Neurol. 1988a;274:158–167. doi: 10.1002/cne.902740203. [DOI] [PubMed] [Google Scholar]
- 44.Napper RM, Harvey RJ. Number of parallel fiber synapses on an individual Purkinje cell in the cerebellum of the rat. J Comp Neurol. 1988b;274:168–177. doi: 10.1002/cne.902740204. [DOI] [PubMed] [Google Scholar]
- 45.Oscarsson O. Functional units of the cerebellum—sagittal zones and microzones. Trends Neurosci. 1979;2:143–145. [Google Scholar]
- 46.Perkel DJ, Hestrin S, Nicoll R. Excitatory synaptic currents in Purkinje cells. Proc R Soc Lond [Biol] 1990;241:116–121. doi: 10.1098/rspb.1990.0074. [DOI] [PubMed] [Google Scholar]
- 47.Rapp M, Segev I, Yarom Y. Physiology, morphology, and detailed passive models of guinea-pig cerebellar Purkinje cells. J Physiol (Lond) 1994;474:101–118. doi: 10.1113/jphysiol.1994.sp020006. [DOI] [PMC free article] [PubMed] [Google Scholar]
- 48.Roth A, Hausser M. Compartmental models of rat cerebellar Purkinje cells based on simultaneous somatic and dendritic patch-clamp recordings. J Physiol (Lond) 2001;535:445–472. doi: 10.1111/j.1469-7793.2001.00445.x. [DOI] [PMC free article] [PubMed] [Google Scholar]
- 49.Salin PA, Malenka RC, Nicoll RA. Cyclic AMP mediates a presynaptic form of LTP at cerebellar parallel fiber synapses. Neuron. 1996;16:797–803. doi: 10.1016/s0896-6273(00)80099-9. [DOI] [PubMed] [Google Scholar]
- 50.Shambes GM, Gibson JM, Welker W. Fractured somatotopy in granule cell tactile areas of rat cerebellar hemispheres revealed by micromapping. Brain Behav Evol. 1978;15:94–140. doi: 10.1159/000123774. [DOI] [PubMed] [Google Scholar]
- 51.Shelton DP. Membrane resistivity estimated for the Purkinje neuron by means of a passive computer model. Neuroscience. 1985;14:111–131. doi: 10.1016/0306-4522(85)90168-x. [DOI] [PubMed] [Google Scholar]
- 52.Shinoda Y, Sugihara I, Wu HS, Sugiuchi Y. The entire trajectory of single climbing and mossy fibers in the cerebellar nuclei and cortex. Prog Brain Res. 2000;124:173–186. doi: 10.1016/S0079-6123(00)24015-6. [DOI] [PubMed] [Google Scholar]
- 53.Stuart G, Hausser M. Initiation and spread of sodium action potentials in cerebellar Purkinje cells. Neuron. 1994;13:703–712. doi: 10.1016/0896-6273(94)90037-x. [DOI] [PubMed] [Google Scholar]
- 54.Sultan F. Distribution of mossy fibre rosettes in the cerebellum of cat and mice: evidence for a parasagittal organization at the single fibre level. Eur J Neurosci. 2001;13:2123–2130. doi: 10.1046/j.0953-816x.2001.01593.x. [DOI] [PubMed] [Google Scholar]
- 55.Takechi H, Eilers J, Konnerth A. A new class of synaptic response involving calcium release in dendritic spines. Nature. 1998;396:757–760. doi: 10.1038/25547. [DOI] [PubMed] [Google Scholar]
- 56.Tempia F, Kano M, Schneggenburger R, Schirra C, Garaschuk O, Plant T, Konnerth A. Fractional calcium current through neuronal AMPA receptor channels with a low calcium permeability. J Neurosci. 1996;16:456–466. doi: 10.1523/JNEUROSCI.16-02-00456.1996. [DOI] [PMC free article] [PubMed] [Google Scholar]
- 57.Thach WT, Goodkin HP, Keating JG. The cerebellum and the adaptive coordination of movement. Annu Rev Neurosci. 1992;15:403–442. doi: 10.1146/annurev.ne.15.030192.002155. [DOI] [PubMed] [Google Scholar]
- 58.Vranesic I, Iijima T, Ichikawa M, Matsumoto G, Knopfel T. Signal transmission in the parallel fiber–Purkinje cell system visualized by high-resolution imaging. Proc Natl Acad Sci USA. 1994;91:13014–13017. doi: 10.1073/pnas.91.26.13014. [DOI] [PMC free article] [PubMed] [Google Scholar]
- 59.Wang SS, Denk W, Hausser M. Coincidence detection in single dendritic spines mediated by calcium release. Nat Neurosci. 2000;3:1266–1273. doi: 10.1038/81792. [DOI] [PubMed] [Google Scholar]
- 60.Xu-Friedman MA, Harris KM, Regehr WG. Three-dimensional comparison of ultrastructural characteristics at depressing and facilitating synapses onto cerebellar Purkinje cells. J Neurosci. 2001;21:6666–6672. doi: 10.1523/JNEUROSCI.21-17-06666.2001. [DOI] [PMC free article] [PubMed] [Google Scholar]
- 61.Zhao H-M, Wenthold RJ, Wang Y-X, Petralia RS. δ-Glutamate receptors are differentially distributed at parallel fibre and climbing fibre synapses on Purkinje cells. J Neurochem. 1997;68:1041–1052. doi: 10.1046/j.1471-4159.1997.68031041.x. [DOI] [PubMed] [Google Scholar]


