

Abstract
Tg2576 mice overexpress a mutant form of human amyloid precursor protein with the Swedish mutation (APPSw), resulting in high β-amyloid (Aβ) levels in the brain. Despite this, amyloid plaques do not develop until 12 months of age, and there is no neuronal loss in mice as old as 16 months. Gene expression profiles in the hippocampus and cerebellum of 6-month-old APPSw mice were compared with age-matched controls. The expression of transthyretin, a protein shown to sequester Aβ and prevent amyloid fibril formationin vitro, and several genes in the insulin-signaling pathway, e.g., insulin-like growth factor-2, were increased selectively in the hippocampus of APPSw mice. Concomitant activation of the insulin-like growth factor-1 receptor, Akt, and extracellular signal-regulated protein kinase 1 and 2 as well as increased phosphorylation of Bad also were unique to the hippocampus of APPSw mice. In addition, the increased expression of transthyretin and insulin-like growth factor-2 and the increased phosphorylation of Bad in hippocampal neurons were maintained in 12-month-old APPSw mice when compared with age-matched controls. These results suggest that the slow progression and lack of full-fledged Alzheimer's disease pathology in the hippocampal neurons of APPSw mice result from the genetic reprogramming of neural cells to cope with increased levels of Aβ.
Keywords: Alzheimer's disease, neuroprotection, insulin-like growth factor, transthyretin, Tg2576, microarray
Alzheimer's disease (AD) is the most common cause of senile dementia. AD is associated with β-amyloid (Aβ) plaques, neurofibrillary tangles, and large-scale neuronal cell loss. Multiple lines of evidence implicate Aβ as the causative agent in AD. For instance, familial AD is linked to mutations in the amyloid precursor protein (APP), presenilin 1, and presenilin 2, all of which lead to increased levels of Aβ. In addition, transgenic mice overexpressing the mutant genes linked to familial AD produce high levels of Aβ, exhibit some of the pathological features of AD, and demonstrate behavioral and learning deficits later in life (Duff et al., 1996; Hsiao et al., 1996; Holcomb et al., 1998). Both the density of plaques and the cognitive changes can be reversed by vaccination against Aβ (Janus et al., 2000; Morgan et al., 2000). Finally, Aβ leads to neuronal death in cell culture and in vivo (Yankner et al., 1990; Giovannelli et al., 1995; Calhoun et al., 1998). The formation of extracellular plaques is common to all lines of transgenic mice overexpressing high levels of mutant APP. However, in contrast to the human disease, most lack neurofibrillary tangles (NFTs) and demonstrate little or no neuronal cell loss (Duff et al., 1996; Hsiao et al., 1996; Irizarry et al., 1997a,b; Holcomb et al., 1998). These mice, therefore, may not be a good model of the complete pathologic process of AD but rather may be an excellent model for understanding how the brain can adapt to and survive high levels of Aβ.
Tg(HuAPP695.K670N-M671L)2576 mice overexpressing APP with the Swedish mutation (APPSw) have markedly increased Aβ levels beginning as early as 2 months of age, and extracellular plaques begin to form in the cortex and hippocampus between 8 and 12 months (Hsiao et al., 1996; Kawarabayashi et al., 2001). In addition, 8,12-iso-iPF2α-VI, a marker for lipid peroxidation, is increased beginning at 7–8 months of age (Pratico et al., 2001), and the levels of oxidized proteins are 12-fold higher compared with nontransgenic animals (Lim et al., 2001). Despite the well characterized toxicity of Aβ as well as the evidence of increased oxidative stress and other pathologies in APPSw mice, there is no neuronal cell loss (Irizarry et al., 1997a). Therefore, we were interested in early gene expression changes that might mediate neuroprotection in these mice. In both humans and APPSw mice the hippocampus is highly susceptible to Aβ accumulation and plaque development, whereas the cerebellum does not develop significant amyloid deposits (Irizarry et al., 2001; Pratico et al., 2001). Thus the present study was designed to determine gene expression profiles in the hippocampus and cerebellum of 6-month-old APPSw mice compared with age-matched controls and to identify potential mechanisms responsible for protecting neurons from Aβ toxicity.
MATERIALS AND METHODS
Animals. Tg2576 mice were created as described previously (Hsiao et al., 1996). Briefly, they contain the human APP 695 with the double mutation K670N and M671L (Swedish mutation) and are driven by the prion protein promoter. In this study, transgenic and nontransgenic control mice were generated from C57B6/SJL N2 generation Tg2576 mice backcrossed to C57B6/SJL breeders. Mice were killed at 6 and 12 months of age.
Oligonucleotide microarray. Male mice were killed with CO2 and immediately perfused through the heart with PBS. The hippocampus and cerebellum were dissected and stored in liquid nitrogen. Total RNA was extracted with Trizol (Invitrogen, Carlsbad, CA) after tissue homogenization. Double-stranded cDNA was synthesized from the total RNA by using a Superscript choice kit (Invitrogen) with a T7-dT24 primer incorporating a T7 RNA polymerase promoter. The cRNA was prepared and biotin-labeled by in vitro transcription (Enzo Biochem, New York, NY). Labeled cRNA was fragmented by incubation at 94°C for 35 min in the presence of 40 mm Tris-acetate, pH 8.1, 100 mm potassium acetate, and 30 mm magnesium acetate. Then 15 μg of fragmented cRNA was hybridized for 16 hr at 45°C to a MG-74Av2 array (Affymetrix, Santa Clara, CA). After hybridization the gene chips were washed automatically and stained with streptavidin–phycoerythrin by using a fluidics station. Finally, probe arrays were scanned at 3 μm resolution by using the Genechip System confocal scanner made for Affymetrix by Aligent. Affymetrix Microarray Suite 4.1 was used to scan and analyze the relative abundance of each gene from the average difference of intensities (Lipshutz et al., 1999). Analysis parameters used by the software were set to values corresponding to moderate stringency (SDT = 30; SRT = 1.5). We scaled the data from each array to normalize for comparisons. Output from the microarray analysis was merged with the Unigene or GenBank descriptor. Each sample was run on a single array, and the comparisons were crossed such that each APPSw transgenic animal was compared with each control for a total of nine comparisons (3 × 3 matrix). The average difference change (ADC) is defined as the difference between the relative level of transcript expression in APPSw mice versus nontransgenic control mice. The definition of increase, decrease, or no change of expression for individual genes was based on ranking the Difference Call (as determined by the Affymetrix software) from three intergroup comparisons (3 × 3), namely, No Change = 0, Marginal Increase/Decrease = 1/−1, Increase/Decrease = 2/−2. The final rank was calculated by summing up the individual ranks from each comparison, and the value varied from −18 to 18. The cutoff value for the final determination of Increase/Decrease was set as 9/−9. Genes for which the coefficient of variance was >1.0 were not included in the final list, and changes of <1.5-fold also were eliminated. Using this kind of data analysis with three replicates generated a conservative list of genes with changed expression levels. RT-PCR of selected genes confirmed the microarray results. Gene classification was based on a literature review.
Reverse transcription-PCR. RNA was isolated from the hippocampus of 6- and 12-month-old mice with Trizol (Invitrogen). RNA (1 μg) was reverse transcribed for 1 hr at 42°C by using an oligo-dT15 primer from the Reverse Transcription System (Promega, Madison, WI). The resulting cDNA was amplified by PCR that used primer sets designed with PRIMER3 (available at www.genome.wi.mit.edu/cgi-bin/primer/primer3_www.cgi) and that used sequence data from the National Center for Biotechnology Information (Bethesda, MD) database. Primers (purchased from IDT, Coralville, IA) were designed for APPSw (5′ primer, ACTGGCTGAAGAAAGTGACAAT and 3′ primer, AGAGGTGGTTCGAGTTCCTACA), resulting in a PCR product of 310 base pairs (bp); transthyretin (5′, CCATACTCCTACAGCACCAC and 3′, GCATCTACAGCCCTTCAG), resulting in a PCR product of 488 bp; insulin-like growth factor-2 (5′, AACCCGAGAAGAAAGGAAG and 3′, TCACACATAGAGCCAATAAGC), resulting in a PCR product of 550 bp; and β-actin (5′, CCCAGAGCAAGAGAGGTATC and 3′, AGAGCATAGCCCTCGTAGAT), resulting in a PCR product of 340 bp.
Immunohistochemistry. Mice were killed with CO2 and immediately perfused through the heart with PBS. The right hemispheres were fixed in 4% paraformaldehyde overnight, sunk in 30% sucrose, and frozen in OCT embedding medium. Frozen sections with a width of 10 μm were taken through the hippocampus and cerebellum. Insulin-like growth factor-2 (IGF-2) was detected with a 1:200 dilution of the polyclonal antibody against IGF-2 (F-20; Santa Cruz Biotechnology, Santa Cruz, CA). Phospho-Akt (Thr308), Akt, phospho-Erk1/2 (Thr202/Tyr204), Erk1/2, phospho-Bad (Ser112), and Bad were detected with a 1:100 (phospho-Akt, Akt, phospho-Erk1/2, and Erk1/2) or 1:1000 (phospho-Bad and Bad) dilution of the respective polyclonal antibody (Cell Signaling, Beverly, MA). As a control, preimmune rabbit IgG (Vector Laboratories, Burlingame, CA) was used in place of the primary antibody. The Vectastain Elite ABC kit and 3, 3′-diaminobenzidine were used to visualize the antibody staining, and selected sections with each antibody were counterstained with hematoxylin (Vector Laboratories). The figures are representative of the results obtained from three APPSw mice and three nontransgenic controls.
Immunoprecipitation and Western immunoblot. Protein was isolated with Trizol (Invitrogen) from the dissected hippocampus and cerebellum of three APPSw mice and three nontransgenic controls. Immunoprecipitation was performed on 500 μg of protein by using a 1:100 dilution of the phosphotyrosine monoclonal antibody P-Tyr-100 (Cell Signaling). The precipitated protein then was run on a gel and immunoblotted with a 1:200 dilution of 24-31, a monoclonal antibody against IGF-1Rβ (Chemicon, Temecula, CA). Additional Western immunoblots were performed on 60 μg of protein by using polyclonal antibodies against Bad and phospho-Bad (Ser112; Cell Signaling). Bands were visualized by using horseradish peroxidase-conjugated secondary antibodies and SuperSignal West Pico chemiluminescent substrate (Pierce, Rockford, IL).
RESULTS
Microarray
Initially, we determined the gene expression profiles of the hippocampus and cerebellum from 6-month-old APPSwmice (n = 3) compared with nontransgenic littermates (n = 3), using oligonucleotide arrays containing 12,427 mouse genes and expressed sequence tags (ESTs). Decreased genes and ESTs totaled 41 in the hippocampus (Table1) and two in the cerebellum (Table 2). In the hippocampus 24 transcripts were increased in Tg2576 mice, four of which were ESTs (Table 1). Two of these genes,transthyretin and ectonucleotide pyrophosphatase/phosphodiesterase 2, also were increased in the cerebellum, where a total of seven genes had increased expression. However, the magnitude of the increase was reduced greatly in the cerebellum (see Table 2).
Table 1.
Differentially regulated genes in the hippocampus of APPSw mice
| Gene classification | Gene description | FC | ADC | Rank |
|---|---|---|---|---|
| Aging | Klotho | 6.52 ± 1.56 | 4908 ± 505 | 16 |
| Amyloid sequestration | Transthyretin (TTR) | 29.49 ± 5.61 | 64779 ± 7231 | 18 |
| Apoptosis | c-fos | −3.70 ± 0.44 | −3590 ± 416 | −12 |
| MEK kinase 4b (MEKK4b) | −3.09 ± 0.47 | −1956 ± 323 | −11 | |
| Protein phosphatase 1B magnesium-dependent β isoform | −2.60 ± 0.40 | −1978 ± 398 | −13 | |
| Extracellular matrix and tissue | Decorin | 1.63 ± 0.58 | 8630 ± 2781 | 12 |
| remodeling | Fibroblast activation protein | 1.50 ± 0.36 | 506 ± 137 | 10 |
| Procollagen, type VIII, α1 | 4.06 ± 0.98 | 2148 ± 442 | 14 | |
| Extracellular matrix protein 1 | −2.41 ± 0.21 | −1086 ± 198 | −9 | |
| Gap junction | Connexin 30 | −3.30 ± 0.87 | −2283 ± 588 | −14 |
| Connexin 32 | −4.51 ± 0.55 | −2560 ± 386 | −9 | |
| Growth factors and growth-related | Adenylate cyclase-activating polypeptide I (PACAP) | 2.78 ± 0.35 | 1619 ± 249 | 9 |
| Growth hormone receptor | 1.48 ± 0.58 | 853 ± 249 | 9 | |
| Insulin-like growth factor-2 (IGF-2) | 16.64 ± 7.06 | 19360 ± 5450 | 10 | |
| Insulin-like growth factor binding protein-2 (IGFBP-2) | 2.80 ± 0.44 | 4001 ± 807 | 12 | |
| Prolactin receptor | 4.46 ± 0.59 | 2896 ± 128 | 12 | |
| Short stature homeobox 2 | 2.21 ± 0.61 | 1013 ± 258 | 10 | |
| Protein tyrosine phosphatase, nonreceptor type substrate 1 (SHPS-1) | −2.88 ± 1.09 | −3213 ± 827 | −10 | |
| Purine biosynthesis and DNA | Adenylosuccinate synthetase 2, nonmuscle | −1.56 ± 0.38 | −2302 ± 532 | −10 |
| replication | DNA primase, p49 subunit | −2.08 ± 0.12 | −768 ± 78 | −11 |
|
Methylenetetrahydrofolate dehydrogenase (NAD+ dependent),
methenyltetrahydrofolate cyclohydrolase |
−3.07 ± 0.36 | −1561 ± 306 | −10 | |
| Synaptic and endocytic | Chloride channel protein 3 (CLCN3) | −1.50 ± 0.55 | −2891 ± 922 | −12 |
| RAB7, member RAS oncogene family, pseudogene 1 | −1.98 ± 0.58 | −2434 ± 821 | −10 | |
| Transcription | Eomesodermin homolog | 1.94 ± 0.17 | 745 ± 151 | 9 |
| RNA polymerase II subunit 3 | 1.83 ± 0.52 | 1803 ± 544 | 10 | |
| CDG-like kinase 4 | −2.53 ± 0.35 | −1140 ± 241 | −9 | |
| Cyclin T1 | −2.69 ± 0.26 | −1395 ± 202 | −10 | |
| Kruppel-like factor 4 (gut) | −2.11 ± 0.12 | −893 ± 161 | −10 | |
| LIM only 4 | −2.69 ± 0.95 | −2260 ± 676 | −9 | |
| Nur-related protein 1 | −1.64 ± 0.51 | −1646 ± 513 | −12 | |
| Zinc finger protein 179 | −2.50 ± 0.94 | −1831 ± 616 | −9 | |
| Miscellaneous | Calpain 1 | 2.43 ± 0.20 | 1209 ± 201 | 9 |
| Ectonucleotide pyrophosphatase/phosphodiesterase 2 | 6.84 ± 0.99 | 60010 ± 6219 | 18 | |
| Folate-binding protein 1 | 3.97 ± 0.72 | 1970 ± 336 | 14 | |
| LPS-binding protein | 4.97 ± 0.58 | 3491 ± 251 | 11 | |
| Myosin alkali light chain, MLC1F/MLC3F | 2.21 ± 0.23 | 899 ± 149 | 11 | |
| Osteoglycin | 2.59 ± 0.42 | 1147 ± 239 | 10 | |
| Retinol dehydrogenase 7 | 2.22 ± 0.53 | 1195 ± 340 | 9 | |
| Aryl-hydrocarbon receptor-interacting protein | −2.79 ± 0.60 | −1827 ± 374 | −12 | |
| Craniofacial development protein 1 | −2.23 ± 0.19 | −1360 ± 150 | −9 | |
| Formin binding protein 1 | −3.07 ± 0.79 | −1604 ± 485 | −12 | |
| Mitochondrial ribosomal protein S22 | −2.22 ± 0.30 | −838 ± 170 | −10 | |
| Myristoylated alanine-rich protein kinase C substrate | −1.56 ± 0.40 | −1797 ± 419 | −10 | |
| Nocturnin | −2.40 ± 0.40 | −2129 ± 440 | −9 | |
| Pancreas sodium bicarbonate cotransporter | −2.23 ± 0.25 | −1664 ± 142 | −10 | |
| Reduced expression 3 | −1.94 ± 0.66 | −1211 ± 373 | −12 | |
| ESTs | AI662095 | 2.11 ± 0.13 | 845 ± 153 | 9 |
| AI845874 | 4.21 ± 0.81 | 2091 ± 272 | 12 | |
| AI849271 | 1.53 ± 0.11 | 3871 ± 779 | 10 | |
| AV372413 | 2.42 ± 0.21 | 996 ± 126 | 9 | |
| AI118529 | −3.54 ± 0.30 | −2035 ± 323 | −10 | |
| AI839611 | −1.50 ± 0.52 | −1034 ± 264 | −9 | |
| AI845542 | −2.42 ± 0.32 | −1401 ± 242 | −10 | |
| AI847784 | −2.27 ± 0.26 | −910 ± 183 | −10 | |
| AI848730 | −1.97 ± 0.48 | −1060 ± 260 | −10 | |
| AI849305 | −2.04 ± 0.65 | −1761 ± 539 | −9 | |
| AI853930 | −2.04 ± 0.58 | −1315 ± 359 | −12 | |
| AW045564 | −1.56 ± 0.39 | −894 ± 216 | −13 | |
| AW049376 | −1.81 ± 0.25 | −2677 ± 553 | −9 | |
| AW122284 | −2.18 ± 0.55 | −1350 ± 361 | −10 | |
| AW122970 | −2.07 ± 0.61 | −1181 ± 363 | −10 | |
| AW124316 | −1.92 ± 0.21 | −2939 ± 630 | −10 | |
| AW209414 | −3.70 ± 0.44 | −2066 ± 368 | −16 | |
| C76227 | −2.51 ± 0.77 | −1396 ± 419 | −10 | |
| C80148 | −3.22 ± 0.62 | −3022 ± 370 | −10 |
Rank is based on the difference call. Rank values ranging from 9 to 18 indicate increased gene expression (Roman text), and values from −9 to −18 indicate decreased gene expression (italic text). ESTs are listed by their GenBank accession number. FC, Fold change; ADC, average difference change. FC and ADC are expressed as mean ± SEM.
Table 2.
Differentially regulated genes in the cerebellum of APPSw mice
| Gene classification | Gene description | FC | ADC | Rank |
|---|---|---|---|---|
| Amyloid sequestration | Transthyretin | 3.21 ± 0.66 | 21557 ± 2926 | 16 |
| Apoptosis | Peroxiredoxin 2 | 1.81 ± 0.88 | 2730 ± 883 | 12 |
| c-fos | −4.57 ± 0.79 | −7557 ± 916 | −10 | |
| Synaptic | Syntaxin 4 | 2.13 ± 0.36 | 2536 ± 422 | 9 |
| Miscellaneous | Ectonucleotide pyrophosphatase/phosphodiesterase 2 | 2.74 ± 0.68 | 22165 ± 4904 | 10 |
| Eph receptor A7 | 1.67 ± 0.57 | 1115 ± 310 | 12 | |
| Kidney cell line-derived transcript 1 | 1.64 ± 0.42 | 840 ± 233 | 10 | |
| Melanoma antigen, 80 kDa | 4.14 ± 0.91 | 2428 ± 673 | 10 | |
| EST | AA607761 | −2.53 ± 0.26 | −1370 ± 397 | −12 |
Rank is based on the difference call. Rank values ranging from 9 to 18 indicate increased gene expression (Roman text), and values from −9 to −18 indicate decreased gene expression (italic text). ESTs are listed by their GenBank accession number. FC, Fold change; ADC, average difference change. FC and ADC are expressed as mean ± SEM.
Increased expression of transthyretin
The most dramatic change in gene expression was for the transcript encoding for transthyretin (TTR), a thyroid hormone binding protein abundant in serum (see Table 1). Transthyretin is the major Aβ binding protein in the CSF and inhibits Aβ aggregation and fibril formation in vitro (Schwarzman et al., 1994). In the APPSw mice TTR mRNA was increased 29.5-fold in the hippocampus and 3.2-fold in the cerebellum. Immunohistochemistry also revealed markedly increased levels of TTR protein throughout the hippocampus with concentrations around the neurons of CA1–CA3 and the dentate gyrus (DG) (Fig. 1).
Fig. 1.
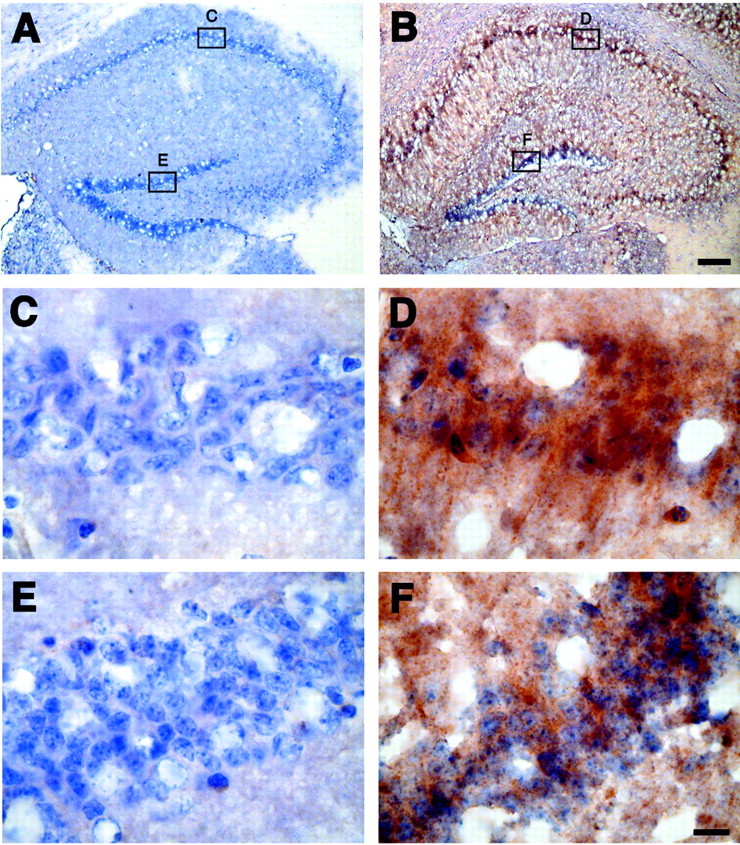
Immunohistochemistry for TTR in the hippocampus of control and APPSw overexpressing mice. Sections from nontransgenic mice (A, C, E) and APPSw mice (B, D, F) were immunostained for TTR and counterstained with hematoxylin. TTR is increased throughout the hippocampus in APPSw mice (B) compared with control mice, which contain little to no TTR (A). TTR levels in APPSw mice are largest around the neurons in CA1 (D) and the dentate gyrus (F). There is virtually no immunostaining for TTR in CA1 (C) and the dentate gyrus (E) of nontransgenic mice. Scale bars: (inB) A, B, 150 μm; (inF) C–F, 10 μm.
Increased expression of genes involved in growth factor pathways
Six genes with increased expression are growth factors or related to growth factor pathways. These include insulin-like growth factor-2 (IGF-2), insulin-like growth factor binding protein 2 (IGFBP-2), adenylate cyclase-activating polypeptide 1, growth hormone receptor, and prolactin receptor (see Table 1). Because IGF-2 expression was increased dramatically in the hippocampus of APPSw mice (see Table 1) and IGF-2 protein has been shown to protect cultured neurons from Aβ toxicity (Dore et al., 1997), we examined cell survival pathways that may be activated by IGF-2. Immunohistochemistry revealed a substantial increase of IGF-2 in the hippocampus (Fig.2A–F), but not in the cerebellum (Fig. 2G,H), of APPSw overexpressing mice. A high level of IGF-2 was found throughout the hippocampus but mostly was localized around the pyramidal neurons within CA1–CA3 and the granule cells of the DG (Fig. 2B,D,F).
Fig. 2.
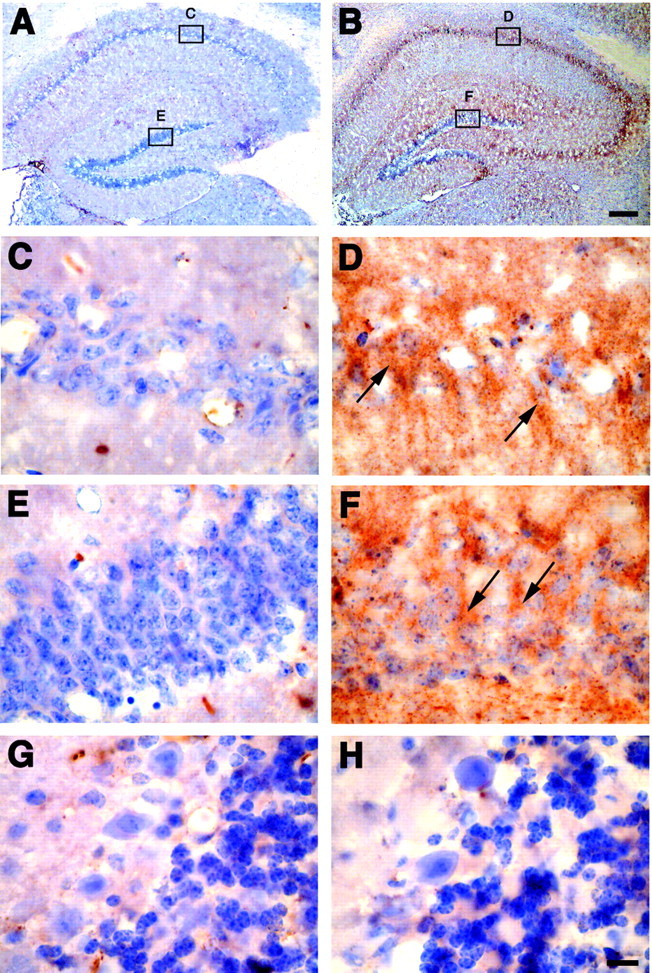
Immunohistochemistry for IGF-2 in control and APPSw overexpressing mice. Sections from nontransgenic mice (A, C, E, G) and APPSwmice (B, D, F, H) were immunostained for IGF-2 and counterstained with hematoxylin. IGF-2 is increased throughout the hippocampus in APPSw mice (B) compared with control mice, which contain little to no IGF-2 (A). IGF-2 levels in APPSw mice are largest around the neurons in CA1 (D) and the dentate gyrus (F). The arrows highlight examples of IGF-2-positive neurons in APPSw mice. There is little immunostaining for IGF-2 in CA1 (C) and the dentate gyrus (E) of nontransgenic mice. IGF-2 expression is unchanged in the cerebellum in which there is little immunostaining in either nontransgenic mice (G) or APPSw mice (H). Scale bars: (in B)A, B, 150 μm; (in H)C–H, 10 μm.
Activated pathways downstream of IGF-2
The β-subunit of the IGF-1 receptor (IGF-1Rβ) is tyrosine phosphorylated with the binding of IGF-1, IGF-2, or insulin. Consistent with the increase of IGF-2 in APPSw mice, the level of tyrosine-phosphorylated IGF-1Rβ is increased in the hippocampus when compared with control animals (Fig.3A). Phosphatidyl inositol 3-kinase (PI3-K) is activated by receptor tyrosine kinases such as IGF-1Rβ and subsequently can activate the serine/threonine kinase Akt. Akt protects cells from a variety of death-promoting insults, including Aβ toxicity (Martin et al., 2001). Akt is activated by phosphorylation at threonine 308, and the neuronal fields in CA1–CA3 and in the DG expressed low levels of Thr308 phospho-Akt in control animals (Fig. 3B,E). In contrast, the level of phospho-Akt was increased markedly in these neurons in mice overexpressing APPSw (Fig. 3C,F). When activated, Akt translocates to the nucleus (Kawano et al., 2001), and, in fact, much of the phospho-Akt was within the nucleus of hippocampal neurons in APPSw mice (Fig. 3D,G). Furthermore, Akt phosphorylates and inhibits glycogen synthase kinase-3 (GSK-3), an enzyme thought to contribute to tau hyperphosphorylation in AD, suggesting that, in APPSw mice, tau phosphorylation may be inhibited through this pathway.
Fig. 3.
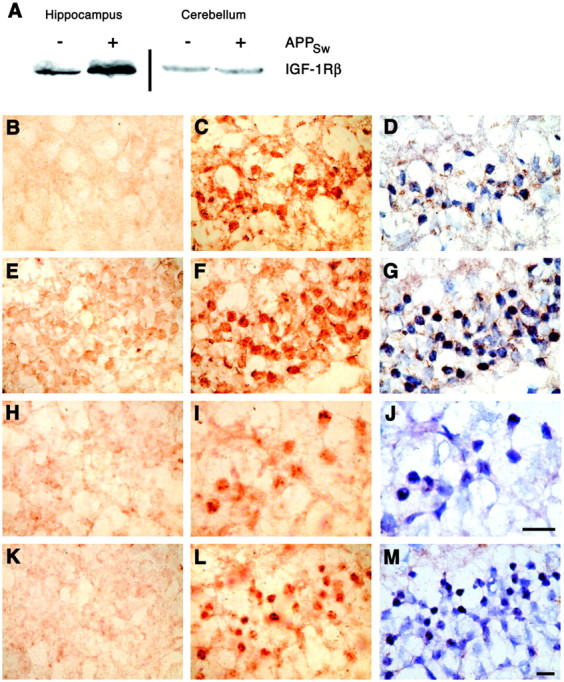
Activation of the IGF-1 receptor, Akt, and Erk1/2 in the hippocampus of APPSw mice. A, Immunoprecipitation for phosphorylated tyrosine and subsequent immunoblotting for the β-subunit of the insulin-like growth factor-1 receptor (IGF-1Rβ) revealed an increase in tyrosine-phosphorylated IGF-1Rβ in APPSw mice (+APPSw) when compared with nontransgenic controls (−APPSw) in the hippocampus but not in the cerebellum. B–G, Hippocampal neurons in CA1 stain faintly or not at all for Akt phosphorylated at Thr308 in nontransgenic control animals (B), but neurons in CA1 in APPSw mice are phospho-Akt positive (C, D). Hippocampal neurons in the dentate gyrus (DG) are faintly positive for phospho-Akt in control mice (E), but this staining is increased in the DG of APPSw mice (F, G). A hematoxylin counterstain of C andF reveals the laminar organization of the CA1 and DG neurons and the nuclear localization of phospho-Akt within these neurons in APPSw mice (D, G).H–M, Hippocampal neurons in CA1 (H) or DG (K) in control mice do not show significant staining for Erk1 phosphorylated at Thr202 and Tyr204 or Erk2 phosphorylated at Thr183 and Tyr185. However, APPSw mice do show positive staining for phospho-Erk1/2 in CA1 (I, J) and DG (L, M). A hematoxylin counterstain of I andL reveals the laminar organization of the CA1 and DG neurons and the nuclear localization of phopsho-Erk1/2 within these neurons in APPSw mice (J, M). Scale bars: J (for H–J), M (for B–G, K, L), 10 μm.
Tyrosine receptor kinases, e.g., IGF-1, growth hormone (GH), and prolactin receptors, can activate mitogen-activated protein kinase (MAPK) by sequential activation of Ras, Raf, MEK, and the MAPK extracellular signal-regulated protein kinase 1 and 2 (Erk1/2). Akt also can activate Ras, leading to increased Erk1/2 activity. Erk1 activity is dependent on phosphorylation at threonine 202 and tyrosine 204, whereas Erk2 activity is induced by phosphorylation at threonine 183 and tyrosine 185. A previous report demonstrated by immunoblotting that APPSw mice have increased phospho-Erk1/2 in the DG at 4 and 13 months of age (Dineley et al., 2001). Consistent with this and with activation of IGF-1R (Fig.3A), we show increased immunostaining for phospho-Erk1/2 in the neurons in CA1 and DG of 6-month-old APPSwmice (Fig. 3H–M). Similar to phospho-Akt, phospho-Erk1/2 is found predominantly in the nucleus of these neurons (Fig. 3J,M) while being virtually undetectable in the hippocampus of control mice.
Interestingly, both activated Akt and Erk1/2 can lead to the phosphorylation of the proapoptotic protein Bad (Datta et al., 1997;Bonni et al., 1999). When phosphorylated at serine 112 or 136, Bad binds to 14-3-3 proteins and releases the anti-apoptotic Bcl-2 family members, Bcl-xl and Bcl-2. Immunohistochemistry for phospho-Bad shows a dramatic increase in the neurons of CA1 and DG in 6-month-old APPSw mice compared with nontransgenic controls (Fig. 4). Similar to the immunostaining for IGF-2 and immunoprecipitation for activated IGF-1Rβ, immunohistochemistry in the cerebellum for phospho-Akt, phospho-Erk1/2, and phospho-Bad also showed no difference between nontransgenic and APPSw mice (data not shown).
Fig. 4.

The 6-month-old APPSw mice have increased levels of phosphorylated Bad in hippocampal neurons. Nontransgenic mice have low levels of Bad phosphorylated at Ser112 in CA1 (A) and dentate gyrus (C) neurons, but levels of phospho-Bad are increased in CA1 (B) and the dentate gyrus (D) of APPSw mice. Scale bars:B (for A, B), D (forC, D), 10 μm.
The microarray analysis indicated no change in the expression of Bad (rank = 0), Akt1 (rank = −2), Akt2 (rank = 2), Erk1 (rank = 0), and Erk2 (rank = 0) (data not shown). Immunohistochemistry in the hippocampus for Akt1, Akt2, and Akt3 demonstrated similar levels in both nontransgenic and APPSw mice. Antibodies directed against total Bad and Erk1/2 did not stain hippocampal neurons with any greater intensity than preimmune rabbit IgG, implying that, under the conditions described here, these antibodies were unable to recognize their antigen. Alternatively, Western immunoblot for total Bad and Erk1/2 demonstrated specific bands in hippocampal extracts that were unchanged in intensity between nontransgenic and APPSw mice (data not shown).
Changes in TTR, IGF-2, and phospho-Bad before and after plaque deposition
Levels of TTR and IGF-2 mRNA are increased in the hippocampus of mice that express the human APPSw transcript (Fig. 5). In agreement with our microarray data, RT-PCR reveals a slight increase of TTR mRNA levels in the cerebellum of two of three APPSw mice. There is no consistent change in IGF-2 levels in the cerebellum, however (Fig. 5A). In the hippocampus both TTR and IGF-2 have increased expression at 6 months of age (preplaque) (Fig.5A) and 12 months of age (postplaque) (Fig. 5B). Consistent with the increase in IGF-2 and with the activation of downstream kinase pathways in 6-month-old APPSwmice, 12-month-old APPSw mice also have increased levels of phospho-Bad in the neurons of CA1 and the DG when compared with nontransgenic littermates (Fig.6).
Fig. 5.

RT-PCR from the hippocampus and cerebellum of APPSw and nontransgenic mice. A, The 6-month-old mice that contain and express the human APPSwtransgene (lanes 2, 4, 6) have increased levels of transthyretin (TTR) and insulin-like growth factor-2 (IGF-2) in the hippocampus when compared with nontransgenic littermates (lanes 1, 3, 5). In the cerebellum the increase in TTR expression is reduced and the increase in IGF-2 is eliminated when comparing APPSw mice (lanes 2, 4, 6) with nontransgenic littermates (lanes 1, 3, 5). B, At 12 months the increased expression of TTR and IGF-2 in the hippocampus of APPSw mice remains (lanes 2, 4) when compared with nontransgenic controls (lanes 1, 3).
Fig. 6.

The 12-month-old APPSw mice have increased levels of phosphorylated Bad in hippocampal neurons. Nontransgenic mice have low levels of Bad phosphorylated at Ser112 in CA1 (A) and dentate gyrus (C) neurons, but levels of phospho-Bad are increased in CA1 (B) and the dentate gyrus (D) of APPSw mice. Scale bar: (inD) A–D, 10 μm.
DISCUSSION
We have shown that the expression of a number of protective genes and a protective pathway culminating in Bad phosphorylation are increased in mice that overexpress APPSw and have no neuronal loss. Increased levels of IGF-2 mRNA and protein correspond to increased activation of the IGF-1 receptor, activation of Akt and Erk1/2, and phosphorylation of Bad in APPSw mice. The increased expression of TTR and IGF-2 as well as increased phospho-Bad staining in hippocampal neurons was consistent in both preplaque (6 months) and postplaque (12 months) Tg2576 mice. Other conditions, such as the presence of a human tau gene, may be necessary for complete AD pathology. However, taken together, these data imply that the lack of neurodegeneration in APPSw mice is a result of the activation of known cell survival pathways associated with the overexpression of APPSw.
Transthyretin has been shown to bind Aβ and inhibit Aβ aggregation (Schwarzman et al., 1994). In human AD patients the concentration of TTR is significantly lower than in age-matched controls (Serot et al., 1997). This, in part, may contribute to the increased levels of Aβ in AD brains. In contrast, one reason why significant plaque deposition does not occur until 12 months of age in the mice overexpressing APPSw may be the dramatic increase of TTR.
Several growth factors and growth factor pathways that can culminate in cell survival and the activation of Akt or Erk1/2 kinase pathways are upregulated in APPSw mice. For example, pituitary adenylate cyclase-activating polypeptide (PACAP) has been shown to stimulate neurite outgrowth, regulate neurotransmitter production, and promote neuronal survival via the inhibition of caspase-3 activity (Vaudry et al., 2000). Growth hormone receptor is expressed on multiple cell types throughout the brain, and intraventricular injection of GH has reduced neuronal loss in the frontoparietal cortex and hippocampus after an ischemic brain injury (Scheepens et al., 2001). In cell lines, GH has inhibited apoptosis induced by the withdrawal of survival factors via the activation of the receptor-associated tyrosine kinase Janus kinase 2 (JAK2), PI3-K, and the serine-threonine kinase Akt (Costoya et al., 1999). Similarly, prolactin acts via its receptor to activate JAK2 and PI3-K (Berlanga et al., 1997). IGF-2 has been shown to protect against Aβ toxicity in culture, and its protective action is thought to be mediated via the activation of the IGF-1 receptor and subsequent activation of Akt and MAPK (Webster et al., 1994; Dore et al., 1997; Zheng et al., 2000). IGF-2 receptors also are abundant on the hippocampal neurons of CA1–CA3 and the DG and may be important in regulating acetylcholine release in these regions (Kar et al., 1997). In addition, IGF-2 and IGFBP-2 are expressed coordinately in many tissues (Logan et al., 1994) and in response to brain injury (Beilharz et al., 1998). IGFBP-2 has been suggested to prolong the biological activity and to be a key transport protein for IGF-2. Our data indicate that the principal components of multiple signal transduction cascades known to promote cell survival are increased selectively in the hippocampus of APPSw mice, suggesting that the cell death signals associated with Aβ-induced neurodegeneration can be balanced successfully by increasing those that are advancing cell life.
Interestingly, some of the decreased genes have been well characterized and appear to contribute to apoptosis. For example, protein tyrosine phosphatase, nonreceptor-type substrate 1 (SHPS-1), is decreased by 2.9-fold in the hippocampus and has been shown to regulate growth factor pathways negatively. In glioblastoma cells the human homolog of SHPS-1, SIRPα, inhibits epidermal growth factor-induced activation of PI3-K and leads to reduced transformation and migration and enhanced apoptosis (Wu et al., 2000). Two other decreased genes,c-fos and mitogen-activated protein kinase kinase kinase 4 (MEKK4b), also are involved in apoptosis. In addition to playing a role in cell growth and development, c-fos has been shown to mediate apoptosis in response to growth factor deprivation and cell injury (Estus et al., 1994; Preston et al., 1996;Hafezi et al., 1997). In AD c-Fos and c-Jun are increased within neurons of the hippocampus where significant apoptosis occurs, but not in the cerebellum where there is no increase in apoptotic cells (Marcus et al., 1998). In a separate pathway, MEKK4b activates the c-Jun NH2-terminal kinase cascade that is thought to contribute to apoptosis and neurodegeneration (Gerwins et al., 1997). Thus in combination with the increased genes and survival pathways discussed above, the decreased expression of these genes also may help to prevent the activation of apoptotic pathways by Aβ in the APPSw mice.
Two recent publications have suggested an association between folate and AD. An increased level of homocysteine, which can result from folate deficiency, is a strong risk factor for the development of Alzheimer's disease (Seshadri et al., 2002). In addition, a folate-deficient diet in a transgenic mouse model overexpressing APPSw results in neurodegeneration in the CA3 region of the hippocampus, and in hippocampal cultures homocysteine augmented Aβ-induced neuronal death (Kruman et al., 2002). Folate binding protein 1 is increased in the hippocampus of APPSw mice (see Table 1) and acts as a receptor to mediate the delivery of 5-methyltetrahydrofolate to the interior of cells. Based on the findings discussed above, the almost fourfold increase in folate binding protein may prevent the accumulation of homocysteine in the hippocampus and help to prevent Aβ-induced neurodegeneration.
In addition to the potentially protective gene expression changes discussed above, the aging gene, klotho, was increased more than sixfold in the hippocampus of APPSw mice (see Table 1). Mice containing a knock-out of the geneklotho develop several age-related disorders and die prematurely. Abnormalities in the mutant klotho mice include growth retardation, arteriosclerosis, and atrophy of the growth hormone-producing cells in the pituitary gland (Kuro-o et al., 1997). Many of these disorders may contribute to and/or be augmented by Aβ-induced pathology. Systemic administration of theklotho gene reversed the pathology in the mutantklotho mice (Shiraki-Iida et al., 2000). Thus, in APPSw mice increased klotho may help to protect against high Aβ levels.
Despite the lack of NFTs and neuron loss, Aβ levels are high in APPSw mice, and some cognitive deficits have been documented. Behavioral testing reveals spatial learning and memory deficits beginning at 9 months of age (Hsiao et al., 1996). Our microarray analysis shows expression changes in some genes that may mediate part of this cognitive decline. Specifically, chloride channel protein 3 (CLCN3) was decreased in the hippocampus of APPSw mice (see Table 1). CLCN3 is expressed on the synaptic vesicles of hippocampal neurons, and its disruption in mice results in severe degeneration of the hippocampus and consequent memory impairments (Stobrawa et al., 2001). Numerous other genes encoding for proteins involved in the cell cycle, transcription regulation, DNA replication, tissue remodeling, and cell-to-cell communication were changed selectively in the hippocampus of APPSw mice (see Table 1). The contribution of these genes to the limited pathology or to the delayed plaque deposition and lack of neuronal loss in the APPSwmice requires further investigation.
Many of the neuroprotective genes and signaling pathways described here have not been characterized fully in the human disease, and it is not clear what role they have in AD. We speculate that the surviving neurons without tau pathology (phospho-tau-negative neurons) would have neuroprotective gene expression changes, Akt and Erk1/2 activation, and Bad phosphorylation. In contrast, dying neurons (phospho-tau-positive neurons) would not show these changes because of an apoptosis-induced shutdown of these protective pathways. In support of this hypothesis, a recent publication found that phospho-Erk1/2 is increased in a subpopulation of neurons with little or no phospho-tau staining, whereas Erk1/2 was unchanged in neurons with dense NFTs or DNA fragmentation (Ferrer et al., 2001). In addition, preliminary data show a lack of increased Bad phosphorylation in the hippocampal neurons of human AD patients (T. D. Stein and J. A. Johnson, unpublished observations). A diagram proposing how these pathways could interact to confer protection is shown in Figure7.
Fig. 7.

Hypothetical schema showing integration of neuroprotective Akt and Erk1/2 pathways in APPSw mice. All differentially expressed genes or proteins (grayed text) that have been shown previously to have a role in the inhibition or activation of apoptosis or are involved in Aβ sequestration are shown. Also indicated is the increased (↑) or decreased (↓) gene expression or protein activation in APPSw mice. Between proteins the black arrows represent the activation of one protein by another, and the bars represent inhibition. AC, Adenylate cyclase; GHR, growth hormone receptor;IRS-1, insulin receptor substrate 1;MKK4, MAPK kinase 4; NFT, neurofibrillary tangles; p-IGF-1Rβ, tyrosine-phosphorylated IGF-1 receptor β; p90RSK, 90 kDa ribosomal S6 kinases;PAC1R, type I PACAP receptor;PKA, protein kinase A; PRLR, prolactin receptor.
The changes in gene expression in the APPSwoverexpressing mice may be induced by APP or its metabolites such as Aβ. Expression levels of the APPSw transgene were similar in the hippocampus and cerebellum (Fig. 5A). However, gene expression changes were markedly different between these two tissues, suggesting that it may be a cleavage product of APPSw and not the APPSwtransgene itself that drives these changes. In fact, cleavage of APP by α-secretase generates a secreted form of APP, which is neuroprotective in cultured hippocampal neurons (Mattson et al., 1993). Furthermore, secreted APP has been shown to activate Erk1/2 in PC-12 cells in a Ras-dependent manner (Greenberg et al., 1994), and phosphorylated Erk1/2, in turn, is important in growth factor-induced secretion of α-secretase-cleaved APP (Mills et al., 1997). One difference between the APPSw mouse model and AD is the fivefold to sixfold overexpression of APPSw in the mouse (Hsiao et al., 1996). Therefore, it may be the subsequent increase in the secreted form of APP that drives the protective gene expression changes described here.
Substantial evidence indicates a protective role for TTR, IGF-2, Akt, Erk, and Bad phosphorylation in vitro. Here we provide evidence that suggests these mechanisms are neuroprotective against Aβ in vivo. Thus, regulating the transcription of these genes and/or the identified signal transduction pathways may have an important role in the design of potential AD therapeutics.
Footnotes
This study was supported by Grants ES08089 (J.A.J.), ES10042 (J.A.J.), and ES09090 (Environmental Health Sciences Center) from the National Institute of Environmental Health Sciences and by the Burroughs Wellcome New Investigator in Toxicological Sciences Award (J.A.J.). We thank Karen Hsiao Ashe for providing Tg2576 mice and Charles Nicholson, Matthew Slattery, and the Molecular Biology Core Facility of the University of Wisconsin Environmental Health Science Center for conducting the gene array hybridizations.
Correspondence should be addressed to Jeffrey A. Johnson, University of Wisconsin–Madison, School of Pharmacy, 6125 Rennebohm Hall, 777 Highland Avenue, Madison, WI 53705-2222. E-mail:jajohnson@pharmacy.wisc.edu.
REFERENCES
- 1.Beilharz EJ, Russo VC, Butler G, Baker NL, Connor B, Sirimanne ES, Dragunow M, Werther GA, Gluckman PD, Williams CE, Scheepens A. Co-ordinated and cellular-specific induction of the components of the IGF/IGFBP axis in the rat brain following hypoxic–ischemic injury. Brain Res Mol Brain Res. 1998;59:119–134. doi: 10.1016/s0169-328x(98)00122-3. [DOI] [PubMed] [Google Scholar]
- 2.Berlanga JJ, Gualillo O, Buteau H, Applanat M, Kelly PA, Edery M. Prolactin activates tyrosyl phosphorylation of insulin receptor substrate 1 and phosphatidylinositol-3-OH kinase. J Biol Chem. 1997;272:2050–2052. doi: 10.1074/jbc.272.4.2050. [DOI] [PubMed] [Google Scholar]
- 3.Bonni A, Brunet A, West AE, Datta SR, Takasu MA, Greenberg ME. Cell survival promoted by the Ras-MAPK signaling pathway by transcription-dependent and -independent mechanisms. Science. 1999;286:1358–1362. doi: 10.1126/science.286.5443.1358. [DOI] [PubMed] [Google Scholar]
- 4.Calhoun ME, Wiederhold KH, Abramowski D, Phinney AL, Probst A, Sturchler-Pierrat C, Staufenbiel M, Sommer B, Jucker M. Neuron loss in APP transgenic mice. Nature. 1998;395:755–756. doi: 10.1038/27351. [DOI] [PubMed] [Google Scholar]
- 5.Costoya JA, Finidori J, Moutoussamy S, Senaris R, Devesa J, Arce VM. Activation of growth hormone receptor delivers an antiapoptotic signal: evidence for a role of Akt in this pathway. Endocrinology. 1999;140:5937–5943. doi: 10.1210/endo.140.12.7209. [DOI] [PubMed] [Google Scholar]
- 6.Datta SR, Dudek H, Tao X, Masters S, Fu H, Gotoh Y, Greenberg ME. Akt phosphorylation of BAD couples survival signals to the cell-intrinsic death machinery. Cell. 1997;91:231–241. doi: 10.1016/s0092-8674(00)80405-5. [DOI] [PubMed] [Google Scholar]
- 7.Dineley KT, Westerman M, Bui D, Bell K, Ashe KH, Sweatt JD. β-Amyloid activates the mitogen-activated protein kinase cascade via hippocampal α7 nicotinic acetylcholine receptors: in vitro and in vivo mechanisms related to Alzheimer's disease. J Neurosci. 2001;21:4125–4133. doi: 10.1523/JNEUROSCI.21-12-04125.2001. [DOI] [PMC free article] [PubMed] [Google Scholar]
- 8.Dore S, Kar S, Quirion R. Insulin-like growth factor I protects and rescues hippocampal neurons against β-amyloid- and human amylin-induced toxicity. Proc Natl Acad Sci USA. 1997;94:4772–4777. doi: 10.1073/pnas.94.9.4772. [DOI] [PMC free article] [PubMed] [Google Scholar]
- 9.Duff K, Eckman C, Zehr C, Yu X, Prada CM, Perez-tur J, Hutton M, Buee L, Harigaya Y, Yager D, Morgan D, Gordon MN, Holcomb L, Refolo L, Zenk B, Hardy J, Younkin S. Increased amyloid-β4243 in brains of mice expressing mutant presenilin 1. Nature. 1996;383:710–713. doi: 10.1038/383710a0. [DOI] [PubMed] [Google Scholar]
- 10.Estus S, Zaks WJ, Freeman RS, Gruda M, Bravo R, Johnson EM., Jr Altered gene expression in neurons during programmed cell death: identification of c-jun as necessary for neuronal apoptosis. J Cell Biol. 1994;127:1717–1727. doi: 10.1083/jcb.127.6.1717. [DOI] [PMC free article] [PubMed] [Google Scholar]
- 11.Ferrer I, Blanco R, Carmona M, Ribera R, Goutan E, Puig B, Rey MJ, Cardozo A, Vinals F, Ribalta T. Phosphorylated map kinase (ERK1, ERK2) expression is associated with early tau deposition in neurones and glial cells, but not with increased nuclear DNA vulnerability and cell death, in Alzheimer disease, Pick's disease, progressive supranuclear palsy and corticobasal degeneration. Brain Pathol. 2001;11:144–158. doi: 10.1111/j.1750-3639.2001.tb00387.x. [DOI] [PMC free article] [PubMed] [Google Scholar]
- 12.Gerwins P, Blank JL, Johnson GL. Cloning of a novel mitogen-activated protein kinase kinase kinase, MEKK4, that selectively regulates the c-Jun amino terminal kinase pathway. J Biol Chem. 1997;272:8288–8295. doi: 10.1074/jbc.272.13.8288. [DOI] [PubMed] [Google Scholar]
- 13.Giovannelli L, Casamenti F, Scali C, Bartolini L, Pepeu G. Differential effects of amyloid peptides β1–40 and β25–35 injections into the rat nucleus basalis. Neuroscience. 1995;66:781–792. doi: 10.1016/0306-4522(94)00610-h. [DOI] [PubMed] [Google Scholar]
- 14.Greenberg SM, Koo EH, Selkoe DJ, Qiu WQ, Kosik KS. Secreted β-amyloid precursor protein stimulates mitogen-activated protein kinase and enhances tau phosphorylation. Proc Natl Acad Sci USA. 1994;91:7104–7108. doi: 10.1073/pnas.91.15.7104. [DOI] [PMC free article] [PubMed] [Google Scholar]
- 15.Hafezi F, Steinbach JP, Marti A, Munz K, Wang ZQ, Wagner EF, Aguzzi A, Reme CE. The absence of c-fos prevents light-induced apoptotic cell death of photoreceptors in retinal degeneration in vivo. Nat Med. 1997;3:346–349. doi: 10.1038/nm0397-346. [DOI] [PubMed] [Google Scholar]
- 16.Holcomb L, Gordon MN, McGowan E, Yu X, Benkovic S, Jantzen P, Wright K, Saad I, Mueller R, Morgan D, Sanders S, Zehr C, O'Campo K, Hardy J, Prada CM, Eckman C, Younkin S, Hsiao K, Duff K. Accelerated Alzheimer-type phenotype in transgenic mice carrying both mutant amyloid precursor protein and presenilin 1 transgenes. Nat Med. 1998;4:97–100. doi: 10.1038/nm0198-097. [DOI] [PubMed] [Google Scholar]
- 17.Hsiao K, Chapman P, Nilsen S, Eckman C, Harigaya Y, Younkin S, Yang F, Cole G. Correlative memory deficits, Aβ elevation, and amyloid plaques in transgenic mice. Science. 1996;274:99–102. doi: 10.1126/science.274.5284.99. [DOI] [PubMed] [Google Scholar]
- 18.Irizarry MC, McNamara M, Fedorchak K, Hsiao K, Hyman BT. APPSw transgenic mice develop age-related Aβ deposits and neuropil abnormalities, but no neuronal loss in CA1. J Neuropathol Exp Neurol. 1997a;56:965–973. doi: 10.1097/00005072-199709000-00002. [DOI] [PubMed] [Google Scholar]
- 19.Irizarry MC, Soriano F, McNamara M, Page KJ, Schenk D, Games D, Hyman BT. Aβ deposition is associated with neuropil changes, but not with overt neuronal loss in the human amyloid precursor protein V717F (PDAPP) transgenic mouse. J Neurosci. 1997b;17:7053–7059. doi: 10.1523/JNEUROSCI.17-18-07053.1997. [DOI] [PMC free article] [PubMed] [Google Scholar]
- 20.Irizarry MC, Locascio JJ, Hyman BT. β-Site APP cleaving enzyme mRNA expression in APP transgenic mice: anatomical overlap with transgene expression and static levels with aging. Am J Pathol. 2001;158:173–177. doi: 10.1016/s0002-9440(10)63955-7. [DOI] [PMC free article] [PubMed] [Google Scholar]
- 21.Janus C, Pearson J, McLaurin J, Mathews PM, Jiang Y, Schmidt SD, Chishti MA, Horne P, Heslin D, French J, Mount HT, Nixon RA, Mercken M, Bergeron C, Fraser PE, St. George-Hyslop P, Westaway D. Aβ peptide immunization reduces behavioural impairment and plaques in a model of Alzheimer's disease. Nature. 2000;408:979–982. doi: 10.1038/35050110. [DOI] [PubMed] [Google Scholar]
- 22.Kar S, Seto D, Dore S, Hanisch U-K, Quirion R. Insulin-like growth factors-I and -II differentially regulate endogenous acetylcholine release from the rat hippocampal formation. Proc Natl Acad Sci USA. 1997;94:14054–14059. doi: 10.1073/pnas.94.25.14054. [DOI] [PMC free article] [PubMed] [Google Scholar]
- 23.Kawano T, Fukunaga K, Takeuchi Y, Morioka M, Yano S, Hamada J, Ushio Y, Miyamoto E. Neuroprotective effect of sodium orthovanadate on delayed neuronal death after transient forebrain ischemia in gerbil hippocampus. J Cereb Blood Flow Metab. 2001;21:1268–1280. doi: 10.1097/00004647-200111000-00003. [DOI] [PubMed] [Google Scholar]
- 24.Kawarabayashi T, Younkin LH, Saido TC, Shoji M, Ashe KH, Younkin SG. Age-dependent changes in brain, CSF, and plasma amyloid β protein in the Tg2576 transgenic mouse model of Alzheimer's disease. J Neurosci. 2001;21:372–381. doi: 10.1523/JNEUROSCI.21-02-00372.2001. [DOI] [PMC free article] [PubMed] [Google Scholar]
- 25.Kruman II, Kumaravel TS, Lohani A, Pedersen WA, Cutler RG, Kruman Y, Haughey N, Lee J, Evans M, Mattson MP. Folic acid deficiency and homocysteine impair DNA repair in hippocampal neurons and sensitize them to amyloid toxicity in experimental models of Alzheimer's disease. J Neurosci. 2002;22:1752–1762. doi: 10.1523/JNEUROSCI.22-05-01752.2002. [DOI] [PMC free article] [PubMed] [Google Scholar]
- 26.Kuro-o M, Matsumura Y, Aizawa H, Kawaguchi H, Suga T, Utsugi T, Ohyama Y, Kurabayashi M, Kaname T, Kume E, Iwasaki H, Iida A, Shiraki-Iida T, Nishikawa S, Nagai R, Nabeshima YI. Mutation of the mouse klotho gene leads to a syndrome resembling aging. Nature. 1997;390:45–51. doi: 10.1038/36285. [DOI] [PubMed] [Google Scholar]
- 27.Lim GP, Chu T, Yang F, Beech W, Frautschy SA, Cole GM. The curry spice curcumin reduces oxidative damage and amyloid pathology in an Alzheimer transgenic mouse. J Neurosci. 2001;21:8370–8377. doi: 10.1523/JNEUROSCI.21-21-08370.2001. [DOI] [PMC free article] [PubMed] [Google Scholar]
- 28.Lipshutz RJ, Fodor SP, Gingeras TR, Lockhart DJ. High density synthetic oligonucleotide arrays. Nat Genet. 1999;21:20–24. doi: 10.1038/4447. [DOI] [PubMed] [Google Scholar]
- 29.Logan A, Gonzalez AM, Hill DJ, Berry M, Gregson NA, Baird A. Coordinated pattern of expression and localization of insulin-like growth factor-II (IGF-II) and IGF-binding protein-2 in the adult rat brain. Endocrinology. 1994;135:2255–2264. doi: 10.1210/endo.135.5.7525264. [DOI] [PubMed] [Google Scholar]
- 30.Marcus DL, Strafaci JA, Miller DC, Masia S, Thomas CG, Rosman J, Hussain S, Freedman ML. Quantitative neuronal c-fos and c-jun expression in Alzheimer's disease. Neurobiol Aging. 1998;19:393–400. doi: 10.1016/s0197-4580(98)00077-3. [DOI] [PubMed] [Google Scholar]
- 31.Martin D, Salinas M, Lopez-Valdaliso R, Serrano E, Recuero M, Cuadrado A. Effect of the Alzheimer amyloid fragment Aβ25–35 on Akt/PKB kinase and survival of PC12 cells. J Neurochem. 2001;78:1000–1008. doi: 10.1046/j.1471-4159.2001.00472.x. [DOI] [PubMed] [Google Scholar]
- 32.Mattson MP, Cheng B, Culwell AR, Esch FS, Lieberburg I, Rydel RE. Evidence for excitoprotective and intraneuronal calcium-regulating roles for secreted forms of the β-amyloid precursor protein. Neuron. 1993;10:243–254. doi: 10.1016/0896-6273(93)90315-i. [DOI] [PubMed] [Google Scholar]
- 33.Mills J, Laurent Charest D, Lam F, Beyreuther K, Ida N, Pelech SL, Reiner PB. Regulation of amyloid precursor protein catabolism involves the mitogen-activated protein kinase signal transduction pathway. J Neurosci. 1997;17:9415–9422. doi: 10.1523/JNEUROSCI.17-24-09415.1997. [DOI] [PMC free article] [PubMed] [Google Scholar]
- 34.Morgan D, Diamond DM, Gottschall PE, Ugen KE, Dickey C, Hardy J, Duff K, Jantzen P, DiCarlo G, Wilcock D, Connor K, Hatcher J, Hope C, Gordon M, Arendash GW. Aβ peptide vaccination prevents memory loss in an animal model of Alzheimer's disease. Nature. 2000;408:982–985. doi: 10.1038/35050116. [DOI] [PubMed] [Google Scholar]
- 35.Pratico D, Uryu K, Leight S, Trojanoswki JQ, Lee VM. Increased lipid peroxidation precedes amyloid plaque formation in an animal model of Alzheimer amyloidosis. J Neurosci. 2001;21:4183–4187. doi: 10.1523/JNEUROSCI.21-12-04183.2001. [DOI] [PMC free article] [PubMed] [Google Scholar]
- 36.Preston GA, Lyon TT, Yin Y, Lang JE, Solomon G, Annab L, Srinivasan DG, Alcorta DA, Barrett JC. Induction of apoptosis by c-Fos protein. Mol Cell Biol. 1996;16:211–218. doi: 10.1128/mcb.16.1.211. [DOI] [PMC free article] [PubMed] [Google Scholar]
- 37.Scheepens A, Sirimanne ES, Breier BH, Clark RG, Gluckman PD, Williams CE. Growth hormone as a neuronal rescue factor during recovery from CNS injury. Neuroscience. 2001;104:677–687. doi: 10.1016/s0306-4522(01)00109-9. [DOI] [PubMed] [Google Scholar]
- 38.Schwarzman AL, Gregori L, Vitek MP, Lyubski S, Strittmatter WJ, Enghilde JJ, Bhasin R, Silverman J, Weisgraber KH, Coyle PK, Zagorski MG, Talafous J, Eisenberg M, Saunders AM, Roses AD, Goldgaber D. Transthyretin sequesters amyloid β protein and prevents amyloid formation. Proc Natl Acad Sci USA. 1994;91:8368–8372. doi: 10.1073/pnas.91.18.8368. [DOI] [PMC free article] [PubMed] [Google Scholar]
- 39.Serot JM, Christmann D, Dubost T, Couturier M. Cerebrospinal fluid transthyretin: aging and late-onset Alzheimer's disease. J Neurol Neurosurg Psychiatry. 1997;63:506–508. doi: 10.1136/jnnp.63.4.506. [DOI] [PMC free article] [PubMed] [Google Scholar]
- 40.Seshadri S, Beiser A, Selhub J, Jacques PF, Rosenberg IH, D'Agostino RB, Wilson PW, Wolf PA. Plasma homocysteine as a risk factor for dementia and Alzheimer's disease. N Engl J Med. 2002;346:476–483. doi: 10.1056/NEJMoa011613. [DOI] [PubMed] [Google Scholar]
- 41.Shiraki-Iida T, Iida A, Nabeshima Y, Anazawa H, Nishikawa S, Noda M, Kuro-o M. Improvement of multiple pathophysiological phenotypes of klotho (kl/kl) mice by adenovirus-mediated expression of the klotho gene. J Gene Med. 2000;2:233–242. doi: 10.1002/1521-2254(200007/08)2:4<233::AID-JGM110>3.0.CO;2-5. [DOI] [PubMed] [Google Scholar]
- 42.Stobrawa SM, Breiderhoff T, Takamori S, Engel D, Schweizer M, Zdebik AA, Bosl MR, Ruether K, Jahn H, Draguhn A, Jahn R, Jentsch TJ. Disruption of ClC-3, a chloride channel expressed on synaptic vesicles, leads to a loss of the hippocampus. Neuron. 2001;29:185–196. doi: 10.1016/s0896-6273(01)00189-1. [DOI] [PubMed] [Google Scholar]
- 43.Vaudry D, Gonzalez BJ, Basille M, Pamantung TF, Fontaine M, Fournier A, Vaudry H. The neuroprotective effect of pituitary adenylate cyclase-activating polypeptide on cerebellar granule cells is mediated through inhibition of the CED3-related cysteine protease caspase-3/CPP32. Proc Natl Acad Sci USA. 2000;97:13390–13395. doi: 10.1073/pnas.97.24.13390. [DOI] [PMC free article] [PubMed] [Google Scholar]
- 44.Webster J, Prager D, Melmed S. Insulin-like growth factor-1 activation of extracellular signal-related kinase-1 and -2 in growth hormone-secreting cells. Mol Endocrinol. 1994;8:539–544. doi: 10.1210/mend.8.5.8058064. [DOI] [PubMed] [Google Scholar]
- 45.Wu CJ, Chen Z, Ullrich A, Greene MI, O'Rourke DM. Inhibition of EGFR-mediated phosphoinositide-3-OH kinase (PI3-K) signaling and glioblastoma phenotype by signal-regulatory proteins (SIRPs). Oncogene. 2000;19:3999–4010. doi: 10.1038/sj.onc.1203748. [DOI] [PubMed] [Google Scholar]
- 46.Yankner BA, Duffy LK, Kirschner DA. Neurotrophic and neurotoxic effects of amyloid β protein: reversal by tachykinin neuropeptides. Science. 1990;250:279–282. doi: 10.1126/science.2218531. [DOI] [PubMed] [Google Scholar]
- 47.Zheng WH, Kar S, Dore S, Quirion R. Insulin-like growth factor-1 (IGF-1): a neuroprotective trophic factor acting via the Akt kinase pathway. J Neural Transm Suppl. 2000;60:261–272. doi: 10.1007/978-3-7091-6301-6_17. [DOI] [PubMed] [Google Scholar]