

Abstract
Dysfunction of the dorsal prefrontal cortex (PFC) in schizophrenia may be associated with alterations in the regulation of brain metabolism. To determine whether abnormal expression of genes encoding proteins involved in cellular metabolism contributes to this dysfunction, we used cDNA microarrays to perform gene expression profiling of all major metabolic pathways in postmortem samples of PFC area 9 from 10 subjects with schizophrenia and 10 matched control subjects. Genes comprising 71 metabolic pathways were assessed in each pair, and only five pathways showed consistent changes (decreases) in subjects with schizophrenia. Reductions in expression were identified for genes involved in the regulation of ornithine and polyamine metabolism, the mitochondrial malate shuttle system, the transcarboxylic acid cycle, aspartate and alanine metabolism, and ubiquitin metabolism. Interestingly, although most of the metabolic genes that were consistently decreased across subjects with schizophrenia were not similarly decreased in haloperidol-treated monkeys, the transcript encoding the cytosolic form of malate dehydrogenase displayed prominent drug-associated increases in expression compared with untreated animals. These molecular analyses implicate a highly specific pattern of metabolic alterations in the PFC of subjects with schizophrenia and raise the possibility that antipsychotic medications may exert a therapeutic effect, in part, by normalizing some of these changes.
Keywords: microarray, neuroleptic, haloperidol, malate, ubiquitin, ornithine, polyamine, aspartate, citrate, transcarboxylic acid, mitochondria, prefrontal
Alterations in the metabolism of the dorsal prefrontal cortex (PFC) are well documented in studies of schizophrenia (Berman et al., 1986; Weinberger et al., 1986; Andreasen et al., 1992; Buchsbaum et al., 1992). It has been suggested that some of these alterations may underlie the cognitive symptoms of the disorder (Goldman-Rakic 1991; Park and Holzman 1992). For example, blunted increases in glucose use and blood flow are seen in the dorsal PFC of subjects with schizophrenia while they perform cognitive tasks compared with the large activations and blood flow increases seen in normal subjects (Berman et al., 1986, 1992; Weinberger et al., 1986;Andreasen et al., 1992; Buchsbaum et al., 1992; Callicott et al., 1998). Considerable efforts have been made to determine the cellular mechanisms that might underlie these apparent alterations in brain metabolism in schizophrenia. Magnetic resonance spectroscopy studies suggest that changes in the concentration of high-energy phosphate molecules (including ATP, phosphocreatine, and phospholipid metabolites) may be a common feature of schizophrenia, present even in never-medicated subjects at the onset of clinical symptoms (Pettegrew et al., 1991; Bertolino et al., 1998; Cecil et al., 1999; Keshavan et al., 2000; Stanley et al., 2000). Other studies have reported altered expression of one or more metabolic genes, or the levels of proteins for which these genes code, in postmortem brain tissue from subjects with schizophrenia (Marchbanks et al., 1995; Mulcrone et al., 1995;Whatley et al., 1996; Prince et al., 1999; Maurer et al., 2001).
It is possible that the changes in prefrontal metabolism reported in schizophrenia may be related to changes in synaptic structure and function. This is attributable to both the high metabolic demands placed on neurons by the processes involved in synaptic communication and the considerable evidence indicating synaptic abnormalities in schizophrenia (Perrone-Bizzozero et al., 1996;Glantz and Lewis, 1997, 2000; Harrison 1999; Karson et al., 1999; Selemon and Goldman-Rakic 1999). In a previous report, we used cDNA microarrays to assess potential alterations in >250 different gene groups in six subjects with schizophrenia (Mirnics et al., 2000,2001a). We showed that genes related to presynaptic secretory function, and the gene encoding the regulator of G-protein signaling 4 (RGS4), were consistently decreased in subjects with schizophrenia. The data suggested that schizophrenia may be a disease with fundamental dysfunction of synaptic communication (Mirnics et al., 2000, 2001a,b). In the present study, we wished to determine whether transcript levels in more than 70 different gene groups involved in cellular metabolism, which could impact the quality of neuronal communication, were altered in a larger sample of subjects with schizophrenia and whether the effects on these gene groups were interrelated. The present report demonstrates that only five of the metabolic pathways examined showed consistent changes (decreases) in subjects with schizophrenia and that four of these groups are linked together by the presence of overlapping gene members.
MATERIALS AND METHODS
Ten subjects with schizophrenia and 11 matched control subjects were used for both the microarray and in situ hybridization studies (Table 1). One of the subject pairs (794c/665s) used in the microarray studies did not have tissue available for in situ hybridization from the control subject, so another matched control subject (806c) was substituted. The two groups of normal subjects and subjects with schizophrenia did not differ in mean ± SD age at time of death (47.3 ± 14.5 and 46.0 ± 12.6 years, respectively), postmortem interval (PMI) (17.4 ± 5.5 and 18.6 ± 6.7 hr, respectively), brain pH (6.83 ± 0.21 and 6.84 ± 0.35, respectively), or tissue storage time at −80°C (57.7 ± 16.6 and 67.7 ± 21.8 months, respectively). Subject pairs were matched for gender (eight males and two females per group), and eight of the pairs were matched for race. Among the group of subjects diagnosed with schizophrenia, eight were receiving antipsychotic medications, three had a history of alcohol abuse or dependence, and one had a history of drug dependence at the time of death. Two of the subjects with schizophrenia died by suicide. Among the control subjects, one (635c) had a past history of depressive disorder, not otherwise specified, and another had a history of alcohol abuse or dependence at the time of death. Consensus DSM-IIIR (Diagnostic and Statistical Manual of Mental Disorders, 1987) diagnoses for all subjects were made using data from clinical records, toxicology studies, and structured interviews with surviving relatives, as described in detail previously (Volk et al., 2000). Six of the subject pairs used in the present study were studied previously using cDNA microarrays (Mirnics et al., 2000, 2001a,b). One of these “old” pairs (685c/622s) and four additional subject pairs not studied previously with microarrays were analyzed using a more updated microarray platform for the current study (see Microarray experiments). We note that, since publication of these previous studies, we performed an extensive reevaluation of all potential subject pairings to obtain the best possible pairs (based on gender, age, postmortem interval, and brain pH) for a much larger set of patients and controls in future microarray studies. This necessitated that some of the previous pairings used for in situhybridization follow-up studies were rearranged.
Table 1.
Characteristics of subjects used in microarray and in situ hybridization studies
| Pair | Gender | Race | Age | PMI (hr) | Brain pH | Storage (months) | ||||||
|---|---|---|---|---|---|---|---|---|---|---|---|---|
| C | S | C | S | C | S | C | S | C | S | C | S | |
| 635c/597s | F | F | Ca | Ca | 54 | 46 | 17.8 | 10.1 | 6.47 | 7.02 | 58 | 64 |
| 551c/625s | M | M | Ca | AA | 61 | 49 | 16.4 | 23.5 | 6.63 | 7.32 | 72 | 60 |
| 685c/622s | M | M | Ca | Ca | 56 | 58 | 14.5 | 18.9 | 6.57 | 6.78 | 52 | 60 |
| 604c/581s | M | M | Ca | Ca | 39 | 46 | 19.3 | 28.1 | 7.08 | 7.22 | 62 | 67 |
| 558c/317s | M | M | Ca | Ca | 47 | 48 | 6.6 | 8.3 | 6.99 | 6.07 | 70 | 121 |
| 806c/665s | M | M | Ca | AA | 57 | 59 | 24.0 | 28.1 | 6.94 | 6.92 | 31 | 55 |
| 822c/787s | M | M | AA | AA | 28 | 27 | 25.3 | 19.2 | 7.04 | 6.67 | 28 | 35 |
| 567c/537s | F | F | Ca | Ca | 46 | 37 | 15.0 | 14.5 | 6.72 | 6.68 | 69 | 74 |
| 516c/547s | M | M | AA | AA | 20 | 27 | 14.0 | 16.5 | 6.86 | 6.95 | 76 | 72 |
| 630c/566s | M | M | Ca | Ca | 65 | 63 | 21.2 | 18.3 | 6.95 | 6.80 | 59 | 69 |
| Mean | 47.3 | 46.0 | 17.4 | 18.6 | 6.83 | 6.84 | 57.7 | 67.7 | ||||
| SD | 14.5 | 12.6 | 5.5 | 6.7 | 0.21 | 0.35 | 16.6 | 21.8 | ||||
C, Control subject; S, schizophrenic subject; M, male; F, female; Ca, Caucasian; AA, African American.
Microarray experiments
Methods of tissue preparation, nucleic acid isolation, sample labeling, microarray hybridization, and initial data analysis were the same as those reported previously (Mirnics et al., 2000). Briefly, 200 ng of mRNA was reverse transcribed using Cy3- or Cy5-labeled fluorescent primers. Samples from matched subject pairs were combined and hybridized onto the same UniGEM V or UniGEM V2 cDNA microarray (Incyte Genomics Inc., Fremont, CA). Each UniGEM V array contained >7800 unique and sequence-verified cDNA or expressed sequence tag elements, whereas each UniGEM V2 array contained nearly 10,000 elements, including >7000 of the genes present on the UniGEM V. If a transcript was differentially expressed, the cDNA feature on the array bound more of the labeled target from one sample than the other, producing either a greater Cy3 or Cy5 signal intensity. Microarrays were scanned under Cy3–Cy5 dual fluorescence, and the resulting images were analyzed for signal intensity. Only genes whose signal intensity was 3.5-fold greater than background signal intensity were called present. The operators performing the labeling, hybridization, scanning, and signal analysis were blind to the specific category to which each sample belonged.
Individual gene expression analysis. Because of the inherent variability in the distribution of expression ratios from experiment to experiment and the use of two different microarray platforms with different published confidence levels, we converted the balanced differential expression (BDE) ratio (of Cy3/Cy5 intensity) for each gene into a standard Z score for each experiment according to the following formula:
After this normalization procedure, the mean Z score for each array comparison was 0.0, with an SD of 1.0. To identify the most consistently affected metabolic-related genes in these experiments, we computed a “Z load score” for each gene, which was the product of the average Z score of a gene across all subject pair comparisons and the number of comparisons in which that gene was significantly changed at the 0.05 α level (i.e., had a Z score that exceeded ±1.65) (Table2).
Table 2.
Ranking of metabolic genes according to Z load scores
| Rank | Gene name | Gene group (category) | UniGene Hs ID | GEMs present | GEMs decrease | Average Z | Z load |
|---|---|---|---|---|---|---|---|
| (1) | Antizyme inhibitor | Ornithine–polyamine (iv) | 223014 | 9 | 7 | 2.49 | 17.43 |
| (2) | Crystallin, μ | Ornithine–polyamine (iv) | 924 | 10 | 7 | 2.22 | 15.53 |
| (3) | Ornithine aminotransferase | Ornithine–polyamine (iv) | 75485 | 5 | 4 | 3.13 | 12.53 |
| (4) | Translocase of inner mitochondrial membrane 17 | Mitochondrial–translocases (vii) | 20716 | 9 | 6 | 2.06 | 12.33 |
| (5) | Ubiquitin-specific protease 14 | Ubiquitin (vii) | 75981 | 9 | 5 | 1.87 | 9.33 |
| (6) | Glutamic-oxaloacetic transaminase 2, mitochondrial | Malate shuttle (i), aspartate–alanine (iv) | 170197 | 10 | 6 | 1.39 | 8.33 |
| (7) | 3-Oxoacid CoA transferase | Ketone body (iii) | 177584 | 10 | 5 | 1.59 | 7.93 |
| (8) | ATP synthase, mitochondrial F1 complex, α | ETC V (i) | 155101 | 10 | 4 | 1.72 | 6.87 |
| (9) | Malate dehydrogenase 1, NAD (soluble) | Malate shuttle (i), TCA cycle (i) | 75375 | 10 | 4 | 1.71 | 6.85 |
| (10) | Ubiquitin C-terminal esterase L1 (thiolesterase) | Ubiquitin (vii) | 76118 | 10 | 4 | 1.71 | 6.82 |
Genes in bold were chosen for in situ hybridization analysis. Category notation provided in Figure 1. CoA, Coenzyme A; NAD, nicotinamide adenine dinucleotide.
Gene group design. Metabolism gene groups were constructed using the Kyoto Encyclopedia of Genes and Genomes release 19.0, July 2001 (www.genome.ad.jp/kegg/metabolism.html). Several additional groups were also constructed using standard biochemistry texts and review articles (Alberts et al., 1989; Siegel et al., 1989; Darnell et al., 1990; Mathews and van Holde, 1990; Kauppinen and Alhonen, 1995;Bernstein and Muller, 1999). These custom designed groups included genes involved in the five different subunits of the electron transport chain (ETC), the malate shuttle system, the ornithine–polyamine system, and ubiquitin metabolism gene families. The list of genes in these groups has been made available for viewing athttp://www.neurobio.pitt.edu/Levitt_JN_Genes.htm.
Gene group expression analysis. Analysis of gene group expression was performed by ANOVA, using a post hoctest (Scheffe's) to compare the distribution of Z scores for all genes in a group with the distribution of Z scores for all of the genes on an array. The significance values (p values) of these post hoc tests were entered into a table that was pseudocolored according to the level of the effect (Fig. 1). We found that this method of gene group expression analysis provides a more conservative estimate of significant gene group effects compared with other methods that we used, such as repeated t test comparisons or χ2 analysis using confidence interval binning. To determine whether there were significant interactions among gene groups, the p values for each gene group were normalized by using the −log of each p, with the sign positive or negative depending on the direction of the change in expression. A correlation matrix was then computed among the 71 different gene groups and principal component analysis (PCA) subsequently applied to the matrix. The factor loadings for the five gene groups that were significantly changed in five or more comparisons were displayed in a radial plot (see Fig. 3A).
Fig. 1.
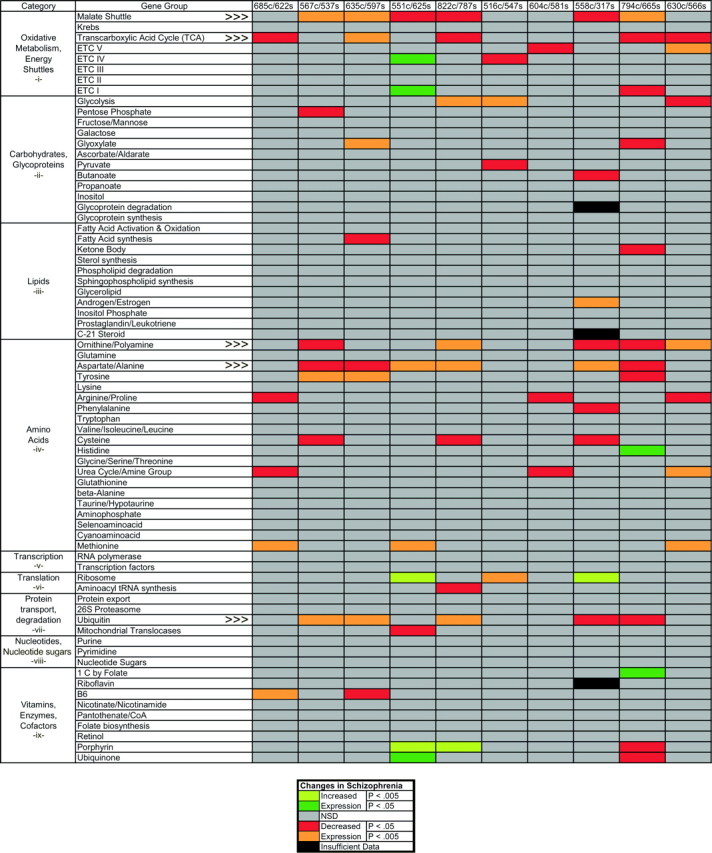
Metabolic gene group expression in schizophrenia. Genes in 71 different metabolic groups, belonging to several different categories of cellular functions, were analyzed in 10 subjects with schizophrenia and their matched controls. For each gene, a pairwise differential expression ratio was calculated and converted into a Z score for each array comparison. TheZ score distribution of all of the genes present in each gene group was then compared with the Z score distribution of each array using ANOVA, and the significance of the differences was estimated with a post hoc paired Scheffe's F test. The p values from these tests were entered into a table that was pseudocolored according to the level of the effect (key at the bottom). An average og 7.2 of the 71 gene groups were significantly changed in each of the five pairs compared using the UniGEM V microarray (right), whereas an average of 7.6 gene groups were changed in each of the five pairs compared using the UniGEM V2 microarray (left). Only five genes groups exhibited changes in expression (decreases) in five or more comparisons (indicated by arrowheads). The decreases in these five gene groups reached significance slightly more often in the UniGEM V2 comparisons (mean, 3.2 of 5) than the UniGEM V comparisons (mean, 2.2 of 5), although a complete shift of the mean Z scores of these groups was evident in all comparisons (see Fig. 2).
Fig. 3.
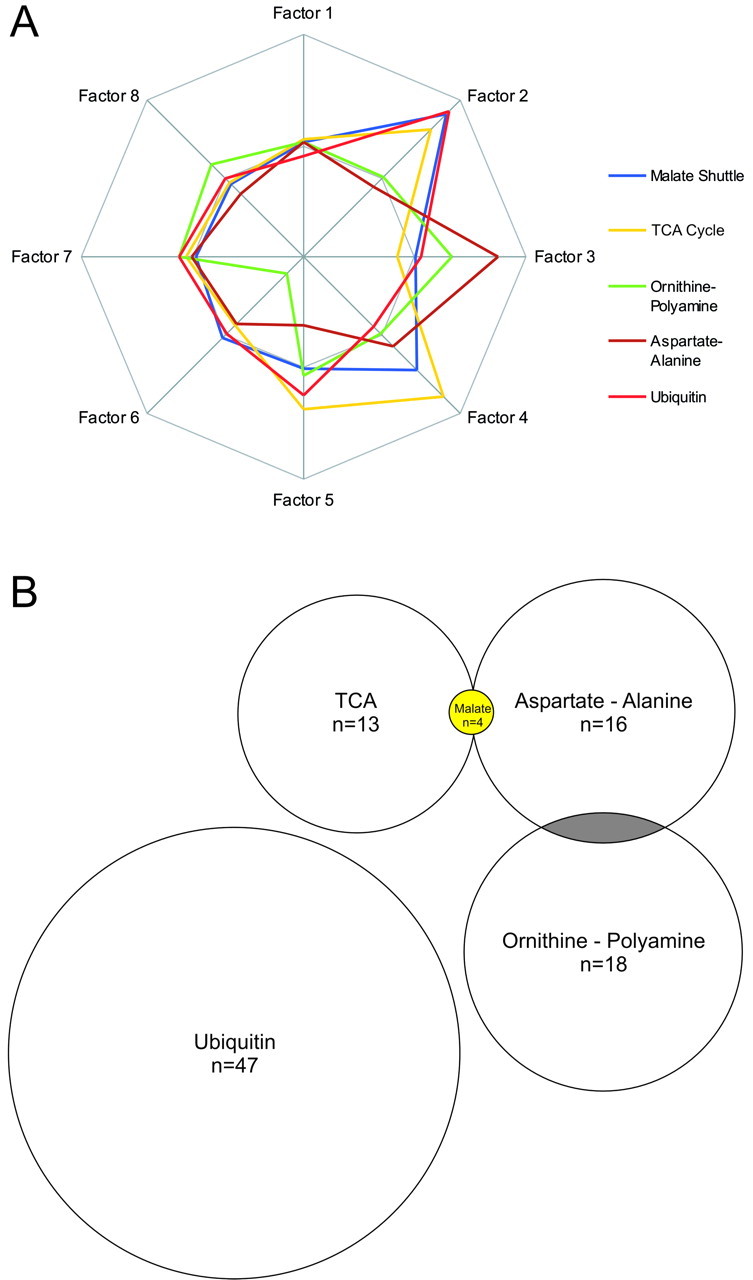
Correlations and connections between affected gene groups. A, To estimate the mathematical relationships between the effects on different gene groups, the normalizedp values from Figure 1 were used to calculate a correlation matrix and perform a PCA. The PCA revealed strong relationships between the effects on the malate shuttle, TCA (citrate) cycle, and ubiquitin metabolism gene groups (Factor 2) and between aspartate–alanine metabolism and ornithine–polyamine metabolism (Factor 3). Variance proportions for factors 1–8 were 0.308, 0.233, 0.169, 0.091, 0.069, 0.055, 0.054, and 0.020, respectively. B, Connections, in the form of shared genes, existed between four of the five most affected gene groups. The size of these gene groups are drawn to scale, with the presence of significantly affected overlapping genes indicted inyellow and nonsignificantly affected overlapping genes shown in gray.
In situ hybridization analysis
The same tissue blocks used for the microarray experiments were used to obtain sections for in situ hybridization. Area 9 was identified based on surface landmarks as described previously (Glantz and Lewis, 2000). After histological verification of the regions, 20 μm sections were cut with a cryostat at −20°C, mounted onto gelatin-coated glass slides, and stored at −80°C until use. The slides were coded so that the investigator performing the analysis was blinded to the diagnosis of the subjects. Three slides from each subject were used to examine the expression of each of four different genes: malate dehydrogenase type 1, cytosolic (MAD1); glutamate-oxaloacetate transaminase type 2, mitochondrial (GOT2); ornithine decarboxylase antizyme inhibitor (OAZIN); and ornithine aminotransferase (OAT). These genes were chosen for in situhybridization analysis because of their consistent changes in expression in the microarray experiments (Table 2). To generate the riboprobes for in situ hybridization, double-stranded cDNA containing highly unique 699–878 bp sequences of each gene were initially amplified from normal human brain cDNA using custom-designed primers in a standard PCR reaction [OAZIN, nucleotides (nt) 1146–1845 of D88674; OAT, nt 84–962 of M1496; MAD1, nt 168–905 of U20352; and GOT2, nt 458–1298 of M22632]. After cloning of the PCR products and sequence verification of selected colonies, [35S]-labeled riboprobes were synthesized. During hybridization, ∼2–3 ng of probe (∼1–2 × 10⁶ dpm) were used per slide in a total volume of 90–100 μl. All other methods used were described previously (Campbell et al., 1999; Mirnics et al., 2000). After hybridization (16 hr, 56°C) and film exposure [42 hr, BioMax MR (Eastman Kodak, Rochester, NY)] high-resolution scans of each film image were used for quantification of signal with Scion NIH Image (version 4.0b). In addition, dark-field images were captured from the slides that had been dipped in radiographic emulsion (14 d, NTB-2; Eastman Kodak). Through all procedures, subject pairs were always processed in parallel. Hybridization of sections with sense riboprobe did not result in detectable signal. The absolute levels (disintegrations per minute per square millimeter) of radioactive probe labeling were calculated using [14C]-labeled standards that had been cross-calibrated to known quantities of [35S]-containing brain matter. The baseline levels for these measurements were set at the 0 dpm level included on each standard.
Data from the in situ hybridization experiments were analyzed using multivariate ANOVA, repeated-measures ANOVA, and analysis of covariance with diagnosis as the main effect and brain pH, PMI, and tissue storage time as covariates. All of these models were applied both with and without subject pair as a blocking factor.Post hoc tests were performed using Fisher's protected least significant difference, Games–Howell, and Scheffe's methods. All models yielded similar results for the effect of diagnosis on expression level differences. Levels of gene expression were also subsequently analyzed by logistic regression.
Monkey experiments. To formally examine the potential influence of antipsychotic medication on the expression of MAD1, OAT, GOT2, and OAZIN, we also used four pairs of male cynomolgus (Macaca fascicularis) monkeys, matched for age and weight, as subjects for in situ hybridization analysis in areas 9 and 46. In each pair, one animal was treated for 9–12 months with the antipsychotic medication haloperidol decanoate as described previously (Pierri et al., 1999). Serum levels were in the therapeutic range for the treatment of schizophrenia. Extrapyramidal symptoms were effectively managed by maintenance administration of benztropine mesylate. Tissue sections from these animals were acquired and used in parallel with the human material.
All procedures were reviewed and approved by the appropriate institutional review boards or the institutional animal care and use committee.
RESULTS
Most of the metabolism gene groups that we analyzed did not display significant differences in transcript levels between schizophrenic and control subjects (Fig. 1). However, five gene groups did display significant alterations (p < 0.05) in transcript levels in five or more of the 10 array comparisons (Fig.1). These included the malate shuttle, transcarboxylic acid (TCA) cycle, ornithine–polyamine, aspartate–alanine, and ubiquitin metabolism groups. Several other gene groups also displayed significantly decreased expression in fewer than five array comparisons. No metabolic gene groups, however, showed significant increases in expression in more than two array comparisons (Fig. 1). When analyzed across all subjects with schizophrenia, the mean expression levels of each of the five most affected gene groups were consistently and significantly decreased compared with matched controls (Figs. 1, 2). In addition, analysis of the mean pairwise Z score distributions for these gene groups revealed two distinct and highly correlated patterns of decreased expression in the subjects with schizophrenia (Fig. 2). The first of these patterns was present in seven of 10 array comparisons with primary intercorrelations ranging from 0.77 to 0.99. The second pattern was present in two array comparisons (630c/566s and 604c/581s; r = 0.68). Only one array comparison failed to demonstrate significant similarity with other array comparisons (Fig. 2, 558c/317s).
Fig. 2.

Mean pairwise Z score distributions: five highly affected and one unaffected gene group. The distribution of mean Z scores for the five most consistently affected gene groups (see Fig. 1) is shown for each array comparison, along with the mean Z scores for an unaffected gene group, RNA polymerases (RNA Poly). Interestingly, the mean Z score distributions for the five most affected gene groups was highly correlated among seven of the 10 subject pairs (Pearson's R range, 0.77–0.99).Asp/Ala, Aspartate–alanine metabolism;Orn/PA, ornithine–polyamine metabolism.
Correlated metabolic group effects
To examine whether there were interactions among the effects on different metabolic gene groups, we next computed a correlation matrix using the −log of the p value for each gene group and performed a varimax PCA on this matrix. PCA permits one to search for significant relationships between multiple data sets and reduces the complexity of these relationships to a small number of factors that best describe the variance of the data. The PCA we performed produced eight factors that described >99.9% of the variance of the correlation matrix for the 71 gene groups. The degree to which the effects on different gene groups are related to each factor is provided by the oblique factor weights for each gene group, which are the correlation of each variable with each factor. Examination of the oblique factor weights in our PCA analysis revealed that the effects on the malate shuttle, TCA cycle, and ubiquitin groups were highly correlated (Fig. 3A,Factor 2). Factor 3, in contrast, more accurately described the effects on aspartate–alanine and ornithine–polyamine metabolism (Fig. 3A, Factor 3). This analysis also revealed that a number of gene groups with decreases in expression in fewer than five schizophrenic subjects had effects that were correlated with those of the more significantly affected gene groups. For example, the tyrosine and cysteine metabolism gene groups exhibited significant decreases in expression in three schizophrenic subjects, with the effects on all 10 subjects highly correlated with factor 2 (oblique factor weights 0.977 and 0.827, respectively). Likewise, expression of glycolysis genes was also significantly decreased in three schizophrenic subjects, with effects that were highly correlated with factor 3 (oblique factor weight 0.805).
Overlap in gene membership between different metabolic groups is one possible explanation for the apparent similarity of statistical effects on different gene groups; that is, a few genes whose changes were robust might impact multiple gene groups. To further probe this issue, we examined the overlap in gene membership among the most consistently affected gene groups (Fig. 3B). Interestingly, of the four genes comprising the malate shuttle group that were present on the array, two genes were part of the TCA group (n = 13 genes) and the other two genes were part of the aspartate–alanine group (n = 16 genes) (Fig. 3B, Table 2). Each of these four shared genes was significantly decreased in most schizophrenic subjects compared with controls. The ornithine–polyamine group (n = 18 genes) also shared two different genes with the aspartate–alanine group. These particular genes, however, were not significantly affected in schizophrenic subjects. The ubiquitin group (n = 47 genes) did not share any genes with the other metabolic gene groups. These observations, combined with our analysis of the statistical effects on different gene groups, indicate that simply sharing one or a few genes is insufficient to explain the effects we described. In many cases, groups with a high degree of overlap in membership do not have similar statistical effects (e.g., tyrosine and phenylalanine gene groups; ornithine–polyamine and urea cycle gene groups). Conversely, many of the gene groups with the highest correlated effects do not have any genes in common (e.g., ubiquitin and tyrosine; ubiquitin and malate shuttle).
Although small overlaps in group membership do not appear to produce correlated effects on different gene groups, they do establish real biological links between them. Of the five different metabolic cascades we identified as significantly affected in five or more array comparisons, we were able to establish biological links between four of these groups at the single gene level, with the lone exception being the ubiquitin gene group (Fig. 2B). These relationships may have important biological significance (see Discussion).
In situ hybridization verification
We examined the expression of some genes that belonged to more than one significantly affected gene group, as well as some genes that belonged to only a single gene group, to verify the decreases in expression observed in the microarray analysis. To determine the individual genes that had the most robust changes in our comparisons, we ranked all of the metabolic-related genes according to their Z load scores (Table 2; see Materials and Methods). Of the top 10 genes identified by this method, the transcripts encoding MAD1, OAT, GOT2, and OAZIN were selected for additional analysis usingin situ hybridization. Two of these transcripts (OAT and OAZIN) were members of a single gene group (ornithine–polyamine metabolism), whereas the other two transcripts belonged to more than one gene group (Table 2).
In situ hybridization analysis confirmed the microarray finding that expression of each of these four genes was significantly decreased (p < 0.05) in the PFC of the subjects with schizophrenia (Fig. 4). Moreover, there was no interaction between these decreases and other subject characteristics, such as brain pH, PMI, or tissue storage time. The decreased expression was present in the majority of the 10 subject pairs for each gene (Fig. 5).
Fig. 4.
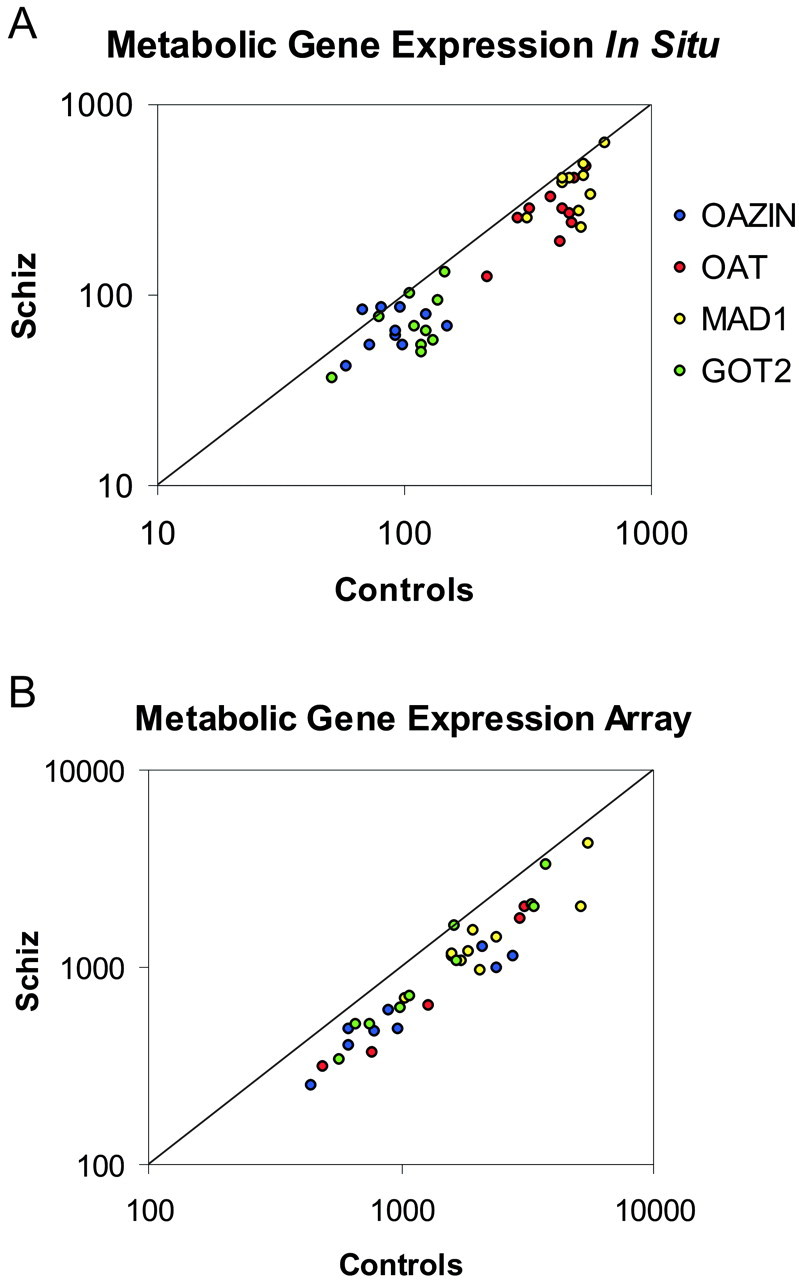
In situ hybridization confirms microarray data. Four genes (OAZIN, OAT, MAD1, and GOT2) were chosen for verification based on their consistency in changes (see Table 2). The expression of these genes was significantly decreased in both thein situ hybridization (A) and microarray (B) studies of 10 subjects with schizophrenia. In both A and B, the pairwise expression of each gene is plotted as a ratio of the level in the control subject compared with the level in the subject with schizophrenia. Genes expressed at a higher level in controls are located below the unity line, whereas genes expressed at a higher level in subjects with schizophrenia are located above the unity line. Levels of expression in A are in disintegrations per minute per square millimeter, and levels in B represent balanced fluorescent signal intensity.
Fig. 5.

Pairwise expression differences in metabolic gene expression. Each of the four metabolic genes we examined was significantly decreased in subjects with schizophrenia, using both paired and unpaired ANOVA comparisons. Mean levels of expression for each subject group are indicated by the black bars. Mean pairwise differences in expression for subjects with schizophrenia are given in the boxes at the bottom of eachpanel.
Each of the genes we examined by in situhybridization displayed a distinct pattern and intensity of hybridization (Figs. 6,7). For MAD1, nearly all cellular cortical layers contained moderate to high levels of expression, with very low levels of expression in the white matter. GOT2, another malate shuttle gene, displayed almost uniformly low levels of expression across all cortical layers. In contrast, OAT was highly expressed throughout most cellular cortical layers, with occasional increases in layer V present in some subjects and a low level of expression in the underlying white matter. OAZIN also displayed its highest expression in layer V, with low levels of expression in other cortical layers and a faint signal in white matter. Notably, the decreased expression of these four genes that we observed in subjects with schizophrenia did not appear to preferentially affect specific cortical layers.
Fig. 6.

Laminar localization of transcript expression. Each of the four genes examined was expressed in neurons, with little or no signal present in white matter. These genes exhibited different patterns and intensities but were all decreased in subjects with schizophrenia (right) compared with control subjects (left). Note that all of photomicrographs were taken using identical radiographic emulsion exposure times and identical illumination conditions. Roman numerals indicate cortical laminas.
Fig. 7.

Selective increases in MAD1 expression in haloperidol-treated monkeys. None of the four genes we examined in haloperidol-treated monkeys (A) exhibited the same significant decreases in expression as subjects with schizophrenia (B). However, one of these genes (MAD1) exhibited significant increases in expression. C, Enlarged views of the dorsomedial convexity of the PFC illustrating the change in MAD1 expression in medial area 9. The increased expression of MAD1 was specific to deep cortical layers. *p < 0.05.
Logistic regression classification
Because of the potentially important role of OAT, OAZIN, MAD1, and GOT2 in the pathophysiology of schizophrenia, we also performed a logistic regression classification test with our in situhybridization data. This analysis revealed that, as a group, the levels of expression of these four genes in the PFC correctly classified 75% of the subjects in our study as either affected or unaffected. This degree of accuracy is comparable with that achieved when analyzing expression levels of the single most changed gene in our microarray analysis, RGS4 (Mirnics et al., 2001a), by logistic regression classification (data not shown). Future studies will be necessary to determine the disease specificity of the changes we reported in the present study, but they support the concept that analyzing gene expression patterns in postmortem samples may be of value in identifying a distinctive molecular neuropathology of schizophrenia.
Gene expression in haloperidol-treated monkeys
Consistent changes in gene expression in subjects with schizophrenia may reflect either a component of the disease process or a consequence of the pharmacological treatment of the disorder.In situ analysis of gene expression in monkeys treated chronically with haloperidol indicated that none of the four genes we examined in subjects with schizophrenia was significantly decreased in an animal model of the treatment of the disorder (Figs. 6, 7). One of these four genes (OAZIN) did show marginal decreases, which may have reached significance with a larger sample size. In contrast to the lack of significant decreases in expression, we observed an unexpected increase (p < 0.05) in the expression of the MAD1 transcript in the PFC of haloperidol-treated monkeys (Figs. 6, 7). This increase in expression averaged over 40% on a pairwise basis (Fig. 7B) and was most evident in deep cortical layers (Fig.7C). Although we recognize that no animal model can accurately mirror the pharmacotherapy of schizophrenia, we cautiously interpret these data to indicate that many of the changes in metabolic gene expression we observed in subjects with schizophrenia are not a direct result of treatment with antipsychotic medication.
DISCUSSION
The use of cDNA microarrays provides an opportunity to assess, in a broad manner, potential metabolic alterations in schizophrenia at the molecular level. Our analysis has revealed a consistent and significant decrease in the expression of genes encoding proteins involved in the mitochondrial malate shuttle, the transcarboxylic acid cycle, aspartate and alanine metabolism, ornithine and polyamine metabolism, and ubiquitin metabolism. Interestingly, many of these effects were highly correlated with each other and with other biologically related, but less consistently affected, gene groups. The ranking of metabolic genes by Z load score and the analysis of gene overlap between different affected metabolic gene groups revealed that alterations in specific genes may be central to the metabolic pathophysiology of schizophrenia. In addition, because of the important relationship that exists between cellular metabolism and synaptic activity in the brain, these findings converge with our recent studies demonstrating reduced expression of gene groups involved in presynaptic function (Mirnics et al., 2000) and the reduced expression of RGS4, a protein involved in postsynaptic signaling (Mirnics et al., 2001). Together, the data suggest that deficits in neuronal communication may contribute to the core pathophysiology of schizophrenia.
Biological significance
At the chromosomal level, many of the individual metabolic transcripts we identified as abnormally expressed in subjects with schizophrenia are located on cytogenetic loci that are directly linked or associated with the disorder, including 1q32–44, 5q11–13, 8p22–21, 17q21, and 22q11–13 (Thaker and Carpenter, 2001). In addition, previous reports suggest that mitochondrial genes are expressed at abnormal levels in schizophrenia (Marchbanks et al., 1995;Mulcrone et al., 1995; Whatley et al., 1996; Prince et al., 1999;Maurer et al., 2001). Thus, it is possible that some metabolic-related genes may prove to be bona fide susceptibility genes. However, whether these transcriptional changes in metabolic gene groups reflect primary or secondary changes, they clearly have the potential to alter neuronal metabolism and activity, thereby contributing to defects in neuronal communication.
Our findings indicate that a number of biologically related and mitochondria-dependent processes are affected in schizophrenia. Specifically, we found that gene groups related to energy shuttles and oxidative metabolism, as well as certain amino acid metabolic pathways, exhibit reduced expression. Previous studies, using protein, enzyme activity, and transcript level analyses, have demonstrated abnormalities in many of these same gene groups and some of the same genes in subjects with schizophrenia (see below).
Malate shuttle and transcarboxylic acid metabolism
In a study published over 35 years ago, serum malate dehydrogenase activity was reported to be significantly diminished (∼25%) in 50 subjects with schizophrenia compared with 10 controls (Burlina and Visentin, 1965). These findings are consistent with our data on the decreased expression of MAD1 in schizophrenia. The potential biological consequences of a decrease in malate dehydrogenase activity, and a general decrease in the activity of the malate shuttle, are quite significant. First, one of the most important functions of the malate shuttle is to transfer hydrogen ions [in the form of reduced nicotinamide adenine dinucleotide (NADH)] from the cytoplasm into the mitochondria. Therefore, schizophrenia may be associated with increased [H+]-reducing equivalents in the cytosol. Increases in cytosolic [H+] are known to decrease the activity of the major rate-limiting enzyme of glycolysis, 6-phosphofructokinase (Mathews and van Holde, 1990). Thus, decreased malate shuttle activity in the PFC of subjects with schizophrenia could produce secondary effects on the rate of glycolysis, perhaps contributing to the reduced glucose use observed in the PFC of these subjects while they are engaged in cognitive tasks (Berman et al., 1986; Weinberger et al., 1986; Andreasen et al., 1992; Buchsbaum et al., 1992).
Second, the malate shuttle system also acts in concert with a malate–citrate exchange system that is part of the TCA cycle and serves as an entry point for fatty acid synthesis. In fact, the malate shuttle system and the TCA system both contain the gene for MAD1. If the malate shuttle activity is reduced and the activity of the malate–citrate exchange system is reduced as well, one might expect to find a loss in cytosolic citrate and decreased activity of other TCA proteins. In our data, we found a reduction in the expression of at least three other TCA genes in subjects with schizophrenia: isocitrate dehydrogenase 3 (average Z of 1.79; Z load of 5.37), ATP citrate lyase (average Z of 1.39;Z load of 4.18), and dihydrolipoamide dehydrogenase (averageZ of 1.18; Z load of 3.53). Together, these findings suggest that TCA metabolism is significantly affected in schizophrenia. Given the role that TCA metabolism plays in fatty acid synthesis, these findings may help explain the reductions in markers of fatty acid metabolism that have been reported in several studies of subjects with schizophrenia (Pettegrew et al., 1991; Fenton et al., 2000; Keshavan et al., 2000; Stanley et al., 2000; Yao et al., 2000;Assies et al., 2001).
Finally, decreased malate shuttle activity could directly alter cytosolic levels of aspartate and glutamate, given the role that the malate shuttle plays in the exchange of cytosolic malate for mitochondrial α-ketoglutarate and then (after transamination of α-ketoglutarate into glutamate) the exchange of cytosolic glutamate for mictochondrial aspartate. Alterations in cytosolic aspartate and glutamate levels could affect not only the metabolism of these molecules (see below) but also ornithine–polyamine metabolism (see below).
Aspartate–alanine metabolism
In addition to the connection, through substrate levels, between the malate shuttle system and aspartate metabolism described above, these groups also share two genes, GOT1 and GOT2. Both of these genes exhibited reduced expression in subjects with schizophrenia (GOT2 average Z of 1.39, Z load of 8.33; GOT1 averageZ of 0.95, Z load of 1.9), with the changes in GOT2 ranking among the most consistent metabolic gene findings (Table2). Other genes in the aspartate–alanine metabolism group also showed consistent and occasionally significant decreases in expression, including asparaginyl-tRNA synthetase (average Z of 1.11;Z load of 3.33) and asparagine synthetase (averageZ of 1.18; Z load of 1.18). The broad effect on this metabolic gene group may help explain the findings of reduced levels of N-acetyl-l-aspartate, an important intermediary molecule of aspartate metabolism, in subjects with schizophrenia (Deicken et al., 1997; Bertolino et al., 2000; Auer et al., 2001).
Ornithine–polyamine metabolism
We found decreased expression of several genes involved in ornithine–polyamine metabolism in subjects with schizophrenia. These expression deficits are consistent with a number of previous studies demonstrating alterations in this system in schizophrenia, particularly in peripheral tissues (Flayeh, 1988;Svinarev, 1987; Ramchand et al., 1994; Berstein and Muller, 1999) (but see Gilad et al., 1995). Our ranking of the changes in expression of genes related to metabolism (Table 2) revealed that three of the genes involved in ornithine–polyamine metabolism were among the most consistently reduced in schizophrenia. Specifically, the transcripts encoding OAZIN, μ-crystallin, and OAT were de-creased in the majority of subjects with schizoprhenia (averageZ scores of 2.49, 2.22, and 3.13, respectively; Z load scores of 17.43, 15.53, and 12.53, respectively). Our in situ hybridization data confirmed the decrease in expression of both OAZIN and OAT, which participate in the regulation of polyamine production. The precise role of μ-crystallin has not been studied in the brain, but this protein is a mammalian homolog of ornithine cyclodeaminase (OCD; EC 4.3.1.12). OCD is present in the retina and other neural tissues and catalyzes the conversion ofl-ornithine to l-proline (Kim et al., 1992). In contrast to OCD–μ-crystallin, the roles of OAZIN and OAT have been well documented in the brain. The ornithine decarboxylase (ODC) antizyme is the key regulator of ODC enzyme activity in the brain and hence a major inhibitor of polyamine production. The antizyme inhibitor (OAZIN) normally boosts polyamine production by decreasing the ability of the antizyme to inhibit ODC activity. There are reports of increased levels of polyamines in the blood and peripheral tissues of schizophrenic subjects, as well as increased levels of ODC expression in the rodent neonatal ventral hippocampal lesion model of schizophrenia (Bernstein et al., 1998) (but see Lipska et al., 1993). Although this is a complex enzyme system, with multiple positive and negative feedback components, it is possible that the decreases in OAZIN and OAT transcript expression we observed in subjects with schizophrenia reflect compensatory mechanisms to reduce elevated polyamine levels or simply an attempt by neurons in the dorsal PFC to downregulate the entire ornithine–polyamine system. Interestingly, not only does ornithine–polyamine metabolism affect glutamate and aspartate metabolism, but the products of this metabolic pathway (polyamines) can serve directly as potent NMDA receptor antagonists (Williams et al., 1991; Kashiwagi et al., 1997) (for review, see Williams, 1997). Thus, decreased levels of glutamate and aspartate, accompanied by decreases in ODC activity and polyamine production, may be characteristic of the metabolic state of the brain in schizophrenia and additional evidence of convergent changes in metabolic and synaptic-related transcripts.
Ubiquitin metabolism
Decreased expression of at least two genes involved in ubiquitin metabolism (ubiquitin specific protease 9 and ubiquitin C-terminal esterase L1) was reported recently in another microarray study of PFC gene expression in schizophrenia (Vawter et al., 2001). Our ranking of the most changed metabolic genes (Table 2) includes one of these genes (ubiquitin C-terminal esterase L1; average Z of 1.71;Z load of 6.82), as well as ubiquitin-specific protease 14 (average Z of 1.87; Z load of 9.33). Thus, at least some of the expression deficits we observed in our patient sample were present in a separate cohort of schizophrenic subjects studied in a different laboratory with another microarray platform. In addition, our analysis extends and integrates these observations on the ubiquitin cascade into a set of highly correlated metabolic group effects that occur in the same subjects. Our factor analysis demonstrated that the effect on ubiquitin metabolism was highly correlated with the effects on the malate shuttle and TCA metabolism gene groups. Because the ubiquitin pathway marks proteins for degradation and plays an important role in the regulation of synaptic formation and activity (Hegde et al., 1997; DiAntonio et al., 2001), this molecular insult could reflect yet another point of convergence for altered neural communication in schizophrenia.
Relevance to synaptic function
In a previous study, we found that reduced expression of transcripts encoding synaptic proteins was a common feature of subjects with schizophrenia (Mirnics et al., 2000, 2001a,b). Interestingly, the vast majority of measurable metabolic flux in the brain occurs at synapses (Sokoloff, 1977; Nudo and Masterton, 1986). Indeed, many of the processes that are essential to synaptic vesicle docking and release are energy dependent and require high levels of ATP production. In our previous study, two of the most consistently affected genes within the presynaptic group (N-etylmalemide-sensitive factor and vacuolar ATPase) were ATPases that use the energy provided by synaptically localized mitochondria to help maintain a readily releasable pool of synaptic vesicles. Together with our present results, these findings indicate that neurons within the PFC of schizophrenic subjects will likely have difficulty meeting the normal metabolic demands placed on them by neural activity.
Effects of antipsychotic medication on metabolic gene expression
One of the unexpected findings in our analysis was the significant increase in expression of MAD1 in the PFC of monkeys in response to chronic haloperidol treatment. This finding indicates that the decreased expression of the MAD1 transcript in subjects with schizophrenia is not attributable to drug treatment. However, the data raise the possibility that antipsychotic treatment in these subjects targets MAD1, either directly or indirectly, and thus could compensate for the normally deficient expression in schizophrenia. Previous studies have shown that haloperidol administration produces increases in certain metabolic enzymes and upregulates neural activity in some brain regions (Prince et al., 1997a,b). Thus, the selective targeting of malate shuttle or TCA cycle proteins and genes may provide a means for therapeutic manipulation of these metabolic processes in the PFC of subjects with schizophrenia.
Conclusion
In summary, we showed that subjects with schizophrenia exhibit a common set of metabolic transcriptional abnormalities. These abnormalities involve decreases in a small number of biologically related cascades involved in energy shuttles and amino acid metabolism, fatty acid synthesis, neurotransmitter metabolism, and glycolysis. We suggest that the effects on the malate shuttle system may serve as a primary site of dysfunction or keystone effect, which, together with the other molecular alterations, disrupts neuronal communication of specific brain circuits. At least one of the malate shuttle genes exhibits increased expression in response to antipsychotic medication, raising the possibility that this treatment may help normalize brain metabolism through actions on this system.
Footnotes
This work was supported by a Young Investigator Award from the National Alliance for Research on Schizophrenia and Depression (F.A.M.), Projects 1 (D.A.L.) and 2 (P.L., K.M.) of National Institute of Mental Health Grant MH45156 (D.A.L.), and an endowment from the Richard King Mellon Foundation (P.L.). We thank Dr. Takanori Hashimoto, Dianne Cruz, and Lansha Peng for technical assistance and Dr. Gregg Stanwood for helpful comments and discussion.
Correspondence should be addressed to Pat Levitt, Department of Neurobiology, E1440 Biomedical Science Tower, University of Pittsburgh School of Medicine, 3500 Terrace Street, Pittsburgh, PA 15261. E-mail: plevitt+@pitt.edu.
REFERENCES
- 1.Alberts B, Bray D, Lewis J, Raff M, Roberts K, Watson JD. Molecular biology of the cell, Ed 2. Garland; New York: 1989. [Google Scholar]
- 2.Andreasen NC, Rezai K, Alliger R, Swayze VW, II, Flaum M, Kirchner P, Cohen G, O'Leary DS. Hypofrontality in neuroleptic-naive patients and in patients with chronic schizophrenia: assessment with xenon 133 single photon emission computed tomography and the Tower of London. Arch Gen Psychiatry. 1992;49:943–958. doi: 10.1001/archpsyc.1992.01820120031006. [DOI] [PubMed] [Google Scholar]
- 3.Assies J, Lieverse R, Vreken P, Wanders RJ, Dingemans PM, Linszen DH. Significantly reduced docosahexaenoic and docosapentaenoic acid concentrations in erythrocyte membranes from schizophrenic patients compared with a carefully matched control group. Biol Psychiatry. 2001;49:510–522. doi: 10.1016/s0006-3223(00)00986-0. [DOI] [PubMed] [Google Scholar]
- 4.Auer DP, Wilke M, Grabner A, Heidenreich JO, Bronisch T, Wetter TC. Reduced NAA in the thalamus, altered membrane, glial metabolism in schizophrenic patients detected by 1H-MRS, tissue segmentation. Schizophr Res. 2001;52:87–99. doi: 10.1016/s0920-9964(01)00155-4. [DOI] [PubMed] [Google Scholar]
- 5.Berman KF, Zec RF, Weinberger DR. Physiological dysfunction of dorsolateral prefrontal cortex in schizophrenia. II. Role of neuroleptic treatment, attention and mental effort. Arch Gen Psychiatry. 1986;43:126–135. doi: 10.1001/archpsyc.1986.01800020032005. [DOI] [PubMed] [Google Scholar]
- 6.Berman KF, Torrey F, Daniel DG, Weinberger DR. Regional cerebral blood flow in monozygotic twins discordant and concordant for schizophrenia. Arch Gen Psychiatry. 1992;49:927–934. doi: 10.1001/archpsyc.1992.01820120015004. [DOI] [PubMed] [Google Scholar]
- 7.Bernstein HG, Grecksch G, Becker A, Hollt V, Bogerts B. Cellular changes in rat brain areas associated with neonatal hippocampal damage. NeuroReport. 1999;10:2307–2311. doi: 10.1097/00001756-199908020-00016. [DOI] [PubMed] [Google Scholar]
- 8.Bernstein HG, Muller M. The cellular localization of the l-ornithine decarboxylase/polyamine system in normal and diseased central nervous systems. Prog Neurobiol. 1999;57:485–505. doi: 10.1016/s0301-0082(98)00065-3. [DOI] [PubMed] [Google Scholar]
- 9.Bertolino A, Callicott JH, Elman I, Mattay VS, Tedeschi G, Frank JA, Breier A, Weinberger DR. Regionally specific neuronal pathology in untreated patients with schizophrenia: a proton magnetic resonance spectroscopic imaging study. Biol Psychiatry. 1998;43:641–648. doi: 10.1016/s0006-3223(97)00555-6. [DOI] [PubMed] [Google Scholar]
- 10.Bertolino A, Esposito G, Callicott JH, Mattay VS, Van Horn JD, Frank JA, Berman KF, Weinberger DR. Specific relationship between prefrontal neuronal N-acetylaspartate and activation of the working memory cortical network in schizophrenia. Am J Psychiatry. 2000;157:26–33. doi: 10.1176/ajp.157.1.26. [DOI] [PubMed] [Google Scholar]
- 11.Buchsbaum MS, Haier RJ, Potkin SG, Nuechterlein K, Bracha HS, Katz M, Lohr J, Wu J, Lottenberg S, Jerabek PA, Trenary M, Tafalla R, Reynolds C, Bunney W. Frontrostriatal disorder of cerebral metabolism in never-medicated schizophrenics. Arch Gen Psychiatry. 1992;49:935–942. doi: 10.1001/archpsyc.1992.01820120023005. [DOI] [PubMed] [Google Scholar]
- 12.Burlina A, Visentin B. Ricerche di enzimopatologia negli stati schizofrenici. I. La malico-deidrogenasi del siero. Riv Anat Patol Oncol. 1965;27:380–386. [PubMed] [Google Scholar]
- 13.Callicott JH, Ramsey NF, Tallent K, Bertolino A, Knable MB, Coppola R, Goldberg T, van Gelderen P, Mattay VS, Frank JA, Moonen CT, Weinberger DR. Functional magnetic resonance imaging brain mapping in psychiatry: methodological issues illustrated in a study of working memory in schizophrenia. Neuropsychopharmacology. 1998;18:186–196. doi: 10.1016/S0893-133X(97)00096-1. [DOI] [PubMed] [Google Scholar]
- 14.Campbell DB, North JB, Hess E. Tottering mouse motor dysfunction is abolished on the Purkinje cell degeneration (pcd) mutant background. Exp Neurol. 1999;160:268–278. doi: 10.1006/exnr.1999.7171. [DOI] [PubMed] [Google Scholar]
- 15.Cecil KM, Lenkinski RE, Gur RE, Gur RC. Proton magnetic resonance spectroscopy in the frontal and temporal lobes of neuroleptic naive patients with schizophrenia. Neuropsychopharmacology. 1999;20:131–140. doi: 10.1016/S0893-133X(98)00063-3. [DOI] [PubMed] [Google Scholar]
- 16.Darnell J, Lodish H, Baltimore D. Molecular cell biology, Ed 2. Scientific American Books; Oxford: 1990. [Google Scholar]
- 17.Deicken RF, Zhou L, Corwin F, Vinogradov S, Weiner MW. Decreased left frontal lobe N-acetylaspartate in schizophrenia. Am J Psychiatry. 1997;154:688–690. doi: 10.1176/ajp.154.5.688. [DOI] [PubMed] [Google Scholar]
- 18.DiAntonio A, Haghighi AP, Portman SL, Lee JD, Amaranto AM, Goodman CS. Ubiquitination-dependent mechanisms regulate synaptic growth and function. Nature. 2001;412:449–452. doi: 10.1038/35086595. [DOI] [PubMed] [Google Scholar]
- 19.Fenton WS, Hibbeln J, Knable M. Essential fatty acids, lipid membrane abnormalities, and the diagnosis and treatment of schizophrenia. Biol Psychiatry. 2000;47:8–21. doi: 10.1016/s0006-3223(99)00092-x. [DOI] [PubMed] [Google Scholar]
- 20.Flayeh KA. Permidine oxidase activity in serum of normal and schizophrenic subjects. Clin Chem. 1988;34:401–403. [PubMed] [Google Scholar]
- 21.Gilad GM, Gilad VH, Casanova MF, Casero RA. Polyamines and their metabolizing enzymes in human frontal cortex and hippocampus: preliminary measurements in affective disorders. Biol Psychiatry. 1995;38:227–234. doi: 10.1016/0006-3223(94)00256-3. [DOI] [PubMed] [Google Scholar]
- 22.Glantz LA, Lewis DA. Reduction of synaptophysin immunoreactivity in the prefrontal cortex of subjects with schizophrenia. Arch Gen Psychiatry. 1997;54:943–952. doi: 10.1001/archpsyc.1997.01830220065010. [DOI] [PubMed] [Google Scholar]
- 23.Glantz LA, Lewis DA. Decreased dendritic spine density of prefrontal cortical pyramidal neurons in schizophrenia. Arch Gen Psychiatry. 2000;57:65–73. doi: 10.1001/archpsyc.57.1.65. [DOI] [PubMed] [Google Scholar]
- 24.Goldman-Rakic PS. Prefrontal cortical dysfunction in schizophrenia: the relevance of working memory. In: Carroll BJ, Barrett JE, editors. Psychopathology and the brain. Raven; New York: 1991. pp. 1–23. [Google Scholar]
- 25.Harrison PJ. The neuropathology of schizophrenia. A critical review of the data and their interpretation. Brain. 1999;122:593–624. doi: 10.1093/brain/122.4.593. [DOI] [PubMed] [Google Scholar]
- 26.Hegde AN, Inokuchi K, Pei W, Casadio A, Ghirardi M, Chain DG, Martin KC, Kandel ER, Schwartz JH. Ubiquitin C-terminal hydrolase is an immediate-early gene essential for long-term facilitation in Aplysia. Cell. 1997;89:115–126. doi: 10.1016/s0092-8674(00)80188-9. [DOI] [PubMed] [Google Scholar]
- 27.Karson CN, Mrak RE, Schluterman KO, Sturner WQ, Sheng JG, Griffin WS. Alterations in synaptic proteins and their encoding mRNAs in prefrontal cortex in schizophrenia: a possible neurochemical basis for “hypofrontality.”. Mol Psychiatry. 1999;4:39–45. doi: 10.1038/sj.mp.4000459. [DOI] [PubMed] [Google Scholar]
- 28.Kashiwagi K, Pahk AJ, Masuko T, Igarashi K, Williams K. Block and modulation of N-methyl-d-aspartate receptors by polyamines and protons: role of amino acid residues in the transmembrane and pore-forming regions of NR1 and NR2 subunits. Mol Pharmacol. 1997;52:701–713. doi: 10.1124/mol.52.4.701. [DOI] [PubMed] [Google Scholar]
- 29.Kauppinen RA, Alhonen LI. Transgenic animals as models in the study of the neurobiological role of polyamines. Prog Neurobiol. 1995;47:545–563. doi: 10.1016/0301-0082(95)00037-2. [DOI] [PubMed] [Google Scholar]
- 30.Keshavan MS, Stanley JA, Pettegrew JW. Magnetic resonance spectroscopy in schizophrenia: methodological issues and findings—part II. Biol Psychiatry. 2000;48:369–380. doi: 10.1016/s0006-3223(00)00940-9. [DOI] [PubMed] [Google Scholar]
- 31.Kim RY, Gasser R, Wistow GJ. mu-Crystallin is a mammalian homologue of Agrobacterium ornithine cyclodeaminase and is expressed in human retina. Proc Natl Acad Sci USA. 1992;89:9292–9296. doi: 10.1073/pnas.89.19.9292. [DOI] [PMC free article] [PubMed] [Google Scholar]
- 32.Lipska BK, Jaskiw GE, Weinberger DR. Postpubertal emergence of hyperresponsiveness to stress and to amphetamine after neonatal excitotoxic hippocampal damage: a potential animal model of schizophrenia. Neuropsychopharmacology. 1993;9:67–75. doi: 10.1038/npp.1993.44. [DOI] [PubMed] [Google Scholar]
- 33.Marchbanks RM, Mulcrone J, Whatley SA. Aspects of oxidative metabolism in schizophrenia. Br J Psychiatry. 1995;167:293–298. doi: 10.1192/bjp.167.3.293. [DOI] [PubMed] [Google Scholar]
- 34.Mathews CK, van Holde KE. Biochemistry. Cummings; Raven City, CA: 1989. [Google Scholar]
- 35.Maurer I, Zierz S, Moller H. Evidence for a mitochondrial oxidative phosphorylation defect in brains from patients with schizophrenia. Schizophr Res. 2001;48:125–136. doi: 10.1016/s0920-9964(00)00075-x. [DOI] [PubMed] [Google Scholar]
- 36.Mirnics K, Middleton FA, Marquez AM, Lewis DA, Levitt P. Molecular characterization of schizophrenia revealed by microarray analysis of gene expression in prefrontal cortex. Neuron. 2000;28:53–67. doi: 10.1016/s0896-6273(00)00085-4. [DOI] [PubMed] [Google Scholar]
- 37.Mirnics K, Middleton FA, Stanwood GD, Lewis DA, Levitt P. Disease-specific changes in regulator of G-protein signaling 4 (RGS4) expression in schizophrenia. Mol Psychiatry. 2001a;6:293–301. doi: 10.1038/sj.mp.4000866. [DOI] [PubMed] [Google Scholar]
- 38.Mirnics K, Middleton FA, Lewis DA, Levitt P. Analysis of complex brain disorders with gene expression microarrays: schizophrenia as a disease of the synapse. Trends Neurosci. 2001b;24:479–486. doi: 10.1016/s0166-2236(00)01862-2. [DOI] [PubMed] [Google Scholar]
- 39.Mulcrone J, Whatley SA, Ferrier IN, Marchbanks RM. A study of altered gene expression in frontal cortex from schizophrenic patients using differential screening. Schizophr Res. 1995;14:203–213. doi: 10.1016/0920-9964(94)00040-f. [DOI] [PubMed] [Google Scholar]
- 40.Nudo RJ, Masterton RB. Stimulation-induced [14C]2-deoxyglucose labeling of synaptic activity in the central auditory system. J Comp Neurol. 1986;245:553–565. doi: 10.1002/cne.902450410. [DOI] [PubMed] [Google Scholar]
- 41.Park S, Holzman PS. Schizophrenics show spatial working memory deficits. Arch Gen Psychiatry. 1992;49:975–982. doi: 10.1001/archpsyc.1992.01820120063009. [DOI] [PubMed] [Google Scholar]
- 42.Perrone-Bizzozero N, Sower A, Bird E, Benowitz L, Ivins K, Neve R. Levels of the growth-associated protein GAP-43 are selectively increased in association cortices in schizophrenia. Proc Natl Acad Sci USA. 1996;93:14182–14187. doi: 10.1073/pnas.93.24.14182. [DOI] [PMC free article] [PubMed] [Google Scholar]
- 43.Pettegrew JW, Keshavan MS, Panchalingam K, Strychor S, Kaplan DB, Tretta MG, Allen M. Alterations in brain high-energy phosphate and membrane phospholipid metabolism in first-episode, drug-naive schizophrenics. A pilot study of the dorsal prefrontal cortex by in vivo phosphorus 31 nuclear magnetic resonance spectroscopy. Arch Gen Psychiatry. 1991;48:563–568. doi: 10.1001/archpsyc.1991.01810300075011. [DOI] [PubMed] [Google Scholar]
- 44.Pierri JN, Chaudry BS, Woo TUW, Lewis DA. Alterations in chandelier neuron axon terminals in the prefrontal cortex of schizophrenic subjects. Am J Psychiatry. 1999;156:1709–1719. doi: 10.1176/ajp.156.11.1709. [DOI] [PubMed] [Google Scholar]
- 45.Prince JA, Blennow K, Gottfries CG, Karlsson I, Oreland L. Mitochondrial function is differentially altered in the basal ganglia of chronic schizophrenics. Neuropsychopharmacology. 1999;21:372–379. doi: 10.1016/S0893-133X(99)00016-0. [DOI] [PubMed] [Google Scholar]
- 46.Prince JA, Yassin MS, Oreland L. Neuroleptic-induced mitochondrial enzyme alterations in the rat brain. J Pharmacol Exp Ther. 1997a;280:261–267. [PubMed] [Google Scholar]
- 47.Prince JA, Yassin MS, Oreland L. Normalization of cytochrome-c oxidase activity in the rat brain by neuroleptics after chronic treatment with PCP or methamphetamine. Neuropharmacology. 1997b;36:1665–1678. doi: 10.1016/s0028-3908(97)00152-4. [DOI] [PubMed] [Google Scholar]
- 48.Ramchand CN, Das I, Gliddon A, Hirsch SR. Role of polyamines in the membrane pathology of schizophrenia. A study using fibroblasts from schizophrenic patients and normal controls. Schizophr Res. 1994;13:227–234. doi: 10.1016/0920-9964(94)90049-3. [DOI] [PubMed] [Google Scholar]
- 49.Selemon LD, Goldman-Rakic PS. The reduced neuropil hypothesis: a circuit based model of schizophrenia. Biol Psychiatry. 1999;45:17–25. doi: 10.1016/s0006-3223(98)00281-9. [DOI] [PubMed] [Google Scholar]
- 50.Siegel G, Agranoff B, Albers RW, Molinoff P. Basic neurochemistry, Ed 4. Raven; New York: 1989. [Google Scholar]
- 51.Sokoloff L. Relation between physiological function and energy metabolism in the central nervous system. J Neurochem. 1977;29:13–26. doi: 10.1111/j.1471-4159.1977.tb03919.x. [DOI] [PubMed] [Google Scholar]
- 52.Stanley JA, Pettegrew JW, Keshavan MS. Magnetic resonance spectroscopy in schizophrenia: methodological issues and findings—part I. Biol Psychiatry. 2000;48:357–368. doi: 10.1016/s0006-3223(00)00949-5. [DOI] [PubMed] [Google Scholar]
- 53.Svinarev VI. Serum spermidine levels of schizophrenic patients. Zh Nevropatol Psikhiatr. 1987;87:732–734. [PubMed] [Google Scholar]
- 54.Thaker GK, Carpenter WT. Advances in schizophrenia. Nat Med. 2001;7:667–671. doi: 10.1038/89040. [DOI] [PubMed] [Google Scholar]
- 55.Vawter MP, Barrett T, Cheadle C, Sokolov BP, Wood WH, III, Donovan DM, Webster M, Freed WJ, Becker KG. Application of cDNA microarrays to examine gene expression differences in schizophrenia. Brain Res Bull. 2001;55:641–650. doi: 10.1016/s0361-9230(01)00522-6. [DOI] [PubMed] [Google Scholar]
- 56.Volk DV, Austin MC, Pierri JN, Sampson RA, Lewis DA. Decreased GAD67 mRNA expression in a subset of prefrontal cortical GABA neurons in schizophrenia. Arch Gen Psychiatry. 2000;57:237–245. doi: 10.1001/archpsyc.57.3.237. [DOI] [PubMed] [Google Scholar]
- 57.Weinberger DR, Berman KF, Zec RF. Physiological dysfunction of dorsolateral prefrontal cortex in schizophrenia. I. Regional cerebral blood flow evidence. Arch Gen Psychiatry. 1986;43:114–124. doi: 10.1001/archpsyc.1986.01800020020004. [DOI] [PubMed] [Google Scholar]
- 58.Whatley SA, Curti D, Marchbanks RM. Mitochondrial involvement in schizophrenia and other functional psychoses. Neurochem Res. 1996;21:995–1004. doi: 10.1007/BF02532409. [DOI] [PubMed] [Google Scholar]
- 59.Williams K. Modulation and block of ion channels: a new biology of polyamines. Cell Signal. 1997;9:1–13. doi: 10.1016/s0898-6568(96)00089-7. [DOI] [PubMed] [Google Scholar]
- 60.Williams K, Romano C, Dichter MA, Molinoff PB. Modulation of the NMDA receptor by polyamines. Life Sci. 1991;48:469–498. doi: 10.1016/0024-3205(91)90463-l. [DOI] [PubMed] [Google Scholar]
- 61.Yao JK, Leonard S, Reddy RD. Membrane phospholipid abnormalities in postmortem brains from schizophrenic patients. Schizophr Res. 2000;42:7–17. doi: 10.1016/s0920-9964(99)00095-x. [DOI] [PubMed] [Google Scholar]