

Abstract
The initial establishment of topographic mapping within developing neural circuits is thought to be shaped by innate mechanisms and is primarily independent of experience. Additional refinement within topographic maps leads to precise matching between presynaptic and postsynaptic neurons and is thought to depend on experiential factors during specific sensitive periods in the animal's development. In male zebra finches, axonal projections of the cortical lateral magnocellular nucleus of the anterior neostriatum (lMAN) are critically important for vocal learning. Overall patterns of topographic organization in the majority of these circuits are adult-like throughout the sensitive period for vocal learning and remain stable despite large-scale functional and morphological changes. However, topographic organization within the projection from the core subregion of lMAN (lMANcore) to the motor cortical robust nucleus of the archistriatum (RA) is lacking at the onset of song development and emerges during the early stages of vocal learning. To study the effects of song-related experience on patterns of axonal connectivity within different song-control circuits, we disrupted song learning by deafening juvenile zebra finches or exposing them to loud white noise throughout the sensitive period for song learning. Depriving juvenile birds of normal auditory experience delayed the emergence of topographic specificity within the lMANcore→RA circuit relative to age-matched controls, whereas topographic organization within all other projections to and from lMAN was not affected. The projection from lMANcore to RA therefore provides an unusual example of experience-dependent modification of large-scale patterns of brain circuitry, in the sense that auditory deprivation influences the development of overall topographic organization in this pathway.
Keywords: topographic organization, sensory experience, sensitive periods, zebra finch, songbird, vocal learning.
An animal's interactions with its external world during sensitive periods of development have a profound and lasting influence on its behavioral capacities. For example, songbirds learn their species-typical vocal pattern after hearing it during a restricted period of development. Although the role of sensory experience in complex behavioral and perceptual functions is well established, the mechanisms whereby experiences shape neural circuits are not well understood. The development of highly precise topographic circuits has generally been thought to involve two broad classes of mechanisms: an activity-independent phase in which the expression of various molecules guides the initial patterning of developing axonal connections, followed by an activity-dependent phase in which experientially driven patterns of synaptic activity act to refine topographic maps (Cline, 1991; Goodman and Shatz, 1993; Roskies et al., 1995; Tessier-Lavigne and Goodman, 1996). The initial level of precision in the projections of presynaptic neurons onto their postsynaptic targets during development, before any contribution from sensory experience, is usually extremely high (Catalano et al., 1991;Agmon et al., 1993, 1995; Crair et al., 1998; Crowley and Katz, 2000; but see Simon and O'Leary, 1992), and abnormal experience seems to have little or no influence on the development of nascent topographic order (O'Leary and Cowan, 1983; Udin, 1985; Weliky and Katz, 1997; Crair et al., 1998; Crowley and Katz, 1999). This pattern of results indicates that the initial specificity of neural circuitry relies primarily on innate mechanisms, and that such mechanisms are able to confer a remarkable degree of precision. In fact, although the exact level of refinement induced by experiential activity is generally not known, it is clear that experience may account for a rather small increment in the grain of any particular neural map (Crair et al., 1998). Of course, it should be stressed that even if only the final 5–10% refinement of a neural circuit were attributable to experientially induced activity, it could nevertheless be true that complex behavioral capabilities may rely primarily on such final levels of refinement.
Tract-tracing studies have shown that a subset of the neural circuits underlying song learning in zebra finches are topographically organized (Johnson et al., 1995; Nixdorf-Bergweiler et al., 1995; Vates and Nottebohm, 1995; Iyengar et al., 1999; Bottjer et al., 2000). That is, broad patterns of axonal connectivity between subregions of vocal-control nuclei are systematically organized in adult birds. We have reported previously that topographic patterns of connectivity in most vocal-control circuits are similar in juvenile male zebra finches during the sensitive period for song learning and in adult birds that have finished learning to produce a stereotyped song pattern. However, one vocal-control pathway provides a salient exception to the general rule that initial circuits have a high degree of precision: the axonal projection from the cortical lateral magnocellular nucleus of the anterior neostriatum (lMAN)core to the motor-cortical robust nucleus of the archistriatum (RA) lacks the level of topographic specificity seen in other song-control projections during early vocal development (Iyengar et al., 1999; cf.Simon and O'Leary, 1990). The refinement of this projection to match the topographic organization seen in adult birds occurs during early stages of vocal learning (20–35 d), when birds are learning about the auditory and motor characteristics of their vocalizations and the lMANcore→RA projection is necessary for the production of normal “subsong” behavior (Iyengar et al., 1999; cf.Marler, 1991; Margoliash, 1997; Nordeen and Nordeen, 1997). The purpose of the present study was to begin to assess the role of experience in topographic mapping of axonal connections to and from lMAN. We found that depriving juvenile birds of normal auditory experience did not influence the maintenance of topographic organization in those song-control circuits that already matched the adult pattern, as has been found in other systems. However, disrupting normal auditory experience did delay the emergence of topographic specificity within the lMANcore→RA projection. This result provides a rare example in which abnormal experience influences the development of initial, large-scale topographic organization in a developing neural circuit.
MATERIALS AND METHODS
All birds used in this study were bred in our aviaries. The surgical procedures used were in accordance with National Institutes of Health guidelines and the Animal Care and Use Committee at the University of Southern California.
Deafening. Juvenile male zebra finches (n = 10 at 12 d after hatching; n = 6 at 20 d after hatching) were anesthetized with 0.04–0.06 ml of the barbiturate anesthetic Equithesin. An incision was made in the skin over each ear and the tympanic membrane covering the middle ear cavity was exposed. The tympanic membrane as well as the columella overlying the oval window were removed, and a pair of fine forceps was used to remove the cochlea. Small plugs of sterile Gelfoam were placed into the inner ear cavity and the incision was closed with Collodion. Birds were returned to their parents in group breeding aviaries after they recovered from surgery. Of the 10 birds deafened at 12 d after hatching, 4 were allowed to survive until 35 d of age. The remaining 12 deafened (DF) birds were removed from the breeding aviaries and placed in separate cages in auditory and visual contact with other adult zebra finches when they were ∼40 d of age and allowed to survive until adulthood.
White noise exposure. Previous work has shown that exposure to white noise (WN) at high sound pressure levels (SPLs) (112–120 dB) causes little or no damage to hair cells in zebra finches (Ryals et al., 1999). Preliminary results from our lab have shown that white noise played continuously for long periods of time (3 months) at ∼100–115 dB disrupts normal song behavior in adult zebra finches without damaging hair cells (Zevin et al., 2000). Therefore, we decided to test the effects of chronic exposure to white noise on the topographic organization of circuits to and from lMAN as a means of disrupting normal auditory experience without directly damaging auditory pathways (cf. Marler et al., 1973; Marler and Waser, 1977). Eleven clutches of juvenile birds (12–22 d of age, including both males and females) were housed with their parents in individual cages placed in sound-attenuating chambers fitted with speakers. To mask normal auditory input to these birds, a Quan-Tech 420 noise generator (Tucker Electronics, Garland, TX) was used to produce white noise that was amplified to either 100 or 116 dB through a NAD 902 multichannel power amplifier and played continuously. One group of juvenile male birds (n = 9 at 100 dB; n = 3 at 116 dB) was raised in white noise from 15 d until 35 d after hatching, and a second group of juvenile male birds (n= 5 at 100 dB; n = 3 at 116 dB) was continuously exposed to white noise from 15 d until they reached adulthood (>90 d of age). Parents and female siblings of the second group of birds were removed from the white-noise boxes when the juvenile male birds were 50 d of age.
Noise levels within the white-noise chambers were monitored daily with a sound-level meter (Realistic; Radio Shack, Forth Worth, TX) to ensure that they did not fluctuate more than ±3 dB. Speakers were mounted on the upper part of one side of each chamber, just above the level of the cages in which birds were housed. Sound levels were measured just opposite the speakers, and also at the center and the base of the cages, where birds spent the majority of their time. When white noise at a 100 dB SPL was played through the speaker, SPLs of 94 dB and 88 dB were recorded at the center and at the base of the chamber, respectively. Increasing the SPL of the white noise to 116 dB at the speakers gave rise to SPLs of 100 dB at the center and 97 dB at the base of the boxes, respectively.
Song recordings. The songs of birds from both experimental groups that survived until adulthood were recorded when birds were >90 d of age (n = 12 DF; n = 8 WN). The songs of six control adult birds that had experienced normal patterns of auditory input throughout the period of song learning were recorded, as were the songs of the fathers of all WN birds before white noise exposure. We attempted to record the songs of all 35 d birds (control, DF, and WN), but most birds did not sing during the time we attempted to record their behavior (i.e., we were unsuccessful in most cases). Furthermore, the temporal order and structure of syllables in the vocalizations of normal 35 d birds are highly variable, making it difficult to compare them with the songs of experimental 35 d birds. Therefore, we did not attempt to analyze the songs of 35 d DF and WN birds. Songs of adult birds were recorded using a TEAC X-300 tape recorder (TEAC, Montebello, CA) and analyzed using a Kay Elemetrics DS 5500 Sona-Graph (Pinebrook, NJ), or were recorded digitally using a voice-activated system with an eight channel ARC88 sound card (SEK'D, Bretzfeld-Schwabbach, Germany) and software from Avisoft (SASlab, Berlin, Germany). To ensure that WN birds did not have access to a song model, they were placed in the recording room individually and their songs were recorded for a period of 3–4 hr every day until they sang for a total of at least 10 min over the course of a week. At the end of each recording session, they were returned to the white-noise boxes. A total of 10–15 song bouts from each bird were selected randomly and printed as plots of frequency over time (sonograms); these plots were used to analyze the sequence of syllables and syllable morphology (see below). Songs of birds that were recorded on tape were later transcribed into digital files for additional analysis using Avisoft.
Song analysis. Zebra finch song is produced as discrete syllables, which appear as continuous tracings on sonograms and are separated from other syllables by 5–10 msec gaps of silence (Zann, 1996). A group of distinct syllables sung in a highly stereotyped order by an adult male zebra finch constitutes a song phrase or motif. Song phrases may be repeated several times, which constitutes a bout (Price, 1979; Sossinka and Böhner, 1980; Cynx, 1990). Song bouts are initiated by a variable number of short, simple introductory notes, whereas individual song syllables are generally of longer duration and more complex. Different song syllables contain elements that may be noisy, highly frequency modulated, or consist of harmonic stacks (Price, 1979; Zann, 1996). Although the syllables in an individual bird's songs are repeated in a highly stereotyped manner, birds occasionally produce motif variants in which some syllables are dropped from their motifs (Zann, 1990; Nordeen and Nordeen, 1992).
Most birds sang readily in the absence of other zebra finches. Such “undirected” songs are slower in tempo and consist of a smaller number of motifs per bout of song compared with songs directed toward other birds (Morris, 1954; Hall, 1962; Sossinka and Böhner, 1980). However, the structure of individual syllables and the sequence of syllables remain the same in both directed and undirected songs (Zann, 1996). Therefore, for three of five 100 dB WN adult birds that did not sing for several recording sessions, songs of these males directed toward a female were recorded.
To quantify the degree of stereotypy in the song phrases of control and experimental birds, we used a computer program (The Songinator:http://siva.usc.edu/∼jdzevin/song help.html, by J. D. Zevin, 1999) to calculate measures of linearity, consistency, and stereotypy based on those published by Scharff and Nottebohm (1991). Our measure of whether syllables were produced in a specific linear order in a bird's song behavior was modified from the sequence linearity score ofScharff and Nottebohm (1991) and was calculated as follows: linearity = (number of different syllables − 1)/number of syllable transitions.
In their calculation of this measure, Scharff and Nottebohm used all syllables produced by a bird as the numerator and all transitions after each syllable as the denominator (including the transition between the last syllable and the ending of the song phrase). However, we included only transitions between song syllables (i.e., we did not include the transition between the last syllable and the end of the song motif, and therefore we used one less than the total number of syllables in the numerator). We calculated this “internal” linearity score to account for the following: normal birds occasionally end their songs at different syllables, although the songs are highly linear. For example, the occurrence of each syllable in two phrases of a song ABCD#ABC# (where “#” signifies the end of a song phrase) can be accurately predicted, given the preceding syllable. Using Scharff and Nottebohm's measure of linearity, this sequence would receive a linearity score <1 (i.e., 4/5 = 0.8), although it is perfectly linear by our measure (i.e., 3/3 = 1.0). (For additional details, seehttp://siva.usc.edu/∼jdzevin/song_help.html.)
A consistency score (Scharff and Nottebohm, 1991) was calculated to measure how often specific variations of the song phrase were sung by each bird (e.g., a bird that produces ABCD#ABC#, as above, has a linear song, but not a consistent song). The consistency with which each bird produced a specific sequence of syllables was calculated in the same way as described by Scharff and Nottebohm using the following equation: consistency = Σ [T(d)/T(a)]/N. In this calculation, the dominant (most frequent) transition for each syllable [T(d)] was divided by all transitions for that syllable, designated T(a). The sum of [T(d)/T(a)] for all syllables in each bird's songs was divided by N (the total number of syllables in that bird's songs). In this measure, we counted end-stops (#) as notes, so as to capture variability at both the beginnings and ends of songs. A completely stereotyped song bout with four syllables in each motif (e.g., #ABCD#ABCD#ABCD#) has five dominant transitions (AB, BC, CD, D#, and #A), and all transitions for each syllable fall into one of these dominant transition types (i.e., eachT(d)/T(a) equals 1), yielding an overall consistency score of 1.0. Linearity and consistency scores for each bird were averaged to determine an overall stereotypy score: stereotypy = (linearity + consistency)/2.
The total number of syllables produced by each bird was also counted and compared with those in the songs of controls to test whether auditory deprivation produced impoverished vocal repertoires. The stereotypy of individual syllable morphology for each bird was analyzed by visually examining different syllables in printed sonograms and comparing those sung in different bouts.
Dye injections into lMAN. The procedures used to make dye injections into different subregions of lMAN as well as qualitative and quantitative methods for analyzing the resulting anterograde and retrograde label from these injections have been described in detail previously (Iyengar et al., 1999). Briefly, lMAN consists of a magnocellular core of neurons as well as a surrounding shell primarily composed of parvocellular neurons (lMANcore and lMANshell, respectively) (cf. Johnson et al., 1995; Bottjer et al., 2000). All birds were anesthetized with Equithesin and placed in a stereotaxic apparatus (see Table1 for summary of dye injections). Approximately 2–5 nl of the fluorescent tracers rhodamine dextran amine (RDA; 10% solution in 0.02 m PBS) or fluorescein dextran amine (FDA; 20% solution in 0.02m phosphate buffered saline) (Molecular Probes, Eugene, OR) was targeted to lMANcore or lMANshell using a Picospritzer. Dye injections that entered both core and shell regions were included with injections that were restricted to only lMANcoreor lMANshell for analysis in this study, because retrograde and anterograde label resulting from these injections was comparable in normal male zebra finches (Johnson et al., 1995; Iyengar et al., 1999). Birds exposed to chronic white noise were removed from their sound chambers just before dye injections and were returned to the white-noise boxes immediately after they recovered from surgery. After a survival time of 3 d after surgery to allow for axonal transport of the dyes, birds were deeply anesthetized and perfused transcardially with 0.7% saline followed by 10% buffered formalin. Brains were removed and post-fixed in 10% buffered formalin for 5–7 d and then cryoprotected in 25% sucrose overnight. Brains were sectioned coronally at a thickness of 50 μm, and two alternate series of sections were collected on gelatin-coated slides. One series was air-dried after sectioning, coverslipped with buffered glycerol, and stored at 4°C. The second series was allowed to dry overnight, Nissl-stained with thionine, and coverslipped with Permount.
Table 1.
Summary of dye injections into lMAN used for qualitative analysis
| Treatment groups | Age | Total number of birds | Injections into lMANcore | Injections into core and shell | Total number of injections |
|---|---|---|---|---|---|
| DF | Adult | 11 | 2 | 8 | 9 |
| WN | Adult | 8 | 4 | 8 | 12 |
| DF | 35 d | 4 | 6 | 1 | 7 |
| WN | 35 d | 12 | 7 | 5 | 12 |
| Total | 35 | 19 | 22 | 40 |
Analysis of topography. Injection sites within lMANcore and the resulting retrograde label in the medial dorsolateral nucleus of the thalamus (DLM) and anterograde label in RA and area X were photographed using an epifluorescence microscope fitted with rhodamine and fluorescein filters (Chroma Technology, Brattleboro, VT) for RDA and FDA, respectively. The location of RDA and FDA injection sites within lMAN as well as the retrograde label within DLM produced by these injections were traced onto Nissl-defined outlines of these nuclei obtained from camera lucida tracings of the thionine-stained series of sections. (There was no differential shrinkage of the tissue in fluorescent vs Nissl-stained sections.) Whereas RDA produced intense anterograde labeling of axons and terminal arborizations, the anterograde fluorescent label produced by injections of FDA into lMAN was faint and difficult to photograph. Therefore the pattern of anterograde label described in this study is derived primarily from RDA injections.
We quantified the volume of anterogradely labeled lMANcore arbors within both RA and area X using methods published previously (Iyengar et al., 1999). Briefly, an image analyzer was used to capture images of anterograde label within RA and area X and injection sites within lMANcore. Only those injection sites that produced well-defined, intensely labeled terminal fields within RA and area X were selected for quantitative analysis. Images of the Nissl-defined profiles of RA and area X from thionine-stained alternate sections were also collected. Ten injections in adult DF and WN birds and 17 injections in 35 d DF and WN birds were used to analyze anterograde label in RA, whereas 9 injections in adult DF and WN birds and 16 injections in 35 d DF and WN birds were used to analyze anterograde label over area X. Image Pro Plus software from Media Cybernetics (Silver Spring, MD) was used to manually outline the area of anterograde label within both nuclei as well as the injection sites within lMANcore on each section in which they appeared. The investigator was not aware of the experimental treatment for each subject during tracing. Criteria for tracing included well-labeled individual processes that formed a terminal field of highly branched, extremely fine processes with numerous varicosities; areas that included only unbranched axons (i.e., axons of passage within the nucleus) were not included. The volume of anterograde label within RA and area X and the volume of the dye injections within lMANcore were estimated by adding these areas and multiplying the sum by the sampling interval (100 μm). The total volumes of RA and area X were measured in Nissl-stained sections in the same manner. The percentage of each nucleus occupied by anterogradely labeled axons from lMANcore was then calculated by dividing the volume of labeled axonal arbors within each nucleus by the total volume of the respective nucleus (RA or area X) in each bird. Quantitative data obtained from juvenile and adult DF and WN birds in this study were compared with previously published data from normal 20 d, 35 d, and adult birds (Iyengar et al., 1999) (see Results and Tables 3 and 4).
Table 3.
Summary data for quantitative analysis of label over RA after injections into lMANcore in control and experimental birds
| Treatment | Age | Volume of injection site3-b | Volume of RA3-b | Volume of terminal field3-b | Volume of arbors/ volume of RA |
|---|---|---|---|---|---|
| Control3-a | 20 d | 0.015 ± 0.008 | 0.127 ± 0.025 | 0.082 ± 0.026 | 0.648 ± 0.161 |
| Control3-a | 35 d | 0.022 ± 0.021 | 0.251 ± 0.074 | 0.059 ± 0.035 | 0.218 ± 0.099 |
| DF + WN | 35 d | 0.012 ± 0.006 | 0.240 ± 0.049 | 0.111 ± 0.041 | 0.479 ± 0.190 |
| Control3-a | Adult | 0.015 ± 0.009 | 0.289 ± 0.068 | 0.108 ± 0.040 | 0.369 ± 0.090 |
| DF + WN | Adult | 0.016 ± 0.007 | 0.326 ± 0.039 | 0.113 ± 0.057 | 0.345 ± 0.164 |
Control data for 20 d, 35 d, and adult male birds were obtained from Iyengar et al. (1999).
Volumes are in cubic millimeters (given as mean ± SD).
Table 4.
Summary data for quantitative analysis of label over area X after injections into lMANcore in control and experimental birds
| Treatment | Age | Volume of injection site4-b | Volume of area X4-b | Volume of terminal field4-b | Volume of arbors/volume of area X |
|---|---|---|---|---|---|
| Controls4-a | 20 d | 0.016 ± 0.008 | 0.926 ± 0.126 | 0.182 ± 0.108 | 0.198 ± 0.118 |
| DF + WN | 35 d | 0.012 ± 0.006 | 1.290 ± 0.304 | 0.116 ± 0.063 | 0.089 ± 0.039 |
| Controls4-a | Adult | 0.015 ± 0.010 | 1.738 ± 0.292 | 0.279 ± 0.259 | 0.164 ± 0.160 |
| DF + WN | Adult | 0.016 ± 0.016 | 1.703 ± 0.229 | 0.137 ± 0.073 | 0.080 ± 0.042 |
Control data for 20 d, 35 d, and adult male birds were obtained from Iyengar et al. (1999).
Volumes are in cubic millimeters (given as mean ± SD).
The average size of injection sites in lMAN was roughly comparable across different experimental groups. However, despite the fact that larger injections tended to produce a greater amount of terminal label (and vice versa), there was not a strong correlation between the size of an injection site and its terminal field in RA or area X, as is typical of any tract-tracing study (Simon and O'Leary, 1992; Feldman and Knudsen, 1997; Iyengar et al., 1999; Scharff et al., 2000). This lack of tight correspondence between the volume of the injection site and the volume of anterograde label could stem not only from differences in the amount of dye contained within each injection site but also from the amount of dye actually incorporated and anterogradely transported by lMAN neurons, which cannot be quantified. Furthermore, the volume of the terminal field in each nucleus includes variations in intensity of anterograde label. Because we wished to quantify the total proportion of RA and area X that received input from lMAN neurons, we included all levels of anterograde label in our quantitative assessment, regardless of variations in the density of fine labeled processes. This source of variability also contributes to the lack of a systematic relationship between the volume of the injection site and that of the terminal field. The important point to note, however, is that our previous work carefully documented that injections of similar size produce a substantially greater proportion of anterograde label in RA of 20 d birds compared with older birds, regardless of location within lMAN (Iyengar et al., 1999). Thus, despite variability in the volume of anterograde label after comparable injections, the methods used here (and in our previous study) are clearly adequate to reveal changes in overall patterns of topography as a function of age or experience.
Another important factor that could affect our measurements of anterograde label within RA is the density of lMANcore projection neurons in different groups of birds in our study. Specifically, neuronal density within lMANcore must be comparable between DF and WN birds as well as between age-matched normal birds, so that injections of similar volume can encompass comparable numbers of neurons in different birds. Previous studies have reported that the total number of lMANcore projection neurons as well as neuronal density within lMAN remains constant throughout song learning (Bottjer et al., 1985; E. J. Nordeen and Nordeen, 1988; Burek et al., 1991). In addition, Burek et al. (1991) showed that early deafening does not affect neuronal density within lMAN in juvenile or adult birds. Therefore, injection sites of comparable volume should include similar numbers of lMANcore neurons in hearing-deprived and normal juvenile and adult birds (Iyengar et al., 1999).
RESULTS
Analysis of song in adult DF and WN birds
Controls
The songs of all normal adult males (controls and the fathers of WN adult males) comprised four to seven syllables (Table2), which were produced in a highly stereotyped sequence with few motif variants. This stable song behavior was reflected in high scores for linearity and consistency, which were averaged to yield high overall stereotypy scores (Table 2). In addition, individual syllables were easily identified in different renditions of the songs sung by these birds and did not vary in structure across different motifs (Fig.1C).
Table 2.
Analysis of songs in control and WN adult birds
| Treatment | Number of motifs analyzed | Linearity2-a | Consistency2-a | Stereotypy2-a | Number of syllables |
|---|---|---|---|---|---|
| Control | 35 ± 4 | 0.95 ± 0.12 | 0.95 ± 0.04 | 0.95 ± 0.07 | 4.67 ± 1.03 |
| WN | 27 ± 8 | 0.68 ± 0.22 | 0.86 ± 0.08 | 0.77 ± 0.15 | 3.29 ± 1.11 |
Stereotypy is the average of linearity and consistency (see Materials and Methods).
All values are given as mean ± SD.
Fig. 1.
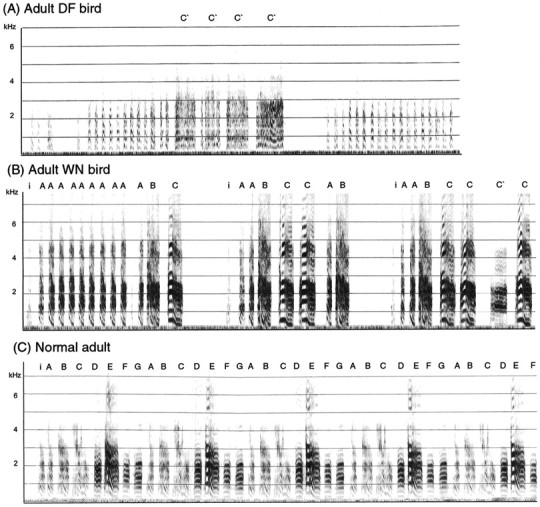
Sonograms comparing songs of adult birds deprived of normal auditory input during the sensitive period for song learning and an adult control. Letters above sonograms denote different syllables in the songs of the WN bird and his father.A, The song of an adult bird deafened at 12 d was composed of noisy syllables repeated several times in succession, with little frequency modulation and poorly resolved harmonics as well as abnormal call-like notes (C′). B, The adult WN (116 dB) bird produced motifs consisting of a variable number of simple introductory note-like syllables (A), followed by one rendition of a song-like syllable (B) and a variable number of call-like notes (syllable C). C, His father's song (B) is highly stereotyped and consists of syllables A–G. Calibration, 200 msec.
Deafened birds
Adult male zebra finches that had been deafened by bilateral cochlear removal at 12 or 20 d produced highly disrupted songs compared with normal controls (Konishi, 1965; Nottebohm, 1968; Price 1979; Scharff and Nottebohm, 1991) (Fig. 1). Syllables in the songs of DF birds were not counted because they were produced in such a variable manner that it was impossible to consistently identify them across different renditions. Compared with syllables in control adult birds' songs, the length and structure of individual syllables produced by deafened birds were highly variable with poorly resolved harmonics and little or no frequency modulation, and highly abnormal call-like notes were incorporated at the end of song phrases in some of these birds. In addition, the songs of DF birds lacked a stable song phrase, such that the temporal sequence of syllables tended to be variable across different iterations of song phrases. An example of song from an adult bird that was deafened at 12 d is shown in Figure1A. This song comprised a string of syllables that resembled introductory notes followed by three to five renditions of a noisy amorphous syllable that seemed to represent variable iterations of the same syllable (C′).
White noise birds
WN birds produced abnormal songs as adults consisting of simple syllables that resembled introductory- and call-like notes in normal songs (Fig. 1). Careful visual inspection of sonograms indicated that the structure of individual syllables in adult songs of WN birds was stable across different renditions and was similar to comparable syllables of control adults (unlike the noisy, poorly structured syllables produced by DF birds). However, songs of WN birds included significantly fewer syllables than did songs of adult controls (Table2) (F(1,12) = 6.88; p= 0.022). In addition, the song phrases of WN birds were less stable than those of controls, resulting in lower scores for linearity and consistency. Although the behavior of birds exposed to 100 dB of white noise tended to be slightly less disrupted than those exposed to 116 dB, there were no significant differences between the two groups (data not shown). Behavioral data from birds raised in white noise at 100 and 116 dB were therefore pooled and compared as a group against adult controls. Adult WN birds received significantly lower scores for linearity (F(1,12) = 7.40;p = 0.02), consistency (F(1,12) = 5.99; p = 0.03), and stereotypy (F(1,12) = 7.61;p = 0.02). These lowered scores were attributable to the tendency of WN birds to repeat one or two syllables a variable number of times within a motif, which is not typical of normal song. In addition, WN birds produced different temporal sequences of notes on occasion and tended to include a variable number of long calls in their songs that were not seen in songs of control adults.
As an example, the song of an adult bird reared in white noise and his father's song (recorded before the father was placed in white noise) are shown in Figure 1, B and C, for comparison. The WN-reared bird produced a very simple adult song consisting of syllable A, which was repeated a variable number of times within different motifs and resembled introductory notes in normal songs. It was frequently followed by one iteration of a song-like syllable (B) and a variable number of call-like notes (C). On other occasions, this bird produced song phrases consisting of syllable A only or syllable C only, and in some song phrases included a note D after A (data not shown). His song phrases were variable in terms of both length (i.e., number of notes) and sequence of notes; thus he lacked a stable song phrase. His father's song consisted of syllables A through G, which were sung in a very stereotyped manner. Syllables A and B of the WN bird are somewhat similar to syllables A and B in his father's song, respectively. In addition, the call-like note (C) in the WN adult bird's song resembles syllable E in his father's song. However, the WN-reared bird's song is highly variable and impoverished compared with his father's song. In summary, birds exposed to loud white noise during the sensitive period for song learning produce highly abnormal song behavior consisting of few, simple syllables produced in a variable manner when they reach adulthood.
Topographic organization within different circuits to and from lMAN
Injections into lMANcore of all birds produced ipsilateral retrograde label in an oval region corresponding to the dorsolateral part of DLM (DLMDL) and anterograde label within ipsilateral RA and area X (Figs. 3, 4). Injections into lMANshell produced ipsilateral retrograde label in a crescent-shaped region corresponding to ventromedial DLM and anterograde label in the ipsilateral dorsal archistriatum (Ad), parolfactory lobe, and dorsolateral caudal neostriatum (a cortical region dorsal and lateral to RA and Ad) in all groups of birds studied (cf. Bottjer et al., 2000). Careful qualitative examination revealed no differences in the topography of axonal connections to and from lMANshell or within the DLMDL→lMANcorecircuit in any of the experimental groups in this study compared with normal 35 d and adult birds from a previous study (cf. Johnson et al., 1995; Iyengar et al., 1999). Therefore, we describe patterns of anterograde label from lMANcore to RA and area X only (Figs. 3, 4).
Fig. 3.
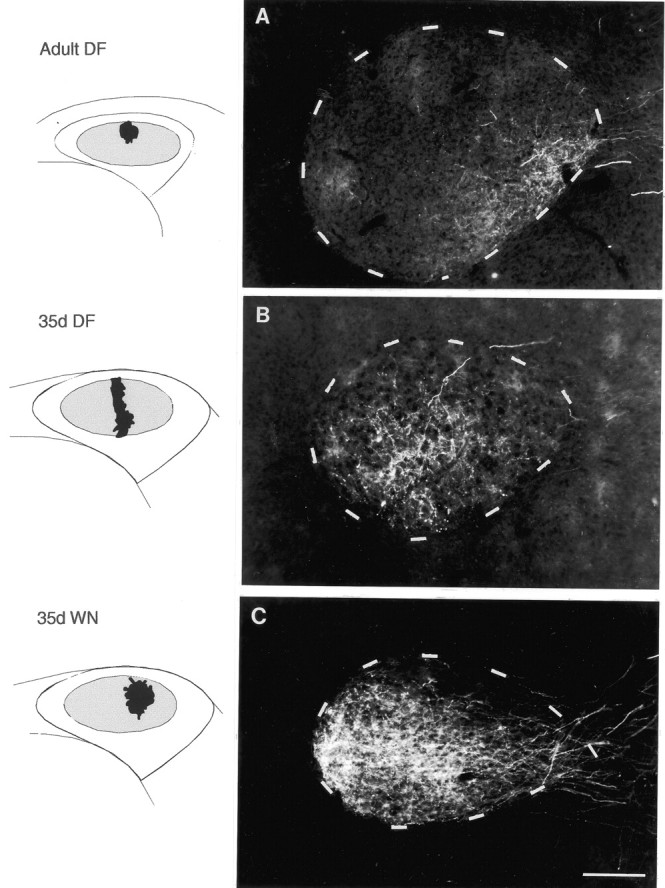
Photomicrographs of anterograde label over coronal sections of right RA resulting from injections of RDA into right lMANcore in an adult DF bird, a 35 d DF bird, and a 35 d WN bird. Nissl-defined outlines of RA are depicted bydashed lines, and injection sites within lMANcore for each bird are shown in schematics; lateral, right; dorsal, superior. A, An injection within dorsal–intermediate lMANcore produced a terminal field that was restricted to the ventrolateral part of RA in an adult DF bird. Small amounts of label in medial and dorsal RA represent single axons that looped through these loci before arborizing within ventrolateral RA. Similar injections in normal adult controls also labeled single axons that looped through topographically “inappropriate” areas before arborizing in the correct location (cf. Simon and O'Leary, 1992; Iyengar et al., 1999). B, An injection within the intermediate part of lMANcore that extended across its dorsoventral axis in a 35 d DF bird produced anterograde label encompassing the central, ventrolateral, and ventromedial parts of RA. The dorsal cap region was the only part of RA that was devoid of label in this bird. C, Anterograde label extended throughout the ventromedial and ventrolateral subregions of RA after an injection centered in the lateral–intermediate subregion of dorsal lMANcore in a 35 d WN bird. Although the lMANcore terminal field in RA in this bird was more extensively labeled than in the 35 d DF bird, it did not extend into the dorsal cap of RA. Scale bar, 200 μm.
Fig. 4.
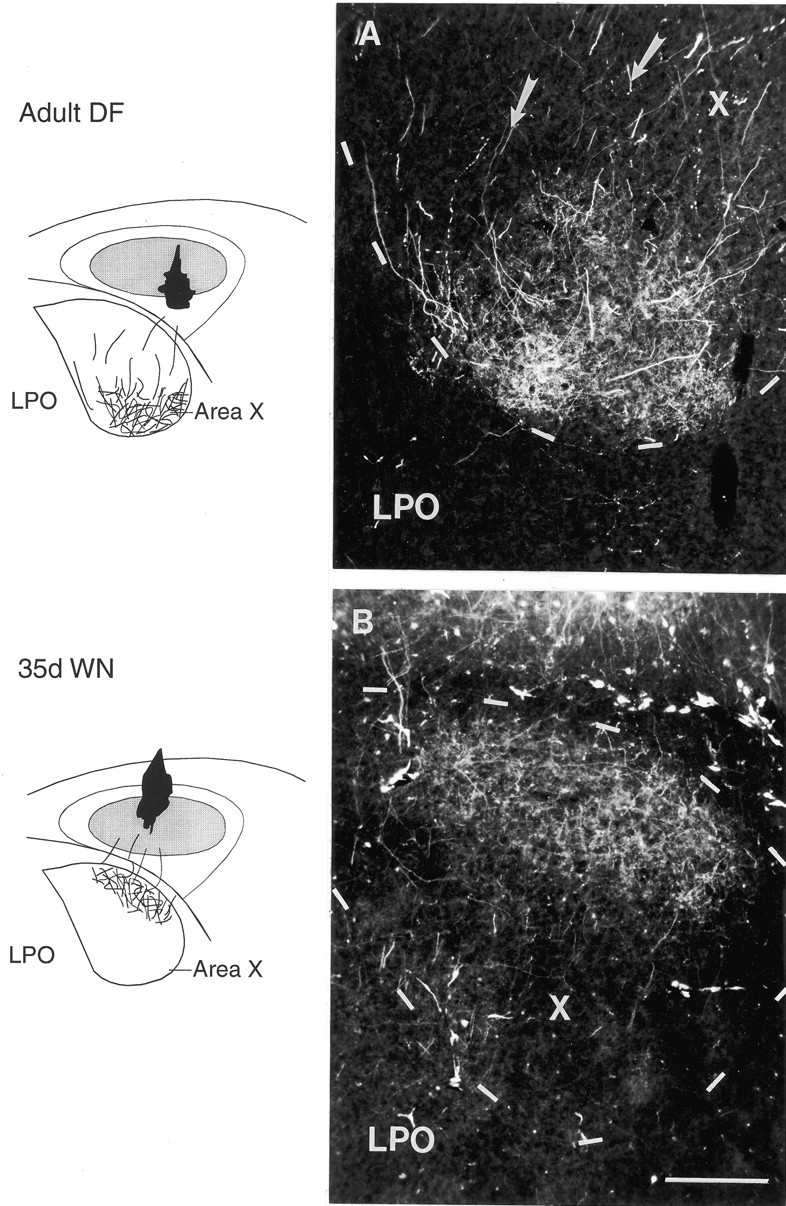
Injections of RDA into different subregions of right lMANcore (shown in schematics) produced anterograde label over specific subregions within coronal sections of right area X (schematics and photomicrographs) in an adult DF bird and a 35 d WN bird. Nissl-defined outlines of area X are depicted bydashed lines; lateral, right; dorsal, superior.A, An injection centered in ventral–intermediate and ventrolateral lMANcore in an adult DF bird produced patches of label within the ventral–intermediate and ventrolateral subregions of area X. Labeled axons from the injection site in lMANcore (arrows) traversed the dorsal and intermediate parts of area X before arborizing exclusively in its ventral subregion. B, Anterograde label within the dorsal intermediate subregion of area X (X) was produced by an injection into the dorsal–intermediate part of lMANcore of a 35 d WN bird. LPO, Parolfactory lobe. Scale bar, 200 μm.
Topographic organization within the lMANcore→RA circuit
The lMANcore→RA circuit in normal adult male zebra finches has a topographic organization such that ventromedial, ventrolateral, and dorsal regions of RA receive projections from lateral, intermediate, and medial subregions of lMANcore, respectively (Johnson et al., 1995). In addition, injections into intermediate–lateral lMANcore label medial and central parts of RA, whereas injections into intermediate–medial lMANcore label dorsal RA as well as small regions extending along the medial and lateral borders adjacent to this dorsal “cap” (Iyengar et al., 1999) (Fig.2). However, our previous work has shown that this topographic organization is lacking at the onset of song learning (20 d), and becomes organized to match the adult pattern by 35 d after hatching, during the early part of song learning and auditory–motor integration (see control data, Table3). In addition, the location of anterograde label within RA produced by dye injections into different subregions of lMANcore at 20 d is not well matched to the adult pattern, whereas the location of anterograde label in RA of 35 d birds does match that seen in adult birds after injections within corresponding subregions of lMANcore (Iyengar et al., 1999).
Fig. 2.

Schematic depicting the overall topographic map of the axonal connections of right lMANcore onto RA in a male zebra finch (see Results) (cf. Johnson et al., 1995; Iyengar et al., 1999). D, Dorsal; I, intermediate;L, lateral; M, medial;I+M, intermediate + medial; L+I, lateral + intermediate; M + C, medial + central;VL, ventrolateral; VM, ventromedial;D ± L± M, dorsal ± lateral border ± medial border.
Qualitative analysis
Qualitative examination of anterograde label in all adult birds that had not experienced normal patterns of auditory input during development revealed that topographic mapping within the lMANcore→RA projection was similar to that in normal adult birds. Twenty-one of 21 injections into different subregions of lMANcore in DF and WN adult birds produced anterograde label that was similar to controls in terms of both location within RA and size of terminal field (Table 1; see below for quantitative analysis). For example, anterograde label stemming from an injection into dorsal–intermediate lMANcore in an adult DF bird was restricted to the ventrolateral part of RA (Fig. 3A). This pattern of label is comparable with that seen in control adult and 35 d birds, in which dye injections anywhere in the intermediate part of lMANcore produce anterograde label within the ventrolateral RA (Fig. 2) (cf. Iyengar et al., 1999).
In contrast, patterns of axonal connectivity between lMANcore and RA in DF and WN birds at 35 d were substantially less refined than those in normal 35 d or adult birds. The majority of injections into lMANcoreof 35 d DF and WN birds (17 of 19 injections; Table 1) produced label that encompassed a much greater proportion of RA compared with that seen after comparable injections in normal 35 d birds. In addition, labeled lMANcore axons in 35 d DF and WN birds were not consistently localized within the target regions of RA that they will ultimately innervate (11 of 19 injections). For example, an injection into the intermediate part of lMANcore (extending across the dorsoventral axis) in a 35 d DF bird produced anterograde label over the ventral two-thirds of RA. Most of the anterograde label was concentrated in the central part and along the ventral–intermediate border of RA, but sparser label was also clearly visible along its ventromedial and ventrolateral borders (Fig. 3B). The dorsal cap, a region that is occupied by axon arbors from the medial subregion of lMANcore in normal adult and 35 d birds, was the only part of RA devoid of label in this bird. In 35 d and adult control birds, injections into intermediate lMANcore label axons only within ventrolateral RA (i.e., as in Fig. 3A). Thus, not only do the terminal fields of neurons from subregions within lMANcoreoccupy a greater proportion of RA in 35 d deaf birds than in hearing birds, but also the location of anterograde label within RA indicates that spatial patterns of axonal connectivity within this circuit do not match those seen in 35 d and adult controls.
The injections shown for adult and 35 d DF birds in Figure 3 are matched for medial–lateral location within lMANcore, although the injection in the 35 d DF bird extended across the dorsoventral axis, whereas the injection in the adult DF bird occupied the dorsal part of intermediate lMANcore. However, it is appropriate to compare the pattern of anterograde label in RA in these birds because the total volume of these injections was comparable (0.010 mm3 and 0.012 mm3 in the 35 d and adult DF bird, respectively) and because our previous work demonstrated that the dorsoventral extent of injections into lMANcoredoes not affect the extent or location of anterograde label in RA (Iyengar et al., 1999). Comparison of these two cases therefore indicates that comparable injections produce a much larger terminal field in RA of 35 d DF birds than that of adult DF birds, such that a much greater proportion of RA is occupied in juvenile deafened birds.
A similar lack of topographic specificity was seen in both DF and WN birds at 35 d of age. For example, labeled axons arborized throughout ventromedial and ventrolateral subregions of RA in a 35 d WN bird after an injection centered in the intermediate–lateral subregion of dorsal lMANcore (Fig.3C). The only part of RA that was not occupied by anterograde label was the dorsal cap, although anterograde label over RA in this bird was more extensive than in the 35 d DF bird (Fig.3B). Similar injections into intermediate–lateral lMANcore in normal 35 d and adult birds label a restricted region within medial and central RA (Fig. 2) (Iyengar et al., 1999). However, this WN bird did provide an example of the fact that initial stages of refinement in topographic organization within the lMANcore→RA circuit were evident in some 35 d DF and WN birds. Although the ventral two-thirds of RA was covered by anterograde label in this 35 d WN bird, label was most intense within medial and central parts of RA.
Quantitative analysis
We decided to confirm our qualitative observations by quantifying the proportion of RA occupied by terminal label in 35 d and adult hearing-deprived and normal birds. The volume of RA, the volume of labeled lMANcore axons within RA, and the proportion of RA occupied by the labeled lMANcoreterminal field were compared across different groups of birds. None of these measures varied when DF and WN birds were compared with each other at either 35 d or adulthood (all F values < 1). Therefore, we compared data from DF and WN birds together against normative age-matched data from Iyengar et al. (1999).
The volume of RA in 35 d DF and WN birds was comparable with that in normal 35 d birds (F < 1), whereas the volume of the anterogradely labeled terminal field of lMANcore neurons within RA was substantially greater in 35 d DF and WN birds than in control 35 d birds (Table 3, Fig. 5) (F(1,20) = 6.44; p = 0.02). Because the overall size of RA was not different in birds with and without normal hearing, whereas the labeled lMANcore terminal field was greatly enlarged in birds deprived of normal auditory experience, there was a dramatic twofold increase in the proportion of RA occupied by lMANcore axons in 35 d DF and WN birds compared with controls (48% vs 22%) (F(1,20) = 8.47; p = 0.009). The finding that RA volume is unaffected by the lack of normal patterns of auditory input during the sensitive period for song learning in zebra finches confirms previous work by Burek et al. (1991). However, the fact that the projection of lMANcore neurons to RA in deprived birds is substantially larger in volume at 35 d compared with age-matched controls shows that auditory experience regulates the development of topographic organization in this pathway by influencing the growth of axon arbors.
Fig. 5.
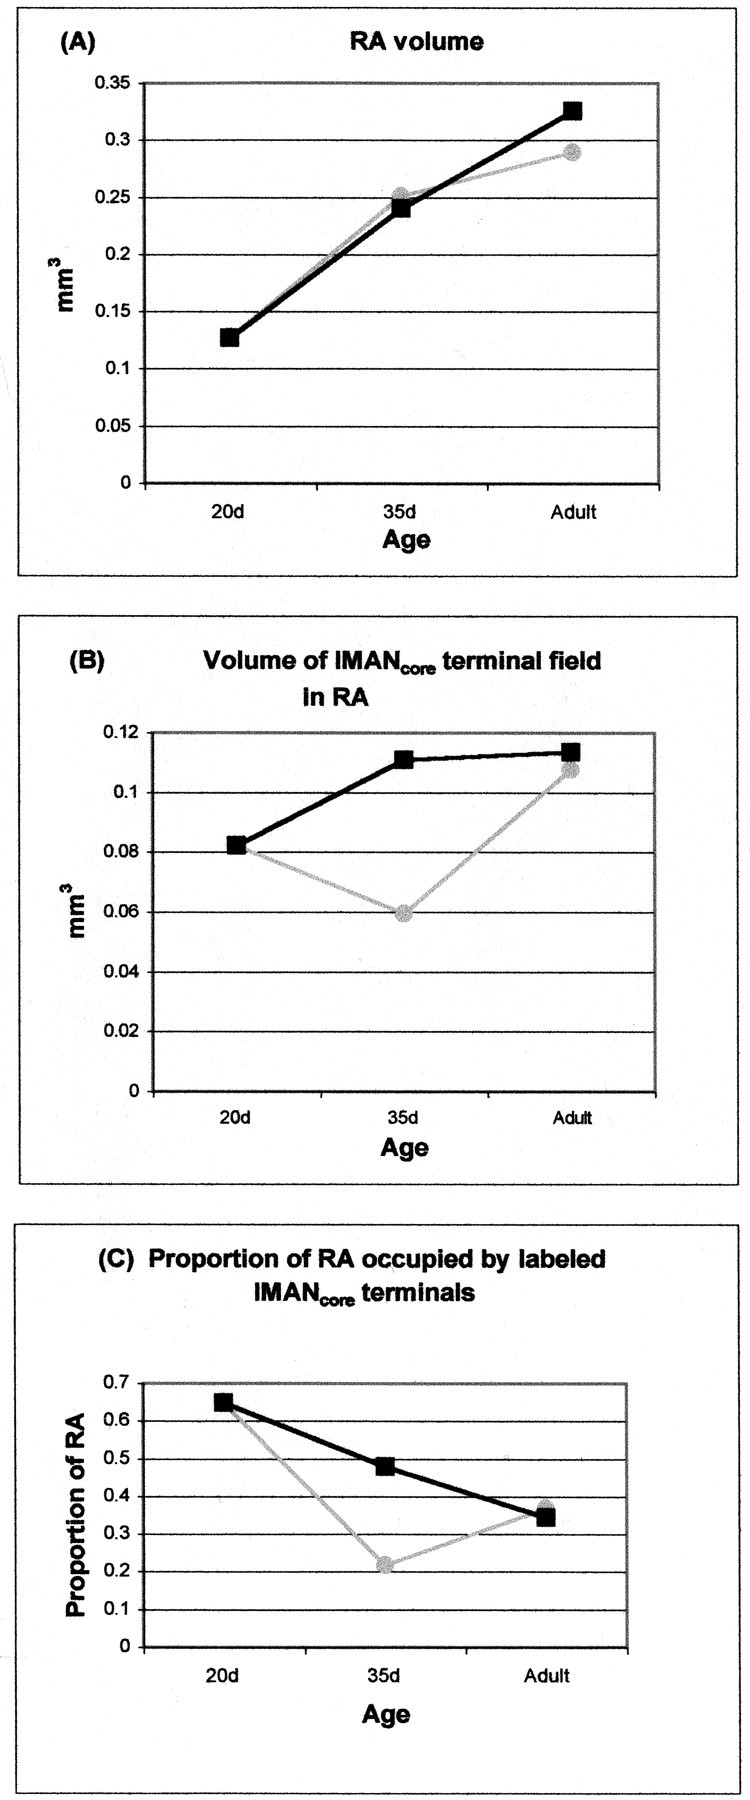
Comparison between changes in RA volume (in cubic millimeters), the volume of the lMANcoreterminal field in RA after dye injections in lMANcore (in cubic millimeters), and the proportion of RA occupied by labeled lMANcore terminals across normal birds (-◍-) and DF and WN birds (-▪-) during the course of song learning; average values of means for each group are given in Table 4; error bars represent SEMs. A, RA volume increases normally between 20 d and adulthood in birds deprived of normal auditory input (cf.Burek et al., 1991). B, The overall volume of the labeled lMANcore terminal field increases dramatically between 20 and 35 d in DF and WN birds, in contrast to the slight decrease in the volume of the lMANcore terminal field in normal 35 d birds. By adulthood, the overall volume of the lMANcore terminal field within RA in DF and WN birds is comparable with that in normal adults, suggesting that refinement of overall topographic organization within this circuit is delayed and occurs between 35 d and adulthood. C, Because the volume of the lMANcore terminal field is much larger in deprived 35 d birds compared with controls, whereas RA volume is comparable between the two groups, the proportion of RA occupied by anterogradely labeled lMANcore terminals is significantly larger in 35 d DF and WN birds compared with normal 35 d birds. By adulthood, the proportion of RA occupied by the lMANcore terminal field is comparable in normal or DF and WN birds, because RA volume as well as the overall volume of the lMANcore terminal field within RA are comparable in the two groups of birds.
To study changes occurring within the lMANcore→RA circuit between the onset of song learning and 35 d in deprived birds, we compared the pattern of results in 35 d DF and WN birds with that in normal 20 d birds. The RA was much larger in volume in 35 d DF and WN birds than in control 20 d birds (F(1,28) = 17.4; p < 0.0001), reflecting the pronounced growth of RA that occurs during early stages of song learning in both normal and deafened birds (Bottjer et al., 1985; Burek et al., 1991) (Table 3, Fig. 5). The volume of the terminal field was substantially greater in 35 d DF and WN birds than in control 20 d birds (F(1,28) = 4.30; p = 0.04), despite the fact that there is normally a slight decrease in the volume of the terminal field of lMANcore neurons in RA between 20 d and 35 d in control male zebra finches. Therefore, depriving juvenile birds of normal auditory input during vocal learning causes small groups of lMANcoreaxon arbors to occupy an expanded amount of postsynaptic territory within the RA between 20 and 35 d. This increased volume of anterograde label in 35 d DF and WN birds was somewhat offset by the increase in overall volume of RA, such that the proportion of RA occupied by labeled lMANcore axons was significantly lower in 35 d DF and WN birds compared with normal 20 d birds (48% vs 65%) (F(1,28) = 6.67; p = 0.015). These results indicate that the terminal field of lMANcore neurons expands abnormally between 20 and 35 d in hearing-deprived birds, rather than regressing slightly as in normal birds. Because RA volume increases in both hearing and deprived birds, the proportion of RA labeled by core axons does decrease somewhat between 20 and 35 d in deprived birds but is still much higher in DF and WN birds compared with normal 35 d controls.
In contrast to 35 d DF and WN birds, the proportion of RA occupied by the anterogradely labeled lMANcore terminal field in adult DF and WN birds was not significantly different from that in normal adult birds (35% vs 37%) (Table 3, Fig. 5) (F < 1). There was no significant difference in the volume of RA between adult DF and WN birds and normal adults (F(1,17) = 1.50; p > 0.05) or in the volume of the terminal field of lMANcore neurons in RA (F < 1). These results confirm that depriving zebra finches of auditory input during vocal learning does not prevent the emergence of overall topographic organization within the lMANcore→RA circuit by the time birds reach adulthood.
In male zebra finches, the total number of neurons in RA remains constant throughout song learning. However, RA volume increases during this period because of a decrease in the density of neurons within this nucleus (Konishi and Akutagawa, 1985; Bottjer et al., 1986; Herrmann and Bischof, 1986; E. J. Nordeen and Nordeen, 1988; K. W.Nordeen and Nordeen, 1988). Deafening birds during vocal learning does not affect the total number of neurons within RA or the increase in overall volume of this nucleus over the course of vocal learning (Burek et al., 1991). Our results have confirmed that the increase in RA volume during song learning in DF and WN birds is comparable with age-matched controls. However, the lMANcoreterminal field undergoes a significant increase in size between 20 d and 35 d in DF and WN birds, in contrast to the slight decrease in volume seen in control birds between 20 d and 35 d. Because the total number of projection neurons within lMANcore remains the same throughout song learning (Nordeen et al., 1992), any developmental changes in the volume of the lMANcore terminal field within RA presumably reflect either exuberant growth of individual axon arbors or adjacent lMANcore neurons projecting to different regions rather than highly similar regions within RA. Therefore, our results suggest that remodeling of individual lMANcore axon arbors within RA between 20 d and 35 d of development depends on the presence of normal patterns of auditory input. By the time 35 d DF and WN birds reach adulthood, the volume of RA increases to match adult controls and the proportion of RA occupied by the lMANcoreterminal field is not significantly different from control adults (Fig.5C).
In summary, both quantitative and qualitative analyses of the lMANcore→RA circuit in DF and WN birds indicate that preventing normal auditory input during the period of vocal learning delays but does not prevent the emergence of topographic organization within the lMANcore→RA circuit. That is, topographic patterns of connectivity do not emerge in birds deprived of normal auditory experience between 20 and 35 d, as they do in normal birds, but do develop some time after 35 d of age. Interestingly, the emergence of topographic organization was delayed beyond 35 d within the lMANcore→RA circuit in both DF and WN birds, although early deafening disrupted the songs of zebra finches to a greater extent than exposure to chronic white noise. We do not know whether the greater behavioral disruption induced by deafening is attributable to lesion-induced changes in the brain or to a more complete blockade of auditory input than is obtained via white noise. However, it seems likely that spontaneous patterns of activity in the lMANcore→RA pathway could be similar in both DF and WN birds, because lMAN neurons respond best to song-like sounds and not to pure tones or noise (for review, see Doupe and Solis, 1997). Thus, patterned activity based on auditory experience may be replaced by similar patterns of spontaneous activity in both DF and WN birds.
Topographic organization within the lMANcore→area X circuit
Mature topographic organization within the lMANcore→area X circuit is already present in normal males at the onset of vocal learning (20 d), unlike the lMANcore→RA circuit, despite the fact that single lMANcore axons bifurcate and project to both RA and area X (Nixdorf-Bergweiler et al., 1995; Vates and Nottebohm, 1995; Iyengar et al., 1999). The lMANcore→area X circuit displays medial-to-lateral topography, such that neurons in the medial, intermediate, and lateral parts of lMANcoreproject to corresponding medial, intermediate, and lateral subregions of area X. In addition, neurons within the dorsal and ventral parts of lMANcore project to dorsal and ventral subregions of area X, respectively, in normal birds.
Qualitative analysis
We found that topographic organization of the lMANcore→area X circuit in virtually all DF and WN birds at adulthood (20 of 21 injections; Table 1) was similar to that seen in age-matched normal birds. For example, an injection centered in the ventral intermediate–lateral part of lMANcore in an adult DF bird produced anterograde label within the ventral intermediate– lateral part of area X (Fig.4A). Labeled axons from the injection site in lMANcore (Fig.4A, arrows) traversed dorsal and intermediate parts of area X before arborizing in ventral subregions similar to those labeled in normal adult birds.
Dye injections into different subregions of lMANcore in DF and WN birds at 35 d demonstrated that topographic organization within the lMANcore→area X circuit was similar to that seen in normal 35 d and adult birds (18 of 19 injections; Table1). For example, an injection into the dorsal–intermediate part of the lMANcore in a 35 d WN bird produced anterograde label concentrated within the dorsal intermediate subregion of area X (Fig. 4B).
Quantitative analysis
Our qualitative observations revealed that topographic organization within the lMANcore→X projection is unaffected by altering auditory experience, and were also borne out by quantitative analysis (Table 4). The proportion of area X occupied by labeled terminals from lMANcore neurons in adult DF and WN birds (8%) was not substantially different from that in adult controls (16%) (F(1,15) = 2.08; p > 0.05). Neither the absolute volume of area X (F < 1) nor the volume of the lMANcore terminal field in area X (F(1,15) = 1.45;p > 0.05) was significantly different between the two groups.
Our previous work showed that spatial patterns of axonal connectivity within the lMANcore→X circuit were similar in normal 20 d, 35 d, and adult birds, and quantitative analysis confirmed that the proportion of area X occupied by the lMANcore terminal field did not vary in normal 20 d and adult birds (Table 4) (Iyengar et al., 1999). Therefore, we did not quantify the proportion of area X occupied by terminal label in normal 35 d birds (because this value was unlikely to be significantly different at 35 d, based on the overall pattern of both qualitative and quantitative results). In the current study, we therefore compared the proportion of area X covered by terminal label in 35 d DF and WN birds with that obtained from normal 20 d and adult birds. Axonal arbors of lMANcore neurons occupied 20% and 16% of area X in normal 20 d birds and normal adults, respectively, and 9% in 35 d DF and WN birds (F(2,31) = 5.65; p = 0.05). The absolute volume of the lMANcore terminal field in area X was not different between normal 20 d birds and 35 d WN and DF birds (Table 4) (F(1,31) = 1.32;p > 0.05), but as expected, normal adult birds had a larger volume of label than juvenile DF and WN birds (F(1,31) = 6.93; p = 0.013). The total volume of area X was larger in 35 d DF and WN birds compared with 20 d birds (F(1,24) = 9.35; p = 0.002) and was also larger in normal adults compared with 35 d DF and WN birds (F(1,22) = 11.80;p = 0.002).
These results demonstrate that depriving birds of normal auditory input during song learning does not affect the growth in volume of area X that occurs during song learning in normal male zebra finches, as has been demonstrated previously (Bottjer et al., 1985; cf. Burek et al., 1991). Our results also suggest that auditory experience does not strongly influence the growth of the lMANcoreterminal field in area X that occurs in normal birds, which acts to preserve the relatively constant proportion of area X occupied by lMANcore axon arbors during vocal development (i.e., 16–20%). In agreement with this idea, the volume of the lMANcore terminal field in area X was not significantly different between adult DF and WN birds and normal adult birds or between 35 d DF and WN birds and 20 d controls. However, this measure was higher in adult controls than in 35 d DF and WN birds, raising the possibility that lMANcore axon arbors may undergo some regression at 35 d in DF and WN birds. Because we did not quantify the lMANcore terminal field in area X in control 35 d birds (Iyengar et al., 1999), we do not know whether it undergoes similar changes in normal birds during vocal development or whether these changes result from the lack of normal auditory input to 35 d DF and WN birds.
These results indicate that neither the establishment nor the maintenance of topography within the lMANcore→area X circuit depends on normal patterns of auditory input during the sensitive period for song learning. The increase in the absolute volume of area X that occurs between 20 d and adulthood in control birds also occurs in both groups of experimental birds used in this study (cf. Bottjer et al., 1985; E. J. Nordeen and Nordeen, 1988; K. W. Nordeen and Nordeen, 1988; Burek et al., 1991). Because the total number of lMANcore projection neurons remains the same throughout song learning, axon arbors of these neurons within area X must be remodeled constantly between 20 d and adulthood in normal birds so that broad patterns of topography are maintained during this period (Iyengar et al., 1999). Therefore, the results in the present study suggest that there are no long-term effects of deafening or chronic exposure to white noise on axon remodeling, which is required to maintain topographic organization within the lMANcore→X circuit.
These results also underscore the differences between the lMANcore→RA and lMANcore→area X circuits in response to deafening and white noise exposure in juvenile birds. That is, emergence of topographic organization within the lMANcore→ RA circuit is delayed in 35 d DF and WN birds. However, patterns of axonal connectivity within the lMANcore→area X circuit in 35 d deprived birds are unaffected by altered patterns of auditory input during the sensitive period for song learning, although individual lMANcore projection neurons send collaterals to both RA and area X (Nixdorf-Bergweiler et al., 1995; Vates and Nottebohm, 1995). This pattern demonstrates the validity of the labeling method used here: the exact same injections that produced an expanded pattern of label within RA of 35 d birds did not produce expanded anterograde label within area X.
DISCUSSION
Topographic specificity in the lMANcore→RA pathway emerges between 20 and 35 d in normal male zebra finches, during early stages of the sensitive period for vocal learning (Fig. 2) (Iyengar et al., 1999). We report here that depriving male zebra finches of normal patterns of auditory input during this period delays the establishment of topographic organization within this circuit. Topographic specificity within this projection emerges some time after 35 d in deprived birds and is comparable with that seen in normal birds by adulthood, although experimental birds produce highly disrupted songs (cf. Konishi, 1965; Nottebohm, 1968; Price, 1979). This finding suggests the possibility that spontaneous patterns of activity within the lMANcore→RA pathway in DF and WN birds may be sufficient to produce a fairly refined degree of topographic order. Of course, it is highly likely that final refinements in the mapping of all axonal projections to and from lMAN are influenced by sensory experience and contribute to the functional processes of song learning by influencing the fine precision of connectivity in these pathways.
Axonal projections between presynaptic neurons and their postsynaptic targets are organized into topographic maps, which are generally present at birth and show well-organized, innately determined patterns of connectivity (O'Leary and Cowan, 1983; Udin, 1985; Young and Rubel, 1986; Catalano et al., 1991; Agmon et al., 1993, 1995; Weliky and Katz, 1997; Crair et al., 1998). The finer details of these maps (at the level of individual axon arbors and synaptic contacts) are shaped by experience during a later sensitive period of development and presumably give rise to the exquisite matching between presynaptic and postsynaptic neurons seen in adult animals (Wallhaüsser-Franke et al., 1995; Crair et al., 1998). The results we present here for most song-control pathways are consistent with other studies showing that topographic organization is evidenced in nascent axonal projections as innate patterns of precise axonal connectivity, which are not influenced by abnormal patterns of sensory experience. However, the lMANcore→RA circuit represents an interesting exception, because topographic mapping is not established in the initially formed projection. The lack of topographic specificity in the lMANcore→RA projection is similar to the developing retinocollicular projection in birds and mammals, in which topographic order is initially lacking and subsequently emerges as a result of substantial remodeling of axon arbors (Nakamura and O'Leary, 1989; Simon and O'Leary, 1990, 1992) (for review, see Roskies et al., 1995).
A striking aspect of the lMANcore→RA projection is that the emergence of initial topographic organization within this map is affected by experience (in this case, auditory input). An influence of experience on patterns of topographic connectivity has also been detected in barn owls, in which prism rearing during the sensitive period when vision calibrates the auditory map of space causes a remapping of the axonal projection leading to the space-specific map in the inferior colliculus (Feldman and Knudsen, 1997). In the case of prism-reared barn owls, the remapped axonal projection persists into adulthood, an effect that is in contrast to our observation of the emergence of topographic mapping in DF/WN adult birds (cf. Knudsen, 1998). This difference raises an interesting question regarding whether removal of experiential inputs (e.g., deafening) is comparable with directional alterations in experiential inputs (e.g., prism rearing). It seems possible that blocking specific experiential factors (as we attempted to do in the current study) might reveal a less profound effect on development of the nervous system than directional alterations in experience, because in the former case an instructive influence of experience is absent and innately specified molecular cues may come to predominate. In contrast, directional manipulations produce a situation in which an instructive influence of experience, although altered, is present throughout the sensitive period (cf. Udin, 1985; Knudsen, 1994). This is an extremely important point for studies examining the role of experiential factors on broad patterns of topographic organization, because most such experiments have blocked experience. If directional manipulations of experience do in fact provide a more sensitive assay, then the basic tenet that initial patterns of topographic mapping are not influenced to a significant extent by experience may be subject to revision.
Effects of altered patterns of auditory input on RA volume and the lMANcore terminal field within RA during song learning
The results presented herein confirm that depriving juvenile male zebra finches of normal patterns of auditory input did not affect the increase in volume of RA that normally occurs between 20 d and adulthood (Bottjer et al., 1986; Herrmann and Bischof, 1986; Kirn and DeVoogd, 1989). In contrast, the volume of the terminal field made by small subgroups of lMANcore neurons within the RA of deprived birds at 35 d was almost twice as large as that in normal 35 d birds. Furthermore, comparison of the size of the lMANcore terminal field within RA in deprived 35 d birds with that in normal 20 d birds revealed a substantial increase in the volume of lMANcoreaxon arbors between 20 d and 35 d in DF/WN birds, which contrasts markedly with the slight decrease seen between 20 d and 35 d in normal birds (Iyengar et al., 1999). Because the total number of neurons within lMAN is comparable in juvenile deaf birds and controls (Burek et al., 1991), any change in the overall volume of the lMANcore terminal field in RA likely reflects changes in individual lMANcore axon arbors within RA. One possibility is that individual axon arbors grow to encompass an expanded postsynaptic target region within RA. Another possible mechanism is that axon arbors of adjacent lMANcore arbors become mistargeted by the lack of normal auditory input, and therefore project to different subregions within RA rather than converging on the same subregion. Therefore, our results suggest that the absence of normal auditory experience during early stages of song learning prevents normal remodeling of lMANcore axon arbors in RA. By adulthood, the overall volume of the lMANcore terminal field within RA as well as the spatial pattern of connectivity seen from lMANcore to RA are comparable in deprived birds and in those birds that received normal patterns of auditory input. However, precise patterns of synaptic connectivity formed by individual lMANcore axon arbors in RA may nevertheless be abnormal in deprived adult birds compared with those in controls, which could in turn prevent the precise alignment of auditory and motor information necessary for normal vocal learning (Dave and Margoliash, 2000).
The lack of topographic organization seen in 35 d DF/WN birds suggests that auditory input may directly affect the initial restriction of axonal connections of lMANcoreneurons to different subregions of RA between 20 d and 35 d. Interestingly, RA-projecting neurons in lMANcorerespond selectively to a bird's own song (Rosen and Mooney, 2000), suggesting that auditory deprivation may act directly on these neurons to alter experience-dependent mechanisms that normally regulate the topographic organization of this projection. Alternatively, the absence of normal auditory input may indirectly affect the development of topographic organization in the lMANcore→RA circuit. Deafening or isolating juvenile birds delays the increase in levels of testosterone that normally occurs by 35 d, and lowerT levels could in turn affect topographic organization within the lMANcore→RA circuit during this period (Pröve, 1983; Adkins-Regan et al., 1990; Korsia and Bottjer, 1991; Balthazart et al., 1992; Whaling et al., 1995; White et al., 1999; Livingston et al., 2000; cf. Bottjer and Johnson, 1997; Wang et al., 1999). Interestingly, levels of testosterone increase sometime after 35 d in deprived birds to match those in normal adults (Livingston et al., 2000), which could help to guide the emergence of normal patterns of topography that we observed in adult DF/WN birds.
What does topographic organization within the lMANcore→RA circuit in male zebra finches signify? The RA contains a myotopic map of the syrinx (Vicario, 1991;Wild, 1993, 1997), and topography within the lMANcore→RA circuit may represent the organization of muscles within the syrinx (Johnson et al., 1995; Vates and Nottebohm, 1995). Topographic specificity within lMANcore may also represent complex acoustic features of the songs sung by male zebra finches, which become tuned to birds' own songs during development, or a combination of different factors important for vocal learning and auditory–motor integration (Doupe and Solis, 1997; Jarvis and Nottebohm, 1997; Jin and Clayton, 1997; Solis and Doupe, 1997; Rosen and Mooney, 2000). During early stages of song learning, juvenile swamp sparrows sing a large number of notes (subsong), of which only a small number are retained in the adult song. The morphology of individual notes as well as the temporal structure of song also become increasingly stereotyped during this period (Marler and Peters, 1982). The emergence of topographic specificity in the lMANcore→RA circuit of juvenile zebra finches may therefore signify refinement of vocal motor patterns (cf. Marler, 1991; Margoliash, 1997; Nordeen and Nordeen, 1997). Thus, vocalization itself may contribute to the emergence of overall topographic organization within the lMANcore→RA circuit, which needs to be studied independently of the effects of auditory input on this projection (cf.Nudo et al., 1996).
Topographic organization within the lMANcore→area X circuit and other neural circuits underlying song learning in deprived birds
Topographic organization within all “core” and “shell” circuits to and from lMAN other than the lMANcore→RA circuit is already established at the onset of song learning (Iyengar et al., 1999). Topographic order within the lMANcore→area X circuit, which is formed by axon collaterals of the same lMANcoreneurons that project to RA (Nixdorf-Bergweiler et al., 1995;Vates and Nottebohm, 1995), is adult-like in 20 d birds and appears not to change over the course of song learning, despite the dramatic increase in the overall volume of area X during this period (Iyengar et al., 1999; cf. Bottjer et al., 1985; E. J. Nordeen and Nordeen, 1988; K. W. Nordeen and Nordeen, 1988). Results from the present study indicate that topographic organization of the lMANcore→area X circuit is not affected by deafening or exposure to white noise. Other core and shell circuits were also not affected by these manipulations (data not shown), suggesting that the maintenance of topographic maps within the majority of the axonal connections of lMAN does not require the presence of normal auditory input in male zebra finches (cf. Bottjer, 1997; Bottjer and Arnold, 1997). However, we should reiterate that individual axon arbors and patterns of synaptic organization may be affected by depriving birds of song-related experience during the sensitive period for song learning.
The absence of topographic organization within the lMANcore→RA circuit in juvenile DF/WN birds may affect organization within other circuits as well, such as the projection between the higher vocal center (HVC) and RA that assumes increasing control of song production as vocal learning proceeds (Nottebohm et al., 1982; Akutagawa and Konishi, 1994). Individual RA neurons are contacted by axons from lMANcore as well as from HVC by 20 d in male zebra finches (Mooney and Rao, 1994; Foster and Bottjer, 1998). Lesions of lMAN in juvenile birds induce a significant decrease in the number of synapses made by HVC axon arbors onto RA neurons, indicating that lMAN can modify the HVC→RA circuit (cf. Herrmann and Arnold, 1991;Kittelberger and Mooney, 1999). The delay in the emergence of topographic organization within the lMANcore→RA circuit in DF and WN birds may therefore alter patterning of the HVC→RA circuit and thereby affect vocal behavior and song learning.
Footnotes
This research was supported by National Institutes of Health Grant DC00190. We thank Linh Ho for excellent technical assistance and Jason Zevin for assistance with the analysis of behavior and helpful comments on this manuscript.
Correspondence should be addressed to Sarah W. Bottjer, Department of Biology, Hedco Neurosciences Building 218, University of Southern California, Los Angeles, CA 90089-2520. E-mail: bottjer@usc.edu.
REFERENCES
- 1.Adkins-Regan E, Abdelnabi M, Mobarak M, Ottinger MA. Sex steroid levels in developing and adult male and female zebra finches (Poephila guttata). Gen Comp Endocrinol. 1990;78:93–109. doi: 10.1016/0016-6480(90)90051-m. [DOI] [PubMed] [Google Scholar]
- 2.Agmon A, Yang LT, O'Dowd DK, Jones EG. Organized growth of thalamocortical axons from the deep tier of terminations into layer IV of developing mouse barrel cortex. J Neurosci. 1993;13:5365–5382. doi: 10.1523/JNEUROSCI.13-12-05365.1993. [DOI] [PMC free article] [PubMed] [Google Scholar]
- 3.Agmon A, Yang LT, Jones EG, O'Dowd DK. Topological precision in the thalamic projection to neonatal mouse barrel cortex. J Neurosci. 1995;15:549–561. doi: 10.1523/JNEUROSCI.15-01-00549.1995. [DOI] [PMC free article] [PubMed] [Google Scholar]
- 4.Akutagawa E, Konishi M. Two separate areas of the brain differentially guide the development of a song control nucleus in the zebra finch. Proc Natl Acad Sci USA. 1994;91:12413–12417. doi: 10.1073/pnas.91.26.12413. [DOI] [PMC free article] [PubMed] [Google Scholar]
- 5.Balthazart J, Foidart A, Wilson EM, Ball GF. Immunocytochemical localization of androgen receptors in the male songbird and quail brain. J Comp Neurol. 1992;317:407–420. doi: 10.1002/cne.903170407. [DOI] [PubMed] [Google Scholar]
- 6.Bottjer SW. Building a bird brain: sculpting neural circuits for a learned behavior. BioEssays. 1997;19:1109–1116. [Google Scholar]
- 7.Bottjer SW, Arnold AP. Developmental plasticity in neural circuits for a learned behavior. Annu Rev Neurosci. 1997;20:459–481. doi: 10.1146/annurev.neuro.20.1.459. [DOI] [PubMed] [Google Scholar]
- 8.Bottjer SW, Johnson F. Circuits, hormones, and learning: vocal behavior in songbirds. J Neurobiol. 1997;33:602–618. doi: 10.1002/(sici)1097-4695(19971105)33:5<602::aid-neu8>3.0.co;2-8. [DOI] [PubMed] [Google Scholar]
- 9.Bottjer SW, Glaessner SL, Arnold AP. Ontogeny of brain nuclei controlling song learning and behavior in zebra finches. J Neurosci. 1985;5:1556–1562. doi: 10.1523/JNEUROSCI.05-06-01556.1985. [DOI] [PMC free article] [PubMed] [Google Scholar]
- 10.Bottjer SW, Miesner EA, Arnold AP. Changes in neuronal number, density, and size account for increases in volume of song-control nuclei during song development in zebra finches. Neurosci Lett. 1986;67:263–268. doi: 10.1016/0304-3940(86)90319-8. [DOI] [PubMed] [Google Scholar]
- 11.Bottjer SW, Brady JD, Cribbs B. Connections of a motor cortical region in zebra finches: relation to pathways for vocal learning. J Comp Neurol. 2000;420:244–260. [PubMed] [Google Scholar]
- 12.Burek MJ, Nordeen KW, Nordeen EJ. Neuron loss and addition in developing zebra finch song nuclei are independent of auditory experience during song learning. J Neurobiol. 1991;22:215–223. doi: 10.1002/neu.480220302. [DOI] [PubMed] [Google Scholar]
- 13.Catalano SM, Robertson RT, Killackey HP. Early ingrowth of thalamocortical afferents to the neocortex of the prenatal rat. Proc Natl Acad Sci USA. 1991;88:2999–3003. doi: 10.1073/pnas.88.8.2999. [DOI] [PMC free article] [PubMed] [Google Scholar]
- 14.Cline HT. Activity-dependent plasticity in the visual systems of frogs and fish. Trends Neurosci. 1991;14:104–111. doi: 10.1016/0166-2236(91)90071-2. [DOI] [PubMed] [Google Scholar]
- 15.Crair MC, Gillespie DC, Stryker MP. The role of visual experience in the development of columns in cat visual cortex. Science. 1998;279:566–570. doi: 10.1126/science.279.5350.566. [DOI] [PMC free article] [PubMed] [Google Scholar]
- 16.Crowley JC, Katz LC. Development of ocular dominance columns in the absence of retinal input. Nat Neurosci. 1999;2:1125–1130. doi: 10.1038/16051. [DOI] [PubMed] [Google Scholar]
- 17.Crowley JC, Katz Early development of ocular dominance columns. Science. 2000;290:1321–1324. doi: 10.1126/science.290.5495.1321. [DOI] [PubMed] [Google Scholar]
- 18.Cynx J. Experimental determination of a unit of song production in the zebra finch (Taeniopygia guttata). J Comp Psychol. 1990;104:3–10. doi: 10.1037/0735-7036.104.1.3. [DOI] [PubMed] [Google Scholar]
- 19.Dave AS, Margoliash D. Song replay during sleep and computational rules for sensorimotor vocal learning. Science. 2000;290:812–816. doi: 10.1126/science.290.5492.812. [DOI] [PubMed] [Google Scholar]
- 20.Doupe AJ, Solis MM. Song- and order-selective neurons develop in the songbird anterior forebrain during vocal learning. J Neurobiol. 1997;33:694–709. [PubMed] [Google Scholar]
- 21.Feldman DE, Knudsen EI. An anatomical basis for visual calibration of the auditory space map in the barn owl's midbrain. J Neurosci. 1997;17:6820–6837. doi: 10.1523/JNEUROSCI.17-17-06820.1997. [DOI] [PMC free article] [PubMed] [Google Scholar]
- 22.Foster EF, Bottjer SW. Axonal connections of the high vocal center and surrounding cortical regions in juvenile and adult male zebra finches. J Comp Neurol. 1998;397:118–138. [PubMed] [Google Scholar]
- 23.Goodman C, Shatz CJ. Developmental mechanisms that generate precise patterns of neuronal connectivity. [Suppl] Cell. 1993;10:77–98. doi: 10.1016/s0092-8674(05)80030-3. [DOI] [PubMed] [Google Scholar]
- 24.Hall MF. Evolutionary aspects of estrildid song. Symp Zoolog Soc Lond. 1962;8:37–55. [Google Scholar]
- 25.Herrmann K, Arnold AP. The development of afferent projections to the robust archistriatal in male zebra finches: a quantitative electron microscopic study. J Neurosci. 1991;11:2063–2074. doi: 10.1523/JNEUROSCI.11-07-02063.1991. [DOI] [PMC free article] [PubMed] [Google Scholar]
- 26.Herrmann K, Bischof HJ. Delayed development of song control nuclei in the zebra finch is related to behavioral development. J Comp Neurol. 1986;245:167–175. doi: 10.1002/cne.902450204. [DOI] [PubMed] [Google Scholar]
- 27.Iyengar S, Viswanathan SS, Bottjer SW. Development of topography within song control circuitry of zebra finches during the sensitive period for song learning. J Neurosci. 1999;19:6037–6057. doi: 10.1523/JNEUROSCI.19-14-06037.1999. [DOI] [PMC free article] [PubMed] [Google Scholar]
- 28.Jarvis ED, Nottebohm F. Motor-driven gene expression. Proc Natl Acad Sci USA. 1997;94:4097–4102. doi: 10.1073/pnas.94.8.4097. [DOI] [PMC free article] [PubMed] [Google Scholar]
- 29.Jin H, Clayton DF. Localized changes in immediate-early gene regulation during sensory and motor learning in zebra finches. Neuron. 1997;19:1049–1059. doi: 10.1016/s0896-6273(00)80396-7. [DOI] [PubMed] [Google Scholar]
- 30.Johnson F, Sablan MM, Bottjer SW. Topographic organization of a forebrain pathway involved with vocal learning in zebra finches. J Comp Neurol. 1995;358:260–278. doi: 10.1002/cne.903580208. [DOI] [PubMed] [Google Scholar]
- 31.Kirn JR, DeVoogd TJ. Genesis and death of vocal control neurons during sexual differentiation in the zebra finch. J Neurosci. 1989;9:3176–3187. doi: 10.1523/JNEUROSCI.09-09-03176.1989. [DOI] [PMC free article] [PubMed] [Google Scholar]
- 32.Kittelberger JM, Mooney R. Lesions of an avian forebrain nucleus that disrupt song development alter synaptic connectivity and transmission in the vocal premotor pathway. J Neurosci. 1999;19:9385–9398. doi: 10.1523/JNEUROSCI.19-21-09385.1999. [DOI] [PMC free article] [PubMed] [Google Scholar]
- 33.Knudsen EI. Supervised learning in the brain. J Neurosci. 1994;14:3985–3997. doi: 10.1523/JNEUROSCI.14-07-03985.1994. [DOI] [PMC free article] [PubMed] [Google Scholar]
- 34.Knudsen EI. Capacity for plasticity in the adult owl auditory system expanded by juvenile experience. Science. 1998;279:1531–1533. doi: 10.1126/science.279.5356.1531. [DOI] [PubMed] [Google Scholar]
- 35.Konishi M. The role of auditory feedback in the control of vocalization in the white-crowned sparrow. Z Tierpsychol. 1965;22:770–783. [PubMed] [Google Scholar]
- 36.Konishi M, Akutagawa E. Neuronal growth, atrophy, and death in a sexually dimorphic song nucleus in the zebra finch brain. Nature. 1985;315:145–147. doi: 10.1038/315145a0. [DOI] [PubMed] [Google Scholar]
- 37.Korsia S, Bottjer SW. Chronic testosterone treatment impairs vocal learning in male zebra finches during a restricted period of development. J Neurosci. 1991;11:2362–2371. doi: 10.1523/JNEUROSCI.11-08-02362.1991. [DOI] [PMC free article] [PubMed] [Google Scholar]
- 38.Livingston F, White SA, Mooney R. Slow NMDA-EPSCs at synapses critical for song development are not required for song learning in zebra finches. Nat Neurosci. 2000;3:482–488. doi: 10.1038/74857. [DOI] [PubMed] [Google Scholar]
- 39.Margoliash D. Functional organization of forebrain pathways for song production and perception. J Neurobiol. 1997;33:671–693. doi: 10.1002/(sici)1097-4695(19971105)33:5<671::aid-neu12>3.0.co;2-c. [DOI] [PubMed] [Google Scholar]
- 40.Marler P. Song-learning behavior: the interface with neuroethology. Trends Neurosci. 1991;14:199–206. doi: 10.1016/0166-2236(91)90106-5. [DOI] [PubMed] [Google Scholar]
- 41.Marler P, Peters S. Developmental overproduction and selective attrition: new processes in the epigenesis of birdsong. Dev Psychobiol. 1982;15:369–378. doi: 10.1002/dev.420150409. [DOI] [PubMed] [Google Scholar]
- 42.Marler P, Waser MS. Role of auditory feedback in canary song development. J Comp Physiol Psychol. 1977;91:8–16. doi: 10.1037/h0077303. [DOI] [PubMed] [Google Scholar]
- 43.Marler P, Konishi M, Lutjen A, Waser MS. Effects of continuous noise on avian hearing and vocal development. Proc Natl Acad Sci USA. 1973;70:1393–1396. doi: 10.1073/pnas.70.5.1393. [DOI] [PMC free article] [PubMed] [Google Scholar]
- 44.Mooney R, Rao M. Waiting periods versus early innervation: the development of axonal connections in the zebra finch song system. J Neurosci. 1994;14:6532–6543. doi: 10.1523/JNEUROSCI.14-11-06532.1994. [DOI] [PMC free article] [PubMed] [Google Scholar]
- 45.Morris D. The reproductive behavior of the zebra finch (Poephila guttata) with special reference to pseudofemale behavior and displacement activities. Behavior. 1954;7:1–31. [Google Scholar]
- 46.Nakamura H, O'Leary DD. Inaccuracies in initial growth and arborization of chick retinotectal axons followed by course corrections and axon remodeling to develop topographic order. J Neurosci. 1989;9:3776–3795. doi: 10.1523/JNEUROSCI.09-11-03776.1989. [DOI] [PMC free article] [PubMed] [Google Scholar]
- 47.Nixdorf-Bergweiler BE, Lips MB, Heinemann U. Electrophysiological and morphological evidence for a new projection of LMAN-neurones toward area X. NeuroReport. 1995;6:1729–1732. doi: 10.1097/00001756-199509000-00006. [DOI] [PubMed] [Google Scholar]
- 48.Nordeen EJ, Nordeen KW. Sex and regional differences in the incorporation of neurons born during song learning in zebra finches. J Neurosci. 1988;8:2869–2874. doi: 10.1523/JNEUROSCI.08-08-02869.1988. [DOI] [PMC free article] [PubMed] [Google Scholar]
- 49.Nordeen EJ, Grace A, Burek MJ, Nordeen KW. Sex-dependent loss of projection neurons involved in avian song learning. J Neurobiol. 1992;23:671–679. doi: 10.1002/neu.480230606. [DOI] [PubMed] [Google Scholar]
- 50.Nordeen KW, Nordeen EJ. Projection neurons within a vocal motor pathway are born during song learning in zebra finches. Nature. 1988;334:149–151. doi: 10.1038/334149a0. [DOI] [PubMed] [Google Scholar]
- 51.Nordeen KW, Nordeen EJ. Auditory feedback is necessary for the maintenance of stereotyped song in adult zebra finches. Behav Neural Biol. 1992;57:58–66. doi: 10.1016/0163-1047(92)90757-u. [DOI] [PubMed] [Google Scholar]
- 52.Nordeen KW, Nordeen EJ. Anatomical and synaptic substrates for avian song learning. J Neurobiol. 1997;33:532–548. doi: 10.1002/(sici)1097-4695(19971105)33:5<532::aid-neu4>3.0.co;2-5. [DOI] [PubMed] [Google Scholar]
- 53.Nottebohm F. Auditory experience and song development in the chaffinch Fringilla coelebs. Ibis. 1968;110:549–568. [Google Scholar]
- 54.Nottebohm F, Kelley DB, Paton JA. Connections of vocal control nuclei in the canary telencephalon. J Comp Neurol. 1982;207:344–357. doi: 10.1002/cne.902070406. [DOI] [PubMed] [Google Scholar]
- 55.Nudo RJ, Milliken GW, Jenkins WM, Merzenich MM. Use-dependent alterations of movement representations in primary motor cortex of adult squirrel monkeys. J Neurosci. 1996;16:785–807. doi: 10.1523/JNEUROSCI.16-02-00785.1996. [DOI] [PMC free article] [PubMed] [Google Scholar]
- 56.O'Leary DD, Cowan WM. Topographic organization of certain tectal afferent and efferent connections can develop normally in the absence of retinal input. Proc Natl Acad Sci USA. 1983;80:6131–6135. doi: 10.1073/pnas.80.19.6131. [DOI] [PMC free article] [PubMed] [Google Scholar]
- 57.Price PH. Developmental determinants of structure in zebra finch song. J Comp Physiol Psychol. 1979;93:260–277. [Google Scholar]
- 58.Pröve E. Hormonal correlates of behavioural development in male zebra finches. In: Balthazart J, Prove E, Gilles R, editors. Hormones and behavior in higher vertebrates. Springer; Berlin: 1983. pp. 368–374. [Google Scholar]
- 59.Rosen MJ, Mooney R. Intrinsic and extrinsic contributions to auditory selectivity in a song nucleus critical for vocal plasticity. J Neurosci. 2000;20:5437–5448. doi: 10.1523/JNEUROSCI.20-14-05437.2000. [DOI] [PMC free article] [PubMed] [Google Scholar]
- 60.Roskies A, Friedman GC, O'Leary DD. Mechanisms and molecules controlling the development of retinal maps. Perspect Dev Neurobiol. 1995;3:63–75. [PubMed] [Google Scholar]
- 61.Ryals BM, Dooling RJ, Westbrook E, Dent ML, MacKenzie A, Larsen ON. Avian species differences in susceptibility to noise exposure. Hear Res. 1999;131:71–88. doi: 10.1016/s0378-5955(99)00022-2. [DOI] [PubMed] [Google Scholar]
- 62.Scharff C, Nottebohm F. A comparative study of the behavioral deficits following lesions of various parts of the zebra finch song system: implications for vocal learning. J Neurosci. 1991;11:2896–2913. doi: 10.1523/JNEUROSCI.11-09-02896.1991. [DOI] [PMC free article] [PubMed] [Google Scholar]
- 63.Scharff C, Kirn JR, Grossman M, Macklis JD, Nottebohm F. Targeted neuronal death affects neuronal replacement and vocal behavior in adult songbirds. Neuron. 2000;25:481–492. doi: 10.1016/s0896-6273(00)80910-1. [DOI] [PubMed] [Google Scholar]
- 64.Simon DK, O'Leary DDM. Limited topographic specificity in the targeting and branching of mammalian retinal axons. Dev Biol. 1990;137:125–134. doi: 10.1016/0012-1606(90)90013-9. [DOI] [PubMed] [Google Scholar]
- 65.Simon DK, O'Leary DDM. Influence of position along the medial-lateral axis of the superior colliculus on the topographic targeting and survival of retinal axons. Brain Res Dev Brain Res. 1992;69:167–172. doi: 10.1016/0165-3806(92)90155-p. [DOI] [PubMed] [Google Scholar]
- 66.Solis MM, Doupe AJ. Anterior forebrain neurons develop selectivity by an intermediate stage of birdsong learning. J Neurosci. 1997;17:6447–6462. doi: 10.1523/JNEUROSCI.17-16-06447.1997. [DOI] [PMC free article] [PubMed] [Google Scholar]
- 67.Sossinka R, Böhner J. Song types in the zebra finch (Poephila guttata-castanotis). Z Tierpsychol. 1980;53:123–132. [Google Scholar]
- 68.Tessier-Lavigne M, Goodman CS. The molecular biology of axon guidance. Science. 1996;274:1123–1133. doi: 10.1126/science.274.5290.1123. [DOI] [PubMed] [Google Scholar]
- 69.Udin SB. The role of visual experience in the formation of binocular projections in frogs. Cell Mol Neurobiol. 1985;5:85–102. doi: 10.1007/BF00711087. [DOI] [PubMed] [Google Scholar]
- 70.Vates GE, Nottebohm F. Feedback circuitry within a song-learning pathway. Proc Natl Acad Sci USA. 1995;92:5139–5143. doi: 10.1073/pnas.92.11.5139. [DOI] [PMC free article] [PubMed] [Google Scholar]
- 71.Vicario DS. Organization of the zebra finch song control system. II. Functional organization of outputs from nucleus Robustus archistriatalis. J Comp Neurol. 1991;309:486–494. doi: 10.1002/cne.903090405. [DOI] [PubMed] [Google Scholar]
- 72.Wallhaüsser-Franke E, Nixdorf-Bergweiler BE, DeVoogd TJ. Song isolation is associated with maintaining high spine frequencies on zebra finch lMAN neurons. Neurobiol Learn Mem. 1995;64:25–35. doi: 10.1006/nlme.1995.1041. [DOI] [PubMed] [Google Scholar]
- 73.Wang N, Aviram R, Kirn JR. Deafening alters neuron turnover within the telencephalic motor pathway for song control in adult zebra finches. J Neurosci. 1999;19:10554–10561. doi: 10.1523/JNEUROSCI.19-23-10554.1999. [DOI] [PMC free article] [PubMed] [Google Scholar]
- 74.Weliky M, Katz LC. Disruption of orientation tuning in visual cortex by artificially correlated neuronal activity. Nature. 1997;386:680–685. doi: 10.1038/386680a0. [DOI] [PubMed] [Google Scholar]
- 75.Whaling CS, Nelson DA, Marler P. Testosterone-induced shortening of the storage phase of song development in birds interferes with vocal learning. Dev Psychobiol. 1995;28:367–376. doi: 10.1002/dev.420280703. [DOI] [PubMed] [Google Scholar]
- 76.White SA, Livingston FS, Mooney R. Androgens modulate NMDA receptor-mediated EPSCs in the zebra finch song system. J Neurophysiol. 1999;82:2221–2234. doi: 10.1152/jn.1999.82.5.2221. [DOI] [PubMed] [Google Scholar]
- 77.Wild JM. The avian nucleus retroambigualis: a nucleus for breathing, singing, and calling. Brain Res. 1993;606:319–324. doi: 10.1016/0006-8993(93)91001-9. [DOI] [PubMed] [Google Scholar]
- 78.Wild JM. Neural pathways for the control of birdsong production. J Neurobiol. 1997;33:653–670. doi: 10.1002/(sici)1097-4695(19971105)33:5<653::aid-neu11>3.0.co;2-a. [DOI] [PubMed] [Google Scholar]
- 79.Young SR, Rubel EW. Embryogenesis of arborization pattern and topography of individual axons in N. laminaris of the chicken brain stem. J Comp Neurol. 1986;254:425–459. doi: 10.1002/cne.902540402. [DOI] [PubMed] [Google Scholar]
- 80.Zann R. Song and call learning in wild zebra finches in south-east Australia. Anim Behav. 1990;40:811–828. [Google Scholar]
- 81.Zann RA. Vocalizations. In: Perrins CM, editor. The zebra finch. A synthesis of field and laboratory studies. Oxford UP; New York: 1996. pp. 196–247. [Google Scholar]
- 82.Zevin JD, Seidenberg MS, Bottjer SW. Song plasticity in adult zebra finches exposed to white noise. Soc Neurosci Abstr. 2000;26:723. doi: 10.1523/JNEUROSCI.1891-04.2004. [DOI] [PMC free article] [PubMed] [Google Scholar]