

Abstract
γ (30–70 Hz) followed by β (10–30 Hz) oscillations are evoked in humans by sensory stimuli and may be involved in working memory. Phenomenologically similar γ→β oscillations can be evoked in hippocampal slices by strong two-site tetanic stimulation. Weaker stimulation leads only to two-site synchronized γ. In vitro oscillations have memory-like features: (1) EPSPs increase during γ→β; (2) after a strong one-site stimulus, two-site stimulation produces desynchronized γ; and (3) a single synchronized γ→β epoch allows a subsequent weak stimulus to induce synchronized γ→β. Features 2 and 3 last >50 min and so are unlikely to be caused by presynaptic effects. A previous model replicated the γ→β transition when it was assumed that K+ conductance(s) increases and there is an ad hoc increase in pyramidal EPSCs. Here, we have refined the model, so that both pyramidal→pyramidal and pyramidal→interneuron synapses are modifiable. This model, in a self-organized way, replicates the γ→β transition, along with features 1 and 2 above. Feature 3 is replicated if learning rates, or the time course of K+ current block, are graded with stimulus intensity. Synaptic plasticity allows simulated oscillations to synchronize between sites separated by axon conduction delays over 10 msec. Our data suggest that one function of γ oscillations is to permit synaptic plasticity, which is then expressed in the form of β oscillations. We propose that the period of γ oscillations, ∼25 msec, is “designed” to match the time course of [Ca2+]i fluctuations in dendrites, thus facilitating learning.
Keywords: Hebbian synapses, 40 Hz, synchronization, EEG, learning, memory
The generation of β (10–30 Hz) oscillations in cortical structures appears to be inextricably linked with the generation of γ (30–70 Hz) oscillations. Examples in human EEGs are as follows. (1) “Evoked” gamma, followed by β, is induced by auditory stimuli (Haenschel et al., 2000). As in vitro (Doheny et al., 2000), the β component is strongest in response to novel stimuli, whereas the γ component habituates. (2) γ, mixed with β, appears after exposure to a visual stimulus that needs to be remembered briefly (Tallon-Baudry et al., 1999). (3) In response to pictures or words, there is increased temporal/parietal coherence of EEG activity in the 13–18 Hz band (von Stein et al., 1999).
In vitro models may provide clues to the mechanism and function of in vivo γ/β oscillations. In the CA1 region of rat hippocampal slices, γ/β oscillations, lasting seconds, are most readily induced by two-site stimulation (Whittington et al., 1997a). β requires that the stimulus be sufficiently strong, so that pyramidal cells and interneurons remain depolarized enough to fire (Faulkner et al., 1999). Interneurons then continue to fire a network γ, whereas pyramidal cells skip beats, switching to β frequency, because of increased afterhyperpolarizations (AHPs) (Whittington et al., 1997a). Pyramidal cells must skip, on average, the same beats of the underlying γ, which is favored by increasing recurrent EPSPs between pyramidal cells (Whittington et al., 1997a).
Given that β oscillations in vivo may play a role in working memory (Tallon-Baudry et al., 1998), it is interesting thatin vitro γ/β oscillations have two “memory-like” features, lasting for >50 min (Whittington et al., 1997a). (1) Strong stimulation at a single site, applied once, has a lasting interference on the ability of subsequent two-site stimulation to induce synchronous γ. (2) Two-site weak stimulation normally induces only two-site synchronized γ, not followed by synchronized β. Nevertheless, if a single instance of strong two-site stimulation is delivered, which induces two-site synchronized γ/β, then, subsequently, two-site weak stimulation also induces two-site synchronized γ/β. The long duration of these effects makes it unlikely that they depend on presynaptic mechanisms.
In this paper, we postulate that excitatory synaptic conductances modify during the course of an oscillation, a reasonable assumption given the observed Hebbian “learning rules” for CA3 recurrent pyramidal→pyramidal and pyramidal→interneuron synaptic connectionsin vitro (Debanne et al., 1994, 1998; Laezza et al., 1999). We use a two-threshold LTP/LTD learning rule (Cormier et al., 2001) embedded into a large network model of multicompartment neurons. Our learning rule does not depend on the time-order of presynaptic and postsynaptic spiking. Although this is important in two-cell experiments (Markram et al., 1997; Bi and Poo, 1998), it does not seem necessary in network oscillations under the conditions that we consider. The learning rule depends on presynaptically induced, and postsynaptic voltage-dependentgCa-induced, [Ca2+]i signals, which decay with time constants in the tens of milliseconds up to 100 msec. The model can replicate both the structure of γ/β and, with some additional testable assumptions, also the memory-like features.
MATERIALS AND METHODS
Simulation methods
The general model principles are as in Traub et al. (1999), with the major difference that certain synapses (from pyramidal cells to other pyramidal cells, and to interneurons) are modifiable, in Hebbian fashion, on the time scale of the oscillations, i.e., tens to hundreds of milliseconds. Such a network property was motivated by earlier simulations (Bibbig, 1999, 2000) in networks of integrate-and-fire neurons, as well as by certain recent experimental data (see Results and Discussion). In addition, the present model has fewer neurons than before (to allow more simulations), and the connectivity is somewhat more realistic.
We chose to use a network model with relatively detailed (multicompartment) models of neurons and synapses for these reasons. (1) Past experience (Traub et al., 1996b, 1999) has shown that detailed models are the most useful for making specific biological predictions. The results are easy to compare with electrophysiological recordings, and quantitative parameters, as they become available, are most readily incorporated into such models. (2) At the same time, it is our opinion that the conceptual complexity of the detailed models is not necessarily more extreme than that of simpler network models (although it can be), despite the vastly larger number of parameters that go into describing the properties of “detailed” neurons. Not only are many of these parameters known experimentally, but the physical principles in the collective behavior of a network are often no harder to grasp in the detailed model than in the simpler one. We do believe, however, that there is still an important role for network simulations using simpler neuron models, such as integrate-and-fire neurons; it was simulations of such networks that gave rise to many of the ideas explored in this paper. Even then, it was not obvious beforehand that learning principles that work in a network of integrate-and-fire neurons would also work in a more complex network of synaptically interconnected multicompartment neurons.
Condensed description of the present model
Overall network structure. The network contains 768 pyramidal cells (excitatory cells, or “e-cells”) and 384 interneurons (“i-cells”). The pyramidal cells are arranged into a 96 × 8 array. The long axis has a lattice spacing of 20 μm, and so 96 × 20 μm = 1.92 mm of extent along CA1 stratum pyramidale is represented. The interneurons are arranged in four 96-cell rows, overlapping the e-cell array. Each row of i-cells represents a type of interneuron, distinguished by its postsynaptic connectivity. When, in Results, we speak of the “left half” and “right half” of the array, we mean that the array is split into two halves along its long (96-cell) axis.
Individual neuronal properties; addition of M-current. Each e-cell is a multicompartment object (64 soma–dendritic compartments and 5 axonal ones), with fast gNa, high-threshold gCa, C-type K+ conductance (voltage and Ca2+-dependent), delayed rectifiergK(DR), and a slow Ca2+-dependent AHP K+ conductance, as described in Traub et al. (1994). As in Traub et al. (1999), the density ofgCa has been reduced twofold with respect to the original model, to suppress bursting, which is not seen during γ/β oscillations. An M-type voltage-dependent K+ conductance has been added, because of its contribution to medium-duration AHPs and to firing accommodation (Madison and Nicoll, 1984; Dutar and Nicoll, 1988) and its block, along with slower AHPs, by metabotropic glutamate receptors (Charpak et al., 1990). M-conductance was confined to the soma and proximal basal and apical dendrites. In a particular compartment, the value of the M-conductance was described by this equation:
| Equation 1 |
In Equation 1, m is a Hodgkin-Huxley-like activation variable. The forward rate function α(V) was, in inverse milliseconds and with V referred to resting potential (defined as 0 mV), equal to 0.02/(1 + exp((40 −V)/5)), and the backward rate function β(V) was 0.01 exp ((17 −V)/18). The scaling constant in Equation 1 was time dependent (see below). [All other kinetic parameters were as inTraub et al. (1994).]
Each i-cell is also a multicompartment object (46 soma–dendritic compartments and 5 axonal ones), with multiple ionic conductances, as for e-cells, although without gK(M)(Traub and Miles, 1995). Dendrites were electrically active (Traub and Miles, 1995; Martina et al., 2000).
[Ca2+]i dynamics in these model neurons follows a simple first-order kinetic scheme, with updating of the variables every 0.25 msec (i.e., every 100 integration steps, each of which is 2.5 μsec). Thus, in each compartment, expressing concentration in arbitrary units:
| Equation 2 |
In dendritic compartments, τCa was 20 msec (cf. Miyakawa et al., 1992; B. Sabatini and K. Svoboda, personal communication) (we call this time constant “τpost”). A similar scheme was used to simulate [Ca2+]igenerated by presynaptic activity; in the case in which the postsynaptic cell is a pyramidal cell, this can be thought of as the synaptically mediated component of spine [Ca2+]i, although the spines themselves were not modeled explicitly. Thus, the program checks when an axonal spike reaches the point of connection between each pair of presynaptic and postsynaptic cells, allowing for axonal conduction delays. If a spike just reaches this site, “ICa” was defined to be 1 (units arbitrary) and otherwise to be 0. Equation 2 was applied at each synaptic connection, using τCa = “τpre” = 25 or 100 msec (Koester and Sakmann, 1998). Note that the model does not simulate, in an explicit way, the effects of metabotropic glutamate receptors, acting via second messenger pathways, on [Ca2+]i (Nakamura et al., 1999, 2000; Pozzo-Miller et al., 2000), but simulates only voltage-dependent effects. We are assuming, as a first approximation, that the metabotropic influence produces a tonic background [Ca2+]i on which voltage-dependent changes are superimposed.
Synaptic connectivity. Each pyramidal cell contacts exactly 30 others, forming a contact with a single compartment in basal dendrites; the probability of connection decreases exponentially with a space constant of 1 mm along the long axis of the array. Each pyramidal cell contacts interneurons, again with probability falling off with 1 mm space constant and with density so that any interneuron was excited by 150 pyramidal cells. Contacts were to single compartments in the dendrites. [In Traub et al. (1999), pyramidal cell connectivity was globally random and did not fall off with distance, but this scheme does not appear to be consistent with data of Csicsvári et al. (1998).]
As in Traub et al. (1999), each pyramidal cell receives input from 80 interneurons, 20 from the interneurons of the first row (“basket cells”), 20 from interneurons of the second row (“axo-axonic cells”), 20 from i-cells of the third row (“bistratified cells”), and 20 from i-cells of the fourth row (“o/lm cells”). Interneurons receive the same number of inputs from other interneurons, as do pyramidal cells, with the exception that interneurons are not contacted by axo-axonic cells. Basket cells contact uniformly the soma and most proximal dendrites of pyramidal cells and dendrites of interneurons. Axo-axonic cells contact the initial segment (most proximal axonal compartment) of pyramidal cells. Bistratified cells and o/lm cells contact the dendrites of pyramidal cells and interneurons. The axons of interneurons are constrained to run no farther than 25 cell diameters (500 μm) along the long axis of the array; within this domain, interneuron connection probabilities are uniform.
Synaptic actions. AMPA- and GABAA-receptor-mediated synaptic connections were simulated. A unitary synaptic conductance was switched on when (1) the most distal axonal compartment of the presynaptic neuron was depolarized ≥70 mV from the rest, and no such depolarization has occurred in the last 4 msec, and (2) a signal propagated, over a delay line representing axonal conduction delay, from the axonal compartment to the postsynaptic neuron. The general form of a unitary e→e synaptic conductance wasce→et exp (−t/2), wheret is the time in milliseconds, andce→eis a scaling parameter; for unitary e→i synaptic conductance it wasce→it exp (−t). The scaling parametersce→eandce→idepend on learning in a manner described below.
The general form of a unitary IPSC wasciexp(−t/10). Default values ofci were as follows: basket cell→pyramidal cell, 1.6 nS; basket cell→interneuron, 2.3 nS; axo-axonic cell→pyramidal cell, 1.6 nS; bistratified or o/lm cell→pyramidal cell, 1.6 nS; bistratified or o/lm cell→interneuron, 0.23 nS. In simulations of the effects of morphine, smaller values ofci were used (Madison and Nicoll, 1988).
Stimulation conditions. As before (Traub et al., 1999), oscillations were evoked by applying tonic “metabotropic” conductances to dendrites of principal cells and interneurons (Whittington et al., 1997b). The reversal potential of this conductance was 60 mV positive to resting potentials. Interneurons received a conductance of 4.0–4.2 nS. For pyramidal cells, “low heterogeneity” and “high heterogeneity” conditions were used on different occasions. In the former, the maximum tonic conductance was 75.0–77.5 nS; in the latter, it was 75.0–82.5 nS. In some cases, stimulation was applied only to half of the array. Details are specified in Results. The tonic excitatory conductance to pyramidal cells was time dependent, starting at 0 at time 0, rising to its maximum over 100 msec (Whittington et al., 1997b), staying constant for the next 700 msec, and then declining linearly with time to 55% of the maximum value, agreeing qualitatively with experimental data (Whittington et al., 1997b).
Time-varying maximal K+ conductances. As in the previous study (Traub et al., 1999), and as motivated by experimental observations (Whittington et al., 1997a), certain K+ conductances are presumed to be suppressed at the beginning of the tetanically elicited γ oscillation and then to recover during the course of γ and into β. In this study, time-varying K+ conductances weregK(M) andgK(AHP). To define the value ofgK(M) density in each compartment, the scaling constant in Equation 1 was varied as follows: it was 0.25 for time ≤250 msec, grew linearly with time to 1.3 over the interval 250–1000 msec, and then stayed at 1.3. To definegK(AHP) density, the reference value as used in Traub et al. (1994) was used, but it was also multiplied by a time-dependent scaling constant. This scaling constant was 0.25 for time ≤250 msec, usually grew linearly with time to 1.25 over the interval 250–1000 msec, and then stayed at 1.25. In some cases, both of the scaling constants grew linearly with time to 1.3 and 1.25, respectively, over the interval 250–500 msec, and then stayed fixed.
It should be noted that metabotropic glutamate receptors depress K+ conductances via a G-protein-dependent pathway, whereas the metabotropic slow EPSP is mediated by a G-protein-independent process, involving an Src-family protein tyrosine kinase (Guérineau et al., 1994; Heuss et al., 1999); thus, these two parameters, EPSC and K+ conductances, in principle could be independently regulated.
Learning. As noted above, e→e synapses and e→i synapses are modifiable during the course of a simulated oscillation. The general rules for this modification, which is “Hebbian” in the sense of depending on correlations between presynaptic and postsynaptic activity, are as follows.
(1)ce→eandce→i, the scaling constants for e→e and e→i synaptic connections, respectively, can assume independent values at each synaptic connection, not depending on values assumed at other connections (apart from the initial conditions).
(2) The program sets initial values and maximum values for the scaling constants. The minimum values are 0. Initial values arece→e= 0.3 nS andce→i= 1.0 nS. Maximum values arece→e= 7.5 nS andce→i= 3.0 nS.
(3) The signals used to “integrate” presynaptic and postsynaptic activity, and hence used to determine whether synaptic conductances increase, decrease, or remain fixed over some time interval, are [Ca2+]iconcentrations. The “presynaptic” signal can be thought of as a local [Ca2+]isignal gated by a presynaptic action potential and might correspond (in the case of a pyramidal cell) to the [Ca2+]i rise in the spine induced by presynaptic activity. The “postsynaptic” signal can be thought of as a localized [Ca2+]i signal induced by voltage-dependent activity in the postsynaptic cell, in basal dendrites (for pyramidal cells), or in selected portions of the dendrites (for interneurons). The equations governing [Ca2+]i dynamics were described above. The postsynaptic signal used was not [Ca2+]i in the individual dendritic compartment on which the synapse was located; rather, the total value of [Ca2+]i was used, summing over compartments on which excitatory synapses could be located. This spatial averaging was done to smooth over wide differences in peak [Ca2+]i values that could occur at different dendritic locations. Consideration of each separate [Ca2+]i signal would have introduced impractically many parameters into the system, because each dendritic compartment, in principle, might have needed its own values of the learning thresholds (see below). In addition, it should be noted that somatic spikes propagated, in our model, to all compartments in the basal dendrites with little decrement. We did not explicitly simulate the release of [Ca2+]i from internal stores or the actions of metabotropic glutamate receptors on [Ca2+]idynamics.
(4) Learning began 175 msec into the simulation, to allow equilibration of the system.
(5) The learning code was executed once per millisecond. It used a two-threshold rule formally similar to (but not identical to) that used by other authors (Bienenstock et al., 1982; Artola et al., 1990). Thus, fixed postsynaptic and presynaptic thresholds were set at the beginning of the program, Tpost andTpre, equal to 75 and to 1.0, respectively (units arbitrary). If both presynaptically gated and postsynaptic [Ca2+]i signals were above their respective threshold values, then the appropriate scaling constant was increased by a preset “up” value. If one of the [Ca2+]isignals, but not the other, was above its respective threshold, then the appropriate scaling constant was decreased by a preset “down” value. If both [Ca2+]i signals were below the respective thresholds, then the scaling constant was not changed. Specific choices most often used for the up and down values were these:ce→eup, 18.75 pS;ce→edown, 1.875 pS;ce→iup, 6.0 pS;ce→idown, 0.6 pS. Other choices were also tried, particularly when the time constants for relaxation of [Ca2+]i were varied. Suitable values for Tpost andTpre were found after extensive trial simulations.
(6) An alternative learning rule was sometimes used for e→i synaptic modification, intended to emulate use-dependent removal of polyamine block of AMPA receptors (Rozov et al., 1998). In this case, opening of AMPA receptors on interneurons, induced by transmitter binding, leads to detachment of a molecule from the receptor, a molecule the presence of which would lower channel conductance. The binding of the transmitter, glutamate, is determined, of course, by presynaptic firing. Thus, the presynaptic signal to be used in the learning rule does not correspond to synaptically induced changes in [Ca2+]i but rather to the extent of AMPA receptor-gated channel opening. The signal was constructed formally in the same way as described above (Eq. 2 and after), only with a decay time constant of 1 msec rather than 25 msec, approximating the kinetics of AMPA receptor-gated conductance in interneurons (Geiger et al., 1995). Specifically, let us call the presynaptic signal in the present case “AMPA-gated.” Then:
| Equation 3 |
As for the usual learning rule,ICa,pre equals 1 when a spike reaches the presynaptic terminal and otherwise is 0.
In such a case, when polyamine block at e→i synapses is being simulated, the learning parameters were changed:Tpre was set to 0.1 (because the channel is open now only a small fraction of the time, and a low threshold is necessary for potentiation to occur at all), andTpost was set to 0, making synaptic modification solely dependent on presynaptic firing, i.e., on glutamate release (Rozov et al., 1998).ce→iup was 15 pS, andce→idown was 0.3 pS. (Note that the presynaptic signal is not identical in time course to a unitary EPSC, but with synaptic modifications occurring only once per millisecond, it is accurate enough for our purposes.)
(7) We did not try an analogous presynaptic learning rule for synapses between pyramidal cells for two reasons. First, [Ca2+] imaging data (Yuste and Denk, 1995) are consistent with a Hebbian mechanism. Second, the effects of intense tissue stimulation on oscillations, effects that appear to be mediated at least in part by changes in synaptic strength, last for tens of minutes (Whittington et al., 1997a); this makes a presynaptic mechanism unlikely.
Some relevant characteristics of the learning algorithm, for the case τpre = 25 msec and τpost = 20 msec, are shown in Figure1. Of note are several features. First, the time constants of [Ca2+]i decay in the model, 20–25 msec, are taken to represent what we presume to be the fastest decay time constant of this signal in dendrites (Miyakawa et al., 1992; Sabatini and Svoboda, personal communication); other, slower time constants are also present (Koester and Sakmann, 1998; Majewska et al., 2000; Schwartz and Alford, 2000). [In some cases, therefore, we also used τpre or τpost (or both) = 100 msec at e→e connections.] Second, the fraction of time that a [Ca2+]i signal spends above threshold is influenced by firing rate (compare, for example, the γ and β portions of the simulation); learning here thus is influenced by oscillation period, as well as by details of synchronization. Learning will be influenced, in addition, by “beat-skipping”; for instance, if the postsynaptic cell fails to fire on a peak of a particular γ wave, then the postsynaptic dendritic [Ca2+]isignal will be severely attenuated. This occurs because the model voltage-dependent calcium conductance, in basal dendrites, closely follows the depolarization induced by the somatic action potential; the latter readily and faithfully propagates into the basal dendrites of model pyramidal neurons. [The reader will recall that recurrent pyramidal→pyramidal synaptic connections, in CA1, are largely in the basal dendrites (Deuchars and Thomson, 1996), and that is where pyramidal cell learning is presumed to occur during tetanic CA1 γ/β (Faulkner et al., 1999; Traub et al., 1999).] Finally, in thinking about the results, the reader must constantly have in mind axonal conduction delays in the system, which in some of our simulations are >10 msec. It is the correlation between [Ca2+]i signals at postsynaptic dendrites and presynaptic terminals (not presynaptic cell bodies) that controls synaptic conductance changes; depolarization at the presynaptic terminal can be delayed by more than half a γ cycle from the action potential at the presynaptic soma. This important detail is different from the learning schemes used in many connectionist models.
Fig. 1.

Example of fluctuations in [Ca2+]i signals during the course of a simulated network oscillation (same simulation as Fig. 3). The entire γ and a portion of the β oscillation are shown. Top traces, Signals from a site in the basal dendrites of pyramidal cell 1. Thick trace is the local [Ca2+]i signal (units arbitrary), andthin trace is the postsynaptic voltage at the same site (action potentials truncated; the amplitude of action potentials at this site is ∼60 mV depolarized from rest). Note the subthreshold voltage fluctuations between full action potentials, during β.Middle trace, Total [Ca2+]i signal in pyramidal cell 1 (units arbitrary); horizontal line through this trace shows the postsynaptic learning threshold,Tpost.Bottom trace, A presynaptic [Ca2+]i signal at a synapse located at the same site in the basal dendrites of pyramidal cell 1; horizontal line through this trace shows the presynaptic learning threshold, Tpre. Decay time constants are τpost = 20 msec (dendritic voltage-induced signal) and τpre = 25 msec (presynaptically induced signal) of the same order as the period of the γ oscillation.
As noted above, experimentally, e→i potentiation can also occur by activity-dependent removal of polyamine block, in AMPA receptors lacking GluR-B (GluR2), i.e., in AMPA receptors of a sort often found in interneurons (Geiger et al., 1995). This phenomenon is Hebbian in that it requires presynaptic activity, whereas it is being expressed postsynaptically (Rozov et al., 1998). On the other hand, removal of polyamine block occurs faster at hyperpolarized membrane potentials in the postsynaptic neuron than at depolarized potentials (Rozov et al., 1998). Therefore, it was considered necessary to examine this type of learning in the model as well. Note that Rozov et al. (1998) described conductance increases, with 33 Hz stimulation, up to ∼38% in homomeric GluR-B(Q) channels expressed in human embryonic kidney cells.
We did not use learning at inhibitory synapses in this model [see, however, Bibbig (1999, 2000)]. [Changes in i→e synaptic connections are difficult to document experimentally during the course of γ/β. For example, isolation of IPSPs requires blockade of AMPA receptors, but block of AMPA receptors prevents the β portion of the oscillation from occurring in a normal way (Traub et al., 1999).] We did not attempt to model the decay of synaptic potentiation. On the one hand, we lack the quantitative data to do so; on the other hand, the decay time constants are likely to be minutes or longer, and it is only practical for us to simulate a few seconds of neuronal activity, at most.
Axon conduction delays. Pyramidal cell axons conducted at 0.5 mm/msec, and interneuron axons conducted at 0.2 mm/msec. Thus, the maximum conduction delay for excitation across the array was 3.84 msec. In some simulations, the array was split in two, imposing an extra conduction delay (up to 20 msec) for axons crossing the midline (cf.Kopell et al., 2000).
Noise. Noise was simulated, as before (Traub et al., 1999), with ectopic spontaneous axonal action potentials, originating by independent Poisson processes, with the average interval at 10 sec in e-cell axons and 5 sec in i-cell axons.
Signals saved and data analysis. The program saved voltages of selected cells (soma, dendrites, terminal axon), [Ca2+]i signals, and synaptic input conductances. It saved, in addition, e-cell spatial averages (56 cell somata) and i-cell spatial averages (28 cell somata), one average from either end of the array. The average signals are presented both as raw data, and in auto- and cross-correlations, the latter using 200–800 msec of data. Average values of synaptic scaling constants,ce→eandce→i, were also saved. These data were saved either as averages regardless of relative position of presynaptic and postsynaptic cells or as averages over the four cases in which presynaptic or postsynaptic cells lay in left versus right halves of the array.
Data base, run times, programming, and systems aspects. After numerous preliminary simulations, mostly aimed at defining parameters of the learning rule, a data base of >120 simulations was accumulated. Code was written in FORTRAN augmented with extra instructions for a parallel computer and run on an IBM SP2 machine with 12 processors. A typical 2 sec simulation took ∼6 hr to run. For details on programming aspects, contact rtraub@netmail.hscbklyn.edu.
Experimental methods
Transverse dorsal CA1 hippocampal slices 400–450 μm thick were prepared from brains of Sprague Dawley rats (200–250 gm), which were killed by cervical dislocation followed by decapitation. Slices were maintained at 34–35° at the interface between warm, wetted 95% O2–5% CO2 and artificial CSF (ACSF) containing (in mm): NaCl 135, KCl 3, NaHCO3 16, NaH2PO4 1.25, CaCl2 1.5–2, MgCl2 0.8,d-glucose 10.
Oscillations were evoked with tetanic stimuli delivered to proximal stratum radiatum at two sites simultaneously (CA1a and CA1c; separation 1.5–2.5 mm). Two types of experiments were performed. In the first, fast-spiking interneurons were impaled at the level of stratum pyramidale at one site, with tetani consisting of eight stimuli delivered at 100 Hz. Recording electrodes (40–90 MΩ) were filled with 2 m potassium acetate or potassium methylsulfate. In the second, both stratum pyramidale and distal stratum oriens field potentials were recorded at one or both sites, with tetani consisting of 20 pulses at 100 Hz. Recording electrodes (0.5–1 MΩ) were filled with 2 m sodium chloride.
RESULTS
EPSP amplitudes increase in interneurons during the course of tetanically elicited γ→β oscillations
In Whittington et al. (1997a), two cellular phenomena were documented as taking place, simultaneously, during the transition from γ to β frequencies in tetanically induced oscillations: an increase in apparent spike AHPs and an increase in AMPA-receptor-mediated EPSPs in pyramidal cells. Figure 2,A and B, shows that compound EPSPs also increase in interneurons under the same conditions. The EPSPs in interneurons during β are broader, with an apparent multicomponent structure, than the EPSPs during γ; in control simulations, phasic AMPA receptor-mediated excitations also become broader during β as compared with γ. The increase in interneuronal EPSPs in the oscillating slice stands in contrast to the depression of interneuronal EPSPs often seen in the resting slice, when a single presynaptic pyramidal cell is induced to fire repetitively (Ali et al., 1998).
Fig. 2.
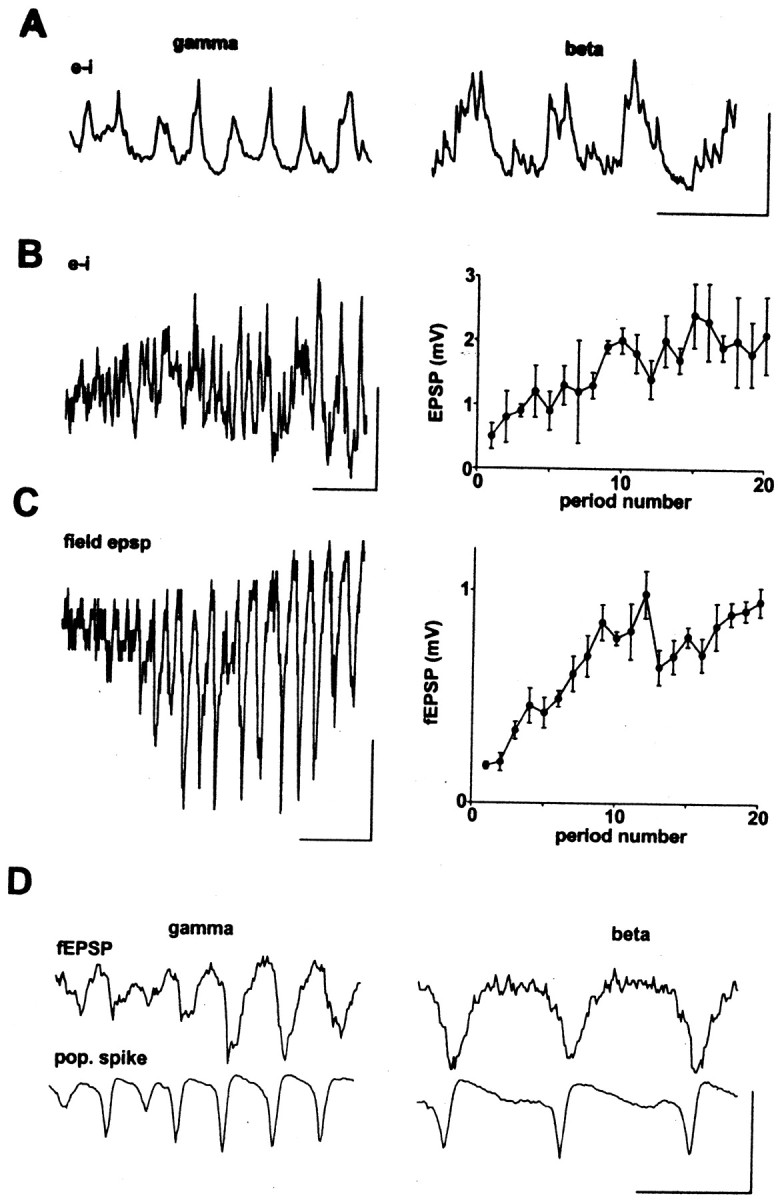
Compound EPSPs grow in both interneurons and pyramidal neurons during the course of tetanically evoked γ/β.A, Intracellular recording of EPSPs in an interneuron, hyperpolarized to −70 mV by current injection (−0.3 nA). Example traces show pattern of EPSPs during the initial γ component of the post-tetanic response and the later β component. Calibration: 100 msec, 5 mV. B, Example trace of EPSPs recorded from the beginning of the post-tetanic response to the beginning of the β oscillation, in an interneuron held at −70 mV. Calibration: 100 msec, 5 mV. Graph shows pooled data from five interneurons with mean (±SEM) EPSP amplitudes for each of the first 20 periods of the post-tetanic response. C, Example of field EPSPs recorded in stratum oriens. Trace shows response from the end of the tetanic stimulation to the beginning of the β oscillation. Graphs shows pooled data, expressed as mean (±SEM; n = 4) amplitude of the field EPSP for each of the 20 periods of oscillation. D, Growth of field EPSPs is not an artifact of growth of population spikes. Traces recorded concurrently in stratum oriens (top traces) and stratum pyramidale (bottom traces) during the initial γ-frequency oscillation and the later β-frequency oscillation. Calibration: 100 msec, 2 mV.
Figure 2, C and D, again documents the increase of field EPSPs (extracellular potentials corresponding to synchronized EPSPs in many nearby neurons, measured in stratum oriens) during the course of γ/β. Figure 2 emphasizes that this increase occurs despite the fact that population spikes, in stratum pyramidale, are not larger in β compared with γ; thus, the growth in field EPSPs is not a simple byproduct of increased synchronization, or increased firing, of pyramidal neurons (cf. Faulkner et al., 1999; Traub et al., 1999).
Categories of simulations
Most of the simulations performed fell into two categories. In the first category (“Category 1”), we fixed τpre at 25 msec, for connections onto either e-cells or i-cells; Tpost was a positive number (75.0) in both e-cells and i-cells. This is, so to speak, “strictly Hebbian.” In the second category (“Category 2”), we set τpre at 100 msec for e→e connections (Koester and Sakmann, 1998), and we set it at 1 msec for e→i connections (Rozov et al., 1998).Tpost in pyramidal cells was the same as in the first category, but was set to 0 in interneurons. Thus, simulations in the second category use learning at excitatory connections onto pyramidal cells that is formally Hebbian, but with a longer presynaptic time constant than in the first category. Additionally, in the second category, excitatory connections onto interneurons learn by a process resembling removal of polyamine block. Learning rates at the different sorts of synapses were adjusted accordingly. The first category of model can replicate virtually all of the experimental data, and for most of the figures below, we illustrate examples chosen from the first category of model. Nevertheless, as noted below, the second category of model can also replicate many of the data.
We also used further variations of these cases, by altering τpre or τpost in different combinations. These variations are noted in the text.
Learning can lead, in cooperation with increasing K+ conductances, to an organized γ→β transition
The mechanistic idea on the γ→β transition proposed in Traub et al. (1999) was this: tetanic stimulation evokes γ oscillations, in which both pyramidal cells and interneurons participate and in case two sites are stimulated, with interneuron doublets stabilizing the synchrony between sites (Traub et al., 1996b; Whittington et al., 1997b). The oscillation is primarily gated by IPSPs, both in pyramidal cells and in interneurons. If the stimulus is strong enough to produce a long-lasting depolarization (Faulkner et al., 1999; Whittington et al., 2001), interneurons remain excited enough to generate a long-lasting γ oscillation, whether or not the pyramidal cells are firing (Whittington et al., 1995; Traub et al., 1996a), so-called “ING” (interneuron network γ). As AHP conductance(s) increase in pyramidal neurons, the latter become unable to follow the interneuron oscillation cycle by cycle and skip beats, so that pyramidal cells fire at β frequency, even as interneurons continue to fire at γ frequency (more accurately, to fire singlets, doublets, or brief bursts at γ frequency). Hence, increases in AHPs can account for β phenomenology, at least in individual pyramidal cells. Nevertheless, AHP increases, by themselves, do not account for what happens in the whole system: without coupling between the pyramidal cells, different pyramidal cells would tend to skip beats in a manner only loosely coupled together, a “disorganized” β. The increases in pyramidal cell EPSPs that also occur, however, introduce correlations between which ING cycles are skipped by the different pyramidal cells and help to lead to an organized β. This idea works, so far as it goes, both in detailed network simulations (Traub et al., 1999) and in reduced models that can be analyzed more rigorously (Kopell et al., 2000).
There is no obvious reason to think that the AHP increases are “self-organized” (that is, dependent on communication between cells in the network). It is possible, however, that the EPSP increases are self-organized, given that (1) Hebbian-type synaptic plasticity exists between hippocampal and cortical neurons (Stanton and Sejnowski, 1989;Debanne et al., 1994, 1998; Ouardouz and Lacaille, 1995; Markram et al., 1997; Laezza et al., 1999; Dragoi et al., 2000) and (2) metabotropic receptors (known to be critical for inhibition-based γ rhythms (Whittington et al., 1997b, 2001), intrinsic membrane properties, and phasic synaptic inputs together interact to give supralinear increases in dendritic [Ca2+]i signals, thus providing a possible physical substrate for Hebbian synaptic plasticity (Christie et al., 1996; Emptage et al., 1999; Nakamura et al., 1999, 2000; Normann et al., 2000; Perez et al., 2000, 2001). There is also in vivo evidence that metabotropic glutamate receptors are important for functional learning, although the cellular mechanisms are not clear (Balschun et al., 1999).
For these reasons, we allowed maximumgK(M) andgK(AHP) conductances to increase in a prespecified time-dependent manner (see Materials and Methods), similar to our earlier study (Traub et al., 1999), but, we let e→e and e→i synapses modify, cooperatively, as described in Materials and Methods. Figure 3 demonstrates that, at least with certain initial conditions and learning parameters, a realistic-appearing γ/β oscillation still can occur. In particular, e-cell β occurs when i-cells continue to form an oscillation at γ frequency, so that beat-skipping during β takes place (Fig.3A, asterisk). Both γ and β portions of the oscillation are synchronized (Fig. 3B). The slowing of γ before the “switch” to β at time ∼900 msec (Fig.3C) is seen experimentally (Whittington et al., 1997a). The increase in e→e and e→i conductances, depicted in Figure3D, allows interneuron singlets to switch to (mostly) doublets (Fig. 3A, d) during γ, as often occurs experimentally (M. A. Whittington, unpublished data), and the increase in conductances provides enough coupling between pyramidal cells to allow long-range synchrony of β. Once β is established, further increases in synaptic conductances stop, in this simulation. This is a result of the relatively reduced e-cell firing rate during β, with consequent reduction of [Ca2+]i signals to levels that are most often below threshold for synaptic conductance increases. Note that spike AHPs increase from γ to β (Fig.3A, arrowheads). Analysis of the GABAA conductance to this pyramidal cell (data not shown) indicates, however, that part of this increase is actually attributable to rises in synaptic inhibition: not growth of unitary IPSCs, an effect not included in this simulation, but rather a reflection of interneuron doublets and, during β, an occasional triplet.
Fig. 3.

Simulated γ/β oscillation (category 1 model).A, Simultaneous traces showing local averages of e-cell voltages (from either end of the array), an e-cell (pyramidal cell) soma, the total AMPA conductance delivered to that e-cell, an i-cell (interneuron), and the total AMPA conductance delivered to that interneuron. Asterisk indicates underlying subthreshold γ during β; arrowheads under the e-cell trace emphasize the growth of pyramidal cell AHPs (partly reflecting synaptic conductances) from γ to β. d is the first doublet generated by the interneuron, and s indicates a singlet amid the doublet firing. B, Superimposed auto- and cross-correlations of average e-cell signals, from γ and β portions of the oscillation. Note the presence of low-amplitude γ activity in the β correlations. C, Instantaneous frequency plot, calculated from local average e-cell signal at one site (cf.Whittington et al., 1997a). D, Average unitary synaptic scaling factors, for e→e and e→i synaptic connections, showing the time course of learning through the evolution of the oscillation. Virtually all of the learning takes place during γ. These signals were averages of excitatory synaptic connections on 64 e-cells and 32 i-cells.
Figure 3 illustrates another interesting feature: there is a period of a few hundred milliseconds in which interneurons do not fire doublets (doublet firing begins at approximately t = 275 msec), and yet γ is synchronized, at least transiently [because γ synchrony without doublets is not stable (Ermentrout and Kopell, 1998)]. The γ cross-correlation of Figure 3B uses data from t = 100–300 msec. Once doublet firing begins, the oscillations slows, as expected, and remains synchronized (data not shown), also as expected (Traub et al., 1996b).
e→i plasticity influences the number of interneuron doublets during γ and the tightness of synchronization, whereas e→e plasticity has little effect
With the same parameters as in Figure 3, but without e→i plasticity (data not shown), the period of γ from 100 to 300 msec had only a small (1.5 msec) lag in the cross-correlation of e-cell signals, but with few doublets occurring during any portion of γ; the period of γ from 300 to 500 msec had a cross-correlation that, although possessing a central peak near 0 (−0.6 msec), had multiple small side peaks. (The corresponding cross-correlation for the simulation of Fig.3 was narrow and had a single small side peak.) γ phenomenology was similar to the case of blocked e→i plasticity, when e→e plasticity was also blocked (data not shown).
Simulations with the second category of model (defined above) were also able to replicate γ/β oscillations, which had an appearance quite similar to that in Figure 3 (Fig. 4).
Fig. 4.

The γ/β transition can also be replicated when e→i learning simulates the removal of polyamine block (category 2 model) (cf. Rozov et al., 1998). The conditions of this simulation are the same as in the run of Figure 3, except that some of the [Ca2+]i dynamics and learning parameters were altered: τpre for e→e connections was increased from 25 to 100 msec, and for e→i connections was reduced from 25 to 1 msec (corresponding approximately to the open time of interneuron AMPA receptors). In interneurons,Tpost, the postsynaptic learning threshold, was set to 0, making learning at e→i connections entirely dependent on presynaptic activity, even as the learning is expressed postsynaptically. Finally, learning rates at e→i connections were adjusted, as described in the learning section of Materials and Methods. The traces in A–D correspond to those in Figure 3.
Effects of altering τpre or τpost
We tried the second category of model (that is, e→i learning depends on polyamine unblocking) with different combinations of pyramidal cell τpre and τpost. With τpre = 100 msec and τpost = 20 msec, we have the usual second category case, described above. Setting both parameters to 100 msec led to a case in which there was a large slow envelope of the [Ca2+]i signal in basal dendrites, making it impossible to select a fixed learning threshold, so that increases in EPSC amplitudes would not take place continuously. As a result, pyramidal cell doublets would occur quickly (data not shown), contrary to experimental observations. On the other hand, with τpost = 100 msec and τpre = 25 msec, γ/β occurred that resembled the case of Figure 3, but with certain important details disagreeing with the experiment. For example, it was not possible to chose the learning threshold Tpre so that no pyramidal cell doublets would occur during γ and still have enough learning for synchronized β to occur (data not shown). These data suggest, therefore, that one or the other [Ca2+]i decay time constants, but not necessarily both, should have a value similar to the γ oscillation period; furthermore, at least in our hands, the model results were most realistic when it was τpostthat had a value close to the γ oscillation period. Recall that the time constants of postsynaptic [Ca2+]i decay in the model, 20–25 msec, are taken to represent what we presume to be the fastest decay time constant of this signal in dendrites (Miyakawa et al., 1992; Sabatini and Svoboda, personal communication).
Initial synaptic conditions could be important in determining whether organized β occurs
There is an interesting experimental observation on β that may be related to memory: smaller tetani evoke γ, which can be synchronized between two sites, but not β, or at least not β that is synchronized between sites (Whittington et al., 1997a; Traub et al., 1999). Nevertheless, despite this, a single strong stimulus, evoking two-site synchronized β, allows future weaker stimuli to evoke two-site synchronized β. This observation might be explained by two assumptions, both testable in principle: (1) the learning rates in the system increase with the strength of stimulation, an idea consistent with observations that metabotropic glutamate receptors both influence synaptic plasticity (Bortolotto et al., 1999) and also exert a cooperative effect with phasic synaptic inputs and dendriticgCa in regulating [Ca2+]i (Nakamura et al., 2000), and (2) a single two-site-synchronized β epoch leaves excitatory synapses potentiated above their baseline values. The simulations in Figure 5 were undertaken to test the feasibility of this idea.
Fig. 5.

γ can evolve into an “organized” (i.e., long-range synchronized) β rhythm, if the learning rate is fast enough, or with a slower learning rate, if combined with elevated initial excitatory conductances. Traces on the left are, respectively, average e-cell voltages from either end of the array (designated here V1 andV2) and the total AMPA conductance received by a selected e-cell. Traces on the right are cross-correlations of the last 800 msec (in 2 sec runs) ofV1 and V2, time periods during which β would be expected to occur.A, Case in which learning rates are slow for e→e and e→i conductances, that is, half the usual values (see Materials and Methods). There is some rise in AMPA conductances during γ, and each side develops its own β rhythm, but in the absence of sufficient excitatory coupling, the sides produce β that is out of phase (double-headed arrow) (cf. Traub et al., 1999). The cross-correlation has its major peaks at γ frequency.B, With the usual learning rate, AMPA conductances increase more than in A. β between the two sides is correlated, and the major side peak in the cross-correlation is at 77 msec (13 Hz). C, The learning rates are slow, as inA, but initial values of e→e and e→i conductances are elevated above their usual values (but not so much that e-cell doublets occur during γ or that i-cell doublets occur immediately). Note the horizontal arrows at the start of the AMPA signals. Again, β between the two sides is correlated, and the cross-correlation is similar to that in B.
Figure 5 illustrates effects of learning parameters and of initial synaptic conductances. Figure 5A shows a simulation identical to that of Figure 3, except that the learning rates have been reduced 50%; that is, the up and down increment values have all been cut in half. In this case, e→e connections do not become as strengthened as in Figure 3. Compare the AMPA conductance in an e-cell in Figure 5A with the AMPA conductance in the same e-cell in Figure 5B, which uses the same data as Figure 3. (Note also that the AMPA conductance stays smaller in Fig. 5A than in 5B, even before β has started, so that the reduced AMPA size in the β portion of Fig. 5A is not simply a consequence of reduced synchrony.) The γ part of the simulation in Figure 5A is synchronized (phase differences <1.5 msec; data not shown), and β can develop at each individual site, because of the time-dependent growth in K+conductances. Nevertheless, because of the small e→e coupling present when β is starting, the two ends of the array do no oscillate in stable synchrony; indeed, our simulations showed an anti-phase oscillation (double-headed arrow).
The simulation of Figure 5A, using the slowed learning rates, was then repeated (Fig. 5C), but now with higher initial unitary e→e conductance (5×; note horizontal arrows on the left of the figure showing initial excitatory conductances “seen” by a selected e-cell) and higher initial unitary e→i conductance (1.25×). In this case, excitatory conductances become potentiated enough that β can synchronize between the two sides, as shown in the cross-correlation on theright. The higher initial excitatory conductances come at a price, however: γ is now not organized as well, the cross-correlation (data not shown) containing a split peak instead of a single sharp peak near 0 msec. Maxima of this split peak were at −6.6 and +3.4 msec, for data from 100 to 300 msec after the start of the oscillation. Such a “disorganizing” effect on γ appeared to be caused by the appearance of interneuron doublets at one site before the other site, followed by alternating singlets and doublets at each site, with the patterns out of phase between the two sites. Other data (Fuchs et al., 2001) suggest that excessively prolonged AMPA receptor-mediated excitation of interneurons can actually be detrimental to γ synchrony. When initial unitary e→e conductances were too large, pyramidal cell doublets occurred during γ (data not shown), something observed only rarely experimentally (H. J. Faulkner and M. A. Whittington, unpublished data). Therefore, there is a constraint on how large initial excitatory conductances can be.
In summary, Figure 5 shows that lasting effects on EPSPs, produced by an oscillatory epoch containing β, along with stimulus-dependent learning rates, could explain the experimental observations outlined at the start of this section. There is, however, another means to produce the results shown in Figure 5. This is to suppose that a weak stimulus allows the AHP conductance to return to baseline faster than does a strong stimulus; such an idea is also consistent with experimental observations on the suppression of the AHP conductance by metabotropic glutamate receptor activation (Charpak et al., 1990), although to our knowledge a dose–response curve has not been determined for the duration of AHP suppression versus metabotropic activation. Thus, when the simulations of Figure 5, A and C, were repeated, with the AHP recovering over the interval from 250 to 500 msec, as compared with the usual 250–1000 msec (used in Fig.5A, and other simulations in this paper), then we observed the following. With synaptic conductances starting at their baseline values, as in Figure 5A, having the AHP recover rapidly, as might be expected with weak stimulation, led to β that was not synchronized between the two sites, analogous to the behavior shown in Figure 5A: not enough learning took place for β synchrony to occur. On the other hand, when using rapid recovery of the AHP, but with higher initial values of excitatory synaptic conductances (just as in Fig. 5C), then organized and synchronized β did occur, also as illustrated in Figure 5C (data not shown). In summary, there are two possible explanations for the ability of a single β-inducing stimulation to allow subsequent weaker stimulations to induce synchronized β: a dependence of learning rates on stimulus intensity and a dependence of AHP recovery kinetics on stimulus intensity. These explanations are not mutually exclusive.
In addition, the data of Figure 5 could also be replicated using a category 2 model, using the same manipulations as in Figure 5. Reducing the learning rates prevents organized β from occurring, whereas using reduced learning rates, along with increased initial values of the starting conductances, does allow organized β to occur (data not shown).
Because experimental observations (Whittington et al., 1997a, their Fig. 2), and also our model (Fig. 2), indicate that excitatory synapses become strengthened during γ and during the γ→β transition rather than during β itself, the model therefore predicts the following: that strengthened excitatory synapses do not decay all the way back to their baseline conductances during β or during the subsequent “quiet” period before the next stimulus. A further testable prediction of the model, as discussed above (Fig.5C), is that γ evoked after an episode of γ/β should be less precisely synchronized than is γ in the “naive” system: an episode of γ/β should leave e→e synaptic connections potentiated enough to interfere with γ synchrony.
Because of learning, stimulation of one side of the array can interfere with the ability of subsequent two-sided stimulation to evoke synchronized γ, as observed experimentally
We next performed two-part simulations of 4.5 sec of neuronal activity, data from one of which are shown in Figures6 and 7. In the first 2 sec in this series of simulations, the array was stimulated as described in Materials and Methods, but with driving conductances given only to cells in the right half of the array. Cells in the left half were not stimulated, and interneurons were hyperpolarized to suppress (at least partly) their firing in response to EPSPs coming from neurons in the right half. AHP and “M” conductances started small and increased, following the protocol described in Materials and Methods. This initial 2 sec of stimulation (Fig. 6), which we call “epoch 1,” produced changes in unitary EPSCs, described below. After epoch 1, stimulation was shut off for 0.5 sec, and then epoch 2 began (Fig. 7), with stimulation of the whole array (“small heterogeneity” conditions; see Materials and Methods). Again, at the start of epoch 2, AHP and M conductances began with small values and were increased over time following the usual protocol. In other words, epoch 2 was similar to a control simulation, except for the initial values of the unitary EPSCs: these latter had been “conditioned” by activity in epoch 1.
Fig. 6.

Induction of oscillations, in one side only of the array, leads to asymmetric potentiation within and between array halves. Control stimulation with small heterogeneity (see Materials and Methods) was delivered, but only to the 384 e-cells and 192 i-cells in the right half of the array. e-cells in the left half of the array were not stimulated, and i-cells were hyperpolarized (−0.2 nA somatic current). A, Average e-cells from a region in the right side (showing collective γ oscillation; β also occurs but is not shown); average e-cells from a region in the left side (unstimulated), showing hyperpolarization by IPSPs; an interneuron (i-cell) from the right side, showing fewer doublets than in control simulations (Fig. 3); an interneuron from the left side, showing rhythmic EPSPs. (Some i-cells on the left side do fire occasionally.) Horizontal lines indicate resting potentials in the interneurons. B, Learning in this simulation, showing evolution of average excitatory synaptic scaling constants, for synaptic connections in which the presynaptic cells are e-cells in the right side of the array. These excitatory connections potentiate most when the postsynaptic cell is also in the right (stimulated) half. If the postsynaptic cell is in the left half, then synaptic connections either potentiate less (e→i) or else depress (e→e). (e→i potentiation is possible in these circumstances, because some i-cells in the left, unstimulated side are synaptically induced to fire by activity of e-cells in the right, stimulated side.)
Fig. 7.

Asymmetrical stimulation of the array interferes with subsequent two-site synchrony. The simulation of Figure 6 was continued for a total of 2 sec, and then stimulation of both e-cells and i-cells was halted for 500 msec. At that point, stimulation of all of the cells was begun as in Figure 3, although with smaller heterogeneity in driving conductances, to give the array an optimum chance to synchronize, if such were possible. The protocol, for starting gK(M) andgK(AHP) conductances small and then increasing them, was reinitiated at the same time as the onset of the driving conductances, as was the collection of data for this figure.A, Part of the γ portion of the oscillation evoked by widespread stimulation under above conditions. e-cell averages, superimposed from the two sides, are asynchronous. An interneuron (i-cell) on the right side (previously stimulated) fires singlets and doublets. An interneuron on the left side fires only singlets. (Recall from Fig. 6Bthat during the initial one-sided stimulation, excitatory synapses on right interneurons become more potentiated than excitatory synapses on left interneurons.) B, Cross-correlation of average e-cell activities during this γ activity confirms the lack of synchrony.
Figure 6A illustrates that, during epoch 1, the stimulated right side develops a locally synchronized γ oscillation, whereas the unstimulated left side does not. Interneurons on the right side can fire doublets, but much less frequently than in control conditions when both sides are stimulated (Fig. 3). This can be determined from the average i-cell signals, which show doublets in the control case and not in epoch 1, when a single side is stimulated (cf.Whittington et al., 1997b). In Figure 6B, we see that, on average, excitatory connections in which the presynaptic e-cell is on the right (hence stimulated and firing regularly) become potentiated when the postsynaptic e- or i-cell is also on the right side (hence also stimulated and firing regularly). There is some lesser degree of potentiation of connections from right e-cells to left i-cells, because of the fact that some left interneurons are synaptically excited (by right e-cells) enough to fire.
Thus, epoch 2 (Fig. 7) begins in a state in which the initial excitatory connections are asymmetrically distributed. Each side produces a γ oscillation, although at somewhat different frequencies (35.7 Hz on the left side; 33.1 Hz on the right side; data from 100–300 msec). The slower frequency on the right (previously stimulated) side occurs because of the greater incidence of interneuron doublets on the right than on the left. Examples of this are shown in Figure 7A, and the relatively increased incidence of interneuron doublets on the right side was confirmed by examination of the local average interneuron voltages (data not shown). The asymmetry in doublet firing is presumably a consequence of the asymmetry in the excitatory synaptic conductances. The net result is a lack of synchrony between the two sides (Fig. 7A, top,B).
Figures 6 and 7 enlarge on an idea discussed in Traub et al. (1999)that was offered to explain another “memory-like” feature of β oscillations: strong one-site stimulation interferes with the ability of subsequent two-site stimuli to induce two-site γ synchrony, stimuli that normally would induce two-site γ synchrony (Whittington et al., 1997a). In the previous study (Traub et al., 1999), we considered only depression of excitatory synapses at connections from pyramidal cells at one site to interneurons at the other site. The present simulations, in which learning takes place, suggest that the desynchronizing effect of a one-site stimulus could also be influenced by potentiation of excitatory synapses, so long as it is asymmetrical.
Simulation of morphine effects: disrupted β and impaired learning
Morphine (∼50 μm) has a number of effects on γ/β oscillations: (1) it interferes with γ synchrony; (2) interneurons fire in doublets, triplets, and even quadruplets during γ; (3) strong tetanization does not evoke normal β, but rather an oscillation in which, as recorded in stratum pyramidale field potentials, many of the intervals are at γ frequency; and (4) field EPSPs, recorded in CA1 stratum oriens do not increase, over the course of the γ→β transition, nearly to the extent that they do in control oscillations, suggesting that morphine disrupts at least one type of potentiation of excitatory synapses (Faulkner et al., 1998, 1999; Whittington et al., 1998). We were interested in whether the present model would replicate the finding of diminished EPSP potentiation, under conditions in which other aspects of morphine on oscillations were captured. This question is of clinical relevance, given that morphine exerts amnesic effects in humans (Kerr et al., 1991).
We have shown previously that features 1 and 2 above, interference with γ synchrony and excessive interneuron firing, could be simulated in a model, when GABAA conductances (on both pyramidal cells and interneurons) were reduced sufficiently (Whittington et al., 1998), consistent with the known effect of morphine of reducing GABA release, by a presynaptic mechanism, at both excitatory and inhibitory terminals (Madison and Nicoll, 1988). Property 3 above, disruption of β, could be replicated if, in addition, K+ conductance(s) did not recover to a normal extent during the γ→β transition (an assumption that was supported by experimental data), and e→e synaptic conductances were held constant (as a constraint imposed by the program) (Faulkner et al., 1999).
In the present study, we simulated morphine effects as before, with reduced GABAA conductances, and with incomplete recovery of K+ conductances, but allowed the learning rules to apply as in control conditions (see Materials and Methods). Figure 8 illustrates a typical example. In this simulation, unitary i→e conductances were reduced by 32%, and unitary i→i conductances were reduced by 73%. MaximumgK(M) density andgK(AHP) density increased only threefold over the γ→β transition, rather than the usual 5.0- to 5.2-fold. The resulting simulation captures the major effects of morphine: oscillations during β are of variable amplitude and frequency [often γ frequency (Fig.8A,C)]; interneurons fire triplets on occasion, associated with total excitatory synaptic inputs of varying amplitude and breadth; the γ cross-correlation is broader than control and somewhat phase shifted [2.5 msec (Fig.8B vs Fig. 3B, and bottom of Fig.8A)]. Of particular interest is that although the parameters for learning are as in control simulations, the total increase in excitatory conductances is less (by ∼40%) in the morphine simulation than in the control simulation (Fig.8D vs Fig. 3D).
Fig. 8.

Simulation of morphine effects on oscillations. GABAA conductances were reduced, compared with control simulations (Madison and Nicoll, 1988): i→e by 32% and i→i by 73% (Whittington et al., 1998). gK(M) andgK(AHP) scaling factors were increased only threefold throughout the simulation, rather than the usual 5- to 5.2-fold (Faulkner et al., 1999). A, e-cell average shows that β is replaced by activity of variable (often γ) frequency and variable amplitude (cf. Faulkner et al., 1999). An i-cell sometimes fires triplets, and its AMPA input is variable in amplitude and time course; superimposed e-cell averages show variable phase relations during γ. B, Cross-correlations of average e-cell activity show a broader central peak of γ, as compared with control (Fig. 3) (Whittington et al., 1998), and β is replaced by γ. C, Instantaneous frequency plot of average e-cell activity confirms the spread of frequencies at which β would normally occur (cf. Faulkner et al., 1999). D, e→e learning is reduced, compared with control (Fig. 3).
Three factors contribute to the reduced learning in the morphine simulations: (1) the average frequency of γ can be a bit slower (initial morphine γ 41.7 Hz, vs 50 Hz in Fig. 3); (2) even during the γ phase in morphine, there can be missed beats at one side or the other, something also seen experimentally (Whittington et al., 1998); and (3) γ is less synchronized in morphine. Dissecting these factors apart experimentally is quite difficult.
It was also possible to produce a simulation similar to that of Figure8, closely resembling the experimental data, using a category 2 model. Some of the parameters were slightly different, e.g., we used a somewhat higher value for unitary IPSCs on pyramidal cells, in the category 2 model. It is at least possible to say that the morphine experimental data do not, by themselves, allow one to distinguish between the two types of models.
With very long conduction delays (≥10 msec), learning leads to production of an “i-weak beat,” which in turn leads to a jump from anti-phase to in-phase γ oscillation
The ability of oscillating networks to synchronize, despite significant separation in space (hence time), is of biological interest, given the long distances, up to 9 cm, over which human γ activity can synchronize during perceptual and learning tasks (Desmedt and Tomberg, 1994; Miltner et al., 1999; Rodriguez et al., 1999). InKopell et al. (2000), the ability of two sites to synchronize was examined, for both γ and β oscillations, when conduction delays were long, i.e., >5 msec, and in networks without synaptic plasticity. The general finding was that β could synchronize with longer conduction delays than γ, and in the detailed network simulation illustrated, using a model quite similar to that of Traub et al. (1999), an extra 10 msec conduction delay imposed on axons crossing the array midline did not permit γ synchrony.
In Bibbig (1999, 2000), a mechanism was considered, “i-weak beats,” that could lead to synchrony in the presence of axon conduction delays of 10 msec or more. (An i-weak beat is defined as a beat in which, at one site in the array, only a few interneurons fire, as well as only a few pyramidal cells.)
The phenomenology of two-site γ oscillations in the model of Bibbig (2000), when ∼10 msec delays between sites were included, was roughly as follows (Bibbig, 2000; Bibbig and Traub, 2000): oscillations occurred initially in near anti-phase between the two sites, when delays were sufficiently long. Given that the period of γ rhythms is primarily determined by locally generated IPSPs of approximately the same amplitude (but opposite phase) at each site, how can the system switch to in-phase? If a single, small IPSP could be induced to occur in neurons at one site but not the other, a “flip” to in-phase oscillation might be possible. This effect is what an i-weak beat accomplishes.
We observed in simulations that as learning proceeded, there came a time at which e-cell activity at one site (site 1) was enough, on its own, to cause (via enhanced e→i conductances) firing of some relatively small number of i-cells at the other site (site 2). This (site 2) i-cell activity then suppressed the firing of nearby (site 2) e-cells, which, in turn, ensured that the local (site 2) i-cell firing would remain limited in extent, thus, the i-weak beat. Once this happened, the next oscillation period of site 2 would be shortened, and the system would switch abruptly from an anti-phase to an in-phase oscillation, despite the long conduction delay. Once the in-phase oscillation began, the breadth of interneuron doublets increased, which acted to stabilize the in-phase oscillation as well as to lengthen its period. The period often would increase enough so that an oscillation of β frequency (i.e., ∼20 Hz) would result.
The i-weak beat mechanism was studied in model networks that differed from the present model in several respects, including the following: (1) having a smaller number of neurons; (2) simulating the neurons with integrate-and-fire models that, among other characteristics, do not possess slow intrinsic conductances (e.g.,gK(M) andgK(AHP)); and (3) including plasticity of i→e synapses, as well as of excitatory synapses. This was one motivation for asking whether i-weak beats could work in more detailed models. In addition, although extra conduction delays as long as 10 msec cannot be realized experimentally in the hippocampal slice preparation, the issue of long-range synchrony of γ is of great interest for in vivo neocortical physiology (Gray, 1994;Tallon-Baudry et al., 1998, 1999; von Stein et al., 1999). We therefore investigated the behavior of the present detailed model when 10 msec extra delays were imposed on the conduction of all axonal signals crossing the midline of the array (see Materials and Methods), with other parameters as in control conditions (Fig. 3). (An extra delay of 10 msec across the midline would produce an average conduction delay, from an excitatory cell to a postsynaptic neuron, of ∼12 msec.)
Interestingly, the phenomenology in the present detailed model was quite similar to the simpler model (Fig.9). After a period of near anti-phase oscillation (Fig. 9A,Bi), during which learning was taking place (Fig. 9C), an i-weak beat occurred (Fig. 9A,C,arrowheads); the fact that the i-weak beat occurs when the two learning curves cross is coincidental. After the i-weak beat, the system switched to in-phase oscillatory activity (Fig.9A,Bii), at lower frequency and with broader interneuron doublets than before. [Interneuron doublets broaden because the second spike in the doublet is triggered by excitatory input from the opposite side. If the two sides are in phase, such excitation takes at least 10 msec to arrive. Besides, the additional smaller middle peaks in the average interneuron activity (Fig. 9A, top trace) after synchronization are attributable to the fact that a few highly driven interneurons fire twice because of strong local activation of nearby pyramidal cells and/or maybe noise, whereas their third spike, with a respective delay of >10 msec, is generated from the distant population of pyramidal cells.] The in-phase oscillation persisted for at least 800 msec. Without learning, and consistent with Kopell et al. (2000), the switch to in-phase oscillation did not occur (Fig.10). Results similar to those shown in Figure 9 were also observed with extra delays of 11 and 8 msec and also with 15 msec (in case the maximal AHP conductance was somewhat reduced) (data not shown). When the extra delay was 6 msec, the system did not produce an anti-phase oscillation at all, but rather remained in-phase throughout (data not shown).
Fig. 9.

The two sides of the array can synchronize despite long axon conduction delays, when learning is present; the switch to synchrony is preceded by an i-weak beat (Bibbig, 2000). The simulation of Figure 3 was repeated, with the modification that all signals passing in axons that cross the midline are subject to an extra 10 msec conduction delay. A, The i-weak beat is indicated by anarrowhead in the two top tracesrepresenting local average i-cell and e-cell activity, respectively. There is reduced (on average) i-cell firing at one site and reduced e-cell firing. Before the i-weak beat, interneuron doublets are narrower than after the i-weak beat (top trace). Also before the i-weak beat, the two sides are in near anti-phase (middle traces), whereas just after the i-weak beat, the two sides switch to synchrony, at a lower frequency. After the i-weak beat, EPSPs from the opposite side appear ∼10 msec (i.e., the extra conduction delay) after action potentials in an e-cell (bottom trace). The [Ca2+]i signal in the bottom trace is shown with a thick line. B, Cross-correlations of 200 msec of average e-cell activity, from before the i-weak beat [(i) near anti-phase] and from after the i-weak beat [(ii) synchronized, and at a lower frequency].C, Learning curves, with the time of the i-weak beat shown by the arrowhead. Learning proceeds more slowly after the i-weak beat.
Fig. 10.

With an extra 10 msec conduction delay, using the initial conditions and stimuli of Figure 9, but without e→e and e→i learning, γ synchronization does not occur [consistent with the results of Kopell et al. (2000)]. A, Traces illustrated are as in Figure 9A. There is no i-weak beat; interneuron doublets, when they occur, are narrow, and the phase relations between the two local e-cell averages remain variable.B, Cross-correlations of the same 200 msec segments of average e-cell data, as used in Figure 9, confirming the persistence of near anti-phase between the two sides. C, Flat learning curves, imposed by the conditions of the simulation.
In addition, i-weak beats and a switch from anti-phase to in-phase oscillations could be observed in a simulation with learning based on category 2 rules.
DISCUSSION
This paper contains six main results. (1) Experimentally, there is e→i potentiation during a γ→β transition (Fig. 2). (2) A large-scale network model was generated using a relatively realistic learning rule. This network uses plasticity of pyramidal→pyramidal and pyramidal→interneuron synapses and an ad hoc increase ofgk(M) andgk(AHP) conductances. It generates, in a self-organized way, a γ→β transition (Figs. 3, 4). (3) The network model could also (re)produce the following features seen in hippocampal slices and in earlier simulations using ad hoc changes in e→e synapses (Whittington et al., 1998; Faulkner et al., 1999; Traub et al., 1999): desynchronizing and reduced-learning effects of morphine (Fig. 8); two memory features, i.e., after a strong one-site stimulus, a two-site stimulus produces a desynchronized γ (Figs. 6, 7); after (at least) one synchronous γ→β induced by a strong stimulus, a weak stimulus also generates a synchronous γ→β (Fig. 5). (4) The network was able to synchronize two sites, despite their being separated by axonal conduction delays of >10 msec and with anti-phase firing at the beginning of the oscillation (Fig. 9). This was caused by a so-called i-weak beat, dependent on plasticity (Fig. 10). (5) We could generate these oscillations with two sets of learning rules. Both used Hebbian plasticity at e→e synapses, but for e →i synapses one rule was Hebbian and the other was presynaptic (Rozov et al., 1998). This implies that γ→β oscillation structure does not determine the exact formulation of the learning rules. (6) A Hebbian e→e learning rule worked best if the time constant of postsynaptic [Ca2+]i decay was in the range of a γ period length. We propose that the period of the γ oscillation is “designed” to match the time course of [Ca2+]ifluctuations in dendrites to facilitate learning. Thus, we predict that [Ca2+]ifluctuation time constants, in neurons in visual areas, should match the period of visually evoked oscillations in the respective species: ∼50 msec in turtle (Prechtl, 1994) and ∼11 msec in monkey (Eckhorn et al., 1993).
Which characteristics of the learning rule are important for generation of a γ→β transition and for synchronization despite long axonal conduction delays?
The necessary potentiation of e→e synapses could be generated by a Hebbian learning rule, taking “presynaptically induced synaptic spine [Ca2+]i” and postsynaptic [Ca2+]i as measures. This is consistent with current ideas about supralinear interactions between spine [Ca2+]i (e.g., from Ca2+ entry through NMDA channels) and voltage-gated [Ca2+]i increases, which release Ca2+ from intracellular stores (Schiller et al., 1998; Emptage et al., 1999; Rae et al., 2000). Nevertheless, we are unable to predict the kinetic details of the various processes, because presynaptic [Ca2+]i decay time constants of 25 and 100 msec (Koester and Sakmann, 1998) both work (Figs. 3, 4). On the other hand, our data suggest that the postsynaptic [Ca2+]i decay time constant should be about a γ period length, i.e., ∼20 msec, consistent with experimental data in dendrites of Purkinje and hippocampal pyramidal cells (Miyakawa et al., 1992; Sabatini and Svoboda, personal communication). Simulations with a much longer postsynaptic [Ca2+]i decay time constant (e.g., 100 msec) could not produce a synchronous γ→β oscillation resembling the one seen in hippocampal slices, even if the presynaptic [Ca2+]i decay time constant was set to 25 msec, a γ period length. This occurs because, with such a long decay time constant, the postsynaptic [Ca2+]i stays above threshold, producing, in effect, a purely presynaptic learning rule.
At e→e synapses, we used a Hebbian learning rule for several reasons. First, several authors have shown Hebbian learning at CA3 e→e synapses (Debanne et al., 1994,1998) and a supralinear effect of presynaptic and postsynaptic activity on the postsynaptic Ca2+ concentration (Yuste and Denk, 1995). Second, with purely presynaptic or postsynaptic e→e learning rules, we had the problem of setting the learning rate and/or threshold such that there is enough potentiation during γ for generation of synchronous β but also not so much potentiation as to cause e-doublets during γ. This parameter range was narrow and with some rules not even available.
Unlike earlier simulations of the γ→β transition (Traub et al., 1999), here both e→e and e→i synapses were made plastic, because EPSPs grow in interneurons (Fig. 2), as well as in pyramidal cells, during the γ→β transition. In the simulations, e→i plasticity produced details similar to slice experiments, such as the occurrence of mainly singlets during the beginning of the γ oscillation; e→i plasticity also enlarged the region in parameter space in which the γ→β transition appeared realistic.
For e→i synapses, the involvement of both presynaptic and postsynaptic sides in synaptic plasticity was shown by Laezza et al. (1999) for LTD and by Perez et al. (2000, 2001) for LTP. On the other hand, Rozov et al. (1998) proposed a shorter lasting facilitation process depending on glutamate binding at the postsynaptic site, in effect a purely presynaptic process. We have shown here that both learning rules could account for various experimental data on γ→β oscillations.
How does the learning rule for pyramidal→pyramidal and pyramidal→interneuron synapses described above fit with experimental data on pyramidal cell pairs?
The experiments of Markram et al. (1997) showed that the firing order of two connected neurons is important for the learning result, so that if neuron 1 fired before neuron 2, then the synapse 1→2 was potentiated, whereas the same synapse was depressed if the two neurons fired in reverse order. The different plasticity results produced by the different stimulation paradigms might be caused by differences in Ca2+ levels, namely a higher Ca2+ concentration if the presynaptic neuron fired before the postsynaptic one, as opposed to the reverse case.
In network oscillations the situation is different. First of all, there are many other neurons active at about the same time as a given pair of presynaptic and postsynaptic neurons. This elevates the overall Ca2+ level, favoring the generation of LTP compared with LTD (Yang et al., 1999; Zucker, 1999). Second, the tetanus, used in the experiments simulated here to generate the network oscillations, generates a tonic depolarization and elevates postsynaptic Ca2+ concentration caused by activation of metabotropic glutamate receptors (Connor et al., 1999;Heuss et al., 1999). This also favors potentiation over depression. In addition, the timing of action potentials during γ oscillation is shaped by IPSPs, a factor not included in experiments on pairs of principal neurons. Finally and most importantly, as Figure11 shows, implementation of a time-ordered learning rule would lead to the same result for learning in a network oscillating at γ frequency, as does the learning rule used in this paper, namely, potentiation at all synapses. This occurs because learning increments are larger for potentiation than for depression (Markram et al., 1997, their Fig. 3C). Thus, for γ oscillations, we can use a less complicated learning rule.
Fig. 11.

In a network oscillating at γ frequency, implementation of a “time-ordered” learning rule leads to a comparable plasticity result as does implementation of the simpler rule used here: namely, potentiation. Top, Scheme of a pair recording, with the presynaptic cell stimulated periodically. As the presynaptic cell (1) fires before the postsynaptic cell (2), the cell 1 → cell 2 connection will be potentiated (Markram et al., 1997).Bottom, Network γ oscillation with many neurons active on each beat. Because cell 1 here fires ∼20 msec before cell 2(1), connection cell 1 → cell 2 will be potentiated; because cell 1 also fires ∼20 msec after cell 2 (2), then connection cell 1 → cell 2 will be depressed. Because potentiation increments are larger than depression increments (see Materials and Methods), the net effect is expected to be potentiation. Note that Figure 3C of Markram et al. (1997) shows that potentiation toward the larger steady-state EPSP amplitude occurs faster than does depression toward the corresponding, smaller steady-state EPSP amplitude.
How could the necessary learning take place with axonal conduction delays of ≥10 msec?
Consider the case of assemblies oscillating almost in anti-phase, separated by a conduction delay of approximately half the oscillation period. Then, the spike of an assembly-1 cell reaches its axonal terminal to generate a Ca2+ signal, when the cells of assembly 2 are just firing or are about to fire their next beat; the dendritic voltage-dependent signal and the [Ca2+]i rise induced by presynaptic activity will be in register and allow for plasticity (Traub et al., 1998). For almost anti-phase oscillations, this relation also holds for connections from assembly 2 to assembly 1 cells. Thus, bidirectional symmetrical strengthening is possible, which seems necessary for the subsequent development of synchronization (asymmetric e→e and e→i synapses between the two assemblies lead to desynchronized activity) (Figs. 6, 7). Once the two sites switch to a synchronized oscillation, then the conduction delay acts to limit further synaptic strengthening.
Our model generates the following predictions. (1) If a plastic network similar to that described here is present in vivo, then synaptic plasticity is an inescapable consequence of γ oscillations. (2) Either learning rates increase with the amount of metabotropic activation or AHP recovery kinetics do, or both. (3) After an episode of γ/β, excitatory synapses are stronger, on average, than baseline. (4) After an episode of γ/β, two-site γ might be less synchronized than in baseline conditions. (5) Plasticity occurs more readily during a fast γ oscillation then during slower oscillations such as β, a consequence of the kinetics of [Ca2+]ichanges.
The experimental data underpinning this model derive from oscillations in hippocampal slices, under conditions during which principal neurons fire at high rates. Such intense activity is unlikely during the theta state in the hippocampus but might be achieved in neocortex during sensory activation, for example. In vivo correlates of the ideas discussed here might best be sought in neocortex.
Why would the brain “want” tight synchrony between presynaptic and postsynaptic events, when the Ca2+ time constants involved in plasticity are ∼20 msec or slower (Miyakawa et al., 1992; Koester and Sakmann, 1998), so that coarse synchrony also suffices to generate potentiation? It appears that the more synchronous the two assemblies are during the γ part of the oscillation, the more potentiation is achieved, and the easier it is to obtain a synchronous β, at least in the case of small delays between sites. Synchronous β then is a sign that learning has taken place. Once there is synchronous β, plasticity is more difficult, because of the slower oscillation frequency. In the case of longer intersite delays, learning during γ appears to be favored by a near anti-phase oscillation; the subsequent slower synchronized oscillation is again a sign that learning has taken place.
Footnotes
This work was supported by the Wellcome Trust. R.D.T. was a Wellcome Principal Research Fellow. We thank William N. Ross, Urs Gerber, Karel Svoboda, Jean-Claude Lacaille, Eberhard H. Buhl, Nancy Kopell, Günther Palm, and Wayne A. Wickelgren for helpful discussions.
In memory of the parents of A.B.: Erika Bibbig (1924–1991) and Karl Rahmig (1917–2001).
Correspondence should be addressed to Dr. A. Bibbig, Department of Physiology and Pharmacology, State University of New York Health Science Center, 450 Clarkson Avenue, Brooklyn, New York 11203. E-mail:abibbig@netmail.hscbklyn.edu.
REFERENCES
- 1.Ali AB, Deuchars J, Pawelzik H, Thomson AM. CA1 pyramidal to basket and bistratified cell EPSPs: dual intracellular recordings in rat hippocampal slices. J Physiol (Lond) 1998;507:201–217. doi: 10.1111/j.1469-7793.1998.201bu.x. [DOI] [PMC free article] [PubMed] [Google Scholar]
- 2.Artola A, Bröcher S, Singer W. Different voltage-dependent thresholds for inducing long-term depression and long-term potentiation in slices of rat visual cortex. Nature. 1990;347:69–72. doi: 10.1038/347069a0. [DOI] [PubMed] [Google Scholar]
- 3.Balschun D, Manahan-Vaughan D, Wagner T, Behnisch T, Reymann KG, Wetzel W. A specific role for Group I mGluRs in hippocampal LTP and hippocampus-dependent spatial learning. Learn Mem. 1999;6:138–152. [PMC free article] [PubMed] [Google Scholar]
- 4.Bi G-Q, Poo M-M. Synaptic modifications in cultured hippocampal neurons: dependence on spike timing, synaptic strength, and postsynaptic cell type. J Neurosci. 1998;18:10464–10472. doi: 10.1523/JNEUROSCI.18-24-10464.1998. [DOI] [PMC free article] [PubMed] [Google Scholar]
- 5.Bibbig A. γ→β transition, pattern separation and the plasticity of inhibitory and excitatory synapses. Soc Neurosci Abstr. 1999;25:2257. [Google Scholar]
- 6.Bibbig A. PhD dissertation. University of Ulm; 2000. Oszillationen, Synchronisation, Mustertrennung, und Hebb'sches Lernen in Netzwerken aus erregenden und hemmenden Neuronen. [Google Scholar]
- 7.Bibbig A, Traub RD. Interneuron weak beats provide coarse synchrony, and doublets stabilize fine synchrony, of γ oscillations in networks with long axon conduction delays. Soc Neurosci Abstr. 2000;26:1965. [Google Scholar]
- 8.Bienenstock EL, Cooper LN, Munro PW. Theory for the development of neuron selectivity: orientation specificity and binocular interaction in visual cortex. J Neurosci. 1982;2:32–48. doi: 10.1523/JNEUROSCI.02-01-00032.1982. [DOI] [PMC free article] [PubMed] [Google Scholar]
- 9.Bortolotto ZA, Fitzjohn SM, Collingridge GL. Roles of metabotropic glutamate receptors in LTP and LTD in the hippocampus. Curr Opin Neurobiol. 1999;9:299–304. doi: 10.1016/s0959-4388(99)80044-0. [DOI] [PubMed] [Google Scholar]
- 10.Charpak S, Gähwiler BH, Do KQ, Knöpfel T. Potassium conductances in hippocampal neurons blocked by excitatory amino-acid transmitters. Nature. 1990;347:765–767. doi: 10.1038/347765a0. [DOI] [PubMed] [Google Scholar]
- 11.Christie BR, Magee JC, Johnston D. The role of dendritic action potentials and Ca2+ influx in the induction of homosynaptic long-term depression in hippocampal CA1 pyramidal neurons. Learn Mem. 1996;3:160–169. doi: 10.1101/lm.3.2-3.160. [DOI] [PubMed] [Google Scholar]
- 12.Connor JA, Petrozzino J, Pozzo-Miller LD, Otani S. Calcium signals in long-term potentiation and long-term depression. Can J Physiol Pharmacol. 1999;77:722–734. [PubMed] [Google Scholar]
- 13.Cormier RJ, Greenwood AC, Connor JA. Bidirectional synaptic plasticity correlated with the magnitude of dendritic calcium transients. J Neurophysiol. 2001;85:399–406. doi: 10.1152/jn.2001.85.1.399. [DOI] [PubMed] [Google Scholar]
- 14.Csicsvári J, Hirase H, Czurko A, Buzsáki G. Reliability and state dependence of pyramidal cell-interneuron synapses in the hippocampus: an ensemble approach in the behaving rat. Neuron. 1998;21:179–189. doi: 10.1016/s0896-6273(00)80525-5. [DOI] [PubMed] [Google Scholar]
- 15.Debanne D, Gähwiler BH, Thompson SM. Asynchronous pre- and postsynaptic activity induces associative long-term depression in area CA1 of the rat hippocampus in vitro. Proc Natl Acad Sci USA. 1994;91:1148–1152. doi: 10.1073/pnas.91.3.1148. [DOI] [PMC free article] [PubMed] [Google Scholar]
- 16.Debanne D, Gähwiler BH, Thompson SM. Long-term synaptic plasticity between pairs of individual CA3 pyramidal cells in rat hippocampal slice cultures. J Physiol (Lond) 1998;507:237–247. doi: 10.1111/j.1469-7793.1998.237bu.x. [DOI] [PMC free article] [PubMed] [Google Scholar]
- 17.Desmedt JE, Tomberg C. Transient phase-locking of 40 Hz electrical oscillations in prefrontal and parietal human cortex reflects the process of conscious somatic perception. Neurosci Lett. 1994;168:126–129. doi: 10.1016/0304-3940(94)90432-4. [DOI] [PubMed] [Google Scholar]
- 18.Deuchars J, Thomson AM. CA1 pyramid-pyramid connections in rat hippocampus in vitro: dual intracellular recordings with biocytin filling. Neuroscience. 1996;74:1009–1018. doi: 10.1016/0306-4522(96)00251-5. [DOI] [PubMed] [Google Scholar]
- 19.Doheny HC, Faulkner HJ, Gruzelier JH, Baldeweg T, Whittington MA. Pathway-specific habituation of induced gamma oscillations in the hippocampal slice. NeuroReport. 2000;11:2629–2633. doi: 10.1097/00001756-200008210-00005. [DOI] [PubMed] [Google Scholar]
- 20.Dragoi G, Hirase H, Buzsáki G. Changes in spontaneous discharge rates of hippocampal neurons by LTP and LTD. Soc Neurosci Abstr. 2000;26:183. [Google Scholar]
- 21.Dutar P, Nicoll RA. Classification of muscarinic responses in hippocampus in terms of receptor subtypes and second-messenger systems: electrophysiological studies in vitro. J Neurosci. 1988;8:4214–4224. doi: 10.1523/JNEUROSCI.08-11-04214.1988. [DOI] [PMC free article] [PubMed] [Google Scholar]
- 22.Eckhorn R, Frien A, Bauer R, Woelbern T, Kehr H. High frequency (60–90 Hz) oscillations in primary visual cortex of awake monkey. NeuroReport. 1993;4:243–246. doi: 10.1097/00001756-199303000-00004. [DOI] [PubMed] [Google Scholar]
- 23.Emptage N, Bliss TVP, Fine A. Single synaptic events evoke NMDA receptor-mediated release of calcium from internal stores in hippocampal dendritic spines. Neuron. 1999;22:115–124. doi: 10.1016/s0896-6273(00)80683-2. [DOI] [PubMed] [Google Scholar]
- 24.Ermentrout GB, Kopell N. Fine structure of neural spiking and synchronization in the presence of conduction delays. Proc Natl Acad Sci USA. 1998;95:1259–1264. doi: 10.1073/pnas.95.3.1259. [DOI] [PMC free article] [PubMed] [Google Scholar]
- 25.Faulkner HJ, Traub RD, Whittington MA. Disruption of synchronous gamma oscillations in the rat hippocampal slice: a common mechanism of anaesthetic drug action. Br J Pharmacol. 1998;125:483–492. doi: 10.1038/sj.bjp.0702113. [DOI] [PMC free article] [PubMed] [Google Scholar]
- 26.Faulkner HJ, Traub RD, Whittington MA. Anaesthetic/amnesic agents disrupt beta frequency oscillations associated with potentiation of excitatory synaptic potentials in the rat hippocampal slice. Br J Pharmacol. 1999;128:1813–1825. doi: 10.1038/sj.bjp.0702948. [DOI] [PMC free article] [PubMed] [Google Scholar]
- 27.Fuchs E, Doheny HC, Faulkner HJ, Caputi A, Traub RD, Bibbig A, Kopell N, Whittington MA, Monyer H. Genetically altered AMPA-type glutamate receptor kinetics in interneurons disrupt long-range synchrony of gamma oscillation. Proc Natl Acad Sci USA. 2001;98:3571–3576. doi: 10.1073/pnas.051631898. [DOI] [PMC free article] [PubMed] [Google Scholar]
- 28.Geiger JRP, Melcher T, Koh D-S, Sakmann B, Seeburg PH, Jonas P, Monyer H. Relative abundance of subunit mRNAs determines gating and Ca2+ permeability of AMPA receptors in principal neurons and interneurons in rat CNS. Neuron. 1995;15:193–204. doi: 10.1016/0896-6273(95)90076-4. [DOI] [PubMed] [Google Scholar]
- 29.Gray CM. Synchronous oscillations in neuronal systems: mechanisms and functions. J Comput Neurosci. 1994;1:11–38. doi: 10.1007/BF00962716. [DOI] [PubMed] [Google Scholar]
- 30.Guérineau NC, Gähwiler NC, Gerber U. Reduction of resting K+ current by metabotropic glutamate and muscarinic receptors in rat CA3 cells: mediation by G-proteins. J Physiol (Lond) 1994;474:27–33. doi: 10.1113/jphysiol.1994.sp019999. [DOI] [PMC free article] [PubMed] [Google Scholar]
- 31.Haenschel C, Baldeweg T, Croft RJ, Whittington M, Gruzelier J. Gamma and beta frequency oscillations in response to novel auditory stimuli: a comparison of human electroencephalogram (EEG) data with in vitro models. Proc Natl Acad Sci USA. 2000;97:7645–7650. doi: 10.1073/pnas.120162397. [DOI] [PMC free article] [PubMed] [Google Scholar]
- 32.Heuss C, Scanziani M, Gähwiler BH, Gerber U. G-protein-independent signaling mediated by metabotropic glutamate receptors. Nat Neurosci. 1999;2:1070–1077. doi: 10.1038/15996. [DOI] [PubMed] [Google Scholar]
- 33.Kerr B, Hill H, Coda B, Calogero M, Chapman CR, Hunt E, Buffington V, Mackie A. Concentration-related effects of morphine on cognition and motor control in human subjects. Neuropsychopharmacology. 1991;5:157–166. [PubMed] [Google Scholar]
- 34.Koester HJ, Sakmann B. Calcium dynamics in single spines during coincident pre- and postsynaptic activity depend on relative timing of back-propagating action potentials and subthreshold excitatory postsynaptic potentials. Proc Natl Acad Sci USA. 1998;95:9596–9601. doi: 10.1073/pnas.95.16.9596. [DOI] [PMC free article] [PubMed] [Google Scholar]
- 35.Kopell N, Ermentrout GB, Whittington MA, Traub RD. Gamma rhythms and beta rhythms have different synchronization properties. Proc Natl Acad Sci USA. 2000;97:1867–1872. doi: 10.1073/pnas.97.4.1867. [DOI] [PMC free article] [PubMed] [Google Scholar]
- 36.Laezza F, Doherty JJ, Dingledine R. Long-term depression in hippocampal interneurons: joint requirement for pre- and postsynaptic events. Science. 1999;285:1411–1414. doi: 10.1126/science.285.5432.1411. [DOI] [PubMed] [Google Scholar]
- 37.Madison DV, Nicoll RA. Control of the repetitive discharge of rat CA1 pyramidal neurones in vitro. J Physiol (Lond) 1984;354:319–331. doi: 10.1113/jphysiol.1984.sp015378. [DOI] [PMC free article] [PubMed] [Google Scholar]
- 38.Madison DV, Nicoll RA. Enkephalin hyperpolarizes interneurones in the rat hippocampus. J Physiol (Lond) 1988;398:123–130. doi: 10.1113/jphysiol.1988.sp017033. [DOI] [PMC free article] [PubMed] [Google Scholar]
- 39.Majewska A, Brown E, Ross J, Yuste R. Mechanisms of calcium decay kinetics in hippocampal spines: role of spine calcium pumps and calcium diffusion through the spine neck in biochemical compartmentalization. J Neurosci. 2000;20:1722–1734. doi: 10.1523/JNEUROSCI.20-05-01722.2000. [DOI] [PMC free article] [PubMed] [Google Scholar]
- 40.Markram H, Lübke J, Frotscher M, Sakmann B. Regulation of synaptic efficacy by coincidence of postsynaptic APs and EPSPs. Science. 1997;275:213–215. doi: 10.1126/science.275.5297.213. [DOI] [PubMed] [Google Scholar]
- 41.Martina M, Vida I, Jonas P. Distal initiation and active propagation of action potentials in interneuron dendrites. Science. 2000;287:295–300. doi: 10.1126/science.287.5451.295. [DOI] [PubMed] [Google Scholar]
- 42.Miltner WHR, Braun C, Arnold M, Witte H, Taub E. Coherence of gamma-band EEG activity as a basis for associative learning. Nature. 1999;397:434–436. doi: 10.1038/17126. [DOI] [PubMed] [Google Scholar]
- 43.Miyakawa H, Lev-Ram V, Lasser-Ross N, Ross WN. Calcium transients evoked by climbing fibre and parallel fibre synaptic inputs in guinea pig cerebellar Purkinje neurons. J Neurophysiol. 1992;68:1178–1189. doi: 10.1152/jn.1992.68.4.1178. [DOI] [PubMed] [Google Scholar]
- 44.Nakamura T, Barbara J-G, Nakamura K, Ross WN. Synergistic release of Ca2+ from IP3-sensitive stores evoked by synaptic activation of mGluRs paired with backpropagating action potentials. Neuron. 1999;24:727–737. doi: 10.1016/s0896-6273(00)81125-3. [DOI] [PubMed] [Google Scholar]
- 45.Nakamura T, Nakamura K, Lasser-Ross N, Barbara J-G, Sandler VM, Ross WN. Inositol 1,4,5-triphosphosphate (IP3)-mediated Ca2+ release evoked by metabotropic agonists and backpropagating action potentials in hippocampal CA1 pyramidal neurons. J Neurosci. 2000;20:8365–8376. doi: 10.1523/JNEUROSCI.20-22-08365.2000. [DOI] [PMC free article] [PubMed] [Google Scholar]
- 46.Normann C, Peckys D, Schulze CH, Walden J, Jonas P, Bischofberger J. Associative long-term depression in the hippocampus is dependent on postsynaptic N-type Ca2+ channels. J Neurosci. 2000;20:8290–8297. doi: 10.1523/JNEUROSCI.20-22-08290.2000. [DOI] [PMC free article] [PubMed] [Google Scholar]
- 47.Ouardouz M, Lacaille J-C. Mechanisms of selective long-term potentiation of excitatory synapses in stratum oriens/alveus interneurons of rat hippocampal slices. J Neurophysiol. 1995;73:810–819. doi: 10.1152/jn.1995.73.2.810. [DOI] [PubMed] [Google Scholar]
- 48.Perez Y, Morin F, Lacaille J-C. mGluR-mediated LTP of minimally evoked EPSCs in hippocampal oriens interneurons induced by theta burst stimulation. Soc Neurosci Abstr. 2000;26:362. [Google Scholar]
- 49.Perez Y, Morin F, Lacaille JC. A hebbian form of long-term potentiation dependent on mGluR1a in hippocampal inhibitory interneurons. Proc Natl Acad Sci USA. 2001;98:9401–9406. doi: 10.1073/pnas.161493498. [DOI] [PMC free article] [PubMed] [Google Scholar]
- 50.Pozzo-Miller LD, Connor JA, Andrews SB. Microheterogeneity of calcium signalling in dendrites. J Physiol (Lond) 2000;525:53–61. doi: 10.1111/j.1469-7793.2000.t01-1-00053.x. [DOI] [PMC free article] [PubMed] [Google Scholar]
- 51.Prechtl JC. Visual motion induces synchronous oscillations in turtle visual cortex. Proc Natl Acad Sci USA. 1994;91:12467–12471. doi: 10.1073/pnas.91.26.12467. [DOI] [PMC free article] [PubMed] [Google Scholar]
- 52.Rae MG, Martin DJ, Collingridge GL, Irving AJ. Role of Ca2+ stores in metabotropic L-glutamate receptor-mediated supralinear Ca2+ signaling in rat hippocampal neurons. J Neurosci. 2000;20:8628–8636. doi: 10.1523/JNEUROSCI.20-23-08628.2000. [DOI] [PMC free article] [PubMed] [Google Scholar]
- 53.Rodriguez E, George N, Lachaux J-P, Martinerie J, Renault B, Varela FJ. Perception's shadow: long-distance synchronization of human brain activity. Nature. 1999;397:430–433. doi: 10.1038/17120. [DOI] [PubMed] [Google Scholar]
- 54.Rozov A, Zilberter Y, Wollmuth LP, Burnashev N. Facilitation of currents through rat Ca2+-permeable AMPA receptor channels by activity-dependent relief from polyamine block. J Physiol (Lond) 1998;511:361–377. doi: 10.1111/j.1469-7793.1998.361bh.x. [DOI] [PMC free article] [PubMed] [Google Scholar]
- 55.Schiller J, Schiller Y, Clapham DE. NMDA receptors amplify calcium influx into dendritic spines during associative pre- and postsynaptic activation. Nat Neurosci. 1998;1:114–118. doi: 10.1038/363. [DOI] [PubMed] [Google Scholar]
- 56.Schwartz NE, Alford S. Physiological activation of presynaptic metabotropic glutamate receptors increases intracellular calcium and glutamate release. J Neurophysiol. 2000;84:415–427. doi: 10.1152/jn.2000.84.1.415. [DOI] [PubMed] [Google Scholar]
- 57.Stanton PK, Sejnowski TJ. Associative long-term depression in the hippocampus induced by hebbian covariance. Nature. 1989;339:215–218. doi: 10.1038/339215a0. [DOI] [PubMed] [Google Scholar]
- 58.Tallon-Baudry C, Bertrand O, Peronnet F, Pernier J. Induced gamma-band activity during the delay of a visual short-term memory task in humans. J Neurosci. 1998;18:4244–4254. doi: 10.1523/JNEUROSCI.18-11-04244.1998. [DOI] [PMC free article] [PubMed] [Google Scholar]
- 59.Tallon-Baudry C, Kreiter A, Bertrand O. Sustained and transient oscillatory responses in the gamma and beta bands in a visual short-term memory task in humans. Vis Neurosci. 1999;16:449–459. doi: 10.1017/s0952523899163065. [DOI] [PubMed] [Google Scholar]
- 60.Traub RD, Miles R. Pyramidal cell-to-inhibitory cell spike transduction explicable by active dendritic conductances in inhibitory cell. J Comput Neurosci. 1995;2:291–298. doi: 10.1007/BF00961441. [DOI] [PubMed] [Google Scholar]
- 61.Traub RD, Jefferys JGR, Miles R, Whittington MA, Tóth K. A branching dendritic model of a rodent CA3 pyramidal neurone. J Physiol (Lond) 1994;481:79–95. doi: 10.1113/jphysiol.1994.sp020420. [DOI] [PMC free article] [PubMed] [Google Scholar]
- 62.Traub RD, Whittington MA, Colling SB, Buzsáki G, Jefferys JGR. Analysis of gamma rhythms in the rat hippocampus in vitro and in vivo. J Physiol (Lond) 1996a;493:471–484. doi: 10.1113/jphysiol.1996.sp021397. [DOI] [PMC free article] [PubMed] [Google Scholar]
- 63.Traub RD, Whittington MA, Stanford IM, Jefferys JGR. A mechanism for generation of long-range synchronous fast oscillations in the cortex. Nature. 1996b;383:621–624. doi: 10.1038/383621a0. [DOI] [PubMed] [Google Scholar]
- 64.Traub RD, Spruston N, Soltesz I, Konnerth A, Whittington MA, Jefferys JGR. Gamma-frequency oscillations: a neuronal population phenomenon regulated by synaptic and intrinsic cellular processes, and inducing synaptic plasticity. Prog Neurobiol. 1998;55:1–13. doi: 10.1016/s0301-0082(98)00020-3. [DOI] [PubMed] [Google Scholar]
- 65.Traub RD, Whittington MA, Buhl EH, Jefferys JGR, Faulkner HJ. On the mechanism of the γ→β frequency shift in neuronal oscillations induced in rat hippocampal slices by tetanic stimulation. J Neurosci. 1999;19:1088–1105. doi: 10.1523/JNEUROSCI.19-03-01088.1999. [DOI] [PMC free article] [PubMed] [Google Scholar]
- 66.von Stein A, Rappelsberger P, Sarnthein J, Petsche H. Synchronization between temporal and parietal cortex during multimodal object processing in man. Cereb Cortex. 1999;9:137–150. doi: 10.1093/cercor/9.2.137. [DOI] [PubMed] [Google Scholar]
- 67.Whittington MA, Traub RD, Jefferys JGR. Synchronized oscillations in interneuron networks driven by metabotropic glutamate receptor activation. Nature. 1995;373:612–615. doi: 10.1038/373612a0. [DOI] [PubMed] [Google Scholar]
- 68.Whittington MA, Traub RD, Faulkner HJ, Stanford IM, Jefferys JGR. Recurrent excitatory postsynaptic potentials induced by synchronized fast cortical oscillations. Proc Natl Acad Sci USA. 1997a;94:12198–12203. doi: 10.1073/pnas.94.22.12198. [DOI] [PMC free article] [PubMed] [Google Scholar]
- 69.Whittington MA, Stanford IM, Colling SB, Jefferys JGR, Traub RD. Spatiotemporal patterns of γ frequency oscillations tetanically induced in the rat hippocampal slice. J Physiol (Lond) 1997b;502:591–607. doi: 10.1111/j.1469-7793.1997.591bj.x. [DOI] [PMC free article] [PubMed] [Google Scholar]
- 70.Whittington MA, Traub RD, Faulkner HJ, Jefferys JGR, Chettiar K. Morphine disrupts long-range synchrony of gamma oscillations in hippocampal slices. Proc Natl Acad Sci USA. 1998;95:5807–5811. doi: 10.1073/pnas.95.10.5807. [DOI] [PMC free article] [PubMed] [Google Scholar]
- 71.Whittington MA, Doheny HC, Traub RD, LeBeau FEN, Buhl EH. Differential expression of synaptic and non-synaptic mechanisms underlying stimulus-induced γ oscillations in vitro. J Neurosci. 2001;21:1727–1738. doi: 10.1523/JNEUROSCI.21-05-01727.2001. [DOI] [PMC free article] [PubMed] [Google Scholar]
- 72.Yang S-N, Tang Y-G, Zucker RS. Selective induction of LTP and LTD by postsynaptic [Ca2+]i elevation. J Neurophysiol. 1999;81:781–787. doi: 10.1152/jn.1999.81.2.781. [DOI] [PubMed] [Google Scholar]
- 73.Yuste R, Denk W. Dendritic spines as basic functional units of neuronal integration. Nature. 1995;375:682–684. doi: 10.1038/375682a0. [DOI] [PubMed] [Google Scholar]
- 74.Zucker RS. Calcium- and activity-dependent synaptic plasticity. Curr Opin Neurobiol. 1999;9:305–313. doi: 10.1016/s0959-4388(99)80045-2. [DOI] [PubMed] [Google Scholar]