

Abstract
In cultured neurons, axon formation is preceded by the appearance in one of the multiple neurites of a large growth cone containing a labile actin network and abundant dynamic microtubules. The invasion-inducing T-lymphoma and metastasis 1 (Tiam1) protein that functions as a guanosine nucleotide exchange factor for Rac1 localizes to this neurite and its growth cone, where it associates with microtubules. Neurons overexpressing Tiam1 extend several axon-like neurites, whereas suppression of Tiam1 prevents axon formation, with most of the cells failing to undergo changes in growth cone size and in cytoskeletal organization typical of prospective axons. Cytochalasin D reverts this effect leading to multiple axon formation and penetration of microtubules within neuritic tips devoid of actin filaments. Taken together, these results suggest that by regulating growth cone actin organization and allowing microtubule invasion within selected growth cones, Tiam1 promotes axon formation and hence participates in neuronal polarization.
Keywords: Tiam1, microtubules, microfilaments, axons, growth cones, polarity
Neuronal polarization occurs when one of the multiple neurites emerging from the cell body initiates a phase of rapid elongation; this neurite becomes the axon, whereas the remaining ones develop as dendrites (Dotti et al., 1988). In cultured hippocampal pyramidal neurons, axon formation is preceded by the appearance in one of the multiple neurites of a large and highly dynamic growth cone containing a very labile actin network (Bradke and Dotti, 1997, 1999;Paglini et al., 1998a). Thus, the regulation of actin organization and activity within selected growth cones appears to be one of the major factors underlying the establishment of neuronal polarity.
Members of the Ras superfamily of small GTPases control a wide variety of cellular responses (Bogusky and McCormick, 1993) and a subgroup of this family, the Rho-like GTPases, affects the organization of the actin cytoskeleton. In fibroblasts, Cdc42 is involved in the induction of filopodia, whereas Rac induces the formation of lamellipodia, and Rho leads to the assembly of actin stress fibers (Ridley and Hall, 1992; Ridley et al., 1992; Nobes and Hall, 1995). Not surprisingly, Rho-like GTPases have recently been put forward as potential regulators of neurite outgrowth. Activation of Rho by thrombin and the lysophospholipid LPA induces neurite retraction in mouse neuroblastoma cells (Mackay et al., 1995), whereas expression of constitutively active variants of Rac promote neurite extension in Drosophila (Luo et al., 1994) and primary neurons (van Leeuwen et al., 1997); conversely, inhibition of Rac activity in both Drosophilaand mice blocks the growth of axons (Luo et al., 1994,1996). Taken collectively, these observations demonstrate that Rac- and Rho-mediated pathways oppose each other during neurite formation and that regulation of their balance may have a role in determining neuronal morphology.
Evidence in favor of such a possibility has come from studies showing the involvement of guanosine nucleotide exchange factors (GEFs), which activate these GTPases by catalyzing the exchange of GDP for GTP. One of these factors is the invasion-inducing T-lymphoma and metastasis 1 (Tiam1) protein that functions as a GEF for Rac1 (Habets et al., 1994). Tiam1 is expressed at high levels in the developing brain (Habets et al., 1995), and its overexpression promotes lamellar spreading and neurite formation in neuroblastoma cells (van Leeuwen et al., 1997). Because one of the early events during neuronal polarization appears to involve the regulation of actin organization and dynamics by Rho-GTPases (Bradke and Dotti, 1999), it may well be that factors such as Tiam1 have an active participation in this event.
To test this hypothesis, in the present study we have analyzed the pattern of expression, subcellular distribution, and consequences of Tiam1 overexpression and suppression on axon formation in cultured hippocampal pyramidal neurons. The results obtained suggest the participation of Tiam1 in the establishment of neuronal polarity.
MATERIALS AND METHODS
Cell culture. Dissociated cultures of hippocampal pyramidal cells from embryonic rat brain tissue were prepared as described previously (Cáceres et al., 1986;Mascotti et al., 1997). Cells were plated onto polylysine-coated glass coverslips (12 or 25 mm in diameter) at densities ranging from 5,000 to 15,000 cells/cm2 and maintained with DMEM plus 10% horse serum for 1 hr. The coverslips with the attached cells were then transferred to 60 mm Petri dishes containing serum-free medium plus the N2 mixture of Bottenstein and Sato (1979). All cultures were maintained in a humidified 37°C incubator with 5% CO2. For some experiments cytochalasin D was added to the cultures at a concentration of 0.5 μg/ml.
Expression construct and transient transfection assays. A Tiam1 cDNA (C1199) (Habets et al., 1994; van Leeuwen et al., 1997) cloned as aBamHI/XhoI fragment into pcDNA3 containing a cytomegalovirus promoter and a hemoagglutinin (HA) tag (Invitrogen, Carlsbad, CA), a generous gift of Dr. John Collard (The Netherlands Cancer Institute, Amsterdam, The Netherlands), was used for transfection of primary neurons. Transient transfection of cultured hippocampal pyramidal neurons was performed using the modified calcium phosphate precipitation method described by Xia et al., (1996).
Antisense oliqonucleotides. Phosphorothioate oligonucleotides were used in this study. One of them, designated AST1a, corresponds to the sequence AACGTCCGATGACAGCCTTAAACCA and is the inverse complement of nucleotides +1231–1255 of the sequence of mouse Tiam1; oligonucleotide AST1b, consisting of the sequence AGAGACTCCTCCGTACAGTAATTA, is the inverse complement of nucleotides +1307–1330 of the mouse sequence. Both of the regions selected from the sequence show no significant homology with any other sequence, except for that of Tiam1.
The oligonucleotides were purified by reverse chromatography and taken up in serum-free medium as described previously (Paglini et al., 1998a,b). For all experiments the antisense oligonucleotides were preincubated with 2 μl of Lipofectin Reagent (1 mg/ml; Life Technologies, Gaithersburg, MD) diluted in 100 μl of serum-free medium. The resulting oligonucleotide suspension was then added to the primary cultured neurons at concentrations ranging from 0.5 to 5 μm. Control cultures were treated with the same concentration of the corresponding sense-strand oligonucleotides.
Primary antibodies. The following primary antibodies were used in this study: a monoclonal antibody (mAb) against tyrosinated α-tubulin (clone TUB-1A2, mouse IgG; Sigma, St. Louis, MO) diluted 1:1000; an mAb against microtubule-associated protein (MAP)1b clone AA6 (DiTella et al., 1996) diluted 1:500; an mAb against MAP2 (clone AP14) (Caceres et al., 1992); an mAb against tau (clone tau-1) (Caceres et al., 1992); a rabbit antiserum against α- and β-tubulin (Sigma); an affinity-purified rabbit polyclonal antibody raised against a peptide corresponding to an amino acid sequence mapping at the C terminus of Tiam1 of mouse origin (C16; Santa Cruz Biotechnology, Santa Cruz, CA) diluted 1:500, 1:100 or 1:50; an mAb against a peptide corresponding to an amino acid sequence of RhoA of human origin (clone 26C4, mouse IgG; Santa Cruz Biotechnology) diluted 1:100 or 1:50; and an affinity-purified rabbit polyclonal antibody raised against a peptide corresponding to an amino acid sequence mapping at the C terminus of Rac1 of human origin (identical to mouse sequence, C14; Santa Cruz Biotechnology) diluted 1:100 or 1:50.
Immunofluorescence. Cells were fixed before or after detergent extraction under microtubule-stabilizing conditions and processed for immunofluorescence as described previously (Paglini et al., 1998a). For some experiments a mild extraction protocol that preserves cytoskeletal-membrane interactions was also used (Nakata and Hirokawa, 1987; Brandt et al., 1995; Paglini et al., 1998b). The antibody staining protocol entailed labeling with the first primary antibody, washing with PBS, staining with labeled secondary antibody (fluorescein or rhodamine conjugated), and washing similarly; the same procedure was repeated for the second primary antibody. Incubations with primary antibodies were for 1 or 3 hr at room temperature, whereas incubations with secondary antibodies were performed for 1 hr at 37°C. For some experiments, rhodamine-labeled phalloidin (Molecular Probes, Eugene, OR) was included with the secondary antibody to visualize filamentous actin (F-actin). The cells were analyzed with aZeiss LSM 410 confocal scanning microscope or with an inverted microscope (Carl Zeiss Axiovert 35M) equipped with epifluorescence and differential interference contrast optics. For some experiments, the relative intensities of tubulin, Tiam1, Rac1, and RhoA immunofluorescence, as well as of phalloidin staining, were evaluated in fixed unextracted cells or in detergent-extracted cytoskeletons using quantitative fluorescence techniques as described previously (Paglini et al., 1998a,b). To image labeled cells, the incoming epifluorescence illumination was attenuated with glass neutral density filters. Images were formed on the faceplate of a Silicon Intensified Target camera (SIT; Hamamatsu Corporation, Middlesex, NJ) set for manual sensitivity, gain, and black level; they were digitized directly into a Metamorph/Metafluor Image Processor (Universal Imaging Corporation, West Chester, PA) controlled by a host IBM-AT computer and stored on laser discs with an optical memory disc recorder (OMDR, LQ-3031, Panasonic). Fluorescence intensity measurements were performed pixel by pixel within the cell body and neurites of identified neurons; using this data, we then calculated the average fluorescence intensity within the cell body and inner, middle, and distal third of identified neurites (either minor processes or axons), including the central and peripheral regions of growth cones. Photographs were printed using Adobe Photoshop.
Subcellular fractionation techniques. Fetal rat brain (18 d of gestation) was fractionated according to Pfenninger et al. (1983) (see also Paglini et al., 1998a,b) to obtain growth cone particles (GCPs). Briefly, the low speed supernatant of fetal brain homogenate was loaded on a discontinuous sucrose gradient in which the 0.75 and 1 m sucrose layers were replaced with a single 0.83 m sucrose step. This facilitated collection of the interface and increased GCP yield without decreasing purity (Quiroga et al., 1995). The 0.32m/0.83 m interface, or A fraction, was collected, diluted with 0.32 m sucrose, and pelleted to give the GCP fraction. This was resuspended in 0.32 msucrose for experimentation.
Preparation of microtubules. Microtubules were prepared from 5-d-old rat brains through three cycles of temperature-dependent assembly–disassembly purification as described by Ihara et al. (1979). Microtubules were also prepared essentially according to the taxol method of Vallee (1982). To dissociate MAPs from microtubules, microtubule pellets were resuspended in buffer A (0.1 m MES, pH 6.5, 1 mm EGTA, 1 mmMgCl2) containing 1 mm GTP and 20 μm taxol, and NaCl was added to 0.5 m. After incubation at 37°C for 10 min, the solution was centrifuged at 30,000 × g for 25 min, leaving the MAPs in the supernatant (Vallee, 1982). The MAP fraction was submitted to gel filtration on a Superose 12 HR 10/30 column (Pharmacia, Upsala, Sweden) equilibrated and eluted with 20 mm PIPES, pH 6.9, 0.1 mNaCl, 1 mm EGTA, 0.5 mm MgCl2, 1 mmdithiothreitol, and 0.1 mm GTP at a flow rate of 0.5 ml/min, and fractions of 0.25 ml were collected. The MAP fraction was also loaded on a phosphocellulose (P11) (Whatman, Maidstone, UK) column equilibrated with buffer A and eluted with buffer A containing 0.1–0.5m NaCl in stepwise increments [see alsoMorishima-Kawashima and Kosik (1996)].
Western blot analysis of Tiam1 protein expression. Changes in the levels of Tiam1 during neuronal development were analyzed by Western blotting as described previously (Paglini et al., 1998a,b). Briefly, equal amounts of crude brain homogenates or whole-cell extracts from cultured cells were separated on SDS-PAGE and transferred to polyvinylidene difluoride membranes in a Tris-glycine buffer, 20% methanol. The filters were dried, washed several times with TBS (10 mm Tris, pH 7.5, 150 mm NaCl), and blocked for 1 hr in TBS containing 5% BSA. The filters were incubated for 1 hr at 37°C with the primary antibodies in TBS containing 5% BSA. They were then washed three times (10 min each) in TBS containing 0.05% Tween 20 and incubated with a secondary horseradish peroxidase-conjugated antibody (Promega Corporation, Madison, WI) for 1 hr at 37°C. After five washes with TBS and 0.05% Tween 20, the blots were developed using a chemiluminiscence detection kit (ECL, Amersham Life Science, Buckinghamshire, England).
Morphometric analysis of neuronal shape parameters. Images were digitized on a video monitor using Metamorph/Metafluor software. To measure neurite length or growth cone shape parameters, fixed unstained or antibody-labeled cells were randomly selected and traced from a video screen using the morphometric menu of the Metamorph as described previously (Paglini et al., 1998a,b). Differences among groups were analyzed by the use of ANOVA and Student–Newman–Keuls test.
RESULTS
Changes in the morphology and cytoskeletal organization of growth cones during the establishment of neuronal polarity
In the first set of experiments, changes in growth cone size and shape, as well as in the distribution of microtubules and microfilaments, were evaluated in control hippocampal pyramidal neurons maintained in culture for 24 hr. At this time point, ∼70% of the neurons have extended a symmetric array of short neurites, designated as minor processes (stage 2) (Dotti et al., 1988), whereas 25% have already extended an axon (stage 3) that exceeds the length of the other processes in >20 μm. We observed that in >60% of stage 2 cells, a single growth cone was distinctively larger than the others [see also Bradke and Dotti (1997)]. Quantitative measurements of growth cone surface area revealed that this growth cone was three to four times larger than those of the remaining minor neurites (Fig.1A,B); a similar phenomenon was detected in the majority of stage 3 cells (Fig.1A,B).
Fig. 1.

A, Graph showing variations in surface area (μm2) of growth cones from minor processes (MP), prospective axons (pAxon), and axons (Axon) of stage 2 or 3 hippocampal pyramidal neurons.B, Frequency histogram analysis showing variations in growth cone surface among MP, prospective axons, and axons of stage 2–3 hippocampal pyramidal neurons. C, A confocal micrograph showing a stage 2 neuron with several minor neurites; note that one of them displays a large growth cone. The cell was double labeled with an mAb against tyrosinated α-tubulin (green) and rhodamine phalloidin (red). D, E, High-power confocal images showing the distribution of microtubules (green) and F-actin (red) in large growth cones from stage 2 hippocampal pyramidal neurons. Note that the growth cones display a large, flattened lamellipodial veil with short actin ribs and that microtubules enter the central growth cone region.F, G, High-power fluorescence micrographs showing the distribution of tyrosinated α-tubulin (F) and F-actin (G) in a small growth cone of a stage 2 hippocampal pyramidal neuron. H, Red-greenoverlay of the images shown in F and G. Note that F-actin (red) occupies the central and peripheral region of the growth cone and that microtubules (green) end at its base. Scale bars: C, 10 μm; D, E, 5 μm; F–H, 7 μm.
Confocal and high-resolution fluorescence microscopy of stage 2 or 3 neurons labeled with an mAb against tyrosinated α-tubulin and rhodamine phalloidin revealed that the larger growth cone displays a central microtubule-containing zone completely surrounded by a peripheral lamellipodial veil composed of a radially oriented array of short actin ribs (Fig. 1C–E). By contrast, the remaining minor neurites display growth cones with radial striations that originate at the base of the growth cone and reach its periphery; in addition, fewer microtubules penetrate in the central growth cone region, with the majority of them ending at its base (Fig.1F–H). Taken together, these observations strongly suggest that a major change accompanying the transformation of a growth cone from a minor neurite into that of an axon involves an expansion of the peripheral lamellipodial veil, a shortening of actin ribs, and the penetration of dynamic microtubules within the central growth cone region.
Expression of Tiam1 during neuronal development
The monospecificity of the affinity-purified rabbit polyclonal antibody raised against a peptide corresponding to an amino acid sequence mapping at the C terminus of Tiam1 of mouse origin is shown in Figure 2A. This antibody recognizes a single band of ∼190 kDa Mr in Western blots of whole-cell homogenates from the cerebral cortex of developing rats (Fig. 2A, lanes 1–3). In the cerebral cortex or hippocampus, the expression of the Tiam1-immunoreactive protein species is higher at late embryonic and early postnatal days and declines gradually but significantly until adulthood, where the lowest levels are detected. A similar analysis performed with cell extracts obtained from cultured hippocampal pyramidal neurons revealed an increase in Tiam1 protein levels 24 hr after plating, just at the time in which cells are beginning to extend axons; no further increases were detected at later time points. RhoA also increases with a similar time course, whereas Rac1 protein levels peak 1 d after plating and afterward show a slight decrease (data not shown).
Fig. 2.

A, Specificity of the affinity-purified peptide antibody against Tiam1 (C-16) as revealed by Western blot analysis of whole-tissue extracts obtained from the cerebral cortex of 3-d-old rats. The Tiam1 antibody diluted 1:100 (lane 1) or 1:250 (lane 2) stains a single immunoreactive protein species with an apparent molecular weight of 190 kDa. The staining generated by this antibody (dilution 1:100) is completely abolished by neutralization with the corresponding purified peptide (lane 3). Ten micrograms of total protein were loaded in each lane.B, Red-green overlay showing the distribution of Tiam1 (green) and F-actin (red) in a stage 1 hippocampal pyramidal neuron; note that Tiam1 immunofluorescence is localized to the cell body. For this experiment the Tiam1 antibody was used at a concentration of 1 μg/ml. C, D, Double-immunofluorescence micrographs showing the distribution of tyrosinated α-tubulin (green) and Tiam1 (red) in stage 2 hippocampal pyramidal neurons. Note that Tiam1 is preferentially localized to a single neurite; this neurite usually displays the larger growth cone. For this experiment the antibody was used at a dilution of 1:100 (0.2 μg/ml). E, F, High-power view of an axonal growth cone from a culture labeled with the Tiam1 antibody (green) and rhodamine phalloidin (red). Note that Tiam1 immunolabeling localizes to the axonal shaft and the central and peripheral region of the growth cone. The Tiam1 antibody was used at a concentration of 1 μg/ml.G, H, Double-immunofluorescence micrographs showing the distribution of tyrosinated α-tubulin (G) and Rac1 (H) in a stage 2 hippocampal pyramidal neuron. Note that Rac1 localizes to all minor processes and their growth cones. Scale bar: B–D, G, H, 10 μm; E, F, 5 μm;I, Western blots of total homogenates from embryonic rat brain (lane 1) and growth cone particles (lane 2) reacted with antibodies against Tiam1, RhoA, and Rac1. Note that Tiam1 is enriched in the growth cone fraction. Ten micrograms of total protein were loaded in each lane.
Tiam1 preferentially localizes to the neurite displaying the larger growth cone in stage 2–3 hippocampal pyramidal cells
The subcellular distribution of Tiam1 in cultured hippocampal pyramidal neurons was analyzed by fluorescence microscopy. In stage 1 neurons, light Tiam1 immunofluorescence was found in the cell body (Fig. 2B); no staining of the lamellipodial veil that surrounds the cell body was detected in these cells (antibody concentration, 1–2 μg/ml). In stage 2 neurons, an intense staining of the cell body and one of the several minor neurites that individual cells extend was observed with the Tiam1 antibody used at a concentration of 0.2–0.5 μg/ml (Fig. 2C,D). In >90% of the cases, the minor process with the larger growth cone was the one displaying intense Tiam1 immunofluorescence. In this neurite, Tiam1 immunolabeling extends toward the tip and reaches the base and central region of the growth cone. At higher antibody concentrations (1–2 μg/ml), Tiam1 immunolabeling was also detected within the peripheral lamellipodial veil of the larger growth cone (Fig.2E,F). To test whether this pattern was shared with proteins of the Ras superfamily of small GTPases, the subcellular localization of rac1 and rhoA was analyzed in stage 2 hippocampal pyramidal neurons. The results obtained showed that both proteins have a widespread distribution localizing to all neuritic shafts and their growth cones (Fig. 2G,H). In a complementary series of experiments, we used quantitative fluorescence techniques to measure the relative amounts of Tiam1, rac1, and rhoA in axons, minor neurites, and growth cones of stage 2 or 3 hippocampal pyramidal neurons. The results obtained, which are shown in Table1, confirmed our observations and clearly established that Tiam1 immunolabeling is preferentially localized to the minor neurite displaying the larger growth cone in the case of stage 2 neurons or to the axon in stage 3 neurons.
Table 1.
Quantitative measurements of Tiam1, Rac1, and RhoA immunofluorescence in growth cones of cultured hippocampal pyramidal cells
| Minor neurites | Prospective axons | Axons | |
|---|---|---|---|
| Tiam1 | 35 ± 8 | 128 ± 131-a | 112 ± 101-a |
| Rac1 | 95 ± 6 | 105 ± 14 | 96 ± 6 |
| RhoA | 44 ± 9 | 53 ± 8 | 46 ± 7 |
Average fluorescence intensity measurements within the central region of growth cones were performed as described in Materials and Methods. Each value represents the mean ± SEM. Pixel intensity expressed in gray values: 0 (black)/255 (white). A total of 50 cells were measured for each double immunofluorescence. Prospective axons were considered minor neurites of stage 2 neurons with a growth cone of >120 μm2.
Values significantly different from those found in the minor neurites.
To confirm biochemically the presence of Tiam1 within growth cones, GCPs were isolated from the cerebral cortex (see Materials and Methods) and probed with the antibody against Tiam1 used at a concentration of 1 μg/ml. The results obtained clearly revealed that Tiam1 was not only present, but also enriched in GCPs obtained from the embryonic cerebral cortex (Fig. 2I, lanes 1,2).
Tiam1 associates with microtubules
To test whether the localization of Tiam1 in neurites and growth cones involves an interaction with components of the cytoskeleton, neurons were extracted with Triton X-100 (0.2%) before fixation under microtubule stabilizing conditions (Paglini et al., 1998a). This procedure, which selectively removes cytosolic proteins while preserving microtubules, did not significantly alter the distribution of Tiam1 when compared with that observed in cells fixed before detergent extraction. In addition, high-resolution fluorescence microscopy revealed a significant colocalization of Tiam1 with microtubules along the central and peripheral regions of axonal growth cones (Fig. 3A–D).
Fig. 3.

Tiam1 associates with microtubules.A–D, Double-fluorescence micrographs showing the distribution of tyrosinated microtubules (A), Tiam1 (B, D), and rhodamine phalloidin (C) in axonal growth cones. For this experiment cultures were extracted with detergents before fixation under microtubule-stabilizing conditions. Note that Tiam colocalizes with microtubules located in the central and peripheral regions of the growth cone; there is also some Tiam1 colocalization with F-actin. Scale bar, 5 μm. E, Western blot showing the relative levels of tubulin and Tiam1 in a total brain homogenate (lane 1) and in microtubules (lane 2) prepared through repeated cycles (3) of temperature-dependent assembly and disassembly. Tubulin was visualized with a rabbit polyclonal antibody that recognizes α- and β-tubulin, whereas Tiam1 was visualized with the C-16 antibody diluted 1:250. Total brain homogenate and microtubules were prepared from the cerebral cortex of 5-d-old rats. Five micrograms of total protein were loaded in each lane.F, Western blots showing that Tiam1 is eluted from a microtubule-associated protein (MAP) fraction in the presence of 0.3 m NaCl. For this experiment a MAP fraction was applied onto a phosphocellulose column from which the bound proteins were eluted in a stepwise gradient with 0.1–0.5 mNaCl as indicated at the top of each lane. Aliquots from each fraction were immunoblotted with antibodies against MAP1b, MAP2, Tiam1, and tau. G, Western blots show the distribution of MAP1b, Tiam1, and tau after fractionation of the MAPs on a size-exclusion column; no codistribution of Tiam with either MAP1b or tau was detected.
To verify biochemically the association of Tiam1 with microtubules, microtubules and microtubule-binding proteins were purified from high-speed extracts of newborn rat cerebral cortex using two standard methods and analyzed by immunoblotting. Co-purification through repeated cycles of temperature-dependent microtubule assembly and disassembly showed that a high proportion of Tiam1 associates with microtubules even in pellets from the third cycle of assembly (Fig.3E), the usual criterion for defining a MAP. Co-sedimentation of assembled microtubules using taxol also brought down a considerable amount of the total Tiam1 (data not shown). When the MAP fraction was separated from the tubulin fraction by increasing the salt concentration in the presence of taxol and GTP, Tiam1 distributed to the MAP fraction. To resolve Tiam1 from co-eluting MAPs, we separated the MAP fraction using a cation-exchange column, a phosphocellulose column. An immunoblot analysis of the MAP fraction applied onto and eluted from the column revealed that the elution position of Tiam1 precisely corresponds to 0.3 m NaCl eluates; Tau and MAP2 a/b proteins, but not MAP2c or MAP1b, were also detected in the 0.3 m NaCl eluate (Fig.3F). Therefore, to examine a possible association of Tiam1 with Tau or MAP2, the MAP fraction was further examined using a gel-filtration column under native conditions. The results obtained showed that almost all of the Tiam1 eluted from the column at the elution volume expected from its molecular weight; in addition, this analysis revealed no co-elution of Tiam1 with MAP1b (Fig.3G), MAP2 (data not shown), or tau (Fig. 3G). To further investigate a possible association of Tiam1 with MAPs, MAP2, tau, and MAP1b were immunoprecipitated from rat brain extracts and analyzed for the presence of Tiam1; as expected according to our previous results, no Tiam1 was detected in the immunoprecipitates (data not shown).
Overexpression of Tiam1 induces the extension of multiple axon-like neurites
The time course of expression and the subcellular localization of Tiam1 are consistent with the possibility of this protein participating in axon formation and hence in the establishment of neuronal polarity. Therefore, to investigate this possibility we first examined the consequences of Tiam1 overexpression on the morphological development of cultured hippocampal pyramidal neurons. For such a purpose, cells were transfected with an NH2 terminally truncated variant known as C1199 Tiam1. This variant can efficiently activate Rac1, is more stably expressed, and appears to be more active than the full-length protein (Habets et al., 1994; van Leeuwen et al., 1997). Cells were transfected with 6 or 12 μg of C1199 Tiam1 using a modified calcium phosphate precipitation protocol 12 hr after plating; 1 d later, the cultures were fixed and processed for immunofluorescence with antibodies against Tiam1, HA, tyrosinated α-tubulin, and tau-1, or labeled with rhodamine phalloidin. Staining with the Tiam1 antibody used at a dilution of 1:500 (0.05 μg/ml) allows for a rapid and reliable identification of transfected neurons, because cells expressing normal levels of Tiam1 display very light immunofluorescence, whereas in those overexpressing Tiam1 a very high immunofluorescence signal was detected (Fig. 4). Using this criterion we estimated a transfection efficiency of ∼5%, which is well within the value reported by Xia et al., (1996). A similar result was obtained when the cells were stained with the HA antibody (data not shown). Analysis of the morphology of neurons overexpressing C1199 Tiam1 revealed that after either 12 or 24 hr, >95% of these cells have extended several long (>50 μm) and thin processes that resemble axon-like neurites. As shown in Figure 4A–D, these neurites were highly immunoreactive with the Tiam1 antibody; interestingly, they also stained with tau1 (Fig. 4C,D), an mAb that recognizes a dephosphorylated variant of tau normally present in axonal processes (Cáceres et al., 1992;Black et al., 1996; Mandell and Banker, 1996). By contrast, cells transfected with pcDNA lacking the C1199 insert display a morphology identical to that of stage 2 or 3 control cells; in addition, almost no neurons with multiple axon-like neurites were found under this condition (data not shown).
Fig. 4.
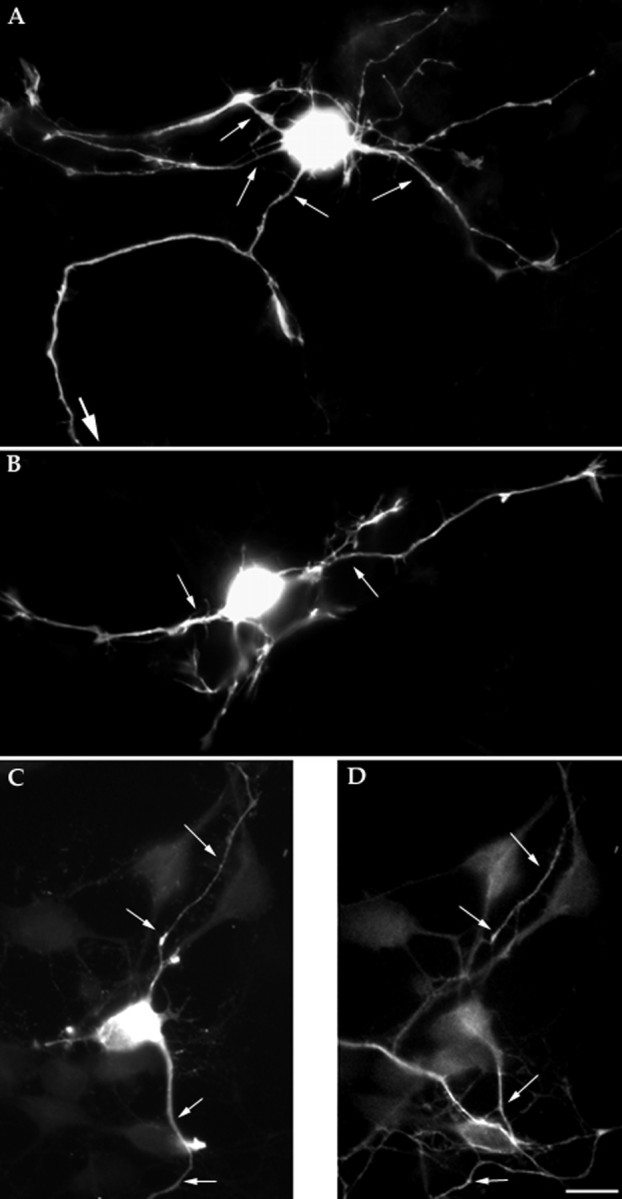
Overexpression of Tiam1 induces the extension of multiple axon-like neurites. A, B, Immunofluorescence micrographs showing hippocampal pyramidal neurons transfected with Tiam1 cDNA (C11990). The cells were transfected 12 hr after plating and fixed for immunofluorescence 1 d later; they were then stained with the Tiam1 antibody diluted 1:500. Note that the cells have extended several long and thin processes (thin arrows), which are immunoreactive for Tiam1. One of these neurites extends out of the micrograph field (thick arrow). C, D, Double-immunofluorescence micrograph showing the distribution of Tiam1 (A) and tau (D) in a hippocampal pyramidal neuron transfected with Tiam1 cDNA (C1199). Note the high Tiam1 immunofluorescence signal in the transfected neuron; note also that Tiam1-immunoreactive neurites (arrows) also stained with the tau1 antibody. Scale bar, 10 μm.
Phosphorothioate antisense oligonucleotides inhibit the expression of Tiam1 and the morphological development of neuronal polarity
In the next series of experiments we used antisense phosphorothioate oligonucleotides to inhibit the expression of Tiam1. Cultured hippocampal pyramidal cells incubated for 24 hr with 2.5, 1.25, or 0.5 μm of the AST1a antisense oligonucleotide described in Materials and Methods showed markedly reduced reactivity to the Tiam1 antibody, as assessed by Western blotting of whole-cell extracts; this phenomenon was dose dependent (Fig.5A). By contrast, cells treated with sense oligonucleotides were comparable in their immunoreactivity to untreated control ones (Fig. 5A). This analysis also revealed that treatment with the AST1b antisense oligonucleotide (2.5 μm) reduced the levels of Tiam1 (Fig. 5A). On the other hand, none of the Tiam1 antisense oligonucleotides reduced the levels of tubulin (Fig. 5A) and of several cytoskeletal-associated proteins, including the small GTPases RhoA (Fig. 5A) and Rac1 (data not shown). The presence of normal levels of these proteins in the Tiam1-suppressed cells suggests that the effect of the antisense treatment is specific and that the regulation of the expression of other proteins, including Rho-like GTPases, is independent of Tiam1.
Fig. 5.

A, Western blots showing the effect of Tiam1 antisense oligonucleotides on Tiam1, tubulin (Tub), and Rho protein levels. Lane 1, Control non-treated;lane 2, sense treated (ST1a); lane 3, sense treated (ST1b); lane 4, AST1a treated (0.5 μm); lane 5, AST1a treated (1.25 μm); lane 6, AST1a treated (2.5 μm); lane 7, AST1b treated (2.5 μm). For this experiment the oligonucleotides were added 4 hr after plating and replenished 12 hr later. Cell extracts were obtained 1 d after plating. The blots were revealed with Tiam1, tyrosinated α-tubulin, and Rho antibodies; 20 μg of protein was loaded in each lane. Lanes 3 and 4 of the blot stained with the Rho antibody contain no protein. B–I, Tiam1 suppression prevents growth cone enlargement in stage 2 neurons. Double-immunofluorescence micrographs from non-treated (B, C), sense-treated (D, E), AST1a-treated (F, G), or AST1b-treated (H, I) cultures showing the morphology of stage 2 hippocampal pyramidal neurons. Note that all control or sense-treated neurons display a neurite with a large growth cone. This phenomenon is not observed in the antisense-treated neurons; all of the growth cones are of uniform and small size. For this experiment cultures were labeled with rhodamine phalloidin (B, D, F, H) and with an mAb against tyrosinated α-tubulin (C, E, G, I). Oligonucleotides were used at concentrations of 2.5 μm. Scale bar, 10 μm.
To analyze the consequences of Tiam1 suppression on neurite outgrowth and development of polarity, the Tiam1 antisense oligonucleotides were added to the cultures shortly after plating, when most of the neurons lack neurites, and examined 24 and 36 hr later. The results obtained indicate that suppression of Tiam1 profoundly affects the development of these neurons. The most significant alteration, which was observed after treatment with 2.5 μm of either AST1a or AST1b, involved a dramatic decrease in the number of cells displaying an axon-like neurite, and hence in entering stage 3 of neuritic development (Fig. 5, Table 2). In addition, none of the stage 2 Tiam1-suppressed neurons exhibited a single growth cone significantly larger than the other ones; all of the growth cones were of small and uniform size (Fig. 5, Table 2). High-resolution fluorescence microscopy of growth cones from Tiam1-suppressed neurons labeled with an antibody against tyrosinated α-tubulin and rhodamine phalloidin revealed that all of them have long actin ribs that extend from the base of the growth cone toward its periphery, and that microtubules do not enter this F-actin-rich zone (Fig. 6). By contrast, when the medium was changed and replaced by a fresh one lacking antisense oligonucleotides, the neurons reexpressed Tiam1 (Table 2), a phenomenon initially paralleled by growth cone enlargement, lamellar spreading, and penetration of microtubules in the central growth cone region of one of the minor neurites; these events are later followed by the extension of axon-like neurites in >90% of the cells. Taken together, our observations are consistent with a model in which remodeling of the actin cytoskeleton in selected growth cones (e.g., those containing Tiam1) produces a loose actin meshwork in the central growth cone region that allows microtubule protrusion and thereafter process elongation (Forscher and Smith, 1988).
Table 2.
The inhibitory effects of the Tiam1 antisense oligonucleotides are reversible
| Antisense treatment | Hours after the release from the antisense treatment | ||
|---|---|---|---|
| 0 | 12 | 24 | |
| Non-treated | |||
| Tiam fluorescence intensity | 138 ± 14 | 135 ± 8 | 141 ± 11 |
| Growth cone area | 195 ± 15 | 206 ± 8 | |
| % Stage 2 neurons | 68 ± 5 | 10 ± 2 | |
| % Stage 3 neurons | 26 ± 3 | 85 ± 4 | |
| Sense treated | |||
| Tiam1 fluorescence intensity | 148 ± 6 | 136 ± 14 | |
| Growth cone area | 225 ± 20 | 215 ± 10 | |
| % Stage 2 neurons | 67 ± 4 | 7 ± 4 | |
| % Stage 3 neurons | 27 ± 6 | 89 ± 6 | |
| AST1a treated (2.5 μm) | |||
| Tiam1 fluorescence intensity | 12 ± 22-a | 38 ± 62-a | 107 ± 10 |
| Growth cone area | 48 ± 112-a | 95 ± 10 | 147 ± 142-a |
| % Stage 2 neurons | 89 ± 52-a | 42 ± 82-a | |
| % Stage 3 neurons | 4 ± 12-a | 52 ± 52-a | |
| AST1a treated (0.5 μm) | |||
| Tiam1 fluorescence intensity | 55 ± 82-a | 127 ± 8 | |
| Growth cone area | 108 ± 92-a | 185 ± 14 | |
| % Stage 2 neurons | 75 ± 5 | 12 ± 4 | |
| % Stage 3 neurons | 15 ± 5 | 79 ± 6 | |
Cultures were treated with the oligonucleotides for 24 hr; after that time period the medium was replaced by a fresh one lacking oligonucleotides, and the cells were analyzed at different time intervals after the release of the treatment. Data are expressed as the mean ± SEM. Tiam1 levels were determined by quantitative fluorescence as described in Materials and Methods. Measurements were performed within the cell body and are expressed in pixels. Area values are expressed in micrometers squared. Measurements were performed in the largest growth cone that stage 2 or stage 3 neurons displayed. A total of 100 cells were analyzed for each time point and experimental condition. The percentage of stage 2 or 3 cells was measured in six different coverslips for each experimental condition. A total of 100 cells were analyzed in each coverslips.
Values significantly different from those of the control groups.
Fig. 6.

A, B, Double-immunofluorescence micrographs showing the morphology and cytoskeletal organization of a large growth cone of a sense-treated neuron. The culture was labeled with an mAb against tyrosinated α-tubulin (A) and rhodamine phalloidin (B). Note the large lamellipodial veil, the short actin ribs at the growth cone edge, and the penetration of microtubules within the central and peripheral growth cone region. C, D, Equivalent micrographs but from a culture treated with the AST1a oligonucleotide (2.5 μm). Note the small size of the growth cone, that microtubules end at its base (C), and that long F-actin (D) radial striations extend from the base of the growth cone toward its periphery. Scale bar, 10 μm.
With these considerations in mind, and because previous studies have shown that global application of actin-depolymerizing drugs produced neurons with multiple axon-like neurites (Bradke and Dotti, 1999; Ruthel and Hollenbeck, 2000), we sought and to determine whether axon formation could be induced in Tiam1-suppressed neurons by treatment with cytochalasin D. For such a purpose, experimental conditions were optimized as follows. After 16–18 hr in cultures, cells were treated with a single dose of cytochalasin D (0.5 μg/ml) and fixed 3 or 12 hr later; fixed cultures were then processed for immunofluorescence. Sense and antisense oligonucleotides were added to the culture medium 2 hr after plating and replenished every 12 hr until the end of the experiment. The results obtained show that after 12 hr in the presence of cytochalasin D, control, sense-treated, or antisense-treated neurons typically display multiple long and thin processes that resemble axon-like neurites (Fig. 7A–D, Table3); in a small percentage of cases 25%), we also detected neurons with a single dominant (both longer and thicker) process. Staining with rhodamine phalloidin to visualize actin filaments showed aggregates of F-actin in the cell body and along the processes, verifying the effectiveness of the cytochalasin D treatment (Ruthel and Hollenbeck, 2000). Equivalent percentages of cells forming one, two, or more axons were detected in control and Tiam-1 suppressed cells treated with cytochalasin D. As in the case of cells overexpressing Tiam1, an axon-like neurite was defined as a process at least twice as long as any other neurite of the same cell, with a minimum length of 50 μm, and was immunoreactive for tau1. Finally, our results show that in both control and Tiam1-suppressed neurons, a 3 hr treatment with cytochalasin D (0.5 μg/ml) results in a flattening of neuritic processes and penetration of microtubules within areas devoid of F-actin, a phenomenon particularly evident at neuritic tips (Fig. 7E,F).
Fig. 7.

A, B, Double-fluorescence micrograph showing that a 12 hr treatment with cytochalasin D (0.5 μg/ml) induces the extension of several axon-like neurites in cultured hippocampal pyramidal neurons. Note the disappearance of F-actin and of growth cones at neuritic tips. C, D, A similar phenomenon is also observed in AST1a-treated neurons. E, F, Double-immunofluorescence micrographs from an AST1a-treated culture showing that a 3 hr treatment with cytochalasin D (0.5 μg/ml) induces a flattening of neuritic processes with penetration of microtubules in areas devoid of actin filaments. Note that microtubules reach the outer rim (arrows) of the flattened neuritic tips. All cultures were labeled with an mAb against tyrosinated α-tubulin (A, C, E) or rhodamine phalloidin (B, D, F). Antisense oligonucleotides were used at a concentration of 2.5 μm. Scale bar, 10 μm.
Table 3.
Effect of cytochalasin D (0.5 μg/ml) on axon formation in control and Tiam1-suppressed neurons
| Percentage of neurons with axon-like neurites | |||
|---|---|---|---|
| 1 | 2–3 | 4 or more | |
| Non-treated | 42 ± 6 | 3 ± 1 | None |
| Non-treated + cytochalasin D | 22 ± 9 | 34 ± 6 | 38 ± 10 |
| Sense-treated + cytochalasin D | 24 ± 12 | 26 ± 5 | 43 ± 9 |
| AST1a | 3 ± 0.2 | None | None |
| AST1a + cytochalasin D | 26 ± 8 | 27 ± 8 | 41 ± 12 |
Each value represents the mean ± SEM. Oligonucleotides were used at a concentration of 2.5 μm. A total of 200 cells were measured for each experimental condition. Cytochalasin D was added to the cultures 16–18 hr after plating; 12 hr later the cell were fixed and processed for immunofluorescence with antibodies against tyrosinated α-tubulin and rhodamine phalloidin.
DISCUSSION
Differentiation-dependent expression of Tiam1 in the developing brain and the consequences of its overexpression in neuroblastoma cells suggest a role for this GEF and its effector Rac in the control of neuronal morphology (Habets et al., 1995; van Leeuwen et al., 1997). The present results are fully consistent with this idea and provide direct experimental evidence revealing the functional involvement of Tiam1 in the development of neuronal polarity. Thus, one striking finding in Tiam1 antisense-treated hippocampal pyramidal neurons is the selective inhibition of axon formation, with most of the cells arrested at stage 2 and failing to undergo changes in growth cone size and in cytoskeletal organization typical of the stage 2–3 transition.
As with any study involving the use of antisense oligonucleotides, it was important to establish that the observed effects were not related to a diminution in the health of the cultures. Several observations suggest that the Tiam1 antisense oligonucleotides specifically and selectively blocked the expression of Tiam1. First, sequence analysis of the regions of the mouse Tiam1 mRNA selected for designing the antisense oligonucleotides revealed no significant homology with any other reported sequence. In addition, none of the S-modified antisense oligonucleotides used in this study contained four contiguous guanosines residues, which are believed to increase oligomer affinity to proteins and hence generate nonspecific inhibitory effects (Wagner, 1995). Second, the antisense oligonucleotide treatment dramatically reduced Tiam1 protein levels without altering the levels of several other proteins, including tubulin, RhoA, and Rac1. Finally, the effects of the antisense oligonucleotides were dose dependent, not observed when the cells were treated with equivalent doses of the corresponding “sense” oligonucleotides, and reversible after changing the medium from a fresh one lacking antisense oligonucleotides (see also below).
Growth cone enlargement, lamellipodial spreading, shortening of actin ribs, and the subsequent penetration of microtubules within the central growth cone region are hallmarks of the stage 2–3 transition in hippocampal pyramidal neurons. This reorganization of the growth cone cytoskeleton is essential for axon formation (Bradke and Dotti, 1997, 1999; Paglini et al., 1998a; this study) and absent in Tiam1-suppressed neurons. Interestingly, cytochalasin D reverts the Tiam1 phenotype, with neurons extending one or more axons. It is likely that cytochalasin D replaces Tiam1 by allowing microtubules to penetrate any neuritic tip devoid of actin filaments and hence leads to multiple axon formation (Forscher and Smith, 1988; Bradke and Dotti, 1999). Interestingly, and as predicted by these results, overexpression of Tiam1 also results in the extension of several axon-like neurites, all of which are immunoreactive for Tiam1 and Tau1. Therefore, the extension of a single axon under control conditions suggests that the regulation of actin organization and dynamics is a more restricted process, occurring only in selected growth cones. Such a selection that allows a growth cone to become either permissive or limiting for microtubule invasion and subsequent axonal growth appears to depend on factors such as Tiam1.
In this regard, two complementary lines of evidence further support a role for Tiam1 in neuronal polarization. First, we detected a high degree of temporal correlation between its expression and the morphological development of axons. Second, in cultured hippocampal pyramidal neurons, Tiam1 protein levels peak 24 hr after plating just at the time in which axon formation begins. Third, qualitative and quantitative immunofluorescence studies show that in stage 3 neurons Tiam1 preferentially localizes to axonal shafts and their growth cones. As expected, a restricted distribution of Tiam1 is also detected in neurons at the stage 2–3 transition; in these cells, Tiam1 preferentially localizes to the minor process displaying the larger growth cone. The small amount of Tiam1 detected in the remaining minor neurites of stage 2 neurons may reflect the potential of all of these processes to become axons (Dotti and Banker, 1987;Esch et al., 1999) or that the sorting machinery is still not fully developed in young neurons (Bradke and Dotti, 1997). On the other hand, it is unlikely that the preferential localization of Tiam1 to axons is the result of bulk cytoplasmic flow; such a mechanism has recently been proposed for explaining a higher amount and transport of cytoskeletal and membrane proteins to the axon during the initial establishment of polarity (Bradke and Dotti, 1997). The predominant axonal localization of Tiam1, as opposed to the widespread distribution of rac1 and rhoA, argues against bulk flow being a major single determinant of its subcellular localization. Several additional mechanisms could account for the axonal enrichment of Tiam1. In future studies it will be of interest to address this issue and to determine whether Tiam1 subcellular distribution is somehow related to its interaction with microtubules.
Thus, one additional and novel finding of the present study is that we show by immunocytochemical and biochemical methods that a substantial amount of Tiam1 associates with microtubules. The lack of co-purification and co-immunoprecipitation of Tiam1 with MAP1b, MAP2, and tau and the fact that the largest amount of Tiam1 from a MAP fraction applied to a gel filtration column eluted at the volume expected from its molecular weight suggest a direct interaction with tubulin. The association of GEFs with microtubules may not be an unusual event. For example, GEF-H1 and the Dbl-related protein, Lfc, two GEFs for rac and rho, appear to localize to microtubules in non-neuronal cells (Best et al., 1996; Ren et al., 1998; Glaven et al., 1999). Moreover, a pleckstrin homology (PH) domain of Lfc specifically associates with tubulin (Glaven et al., 1999). Interestingly, analysis of the Tiam1 sequence reveals the presence of at least two PH domains located at the C terminus of the molecule that may bind to tubulin.
The association of GEFs with tubulin may contribute to explain positive feedback interactions between microtubules and actin dynamics during cell motility (Waterman-Storer and Salmon, 1999). Thus, several recent reports have shown that the growth of microtubules in fibroblasts can lead to rac1 activation, which in turn results in actin polymerization and protrusion of the leading lamellipodia (Waterman-Storer and Salmon, 1999;Waterman-Storer et al., 1999). The association of rac-GDP, but not rac-GTP, with tubulin has been demonstrated using blot overlay assays (Best et al., 1996). On the basis of these observations, Waterman-Storer and Salmon (1999)have suggested a model in which growth of microtubules could directly activate rac1 with GTP-bound rac being released from tubulin during microtubule growth, which in turn promotes lamellipodial protrusion. Interestingly, polymerizing microtubules also activate site-directed F-actin assembly in nerve growth cones (Rochlin et al., 1999), a phenomenon that may well be related to the presence of Tiam1.
Therefore, it is likely that during the stage 2–3 transition, microtubule-associated Tiam1 could promote rac activation and hence growth cone lamellar spreading and enlargement. In favor of this view, previous studies have established that neuroblastoma cells overexpressing Tiam1 become polarized, retracting from the substrate at one end of the cell and carrying a leading lamella at the other one, like migrating fibroblast; after some time, these polarized cells begin to form neuritic-like processes that carry prominent lamellipodia at their tips (van Leeuwen et al., 1997). This response is rac dependent because it does not occur in cells coexpressing dominant–negative variants of rac and also may involve a silencing of Rho-activated pathways (van Leeuwen et al., 1997). In this regard, in future studies, it will be of interest to establish whether the disappearance of actin ribs from the central growth cone region involves Rho inactivation.
Footnotes
This work was supported by grants from CONICET (PICT-PIP 4906), FONCyT (PICT 05-00000-00937), CONICOR, Fundación Perez-Companc, Fundación Antorchas, and a Fogarty International Collaborative Award (FIRCA). It was also supported by a Howard Hughes Medical Institute grant to A.C. (HMMI 75197-553201) awarded under the International Research Scholars Program. P.K. is a fellow from CONICET. G.P. is a postdoctoral fellow from Min. Salud (Argentina).
Correspondence should be addressed to Alfredo Cáceres, Instituto Mercedes y Martín Ferreyra, Casilla de Correo 389, 5000 Córdoba, Argentina. E-mail:acaceres@immf.uncor.edu.
REFERENCES
- 1.Best A, Ahmed S, Kozma R, Lim L. The Ras-related GTPase Rac1 binds tubulin. J Biol Chem. 1996;271:3756–3762. doi: 10.1074/jbc.271.7.3756. [DOI] [PubMed] [Google Scholar]
- 2.Black M, Slaughter T, Moshiach S, Obrocka M, Fisher I. Tau is enriched on dynamic microtubules in the distal region of growing axons. J Neurosci. 1996;16:3601–3619. doi: 10.1523/JNEUROSCI.16-11-03601.1996. [DOI] [PMC free article] [PubMed] [Google Scholar]
- 3.Bogusky MS, McCormick F. Protein regulating Ras and its relatives. Nature. 1993;366:643–654. doi: 10.1038/366643a0. [DOI] [PubMed] [Google Scholar]
- 4.Bottenstein J, Sato G. Growth of a rat neuroblastoma cell line in a serum-free supplemented medium. Proc Natl Acad Sci USA. 1979;81:5613–5617. doi: 10.1073/pnas.76.1.514. [DOI] [PMC free article] [PubMed] [Google Scholar]
- 5.Bradke F, Dotti CG. Neuronal polarity: vectorial cytoplasmic flow precedes axon formation. Neuron. 1997;19:1175–1186. doi: 10.1016/s0896-6273(00)80410-9. [DOI] [PubMed] [Google Scholar]
- 6.Bradke F, Dotti CG. The role of local actin instability in axon formation. Science. 1999;283:1931–1934. doi: 10.1126/science.283.5409.1931. [DOI] [PubMed] [Google Scholar]
- 7.Brandt R, Leger J, Lee G. Interaction of tau with the neural plasma membrane mediated by tau's amino-terminal projection domain. J Cell Biol. 1995;131:1327–1340. doi: 10.1083/jcb.131.5.1327. [DOI] [PMC free article] [PubMed] [Google Scholar]
- 8.Cáceres A, Banker G, Binder LI. Immunocytochemical localization of tubulin and microtubule-associated protein 2 during the development of hippocampal neurons in culture. J Neurosci. 1986;6:714–722. doi: 10.1523/JNEUROSCI.06-03-00714.1986. [DOI] [PMC free article] [PubMed] [Google Scholar]
- 9.Cáceres A, Mautino J, Kosik KS. Suppression of MAP2 in cultured cerebellar macroneurons inhibits minor neurite formation. Neuron. 1992;9:607–618. doi: 10.1016/0896-6273(92)90025-9. [DOI] [PubMed] [Google Scholar]
- 10.Ditella M, Feipuin F, Carri N, Kosik K, Cáceres A. MAP-1b/Tau functional redundancy during laminin-enhanced axonal growth. J Cell Sci. 1996;109:467–477. doi: 10.1242/jcs.109.2.467. [DOI] [PubMed] [Google Scholar]
- 11.Dotti C, Banker G. Experimentally induced alterations in the polarity of developing neurons. Nature. 1987;330:254–256. doi: 10.1038/330254a0. [DOI] [PubMed] [Google Scholar]
- 12.Dotti CG, Sullivan CA, Banker GA. The establishment of polarity by hippocampal neurons in culture. J Neurosci. 1988;8:1454–1468. doi: 10.1523/JNEUROSCI.08-04-01454.1988. [DOI] [PMC free article] [PubMed] [Google Scholar]
- 13.Esch T, Lemmon V, Banker G. Local presentation of substrate molecules directs axon specification by cultured hippocampal neurons. J Neurosci. 1999;19:6417–6426. doi: 10.1523/JNEUROSCI.19-15-06417.1999. [DOI] [PMC free article] [PubMed] [Google Scholar]
- 14.Forscher P, Smith SJ. Actions of cytochalasins on the organization of actin filaments and microtubules in a neuronal growth cone. J Cell Biol. 1988;107:1505–1516. doi: 10.1083/jcb.107.4.1505. [DOI] [PMC free article] [PubMed] [Google Scholar]
- 15.Glaven JA, Whitehead I, Bagrodia S, Kay R, Cerione RA. The Dbl-related protein, Lfc, localizes to microtubules and mediates the activation of rac signaling pathways in cells. J Biol Chem. 1999;274:2279–2285. doi: 10.1074/jbc.274.4.2279. [DOI] [PubMed] [Google Scholar]
- 16.Habets GGM, Scholtes EHM, Zuydgeest D, van der Kammen RA, Stam JC, Berns A, Collard JG. Identification of an invasion inducing gene, Tiam1, that encodes a protein with homology to GDP-GTP exchangers for Rho-like proteins. Cell. 1994;77:537–549. doi: 10.1016/0092-8674(94)90216-x. [DOI] [PubMed] [Google Scholar]
- 17.Habets GGM, van der Kammen RA, Stam JC, Berns A, Collard JG. Sequence of the human invasion-inducing Tiam1 gene, its conservation in evolution and its expression in tumor cell lines of different tissue origin. Oncogene. 1995;10:1371–1376. [PubMed] [Google Scholar]
- 18.Ihara Y, Fujii T, Azai T, Omori A, Tanaka R, Kaziro Y. The presence of an adenosine-5′-triphosphatase dependent on 6S-tubulin and calcium ions in rat brain microtubules. J Biochem. 1979;86:587–590. doi: 10.1093/oxfordjournals.jbchem.a132560. [DOI] [PubMed] [Google Scholar]
- 19.Luo L, Liao YJ, Jan LY, Jan YN. Distinct morphogenetic functions of similar small GTPases: Drosophila Dra 1 is involved in axonal outgrowth and myoblast fusion. Gene Dev. 1994;8:1787–1802. doi: 10.1101/gad.8.15.1787. [DOI] [PubMed] [Google Scholar]
- 20.Luo L, Hensh TK, Ackerman L, Barbel S, Jan LY, Yan YN. Differential effects of the rac GTPase on Purkinje cell axons and dendritic trunks and spines. Nature. 1996;379:837–840. doi: 10.1038/379837a0. [DOI] [PubMed] [Google Scholar]
- 21.Mackay DJG, Nobes CD, Hall A. The Rho's progress: a potential role during neuritogenesis for the Rho family of GTPases. Trends Neurosci. 1995;18:496–501. doi: 10.1016/0166-2236(95)92773-j. [DOI] [PubMed] [Google Scholar]
- 22.Mandell J, Banker GA. A spatial gradient of tau protein phosphorylation in nascent axons. J Neurosci. 1996;16:5727–5740. doi: 10.1523/JNEUROSCI.16-18-05727.1996. [DOI] [PMC free article] [PubMed] [Google Scholar]
- 23.Mascotti F, Cáceres A, Pfenninger KH, Quiroga S. Expression and distribution of IGF-1 receptors containing a β-subunit (βgc) in developing neurons. J Neurosci. 1997;17:1447–1459. doi: 10.1523/JNEUROSCI.17-04-01447.1997. [DOI] [PMC free article] [PubMed] [Google Scholar]
- 24.Morishima-Kawashima M, Kosik KS. The pool of MAP kinase associated with microtubules is small but constitutively active. Mol Biol Cell. 1996;7:893–905. doi: 10.1091/mbc.7.6.893. [DOI] [PMC free article] [PubMed] [Google Scholar]
- 25.Nakata T, Hirokawa N. Cytoskeletal reorganization of human platelets after stimulation revealed by the quick-freeze deep-etch technique. J Cell Biol. 1987;106:1771–1780. doi: 10.1083/jcb.105.4.1771. [DOI] [PMC free article] [PubMed] [Google Scholar]
- 26.Nobes CD, Hall A. Rho, Rac and Cdc42 GTP-ases regulate the assembly of multi-molecular focal complexes associated with actin stress fibers, lamellipodia and filopodia. Cell. 1995;81:53–62. doi: 10.1016/0092-8674(95)90370-4. [DOI] [PubMed] [Google Scholar]
- 27.Paglini G, Kunda P, Quiroga S, Kosik K, Cáceres A. Suppression of radixin and moesin alters growth cone morphology, motility, and process formation in primary cultured neurons. J Cell Biol. 1998a;143:443–455. doi: 10.1083/jcb.143.2.443. [DOI] [PMC free article] [PubMed] [Google Scholar]
- 28.Paglini G, Pigino G, Kunda P, Morfini G, Maccioni R, Quiroga S, Cáceres A. Evidence for the participation of the neuron-specific cdk5 activator p35 during laminin-enhanced axonal growth. J Neurosci. 1998b;18:9858–9869. doi: 10.1523/JNEUROSCI.18-23-09858.1998. [DOI] [PMC free article] [PubMed] [Google Scholar]
- 29.Pfenninger K, Ellis L, Johnson M, Friedman L, Somlo L. Nerve growth cones isolated from fetal rat brain: subcellular fractionation and characterization. Cell. 1983;35:573–584. doi: 10.1016/0092-8674(83)90191-5. [DOI] [PubMed] [Google Scholar]
- 30.Quiroga S, Garofalo S, Pfenninger K. Insulin-like growth factor I receptors of fetal brain are enriched in nerve growth cones and contain a β-subunit variant. Proc Natl Acad Sci USA. 1995;92:4309–4312. doi: 10.1073/pnas.92.10.4309. [DOI] [PMC free article] [PubMed] [Google Scholar]
- 31.Ren Y, Li R, Zheng Y, Busch H. Cloning and characterization of GEF-H1, a microtubule-associated guanine nucleotide exchange factor for rac and rho GTPases. J Biol Chem. 1998;273:34954–34960. doi: 10.1074/jbc.273.52.34954. [DOI] [PubMed] [Google Scholar]
- 32.Ridley AJ, Hall A. The small GTP-binding protein rho regulates the assembly of focal adhesion and actin stress fibers in response to growth factors. Cell. 1992;70:389–399. doi: 10.1016/0092-8674(92)90163-7. [DOI] [PubMed] [Google Scholar]
- 33.Ridley AJ, Peterson HF, Johnson CI, Diekmann D, Hall A. The small GTP-binding protein rac regulates growth factor-induced membrane ruffling. Cell. 1992;70:401–410. doi: 10.1016/0092-8674(92)90164-8. [DOI] [PubMed] [Google Scholar]
- 34.Rochlin MW, Dailey ME, Bridgman PC. Polymerizing microtubules activate site-directed F-actin assembly in nerve growth cones. Mol Biol Cell. 1999;10:2309–2327. doi: 10.1091/mbc.10.7.2309. [DOI] [PMC free article] [PubMed] [Google Scholar]
- 35.Ruthel G, Hollenbeck P. Growth cones are not required for initial establishment of polarity or differential axon branch growth in cultured hippocampal neurons. J Neurosci. 2000;20:2266–2274. doi: 10.1523/JNEUROSCI.20-06-02266.2000. [DOI] [PMC free article] [PubMed] [Google Scholar]
- 36.Vallee RB. A taxol-dependent procedure for the isolation of microtubules and microtubule-associated proteins (MAPs). J Cell Biol. 1982;92:435–442. doi: 10.1083/jcb.92.2.435. [DOI] [PMC free article] [PubMed] [Google Scholar]
- 37.van Leeuwen FN, Kain HET, van der Kammen R, Michiles F, Kranenburg OW, Collard JG. The guanine nucleotide exchange factor Tiam1 affects neuronal morphology: opposing roles for the small GTPases Rac and Rho. J Cell Biol. 1997;139:797–807. doi: 10.1083/jcb.139.3.797. [DOI] [PMC free article] [PubMed] [Google Scholar]
- 38.Wagner R. The state of the art in antisense research. Nat Med. 1995;1:1116–1118. doi: 10.1038/nm1195-1116. [DOI] [PubMed] [Google Scholar]
- 39.Waterman-Storer CM, Salmon ED. Positive feed-back interactions between microtubules and actin dynamics during cell motility. Curr Opin Cell Biol. 1999;11:61–67. doi: 10.1016/s0955-0674(99)80008-8. [DOI] [PubMed] [Google Scholar]
- 40.Waterman-Storer CM, Worthylake RA, Liu BP, Burridge K, Salmon ED. Microtubule growth activates Rac1 to promote lamellipodial protrusion in fibroblasts. Nat Cell Biol. 1999;1:45–50. doi: 10.1038/9018. [DOI] [PubMed] [Google Scholar]
- 41.Xia Z, Dudek H, Miranti C, Greenberg M. Calcium influx via the NMDA receptor induces immediate early gene transcription by a MAP kinase/ERK-dependent mechanism. J Neurosci. 1996;16:5425–5436. doi: 10.1523/JNEUROSCI.16-17-05425.1996. [DOI] [PMC free article] [PubMed] [Google Scholar]