

Abstract
Trigeminal mesencephalic (Mes V) neurons are critical components of the circuits controlling oral-motor activity. The possibility that they can function as interneurons necessitates a detailed understanding of the factors controlling their soma excitability. Using whole-cell patch-clamp recording, in vitro, we investigated the development of the ionic mechanisms responsible for the previously described subthreshold membrane oscillations and rhythmical burst discharge in Mes V neurons from rats ages postnatal day (P) 2–12. We found that the oscillation amplitude and frequency increased during development, whereas bursting emerged after P6. Furthermore, when bursting was initiated, the spike frequency was largely determined by the oscillation frequency. Frequency domain analysis indicated that these oscillations emerged from the voltage-dependent resonant properties of Mes V neurons. Low doses of 4-aminopyridine (<100 μm) reduced the oscillations and abolished resonance in most neurons, suggesting that the resonant current is a steady-state K+ current (I4-AP). Sodium ion replacement or TTX reduced substantially the oscillations and peak amplitude of the resonance, suggesting the presence of a persistent Na+ current (INaP) that functions to amplify the resonance and facilitate the emergence of subthreshold oscillations and bursting.
Keywords: trigeminal mesencephalic neurons, resonance, subthreshold oscillations, oral-motor activity, 4-AP-sensitive current, TTX-sensitive persistent sodium current
Mesencephalic trigeminal sensory neurons (Mes V) are critical components of the brainstem circuitry responsible for oral-motor behaviors. Traditionally, they have been viewed as classic sensory neurons involved in the stretch reflex. They have a peripheral process that innervates jaw-closer muscle spindles and periodontal mechanoreceptors (Corbin and Harrison, 1940; Jerge, 1963) and central processes that project to the trigeminal motor nucleus as well as various other brainstem nuclei (Dessem and Taylor, 1989; Raappana and Arvidsson, 1993; Luo et al., 1995).
In contrast to trigeminal sensory ganglia neurons, Mes V neurons are located within the brainstem and receive synaptic inputs from various brainstem structures (Alley, 1973; Liem et al., 1992; Luo and Dessem, 1995; Buisseret-Delmas et al., 1997) and are richly endowed with various neuromessenger receptors (Copray et al., 1990; Hayar et al., 1997; Khakh et al., 1997; Pelkey and Marshall, 1998). As such, this unique location and innervation for these neurons impart them with the ability to function as interneurons (Manni et al., 1982; Kolta et al., 1990), integrating peripheral and central information pertaining to oral-motor behavior. During jaw movements, these neurons discharge at very high frequencies (Hidaka et al., 1999), yet the underlying ionic mechanisms for this behavior are not clearly understood.
Recently, using brainstem slices, it was demonstrated that after membrane depolarization Mes V neurons produce rhythmical burst discharges and subthreshold membrane oscillations of 1–5 mV that are dependent on TTX-sensitive Na+ channels (Pedroarena et al., 1999). The presence of subthreshold oscillations suggests that these neurons possess resonant properties, that is, the ability of a neuron to respond selectively to preferred frequencies of input (Hutcheon and Yarom, 2000). The presence of membrane resonance and subsequent subthreshold oscillations in Mes V neuron somas suggests that as interneurons, they are not passive relays for incoming synaptic events, but rather participate in sculpting their final output according to the factors controlling their resonant properties. Furthermore, resonance could greatly facilitate synchronous rhythmic activity between populations of coupled neurons (Lampl and Yarom, 1997), such as Mes V neurons, which are known to be electrically and synaptically coupled (Baker and Llinas, 1971; Liem et al., 1991; Luo and Dessem, 1996).
In previous studies, resonance and input frequency selectivity have been demonstrated nicely in thalamic neurons (Puil et al., 1994), cortical neurons (Gutfreund et al., 1995; Hutcheon et al., 1996), and trigeminal root ganglion neurons (Puil et al., 1986), among others. Although the mechanisms may vary, in all cases the resonance results from the complex interaction in the subthreshold region of the passive membrane properties with time- and voltage-dependent ionic currents.
To study the subthreshold properties and development of oscillations in Mes V neurons, we used a combination of time and frequency domain analyses in combination with pharmacological manipulations. We show that subthreshold oscillations and bursting behavior are developmentally regulated and emerge from the resonant properties of Mes V neurons, which are governed predominately by the interaction a 4-aminopyridine (AP)-sensitive noninactivating outward current and a persistent Na+ current.
MATERIALS AND METHODS
Coronal slices from neonatal Sprague Dawley rats (P2–12) were used in the present study. Animals were anesthetized by halothane inhalation, decapitated, and dissected in oxygenated (95%O2–5%CO2) ice-cold cutting solution (see below for composition). The brainstem was glued by its rostral end to the platform of a chamber and covered with ice-cold cutting solution. Six slices (300 μm) were cut on a vibrating slicer (DSK microslicer, Ted Pella, Redding, CA), placed into room temperature oxygenated incubation solution (see below for composition), and incubated at 37°C for 40–50 min, then maintained at room temperature (22–24°C).
Solutions. Cutting solution was composed of (in mm): 126 NaCl, 3 KCl, 1.25 NaH2PO4, 26 NaHCO3, 10 glucose, 1 CaCl2, 5 MgCl2, and 4 lactic acid (Schurr et al., 1988). Artificial CSF (ACSF) contained (in mm): 124 NaCl, 3 KCl, 1.25 NaH2PO4, 26 NaHCO3, 10 glucose, 2 CaCl2, and 2 MgCl2. Incubation solution was identical to ACSF but had additional 4 mm lactic acid (Schurr et al., 1988). In some experiments, Na+ concentration was lowered to 117 or 53 mm and substituted with choline. The composition of the solution used for isolating persistent sodium current contained (in mm): 131 NaCl, 10 HEPES, 3 KCl, 10 glucose, 1 CaCl2, 2 MgCl2, 10 tetraethylammonium (TEA)-Cl, 10 CsCl, 1 4-AP, 0.1 CdCl2. Drugs were bath applied at the following concentrations:d-2-amino-5-phosphonovaleric acid (AP-5) 10 μm, 6-cyano-7-nitroquinoxaline-2,3-dione (CNQX) 10 μm, bicuculline 10 μm, tetrodotoxin (TTX) 0.2–1.0 μm, CdCl2 100 μm, TEA 10 mm, 4-AP 10–100 μm. All drugs were purchased from Sigma (St. Louis, MO). The intrapipette solution for general recording contained (in mm): 115 K-gluconate, 25 KCl, 9 NaCl, 10 HEPES, 0.2 EGTA, 1 MgCl2, 3 K2-ATP, and 1 Na-GTP pH 7.25, osmolarity adjusted to 280–290 mOsm. The intrapipette solution used for recording persistent sodium currents was composed of (in mm): 110 CsF, 10 NaCl, 10 HEPES, 11 EGTA, 2 MgCl2. Lucifer yellow (0.1%, Sigma) was added to small volumes of intrapipette solution and used to backfill electrode tips for fluorescence viewing in some experiments.
Electrophysiological technique. Whole-cell current and voltage recordings were performed with an Axopatch-1D patch-clamp amplifier (Axon Instruments, Foster City, CA) in concert with pCLAMP acquisition software (v8.0, Axon Instruments). Patch electrodes (resistance 2–4 MΩ) were fabricated from borosilicate glass capillary tubing (1.5 mm outer diameter, 0.86 mm inner diameter) using a model P−97 puller (Sutter Instruments, Navato, CA). Signals were grounded (Ag/AgCl wire) using a 3 m KCl agar bridge. Cells with seals <1 GΩ before breakthrough were discarded. Uncompensated series resistance was usually <15 MΩ, compensated 60–80%, and monitored periodically throughout the experiment. Data were low-pass-filtered at 2 kHz (V-clamp) or 5 kHz (I-clamp) (3 dB four-pole Bessel filter) and sampled at 1–10 kHz depending on the experiments. The liquid junction potential was measured directly by recording the voltage offset produced by sequentially immersing a patch electrode in the electrode solution followed by ACSF (Zhang and Krnjevic, 1993). A −5 mV potential was obtained and corrected off-line.
Slices were secured in a recording chamber and perfused with oxygenated ACSF (2 ml/min) at room temperature and visualized by infrared differential interference contrast microscopy (Stuart et al., 1993). The Mes V nucleus was identified bilaterally in the coronal slice under low magnification (5×) as an ellipsoid region, located dorsally in brainstem slices ∼500 μm lateral to the midline. Mes V neurons were easily distinguished on the basis of their location, pseudounipolar soma, and size (Henderson et al., 1982; Liem et al., 1991; Raappana and Arvidsson, 1993; Del Negro and Chandler, 1997). The effects of drugs applied to the bath solution were obtained after 3–5 min applications. Recording periods were usually between 30 and 90 min.
Analysis. The acceptance criteria for including Mes V neurons in the analysis were resting membrane potential (RMP) more negative than −55 mV and action potential amplitude >70 mV. Input resistance (Rinp) was measured in voltage clamp in the whole-cell configuration at −65 mV using pClamp software (Axon Instruments) on-line. Voltage-clamp data were analyzed only in the cells that had a Rinp at least 10× greater than series resistance (Rs). This value was used for off-line leak subtraction. Whole-cell capacitance (Cm) was determined off-line from the integral of capacity current in response to 15 msec hyperpolarizing step voltage commands. The peeling method (Rall, 1969) was applied to estimate the system time constant (tau) and the first equalizing time constant, tau 1, in some neurons both at resting potential and at membrane potentials before burst threshold. This was measured in current clamp by applying short hyperpolarizing current pulses (0.3 msec, −1.5 nA) and fitting the membrane potential trajectory from the termination of the pulse back to baseline with an exponential function. Because most Mes V neurons are devoid of dendrites, the first equalizing time constant was very small in relation to tau, a condition indicating reasonably good space clamp.
In neurons that showed burst discharge, the mean peak-to-peak amplitude of subthreshold oscillations occurring between bursts at different membrane potentials was determined by averaging the peak amplitude of oscillation within five equal intervals of time between subsequent burst discharges. At membrane potentials that did not show bursting discharge, we routinely obtained mean oscillation peak amplitude for three periods lasting 1–2 sec at each voltage level. The peak subthreshold oscillation frequency was determined from fast Fourier transform (FFT) analysis by measuring the voltage region between two subsequent burst discharges. In the absence of burst discharge, the FFT was constructed from epochs of 1–2 sec duration. We averaged the results from three different epochs, plotted the power–frequency relationship, and obtained peak frequencies.
Burst duration during rhythmical discharge was defined as the mean time from burst onset to burst termination in three or more consecutive bursts. Cycle duration for rhythmical bursting was defined as the mean time from burst onset to onset in three or more consecutive cycles. Intraburst spike frequency was obtained by averaging the mean frequency values of three or more consecutive bursts.
Frequency-domain analysis (Puil et al., 1986, 1988) was performed by injecting a computer-generated impedance amplitude profile (ZAP) input current of changing frequencies between 0 and 250 Hz into neurons and recording the resulting voltage responses. To carefully analyze the subthreshold membrane properties in the absence of spikes, the amplitude of the ZAP input function was adjusted to keep the peak-to-peak voltage responses <10 mV. The current and voltage records were digitized at frequencies of 10 kHz. Impedance (Z) was calculated from the ratio of the FFT of the voltage response and the input current using the formula:Z = FFT (V)/FFT (I).
The magnitude of the impedance was plotted against frequency to give a frequency–response curve (FRC). Once the FRC was obtained, the resonant behavior, if present, was quantified by measuring the resonant frequency (Fres) and the Q value. TheFres was defined as the frequency at the peak of the hump in the FRC. The Q value was calculated by measuring the impedance at Fres and dividing that by the magnitude of the impedance at the lowest frequency measured (Koch, 1984; Hutcheon et al., 1996). A Q value of 1 would indicate that there was no resonance present, whereas values >1 indicate some degree of resonant behavior and, therefore, a particular frequency preference for the neuron.
ZAP input current was generated with the formula:I(t) = asin(bt3), 0 ≤ t ≤T. Here, a and b are adjustable parameters controlling the amplitude and bandwidth of the input current, respectively. T was a finite duration. In our case,a = 5, b = 10−7,t = 8 sec, T = 10 sec. The frequency applied was between 0 and 250 Hz. We used a low-pass filter of 0.5 kHz to reduce the noise of the input current. The results with and without the low-pass filter were identical.
Data were collected and analyzed with a combination of software [Clampfit v8.0 (Axon Instruments), Datapac III (v1.61, Run Technologies, Irvine, CA), StatView (SAS Institute, Cary, NC), and Microsoft Excel]. Results were reported as mean ± SD, unless indicated otherwise. Unless specified, group comparison of mean values was performed with Student's t test set at a level of significance of p < 0.05.
RESULTS
Electrophysiological recordings were performed on >200 mesencephalic trigeminal neurons from P2–12 rats using whole-cell patch-clamp recording methods. Neurons were recorded throughout the rostral-caudal extent of the nucleus to avoid sampling bias. A subset of Mes V neurons were stained intracellularly with Lucifer yellow (data not shown, n = 28) and were pseudounipolar with a large, round to ovoid-shaped cell body typical of Mes V neurons. A few neurons were multipolar, with one or two dendritic processes, and were similar to those reported previously in some immature Mes V neurons (Dessem et al., 1997).
Within a few minutes of membrane rupture, all Mes V neurons obtained a stable RMP. The mean RMP for all neurons examined (n = 168) was −62.9 ± 3.3 mV. There were no significant differences in RMP between the different age groups, although there was a slight tendency for RMP to decline with age. On visual inspection of neurons within the slice, Mes V neuron size markedly increased as a function of age, and this was reflected in the increase in whole-cell capacitance (p < 0.001, ANOVA) and reduction in input resistance (p < 0.01, ANOVA). Table 1 shows the values of some basic membrane properties as a function of age of the animal. In a subset of two extreme age groups of neurons (P2–3 and P10–12), the membrane time constant (tau) at resting potential was calculated (see Materials and Methods) and was similar for both groups (P2–3 = 9.7 msec, n = 57 vs P10–12 = 10.8 msec,n = 98; p = 0.12). In a subset of P3 neurons (n = 8) measured at membrane potentials artificially depolarized from resting potential to a level subthreshold to spike generation, tau decreased significantly from 8.5 to 4.3 msec (p < 0.002).
Table 1.
Membrane properties and prevalence of burst discharge in Mes V neurons at different ages
| Age (day) | Resting membrane potential (mV) | Input resistance (MΩ) | Cm (pF) | Cells with burst discharge when depolarized (%) |
|---|---|---|---|---|
| 2 | −63.2 ± 4.7 | 225.8 ± 166.8 | 35.7 ± 8.8 | 0 /25 (0) |
| 3 | −64.8 ± 3.6 | 187.8 ± 145.6 | 37.0 ± 7.9 | 0 /31 (0) |
| 6 | −63.5 ± 3.1 | 159.2 ± 180.2 | 35.6 ± 8.4 | 0 /15 (0) |
| 7 | −62.0 ± 1.4 | 120.7 ± 88.6 | 46.4 ± 6.7 | 6 /12 (50.0%) |
| 8 | −63.3 ± 3.2 | 110.9 ± 50.2 | 48.0 ± 9.9 | 24 /54 (44.4%) |
| 9 | −62.2 ± 3.5 | 108.9 ± 62.7 | 49.1 ± 9.8 | 16 /28 (57.1%) |
| 10 | −63.5 ± 2.8 | 129.3 ± 134.1 | 54.1 ± 11.1 | 46 /89 (51.7%) |
| 11 | −62.7 ± 3.1 | 117.1 ± 65.2 | 58.3 ± 11.1 | 57 /87 (65.5%) |
| 12 | −59.7 ± 2.6 | 106.2 ± 64.4 | 62.8 ± 12.4 | 12 /14 (85.7%) |
High-frequency subthreshold membrane potential oscillations in Mes V neurons
In most neurons examined from animals older than P6, constant-current depolarization of the membrane from RMP produced a gradual increase in baseline noise and the emergence of spontaneous rhythmical burst discharges (Fig.1A). Close examination of the membrane voltage trajectory during the interburst periods showed that the membrane noise before burst onset was actually composed of periodically occurring envelopes of voltage-dependent subthreshold membrane potential oscillations of 1–6 mV in amplitude, as described previously in dorsal root ganglion neurons (Amir et al., 1999; Liu et al., 2000) and adult Mes V neurons (Pedroarena et al., 1999). Figure1B shows sample traces taken at different membrane potentials and higher gain (A, a–d) before the onset of burst discharge. The emergence of these potentials with membrane depolarization, and within a given envelope, their waxing and waning nature over time, are evident. In this example, at −58 mV (Fig. 1B,a), no oscillations are evident. However, a 7 mV depolarization to −51 mV produced distinct oscillations. It was also apparent that burst discharge emerged once these oscillations reached a critical threshold. Figure1C,c shows an example of the oscillations recorded just before burst onset (A,c). The mean peak-to-peak amplitude of the subthreshold oscillations within the envelope just before burst threshold was 4.3 ± 1.1 mV (1.8–6.3 mV) (n = 52). Figure 1C,d also shows the common observation that burst discharge terminated with an aborted oscillation (arrow) and a 1–3 mV membrane hyperpolarization relative to the mean membrane potential just before burst onset (mean peak hyperpolarization 3.2 ± 0.8 mV, 1.5–4.6 mV,n = 23). Interestingly, during the period of hyperpolarization after burst, oscillations were suppressed immediately after a burst for a variable amount of time.
Fig. 1.

Subthreshold oscillations and spontaneous burst discharges are evoked by membrane depolarization. A, Membrane potential response to different levels of maintained current injection. When depolarized by adding constant current stimuli, subthreshold oscillations emerged and developed into spontaneous burst discharges after further depolarization. Bottom trace is current stimuli. B, C, High gain records of segments of membrane potential taken from A and indicated by lowercase letters. Ba, At resting membrane potential of −58 mV, prominent oscillations were not evident. Bb, Membrane depolarization produced subthreshold oscillations with a dominant frequency of ∼90 Hz and a peak-to-peak amplitude of 4.3 mV. Cc, Initiation of spikes from the peak of subthreshold membrane oscillations. Spikes are truncated. Inset taken from region of boxat a faster time base. Asterisks indicate spikes.Cd, Termination of burst discharge. Note the aborted oscillations and suppression of oscillations during the early part of the hyperpolarization after burst. The data were recorded from a P12 animal. Calibration in C applies toB.
It is unlikely that these oscillations and burst discharges resulted from complex interactions between excitatory and inhibitory synaptic inputs, because the oscillations were observed in the presence of antagonists of GABAergic transmission (bicuculline) and the NMDA and non-NMDA antagonists, AP-5 and CNQX, respectively (data not shown).
Voltage dependence of amplitude and frequency of subthreshold oscillations
In initial experiments the emergence of the oscillatory behavior appeared to be voltage dependent within a narrow voltage window. In 24 neurons this phenomena was examined more carefully. Figure2A shows an example of the onset and voltage dependence of the subthreshold oscillations at different membrane potentials evoked by maintained depolarizing current injection. Figure 2B shows the typical observation that the peak-to-peak amplitude of the oscillations increased to a plateau level that was usually around burst threshold (arrow).
Fig. 2.
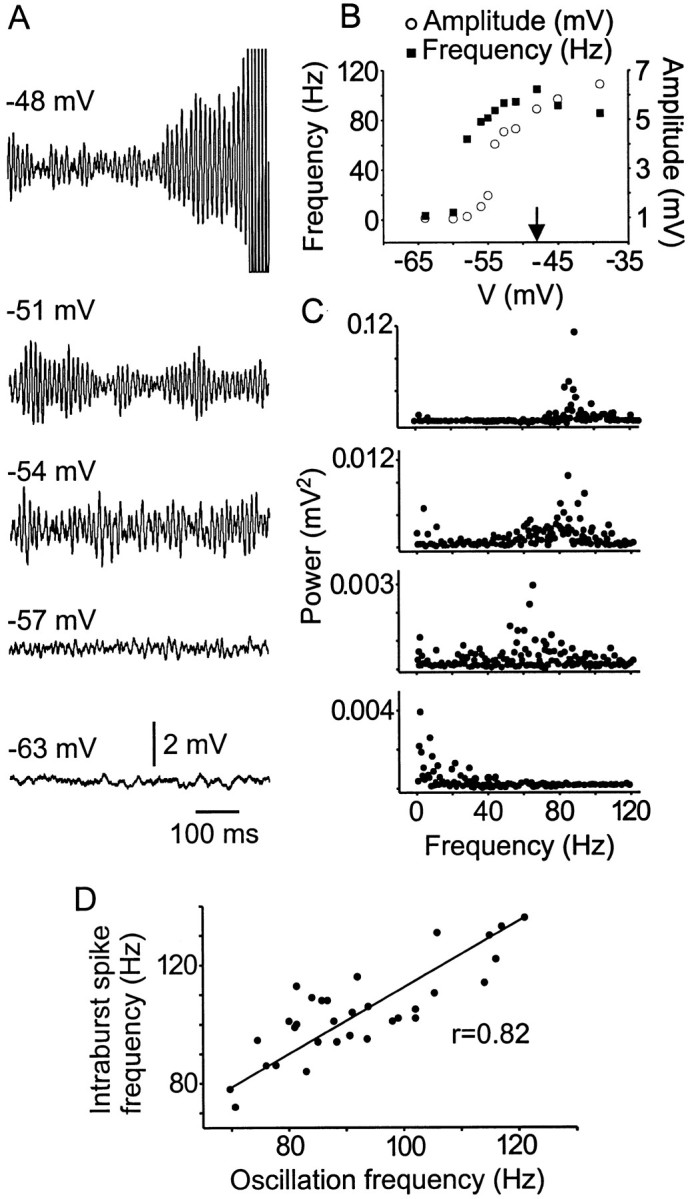
The amplitude and frequency of subthreshold oscillations are voltage dependent. A, Subthreshold oscillations were elicited by maintained membrane depolarization. Spikes are truncated. B, Plot of subthreshold oscillation frequency and amplitude versus membrane holding potential.Arrow indicates the membrane potential level where bursts were initiated and maintained. C, FFT analysis was performed at the same voltage levels indicated in A. Note the shift in frequency and power with increases in membrane potential. All data came from the same cell. D, Correlation between intraburst spike frequency and subthreshold oscillation frequency. Data are from 32 neurons.
The peak frequency of oscillations at different membrane potentials was determined by FFT analysis of voltage regions in the absence of spike discharge (see Materials and Methods).The power-frequency relationship for the FFT was plotted (Fig. 2C), and the peak frequency was then obtained. In all bursting neurons that were examined, the mean peak frequency of subthreshold oscillations at burst threshold potential was 91 ± 16 Hz (range 74–121 Hz; n = 52), similar to that shown previously in Mes V neurons and in dorsal root ganglia neurons (Amir et al., 1999; Pedroarena et al., 1999; Liu et al., 2000). As membrane potential was depolarized further, the peak frequency shifted to higher values (Fig. 2B) until a maximum peak was reached, at which further depolarization produced a decline.
Development of subthreshold oscillations
As shown in Figure 3, Aand B, before P7, membrane depolarization increased baseline noise but did not produce distinct, large amplitude, subthreshold oscillations. During this developmental period, oscillations were present, but of very small amplitude, which precluded accurate measurement of their amplitudes. FFT analysis indicated that subthreshold oscillations were present early on but were of lower peak frequency and power (data not shown) compared with older ages (Table2). However, starting around P7, large amplitude, distinct subthreshold oscillations were observed with membrane depolarization (Fig. 3C). These oscillations exhibited a clear peak in the FFT, with a power ∼10 times larger and amplitudes easy to measure compared with younger animals. Table 2 shows changes in various parameters for these oscillations for bursting and nonbursting neurons during development. The mean peak frequency and amplitude of oscillations did not change significantly with age between P7 and P12 in the present study. Amplitudes could not be accurately measured for nonbursting neurons because of their very small amplitude in relation to baseline noise.
Fig. 3.

Subthreshold membrane oscillations are developmentally regulated. A, B, In P3 and P6 animals, membrane depolarization did not evoke distinct, maintained subthreshold oscillations or rhythmical burst discharge.C, Subthreshold oscillations were evoked in approximately half of the P8 animals by membrane depolarization. Bursting was always accompanied by subthreshold oscillations.D, Membrane potential traces taken from P11 bursting and nonbursting neurons recorded in the same slice. Note the lack of prominent subthreshold oscillations in the nonbursting neuron.
Table 2.
Properties of subthreshold oscillations
| Age (day) | Frequency of subthreshold oscillations (Hz) | Amplitude of subthreshold oscillations (mV) | |
|---|---|---|---|
| Nonburst | Burst | ||
| 2 | 46 ± 17 (22) | ||
| 3 | 60 ± 27 (32) | ||
| 6 | 81 ± 19 (15) | ||
| 7 | 93 ± 30 (8) | 49 ± 8 (3) | 4.9 ± 0.9 |
| 8 | 85 ± 13 (12) | 84 ± 21 (10) | 4.6 ± 0.9 |
| 9 | 90 ± 30 (6) | 94 ± 16 (9) | 4.4 ± 0.8 |
| 10 | 102 ± 21 (18) | 90 ± 16 (24) | 4.2 ± 0.9 |
| 11 | 105 ± 27 (9) | 94 ± 20 (37) | 4.3 ± 1.3 |
| 12 | 95 ± 19 (9) | 90 ± 17 (12) | 4.0 ± 0.9 |
| Total | 77 ± 30 (131) | 90 ± 20 (95) | 4.3 ± 1.1 |
Neurons less than P7 age also never exhibited maintained rhythmical burst discharges as indicated in Table 1. In a subset of neurons older than P6 that did not exhibit maintained bursting, subthreshold oscillations were generally quite small in amplitude and did not exhibit a characteristic waxing and waning pattern, as shown in Figure3D. Furthermore, the power in the peak frequency in the FFT compared with bursting neurons was significantly smaller (nonburst 0.011 ± 0.016 mV2, n= 62 vs burst 0.103 ± 0.05 mV2,n = 92; p < 0.0001). This suggests that the presence of subthreshold oscillations of a sufficient amplitude and frequency is a necessary condition for initiation of burst discharge. This is further supported by the observation that spike initiation always occurred from the peak of an oscillation (Fig.1C, inset).
It is unlikely that the increase in amplitude and frequency of these oscillations with age was a result of selective damage to older neurons from tissue slicing or electrode impalement, because the RMPs for neurons from young and older groups were quite similar (Table 1).
Characteristics of burst discharge
In most neurons that exhibited prominent subthreshold oscillations after membrane depolarization, rhythmical burst discharges were evoked by further membrane depolarization (Fig. 1A). The mean threshold potential for evoking rhythmical burst discharge in all neurons examined was −51 ± 4 mV (−44 to −60 mV;n = 52). The range of mean cycle durations (0.4–19.0 sec) and burst durations (0.04–5.1 sec) was quite varied between neurons (n = 52). However, for a given neuron, once bursting was initiated the periodicity in burst discharge was quite regular as indicated by the low mean coefficient of variation for bursting for all neurons examined (0.23 ± 0.093;n = 52).
The frequency of spike discharge within a burst induced by maintained current injection for Mes V neurons was high compared with trigeminal motoneurons (Chandler et al., 1994). When measured at the threshold for rhythmical burst discharge, the mean intraburst spike frequency for all bursting neurons examined was 99 ± 19 Hz (69–156 Hz;n = 52) and did not vary with age (p = 0.4892, ANOVA).
The observation that spikes arise from individual membrane oscillations (Fig. 1) suggests that the subthreshold oscillation frequency determines the intraburst spike frequency. Figure 2Dshows a graph of mean intraburst frequency versus mean subthreshold oscillation frequency at burst threshold for 32 neurons. Linear regression analysis demonstrated a significant, strong linear correlation between subthreshold oscillation frequency and subsequent intraburst spike frequency (p < 0.0001;r = 0.82; n = 32). The slope of the relationship was 0.76, suggesting that, indeed, the high discharge rate observed in Mes V neurons resulted from the high underlying subthreshold oscillation frequency.
Frequency domain analysis: impedance measurements
Figure 4A shows a typical example of a ZAP current input and subsequent voltage output from a bursting neuron, whereas Figure 4B shows the FRC constructed from such data. In this example, the Freswas 42 Hz and the Q value was 1.5 when measured at resting potential (−64 mV), whereas at −57 mV, the Fres was 110 Hz and the Q value was 5.2. In all neurons examined, when the membrane potential was depolarized to within 7 mV of spike threshold, the Q value increased, the Fres shifted to higher values, and the width of the FRC narrowed, reflecting a voltage dependence for the impedance. As shown, membrane depolarization produced a more focused region of frequency preference for the neuron. When measured within 7 mV of burst threshold, all of the neurons showed a single resonant peak between 20 and 135 Hz (n = 126).
Fig. 4.

The response to ZAP input is voltage dependent.A, Subthreshold swept-sine wave (ZAP) input current (bottom) and corresponding voltage responses (top) recorded in a P11 neuron. Note that the amplitude of membrane potential response to ZAP input increased within a narrow frequency window (resonant frequency) and resulted in a spindle-shaped voltage response. B, Impedance–frequency plot in response to ZAP input at different membrane potentials. Resonance appeared as a hump in the FRC. The peak resonant frequencies andQ values were voltage dependent. The lines were obtained by five points moving average of the data. Note that two different resonant behaviors are observed in Mes V neurons: one is induced by depolarization (−57 mV) with high peak frequency (110 Hz in this neuron), and another is evoked by hyperpolarization from resting potential (−70 mV) with low peak frequency (<10 Hz).
Table 3 summarizes some of the characteristics of resonance for Mes V neurons measured at resting potential and a depolarized level for two age groups of animals (P2–3 and P10–12). The significant increase in both Fres andQ values at depolarized membrane potentials compared with resting potential relates, in part, to the activation of voltage-dependent currents that are described below. However, at resting potential, 39 of 126 neurons exhibited a low-frequency resonant peak (<10 Hz) that was not present when the neurons were depolarized. This low-frequency resonance is most likely attributable to the presence of an inward rectifying “h” current that activates at membrane potentials around rest and more negative to resting potential (Hutcheon et al., 1996). In Mes V neurons, this current is not active at membrane potentials depolarized from resting potential (our unpublished observation). Therefore, the low-frequency resonance will not be described further.
Table 3.
Resonant properties of Mes V neurons for different age groups
| Resting potential | Depolarization | |||
|---|---|---|---|---|
| P2–3 | P10–12 | P2–3 | P10–12 | |
| Voltage (mV) | −64.9 ± 5.8 (29) | −63.0 ± 3.8 (59) | −54.0 ± 2.9 (15) | −54.4 ± 2.6 (54) |
| Fres(Hz) | 20.5 ± 18.3 (29) | 24.4 ± 27.0 (60) | 52.7 ± 15.7 (19) | 89.9 ± 18.6 (62)3-160 |
| Q | 1.4 ± 0.22 (29) | 1.8 ± 0.98 (60) | 2.5 ± 0.95 (19) | 4.7 ± 1.9 (61)3-160 |
| ΔFresTTX(%) | 4.7 ± 20.6 (16) | −33.9 ± 77.9 (22) | −17.0 ± 18.8 (18) | −17.1 ± 30.6 (24) |
| ΔQTTX (%) | −10.2 ± 9.7 (16) | −24.6 ± 20.4 (22)3-150 | −25.6 ± 19.9 (18) | −51.5 ± 13.4 (24)3-160 |
P2–3 group versus P10–12 group; unpaired t test,
F3-150: p <0.05,
F3-160: p <0.01. ΔFresTTX and ΔQTTXare percentage change from control.
Fres and Q values increase during development
There was a significant trend for both Q values (p < 0.0002; n = 68) andFres to increase between ages P2 and P12 (p < 0.001; n = 68) when measured at a membrane potential depolarized from resting potential. Table 3 shows some characteristics of resonance for P2–3 compared with P10–12 age groups. At P2–3, a time when subthreshold oscillations are of low amplitude and bursting is not present, the mean Fresand Q values are significantly lower compared with P10–12 neurons, a period when most neurons show distinct subthreshold oscillations and bursting.
Ionic mechanisms underlying oscillations, bursting, and membrane resonance
Sodium dependence for oscillations
To determine the role of Na+ channels in the production of subthreshold membrane events, bath application of TTX and sodium substitution experiments were performed. Figure5 shows examples of such experiments. Compared with control (Fig. 5A), bath application of TTX (0.5 μm) completely abolished the subthreshold oscillations (Fig. 5B) and bursting. This was observed in all six neurons examined. Additionally, a 1–3 msec subthreshold current pulse evoked a transient subthreshold active membrane response (Fig. 5C, control) that was also blocked by TTX (Fig. 5C, TTX), demonstrating a role for TTX-sensitive Na+ currents in the initiation of this response.
Fig. 5.

Subthreshold oscillations and burst discharge depend on TTX-sensitive Na+ current.A, B, Subthreshold membrane potential oscillations and burst discharge (spikes truncated) recorded before (A) and after (B) TTX from a P9 neuron. Note the complete suppression of subthreshold oscillations. C, Subthreshold active membrane response evoked by a short-duration step pulse (0.2 nA, 3 msec) before and after TTX. D, Effects of reducing external sodium concentration on subthreshold membrane oscillations. E, Effects of low sodium concentrations on subthreshold active membrane potential responses. In low sodium conditions, subthreshold active membrane responses were not evoked, even with a larger current pulse (0.8 nA). Inset shows action potentials in low sodium conditions. A–C andD–E from two different neurons. Calibration in A applies to A,B, and D.
To further determine the importance of sodium for initiation and maintenance of subthreshold oscillations and maintained bursting, the sodium concentration was reduced, and the effects on spike generation and subthreshold oscillations were examined. Figure 5D shows that when the external sodium concentration was reduced from 151 to 117 mm, the peak amplitudes of the oscillations were reduced substantially. Under these conditions, initiation and maintenance of rhythmical burst activity was not possible. Further reduction of the external sodium concentration to 53 mm abolished all subthreshold oscillations. During these reduced sodium conditions, subthreshold active responses evoked by short current pulses were also abolished (Fig.5E). However, during altered sodium conditions, the action potential was still capable of initiation (Fig. 5E,inset), although the amplitude was reduced because of the smaller driving force (control 104.0 ± 9.4 mV; 117 mm Na+, 100.1 ± 9.0 mV; 53 mmNa+, 78.5 ± 5.6 mV;n = 5). This indicates that the absence of bursting was not caused by the inability to initiate spikes and therefore suggests that the mechanism of fast spike generation can be dissociated from the mechanism generating subthreshold oscillations.
Sodium currents enhance membrane resonance
The effects of 0.2 μm TTX on the FRC of a representative P11 neuron are shown at resting potential (Fig.6Aa) and at a value more depolarized to resting potential (Fig. 6Ab). For both levels of membrane potential, TTX reduced the magnitude of the impedance for frequencies less than ∼150 Hz. In all cases, this concentration of TTX was sufficient to completely abolish rapid Na+ spikes, but seldom completely eliminated the resonant hump in the FRC. In this example the curves approximate each other at ∼200 Hz, indicating that a TTX-sensitive current modulates the frequencies below this value but is not a necessary prerequisite for resonance. This general trend was also true for P2–3 neurons. However, when the Q values for P2–12 neurons were examined, there was a significant tendency for a greater reduction in Q value in older animals after TTX application compared with younger ones (p < 0.002, ANOVA). Table 3 shows the percentage change in Qvalue and Fres after TTX application for two age groups and for two different levels of membrane potential. Although P2–3 neurons showed a ∼10% change in Q value after TTX (ΔQTTX) (n = 16) compared with control, P10–12 animals showed a ∼25% change in ΔQTTX (n = 22) compared with control when measured at resting potential. These differences were significant (p < 0. 05). As shown in Table 3, significantly greater changes were found at depolarized membrane potentials where resonance was most prominent. These data are consistent with the hypothesis that a TTX-sensitive persistent sodium current (INaP) is active around resting potential and serves to amplify the impedance within a range of frequencies in the FRC as shown for other types of neurons (Gutfreund et al., 1995; Hutcheon et al., 1996). The data further suggest a greater dependence on TTX-sensitive Na+ currents for P10–12 compared with P2–3 animals. To test directly the hypothesis that a voltage-dependentINaP is present around resting potential and is greater in P10–12 compared with P2–3 age groups, voltage-clamp experiments were performed.
Fig. 6.

Resonance is dependent onI4-AP and amplified byINaP. A–C, Impedance–frequency relationships in response to different channel antagonists at two levels of membrane potential. Aa,Ab, Application of 0.2 μm TTX reduced the impedance magnitude of FRC substantially at both resting membrane potential and depolarized potentials but did not abolish it.Ba, Bb, Effects of 4-AP (10 μm) were recorded in the presence of 0.2 μmTTX to suppress spikes. 4-AP abolished resonant behavior at both voltage levels and decreased the Q values to 1, indicating that the membrane acted as a low-pass filter.Ca, Cb, Application of 100 μm Cd2+ produced modest effects on resonance.
Evidence for INaP
In current clamp, after TTX application, we observed in most neurons that the resting membrane potential hyperpolarized a few millivolts (data not shown). To directly determine whether such a current is present in Mes V neurons and, if so, whether it is developmentally regulated, we performed the following voltage-clamp experiment, which is illustrated in Figure7, A and B. The internal pipette solution and external bathing solution were adjusted to suppress outward K+ currents and inward Ca2+ currents (see Materials and Methods). Neurons were clamped at −70 mV and then rapidly stepped to +15 mV for ∼1 sec to inactivate residual transient Na+ and outward K+ currents. Subsequently, a ramp voltage command from +15 to −85 mV was applied over a 5–7 sec period as shown in Figure 7A, bottom. All currents were leak subtracted. Over this time period, the transient Na+ spike was inactivated, and a slow inwardly developing current emerged, as shown in the quasi-steady-stateI–V relationship. Application of TTX abolished this inward current, leaving an outwardly rectifying current (Fig.7A) that in other systems was characterized as a nonspecific cation current (Alzheimer, 1994). The I–Vrelationship for the TTX-sensitive component ofINaP was obtained by digital subtraction (control − TTX curves) of the traces in Figure7A and is shown in Figure 7B. For P3–4 and P10–11 groups, the thresholds for activation were similar (−69.0 ± 5 mV, n = 15 vs −72.0 ± 6 mV,n = 11, respectively). Similar to the 4-AP-sensitive K+ current present in these neurons (see below), INaP contributes to resting potential because its activation threshold is similar to or more negative than resting potential (see Table 1). Although there was no significant change in the threshold for activation of this current between these age groups, the normalized (for cell size) peak amplitude of this current was significantly greater in the P10–11 compared with P3–4 age group (−3.5 ± 0.94 pA/pF, n = 11 vs −2.6 ± 1.2 pA/pF, n = 15; p < 0.05). The peak amplitudes were most likely underestimated because there was some tendency for the peak amplitudes to get larger with faster ramps, indicating some degree of inactivation ofINaP during this time period (data not shown). These data support the hypothesis thatINaP is responsible for the enhancement of the resonant Q value and the increase in amplitude of the subthreshold oscillations in older age groups. However, we cannot rule out that changes in various transient Na+ channel properties over time (Cummins and Waxman, 1997) also contribute to our observations.
Fig. 7.

Isolation of INaP andI4-AP in Mes V neurons. A,I–V relationship in the absence and presence of TTX. Protocol is indicated. Application of 1 μm TTX blocked the persistent inward current, leaving an outward current. B, INaP was obtained by digital subtraction of the curves inA (control −TTX). In this neuron,INaP activated at −69 mV and reached its peak around −40 mV. C, MeanI–V relationship forI4-AP in P2–3 and P10–12 neurons. Protocol is indicated. The 4-AP-sensitive current was obtained by digital subtraction of 4-AP traces from control. In both P2–3 and P10–12 animals, 4-AP-sensitive currents activated around −60 mV, but the absolute magnitude of the current was larger in the older compared with the young group. D, MeanI–V relationship forI4-AP after the current was normalized for cell capacitance. Note the complete overlap of current except at the highest command potentials. Leak subtraction was performed off-line. Data are based on 23 P2–3 and 21 P10–12 neurons and were plotted at discrete voltages from ramp data. Error bars are omitted for clarity.
Subthreshold membrane oscillations and bursting: role of outward currents
Outward currents and subthreshold oscillations
We showed previously that a noninactivating low-threshold 4-AP-sensitive outward current (I4-AP) is present in Mes V neurons and participates in control of resting potential (Del Negro and Chandler, 1997). Therefore, the role ofI4-AP in subthreshold membrane oscillations was examined and is illustrated in Figure8A. In this example, compared with control (Fig. 8Aa), 10 μm 4-AP transformed high-frequency, large-amplitude subthreshold membrane oscillations of ∼90 Hz into low-frequency, smaller amplitude oscillations of ∼10 Hz (Table4, Fig.8Ab,Ac). In contrast, TEA did not reduce the amplitude of the oscillations significantly (Fig.8Ba,Bb) but did shift the dominant frequency from ∼120 Hz to 90 Hz in this example (Fig.8Bc). This pattern was characteristic of all neurons examined (Table 4). Cd2+ was without effect on both the amplitude and frequency of oscillations (Fig.8Ca–Cc). Table 4 summarizes the effects of the different antagonists on the characteristics of subthreshold oscillations.
Fig. 8.

I4-AP is critical for the production of high-frequency subthreshold membrane oscillations.Aa, Ab, 4-AP (10 μm) transformed the high-frequency subthreshold oscillations into low-frequency oscillations. Ac, FFT analysis showed the dominant frequency of subthreshold oscillation shifted from ∼90 to ∼10 Hz after 4-AP application. Ba, Bb, Effects of 10 mm TEA on subthreshold oscillations. Compared with 4-AP, TEA effects were modest. C, Cd2+ (100 μm) had minimal effects on both frequency and amplitude of subthreshold oscillations.
Table 4.
Effects of channel blockers on subthreshold oscillations and bursting
| n | Frequency of oscillation (%) | Amplitude of oscillation (%) | Intraburst spike frequency (%) | Burst duration (%) | Cycle duration (%) | |
|---|---|---|---|---|---|---|
| 10 μm4-AP | 5 | 69.1 ± 9.54-150 | 28.6 ± 7.44-150 | 74.1 ± 9.04-150 | ||
| 10 mm TEA | 4 | 25.6 ± 3.64-150 | 9.7 ± 10.6 | 48.4 ± 2.84-150 | 64.5 ± 10.6 | 66.2 ± 11.1 |
| 100 μm Cd2+ | 5 | 10.8 ± 4.2 | 2.3 ± 7.1 | 1.8 ± 5.3 | ↑ 331 ± 884-150 | ↑ 202 ± 344-150 |
Values indicate the percentage reduction from control; mean ± SEM. Paired t test,
F4-150: p <0.05. ↑ indicates the percentage increase from control.
I4-AP is necessary for high-frequency resonance
As shown in other systems, membrane resonance can be modeled by the interaction of a resonant current, which imparts high-pass filter characteristics to the membrane, with a passive leakage current and membrane capacitance of a neuron (Gutfreund et al., 1995). The interaction of these currents produces a neuron with bandpass filter characteristics that exhibits a resonant peak in the FRC (for review, see Hutcheon and Yarom, 2000). The importance ofI4-AP in the production of high-frequency resonance in Mes V neurons is demonstrated in Figure6B for a neuron at two different membrane potentials. At resting potential (Fig. 6Ba), in the presence of TTX to suppress action potentials, resonance is not prominent. However, depolarization of this neuron by 6 mV produced a very strong resonant peak in the FRC at ∼90 Hz, with a Q value of 1.8 (Fig.6Bb). After 4-AP, the resonant peak was abolished, the impedance below 90 Hz increased, and the two curves converged at frequencies above 90 Hz (Fig. 6Bb). This pattern was observed in seven of seven neurons in response to 50 μm 4-AP. These results demonstrate thatI4-AP influences the impedance of Mes V neurons, and its presence is a necessary condition for high-frequency subthreshold resonance. In the absence of this current, the membrane behaves as a low-pass filter, as evidenced by the shape of the FRC after 4-AP in Figure 6, Ba and Bb.
TEA at high concentrations (10 mm), which is generally considered nonspecific, did not eliminate resonance or change significantly the Q value in the FRC at depolarized potentials (data not shown). However, it did shift the Fresto lower values (104 ± 20 vs 56 ± 18 Hz; n= 5; p < 0.001).
As expected, Ca2+-mediated events do not influence, significantly, the subthreshold behavior of Mes V neurons. Figure 6, Ca and Cb, shows a representative example of the effects of Cd2+ on the FRC at two different membrane potentials. In both cases, Cd2+ produced minimal effects on the shape of the FRC.
Outward currents and maintained rhythmical bursting
As expected, suppression of subthreshold oscillations alters the ability of the neuron to produce high-frequency discharge and maintained rhythmical bursting. This is illustrated in Figure9. In this example, in contrast to the rhythmical bursting behavior and 100 Hz high-frequency intraburst spike discharge observed in this neuron (Fig. 9Aa,Ac), after 4-AP application (Fig. 9Ab), maintained membrane depolarization produced a nonterminating, continuous low-frequency spike train of ∼15 Hz as shown in the frequency–time plot (Fig.9Ac). Furthermore, note the absence of the large amplitude, rapid afterhyperpolarization (AHP) normally present within a spike train (Fig. 9Aa,Ab). Table 4 shows the effects of 4-AP on spike frequency and subthreshold oscillations.
Fig. 9.

Effects of antagonists on bursting and spike discharge characteristics. I4-AP is important for rhythmical burst discharge. Aa,Ab, 4-AP (50 μm) transformed the rhythmical burst discharge into low-frequency tonic spiking. Note the reduction in fast AHP after 4-AP. Ac, Instantaneous spike frequency–time relationship. Note the reduction in frequency and absence of adaptation after 4-AP. B, Effects of 10 mm TEA on burst characteristics. C, Cd2+ (100 μm) significantly prolonged the burst duration and cycle burst duration without affecting peak intraburst frequency and fast AHP.
In contrast to the effects of 4-AP on bursting, TEA and Cd2+ produced different effects, which are shown in Table 4. TEA (10 mm) reduced the intraburst spike frequency compared with control, an effect that derives from the reduction in subthreshold oscillation frequency after TEA (Fig.8B). In contrast, TEA did not block the ability to produce rhythmical bursting (Fig. 9Ba–Bc). Similarly, during Cd2+ conditions, bursting was still possible, but the burst durations were significantly increased (Fig. 9Cb,Cc). Interestingly, the peak frequency after Cd2+ remained constant, as predicted from its effects on the frequency and amplitude of the subthreshold oscillations and resonance. Taken together, these data further indicate that the intraburst spike frequency is strongly related to the frequency of subthreshold membrane oscillations (Fig.2D). Table 4 shows the effects of the various outward current antagonists on burst cycle characteristics and intraburst spike frequency.
I4-AP during development
To determine whether the presence of subthreshold oscillations and bursting in animals (>P6) resulted from changes in the magnitude of the I4-AP, voltage-clamp experiments were performed in modified ACSF (see Materials and Methods). A step command to 0 mV for 1 sec was followed by a slow ramp command (5–7 sec) back to −85 mV. This was repeated in the presence of 100 μm 4-AP. TheI4-AP was then obtained by digital subtraction. Figure 7C shows the compositeI–V relationship for the totalI4-AP taken from P10–12 and P2–3 age groups. The curves are leak subtracted and show that the totalI4-AP is significantly larger in P10–12 compared with P2–3 groups (repeated measures ANOVA,p < 0.001). When the current was normalized by cell capacitance for differences in cell size, the normalizedI–V curves overlapped and were not statistically different as shown in Figure 7D (p > 0.8). These data suggest that the increase in the resonant Qvalue and the emergence of subthreshold oscillations and bursting during early development are not a result of a selective change in the amplitude of the I4-AP density in older animals.
DISCUSSION
A significant observation in the present study and in one other (Pedroarena et al., 1999) was that after membrane depolarization, and in the absence of exogenous application of neuroactive substances, Mes V neurons are capable of spontaneous rhythmical burst generation and therefore can be classified as conditional burst neurons. Because Mes V neurons reside within the brainstem and potentially can function as interneurons (Kolta et al., 1995), this has significant implications for how these neurons function in oral-motor activities. The present findings indicate that these rhythmical bursts arise uniquely from the onset of subthreshold membrane oscillations between 70 and 120 Hz, both of which are voltage dependent and developmentally regulated. An argument will be presented that the subthreshold oscillations emerge in amplitude and frequency from the unique resonant properties of these neurons and depend, predominately, on the complex interaction between the passive membrane properties, a 4-AP-sensitive noninactivating K+ current, and a persistent Na+ current (INaP), which serves to amplify the resonance.
Mechanism of resonance
In the present work, using the ZAP method for frequency domain analysis (Puil et al., 1986, 1988), we found that almost all Mes V neurons (P2–12) exhibited resonance at resting membrane potential, although there were significant differences in the Fres andQ values of FRCs between young (<P4) and older (>P9) animals at depolarized membrane potentials (Table 3). Furthermore, bothFres and Q values were voltage dependent, indicating that some voltage-dependent currents were activated in the subthreshold region (Gutfreund et al., 1995; Hutcheon et al., 1996).
The ionic mechanisms responsible for resonance vary widely among neurons (Puil et al., 1989; Gutfreund et al., 1995; Hutcheon et al., 1996). Our data suggest that the resonant current for Mes V neurons is a previously characterized, low-threshold, steady-state outward current (I4-AP) that is blocked selectively by low doses of 4-AP (Del Negro and Chandler, 1997). In the present study, during TTX and 4-AP conditions, the resonant hump in the FRC was transformed into a curve resembling a low-pass filter (Fig.6B), thus demonstrating the importance ofI4-AP for the production of resonance. It is unlikely that the resonant current is caused by activation of a slow transient, 4-AP-sensitive current (I4AP-TOC), because that current is blocked by large doses of 4-AP (∼500 μm) and is mostly inactivated at voltages around −45 mV (Del Negro and Chandler, 1997), which in the present study actually produced the largest resonant peak in the FRC. A 4-AP-sensitive current underlying the membrane resonance in trigeminal ganglion neurons has been reported (Puil et al., 1989). However, in contrast to Mes V neurons, reduction in external Na+ concentrations and TTX application had no effects on resonant behavior.
Persistent sodium current amplifies resonance
Although resonance exhibited in the FRC of Mes V neurons can be explained by the interaction of I4-APwith the passive membrane properties, we propose that a TTX-sensitive noninactivating Na+ current strongly contributes to the magnitude of the Q value and thus to the sensitivity of Mes V neurons to synaptic inputs occurring around the resonant frequency. The presence ofINaP was demonstrated by our voltage-clamp studies in which a noninactivating or slowly inactivating inward current, blocked by TTX, was isolated. The strong sensitivity of the FRC to TTX (Fig. 6A) was demonstrated clearly at depolarized membrane potentials where the percentage reduction inQ value after TTX (%ΔQTTX) increased dramatically compared with resting potential in both P2–3 and P10–12 animals (Table 3). This dependence on a persistent Na+ current most likely accounts for the strong voltage dependence of the resonance at subthreshold membrane potentials, thus classifying this current as an amplifying current (Hutcheon and Yarom, 2000). Amplified resonance was demonstrated in cortical neurons, where INaPfacilitates resonance either by interacting with an inward rectifying current at hyperpolarized potentials (Hutcheon et al., 1996) or by interacting with a slowly activating K+current at more depolarized potentials (Gutfreund et al., 1995).
Subthreshold oscillations emerge from amplified resonance
Subthreshold membrane oscillations share many properties in common with membrane resonance and most likely emerge from the interaction of the resonant current and INaP. Both resonance and subthreshold oscillations are highly voltage dependent and very sensitive to low doses of TTX. In fact, in the presence of TTX, subthreshold oscillations are not present, and the resonantQ values in the FRC are substantially reduced. After application of low doses of 4-AP (10–100 μm) sufficient to block I4-AP, subthreshold oscillations were reduced in amplitude, and their frequency was shifted to very low values, usually <20 Hz. During these conditions, the Fres was shifted to lower values until the resonance was abolished. Furthermore, block of voltage-gated calcium channels with cadmium produced minimal effects on the oscillations and membrane resonance. Finally, in oscillatory neurons, the frequency of subthreshold oscillations, intraburst spike frequency, and the resonant frequency were all within the same range (Tables 2, 3). Taken together, these data suggest a common ionic mechanism for membrane resonance at depolarized potentials and subthreshold high-frequency oscillations in Mes V neurons, and further suggest that the oscillations emerge from the membrane resonance (Gutfreund et al., 1995; Lampl and Yarom, 1997;Hutcheon and Yarom, 2000).
Resonance and oscillation amplitude showed a parallel increase during development such that by P7 oscillations were prominent. We propose that this results from a developmental increase inINaP, thereby increasing the resonantQ value. This would tend to destabilize the neuron at depolarized membrane potentials, thus allowing for the emergence of subthreshold oscillations. Consistent with this,INaP current density was largest in the P10–12 group. Furthermore, we found that the sensitivity of theQ value to TTX (ΔQttx) was approximately twofold greater for P10–12 compared with P2–3 animals at depolarized membrane potentials (Table 3). It is unlikely that the emergence of the oscillations resulted strictly from changes in the amplitude of I4-AP, because we found no significant differences in peak current density forI4-AP between P2–3 and P10–12 animals (Fig. 7D). However, changes in the kinetics ofI4-AP cannot be discounted.
Relationship between subthreshold oscillations and burst discharge
In the majority of neurons that exhibited subthreshold oscillations, rhythmical bursting was observed when the membrane potential was maintained at a depolarized level by extrinsic current application. This type of burst discharge was reported previously in Mes V neurons (Pedroarena et al., 1999), in trigeminal sensory ganglia (Puil et al., 1989), and in DRG neurons (Amir et al., 1999). The mechanism of burst initiation and maintenance in Mes V neurons differs fundamentally from that observed during 5-HT- or NMDA-induced bursting in trigeminal motoneurons. In trigeminal motoneurons, a bi-stable state, characterized by the onset of a rapidly occurring depolarizing plateau potentials on which spikes occur in the absence of subthreshold oscillations, is the basis for maintained burst discharge. This results from the presence of a large net inward current and negative slope conductance in the steady-state I–V relationship (Kim and Chandler, 1995; Hsiao et al., 1998), characteristics never observed in Mes V bursting neurons.
In Mes V burst neurons, subthreshold oscillations are critical for both burst initiation and control of intraburst spike frequency. First, in neurons in which subthreshold oscillations were not prominent, maintained spike discharge was not possible. Second, the frequency of subthreshold oscillations determined the intraburst spike frequency because both frequencies were quite similar for a given neuron (Fig.2D), and single spikes were most often observed emanating from the peak of a resonant oscillation. When drugs such as 4-AP or TEA were applied, the frequency of oscillations and the intraburst spike frequency were similarly reduced (Figs. 8, 9). Moreover, in reduced Na+ conditions, prominent subthreshold oscillations could not be sustained, and rhythmical bursting was abolished.
Functional implications for resonance and subthreshold oscillations
Mes V neurons are unique among sensory neurons because they are located within the CNS. Therefore, they have the potential to function as interneurons involved in oral-motor pattern generation as well as in their more traditional role in proprioception and reflex activity. Although subthreshold oscillations are small events, their presence may be critical for controlling the input–output relationship for Mes V neurons and their excitability during different oral-motor acts. Although it is unlikely that bursting in Mes V neurons during rhythmical oral-motor activity is caused by membrane resonance, this property could be useful as an additional mechanism to reinforce the output of the oral-motor central pattern generator(s). It is more likely that the presence of resonance and high-frequency subthreshold oscillations is the basis for the observed high rates of discharge of Mes V neurons during reflex and central pattern-generated movements and thus facilitates temporal summation of synaptic events at Mes V targets.
There is some evidence that Mes V neurons form coupled networks among themselves via electrical and excitatory recurrent connections (Baker and Llinas, 1971; Liem et al., 1991; Luo and Dessem, 1996). The presence of resonance and subthreshold oscillations would be useful in rapidly synchronizing and stabilizing coordinated activity within the network (Llinas and Pare, 1991; Silva et al., 1991; Lampl and Yarom, 1997). During increased states of vigilance, such as during mastication or periods of increased postural tonus, Mes V neurons may be at a more depolarized resting potential, thus engendered with amplified resonance. Under these conditions, a localized peripheral or central excitatory stimulus to a single Mes V neuron could result in rapid synchronous high-frequency spike activity within the entire network.
Amplified resonance giving rise to subthreshold oscillations is an intriguing mechanism for control of excitability in normal and potentially pathological states such as occurs during oral-motor dysfunction (De Laat, 1998). Future work examining the modulation of the underlying currents responsible for resonance by various neuromessengers will be useful in elucidating the mechanisms controlling Mes V neuronal discharge.
Footnotes
This work was supported by National Institute of Dental and Craniofacial Research Grant DE 06193. We thank Marvin Castillo for technical assistance.
Correspondence should be addressed to Dr. Scott H. Chandler, Department of Physiological Science, University of California, Los Angeles, 2851 Slichter Hall, Los Angeles, CA 90095. E-mail:schandler@physci.ucla.edu.
REFERENCES
- 1.Alley KE. Quantitative analysis of the synaptogenic period in the trigeminal mesencephalic nucleus. Anat Rec. 1973;177:49–59. doi: 10.1002/ar.1091770106. [DOI] [PubMed] [Google Scholar]
- 2.Alzheimer C. A novel voltage-dependent cation current in rat neocortical neurones. J Physiol (Lond) 1994;479:199–205. doi: 10.1113/jphysiol.1994.sp020288. [DOI] [PMC free article] [PubMed] [Google Scholar]
- 3.Amir R, Michaelis M, Devor M. Membrane potential oscillations in dorsal root ganglion neurons: role in normal electrogenesis and neuropathic pain. J Neurosci. 1999;19:8589–8596. doi: 10.1523/JNEUROSCI.19-19-08589.1999. [DOI] [PMC free article] [PubMed] [Google Scholar]
- 4.Baker R, Llinas R. Electrotonic coupling between neurones in the rat mesencephalic nucleus. J Physiol (Lond) 1971;212:45–63. doi: 10.1113/jphysiol.1971.sp009309. [DOI] [PMC free article] [PubMed] [Google Scholar]
- 5.Buisseret-Delmas C, Pinganaud G, Compoint C, Buisseret P. Projection from trigeminal nuclei to neurons of the mesencephalic trigeminal nucleus in rat. Neurosci Lett. 1997;229:189–192. doi: 10.1016/s0304-3940(97)00452-7. [DOI] [PubMed] [Google Scholar]
- 6.Chandler SH, Hsaio CF, Inoue T, Goldberg LJ. Electrophysiological properties of guinea pig trigeminal motoneurons recorded in vitro. J Neurophysiol. 1994;71:129–145. doi: 10.1152/jn.1994.71.1.129. [DOI] [PubMed] [Google Scholar]
- 7.Copray JC, Ter Horst GJ, Liem RS, van Willigen JD. Neurotransmitters and neuropeptides within the mesencephalic trigeminal nucleus of the rat: an immunohistochemical analysis. Neuroscience. 1990;37:399–411. doi: 10.1016/0306-4522(90)90410-6. [DOI] [PubMed] [Google Scholar]
- 8.Corbin KB, Harrison F. Function of mesencephalic root of fifth cranial nerve. J Neurophysiol. 1940;3:424–435. [Google Scholar]
- 9.Cummins TR, Waxman SG. Downregulation of tetrodotoxin-resistant sodium currents and upregulation of a rapidly repriming tetrodotoxin-sensitive sodium current in small spinal sensory neurons after nerve injury. J Neurosci. 1997;17:3503–3514. doi: 10.1523/JNEUROSCI.17-10-03503.1997. [DOI] [PMC free article] [PubMed] [Google Scholar]
- 10.De Laat A. Scientific basis of masticatory disorders. In: Linden RWA, editor. The scientific basis of eating, Vol 9. Karger; Basel: 1998. pp. 122–134. [Google Scholar]
- 11.Del Negro CA, Chandler SH. Physiological and theoretical analysis of K+ currents controlling discharge in neonatal rat mesencephalic trigeminal neurons. J Neurophysiol. 1997;77:537–553. doi: 10.1152/jn.1997.77.2.537. [DOI] [PubMed] [Google Scholar]
- 12.Dessem D, Taylor A. Morphology of jaw-muscle spindle afferents in the rat. J Comp Neurol. 1989;282:389–403. doi: 10.1002/cne.902820306. [DOI] [PubMed] [Google Scholar]
- 13.Dessem D, Donga R, Luo P. Primary- and secondary-like jaw-muscle spindle afferents have characteristic topographic distributions. J Neurophysiol. 1997;77:2925–2944. doi: 10.1152/jn.1997.77.6.2925. [DOI] [PubMed] [Google Scholar]
- 14.Gutfreund Y, Yarom Y, Segev I. Subthreshold oscillations and resonant frequency in guinea-pig cortical neurons: physiology and modelling. J Physiol (Lond) 1995;483:621–640. doi: 10.1113/jphysiol.1995.sp020611. [DOI] [PMC free article] [PubMed] [Google Scholar]
- 15.Hayar A, Poulter MO, Pelkey K, Feltz P, Marshall KC. Mesencephalic trigeminal neuron responses to gamma-aminobutyric acid. Brain Res. 1997;753:120–127. doi: 10.1016/s0006-8993(97)00002-4. [DOI] [PubMed] [Google Scholar]
- 16.Henderson G, Pepper CM, Shefner SA. Electrophysiological properties of neurons contained in the locus coeruleus and mesencephalic nucleus of the trigeminal nerve in vitro. Exp Brain Res. 1982;45:29–37. doi: 10.1007/BF00235760. [DOI] [PubMed] [Google Scholar]
- 17.Hidaka O, Morimoto T, Kato T, Masuda Y, Inoue T, Takada K. Behavior of jaw muscle spindle afferents during cortically induced rhythmic jaw movements in the anesthetized rabbit. J Neurophysiol. 1999;82:2633–2640. doi: 10.1152/jn.1999.82.5.2633. [DOI] [PubMed] [Google Scholar]
- 18.Hsiao CF, Del Negro CA, Trueblood PR, Chandler SH. Ionic basis for serotonin-induced bistable membrane properties in guinea pig trigeminal motoneurons. J Neurophysiol. 1998;79:2847–2856. doi: 10.1152/jn.1998.79.6.2847. [DOI] [PubMed] [Google Scholar]
- 19.Hutcheon B, Yarom Y. Resonance, oscillation and the intrinsic frequency preferences of neurons. Trends Neurosci. 2000;23:216–222. doi: 10.1016/s0166-2236(00)01547-2. [DOI] [PubMed] [Google Scholar]
- 20.Hutcheon B, Miura RM, Puil E. Subthreshold membrane resonance in neocortical neurons. J Neurophysiol. 1996;76:683–697. doi: 10.1152/jn.1996.76.2.683. [DOI] [PubMed] [Google Scholar]
- 21.Jerge CR. Organization and function of the trigeminal mesencephalic nucleus. J Neurophysiol. 1963;26:393–402. doi: 10.1152/jn.1963.26.3.379. [DOI] [PubMed] [Google Scholar]
- 22.Khakh BS, Humphrey PP, Henderson G. ATP-gated cation channels (P2X purinoceptors) in trigeminal mesencephalic nucleus neurons of the rat. J Physiol (Lond) 1997;498:709–715. doi: 10.1113/jphysiol.1997.sp021895. [DOI] [PMC free article] [PubMed] [Google Scholar]
- 23.Kim YI, Chandler SH. NMDA-induced burst discharge in guinea pig trigeminal motoneurons in vitro. J Neurophysiol. 1995;74:334–346. doi: 10.1152/jn.1995.74.1.334. [DOI] [PubMed] [Google Scholar]
- 24.Koch C. Cable theory in neurons with active, linearized membranes. Biol Cybern. 1984;50:15–33. doi: 10.1007/BF00317936. [DOI] [PubMed] [Google Scholar]
- 25.Kolta A, Lund JP, Rossignol S. Modulation of activity of spindle afferents recorded in trigeminal mesencephalic nucleus of rabbit during fictive mastication. J Neurophysiol. 1990;64:1067–1076. doi: 10.1152/jn.1990.64.4.1067. [DOI] [PubMed] [Google Scholar]
- 26.Kolta A, Lund JP, Westberg KG, Clavelou P. Do muscle-spindle afferents act as interneurons during mastication? Trends Neurosci. 1995;18:441. doi: 10.1016/0166-2236(95)94493-o. [DOI] [PubMed] [Google Scholar]
- 27.Lampl I, Yarom Y. Subthreshold oscillations and resonant behavior: two manifestations of the same mechanism. Neuroscience. 1997;78:325–341. doi: 10.1016/s0306-4522(96)00588-x. [DOI] [PubMed] [Google Scholar]
- 28.Liem RS, Copray JC, van Willigen JD. Ultrastructure of the rat mesencephalic trigeminal nucleus. Acta Anat (Basel) 1991;140:112–119. doi: 10.1159/000147045. [DOI] [PubMed] [Google Scholar]
- 29.Liem RS, Copray JC, van Willigen JD. Distribution of synaptic boutons in the mesencephalic trigeminal nucleus of the rat: a quantitative electron-microscopical study. Acta Anat (Basel) 1992;143:74–78. doi: 10.1159/000147231. [DOI] [PubMed] [Google Scholar]
- 30.Liu CN, Michaelis M, Amir R, Devor M. Spinal nerve injury enhances subthreshold membrane potential oscillations in DRG neurons: relation to neuropathic pain. J Neurophysiol. 2000;84:205–215. doi: 10.1152/jn.2000.84.1.205. [DOI] [PubMed] [Google Scholar]
- 31.Llinas RR, Pare D. Of dreaming and wakefulness. Neuroscience. 1991;44:521–535. doi: 10.1016/0306-4522(91)90075-y. [DOI] [PubMed] [Google Scholar]
- 32.Luo P, Dessem D. Inputs from identified jaw-muscle spindle afferents to trigeminothalamic neurons in the rat: a double-labeling study using retrograde HRP and intracellular biotinamide. J Comp Neurol. 1995;353:50–66. doi: 10.1002/cne.903530107. [DOI] [PubMed] [Google Scholar]
- 33.Luo P, Dessem D. Morphological evidence for recurrent jaw-muscle spindle afferent feedback within the mesencephalic trigeminal nucleus. Brain Res. 1996;710:260–264. doi: 10.1016/0006-8993(95)01439-x. [DOI] [PubMed] [Google Scholar]
- 34.Luo P, Wong R, Dessem D. Projection of jaw-muscle spindle afferents to the caudal brainstem in rats demonstrated using intracellular biotinamide. J Comp Neurol. 1995;358:63–78. doi: 10.1002/cne.903580104. [DOI] [PubMed] [Google Scholar]
- 35.Manni E, Lucchi ML, Filippi GM, Bortolami R. Area postrema and the mesencephalic trigeminal nucleus. Exp Neurol. 1982;77:39–55. doi: 10.1016/0014-4886(82)90141-8. [DOI] [PubMed] [Google Scholar]
- 36.Pedroarena CM, Pose IE, Yamuy J, Chase MH, Morales FR. Oscillatory membrane potential activity in the soma of a primary afferent neuron. J Neurophysiol. 1999;82:1465–1476. doi: 10.1152/jn.1999.82.3.1465. [DOI] [PubMed] [Google Scholar]
- 37.Pelkey KA, Marshall KC. Actions of excitatory amino acids on mesencephalic trigeminal neurons. Can J Physiol Pharmacol. 1998;76:900–908. doi: 10.1139/cjpp-76-9-900. [DOI] [PubMed] [Google Scholar]
- 38.Puil E, Gimbarzevsky B, Miura RM. Quantification of membrane properties of trigeminal root ganglion neurons in guinea pigs. J Neurophysiol. 1986;55:995–1016. doi: 10.1152/jn.1986.55.5.995. [DOI] [PubMed] [Google Scholar]
- 39.Puil E, Gimbarzevsky B, Spigelman I. Primary involvement of K+ conductance in membrane resonance of trigeminal root ganglion neurons. J Neurophysiol. 1988;59:77–89. doi: 10.1152/jn.1988.59.1.77. [DOI] [PubMed] [Google Scholar]
- 40.Puil E, Miura RM, Spigelman I. Consequences of 4-aminopyridine applications to trigeminal root ganglion neurons. J Neurophysiol. 1989;62:810–820. doi: 10.1152/jn.1989.62.3.810. [DOI] [PubMed] [Google Scholar]
- 41.Puil E, Meiri H, Yarom Y. Resonant behavior and frequency preferences of thalamic neurons. J Neurophysiol. 1994;71:575–582. doi: 10.1152/jn.1994.71.2.575. [DOI] [PubMed] [Google Scholar]
- 42.Raappana P, Arvidsson J. Location, morphology, and central projections of mesencephalic trigeminal neurons innervating rat masticatory muscles studied by axonal transport of choleragenoid-horseradish peroxidase. J Comp Neurol. 1993;328:103–114. doi: 10.1002/cne.903280108. [DOI] [PubMed] [Google Scholar]
- 43.Rall W. Time constants and electrotonic length of membrane cylinders and neurons. Biophys J. 1969;9:1483–1508. doi: 10.1016/S0006-3495(69)86467-2. [DOI] [PMC free article] [PubMed] [Google Scholar]
- 44.Schurr A, West CA, Rigor BM. Lactate-supported synaptic function in the rat hippocampal slice preparation. Science. 1988;240:1326–1328. doi: 10.1126/science.3375817. [DOI] [PubMed] [Google Scholar]
- 45.Silva LR, Amitai Y, Connors BW. Intrinsic oscillations of neocortex generated by layer 5 pyramidal neurons. Science. 1991;251:432–435. doi: 10.1126/science.1824881. [DOI] [PubMed] [Google Scholar]
- 46.Stuart GJ, Dodt HU, Sakmann B. Patch-clamp recordings from the soma and dendrites of neurons in brain slices using infrared video microscopy. Pflügers Arch. 1993;423:511–518. doi: 10.1007/BF00374949. [DOI] [PubMed] [Google Scholar]
- 47.Zhang L, Krnjevic K. Whole-cell recording of anoxic effects on hippocampal neurons in slices. J Neurophysiol. 1993;69:118–127. doi: 10.1152/jn.1993.69.1.118. [DOI] [PubMed] [Google Scholar]