

Abstract
Gamma frequency oscillations occur in hippocampus in vitro after brief tetani delivered to afferent pathways. Previous reports have characterized these oscillations as either (1) trains of GABAA inhibitory synaptic events mediated by depolarization of both pyramidal cells and interneurons at least in part mediated by metabotropic glutamate and acetylcholine receptors, or (2) field potential oscillations occurring in the near absence of an inhibitory synaptic oscillation when cells are driven by depolarizing GABA responses and local synchrony is produced by field effects. The aim of this study was to investigate factors involved in the differential expression of these synaptically and nonsynaptically gated oscillations. Field effects were undetectable in control recordings but manifested when slices were perfused with hypo-osmotic solutions or a reduced level of normal perfusate. These manipulations also reduced the amplitude of the train of inhibitory synaptic events associated with an oscillation and enhanced the depolarizing GABA component underlying the post-tetanic depolarization. The resulting field oscillation was still dependent, at least in part, on inhibitory synaptic transmission, but spatiotemporal aspects of the oscillation were severely disrupted. These changes were also accompanied by an increase in estimated [K+]o compared with control. We suggest that nonsynaptic oscillations occur under conditions also associated with epileptiform activity and constitute a phenomenon that is distinct from synaptically gated oscillations. The latter remain a viable model for in vivo oscillations of cognitive relevance.
Keywords: gamma oscillation, tetanic stimulation, synaptic potentials, ephaptic effects, osmotic changes, potassium ion concentrations
Stimulus-induced gamma oscillations (30–80 Hz) are a feature of the response to sensory input measured via cortical EEG (Tallon-Baudry et al., 1998). Similar hippocampal responses can be elicited in the hippocampal slice by brief tetanic stimuli to area CA1 (Whittington et al., 1997; Doheny et al., 2000). The field potential response during these oscillations takes the form of a train of population spikes in stratum pyramidale at γ and β frequencies (Faulkner et al., 1999). Intracellular recordings show a post-tetanic depolarization that drives interneuron network activity to produce a gamma oscillation consisting of trains of GABAA receptor-mediated inhibitory synaptic potentials (Traub et al., 1999a). This synaptic inhibition-based gamma entrains and synchronizes action potential generation in pyramidal cells, producing population spikes at gamma frequencies. This can be demonstrated by observing the effects of GABAergic modulators on IPSP trains or by the observation of population spike frequency in field recordings (Faulkner et al., 1998; 1999). The observed effects are predicted by the interneuron network model of synaptic gamma oscillations whereby the kinetics of mutual inhibitory synaptic connections between interneurons governs the frequency of network oscillation (Whittington et al., 1995).
A previous report (Bracci et al., 1999) demonstrated that post-tetanic oscillations can also be generated and locally synchronized by field effects accompanying large-scale involvement of pyramidal cells. These field effect-mediated oscillations occur over a wider range of frequencies than the gamma band and appear to have little, if any, accompanying synaptic inhibition-based oscillation. Post-tetanic responses of the above two types appear to be mediated by different mechanisms underlying the depolarizing drive to area CA1. In situations in which these field effect-mediated oscillations predominate, the underlying depolarization is mainly mediated by a depolarizing GABA potential. Such post-tetanic depolarizations have been characterized in detail by Taira et al. (1997). When trains of inhibitory postsynaptic potentials are seen to underlie the post-tetanic oscillation, the depolarizing drive is, in part, sensitive to blockers of metabotropic glutamate receptors, suggesting a synaptic metabotropic glutamate receptor-mediated excitatory drive, as previously described by a number of researchers in hippocampal areas CA1 and CA3 (Miles and Poncer, 1993; Congar et al., 1997; Partridge and Valenzuela, 1999).
As a synaptic phenomenon, post-tetanic oscillations in hippocampal slices constitute a useful model for studying mechanisms underlying stimulus-induced gamma oscillations in vivo. The introduction of field effects and large population spikes is relevant to conditions that support epileptiform activity. It is the aim of this study to analyze the conditions required to elicit synaptic and nonsynaptic post-tetanic oscillations to differentiate between mechanisms of possible physiological and pathological relevance. Here we demonstrate, in the first instance, that field potential oscillations are not causally related to post-tetanic gamma oscillations in hippocampal slices maintained in normal interface conditions. We then concentrate on membrane potential responses to tetanic stimuli in pyramidal cells to show that the synaptic properties of the gamma oscillation and the field effects and depolarizing GABA responses can be differentially expressed by changing the osmolarity and/or the level of the slice perfusion solution.
MATERIALS AND METHODS
Experimental methods. Transverse dorsal hippocampal slices (450 μm thick) were prepared from brains of male Sprague Dawley rats (220–290 gm) after cervical dislocation and decapitation. They were maintained at the interface of warm, wet 95% O2 and 5% CO2 and artificial CSF (aCSF) containing (in mm): 135 NaCl, 16 NaHCO3, 3 KCl, 2 CaCl2, 1.25 NaH2PO4, 1 MgCl2, and 10 d-Glucose, equilibrated with 95%O2 and 5%CO2, pH 7.2, at 33–35°C.
Brief tetanic stimuli (100 Hz, 80 msec; 4–80 V, 50 μsec duration) were delivered simultaneously to the proximal stratum radiatum at a single recording site midway along area CA1 or at two recording sites at either end of the CA1 region (separation, 1.5–2.5 mm) every 4 min throughout each experiment. In three experiments, the number of stimuli in a tetanus was altered from 8 to 20, and the position of the electrode was altered from stratum radiatum to stratum pyramidale or stratum oriens. Post-tetanic oscillations were studied using three distinct recording protocols. (1) Field potentials of band width 0.1 Hz to 2 kHz were recorded using glass micropipettes filled with 2m NaCl (resistance, 1–10 MΩ) at the level of stratum pyramidale (for population spikes) at the single site or at two sites simultaneously. (2) Intracellular potentials were recorded from pyramidal neurons and fast-spiking interneurons at the level of the cell soma using micropipettes filled with 2 m potassium acetate or methylsulfate (resistance, 30–90 MΩ). For interneuron recordings, the electrodes were also filled with an additional 50 mm QX314. (3) Extracellular potassium ion activity was recorded at the level of stratum pyramidale using electrodes tip-filled with potassium ionophore cocktail B (Sigma, Poole, UK) and back-filled with 10 mm potassium chloride. Electrode tips were advanced into the slice at different depths during the experiments (see Results). Potassium ion concentration was estimated by combining the voltage response of the ion-sensitive electrode with the voltage response of the local DC field potential low-pass filtered at 100 Hz (3.2 ± 0.4 mV in control conditions; 3.6 ± 0.3 mV with low perfusion level). In addition, we examined the effects of the slice environment on responses to single afferent stimuli delivered to the Schaffer collateral commissural pathway. Stimulating electrodes were placed in stratum radiatum at the CA1–CA2 border. Stimulus intensity was adjusted to give a maximal population spike amplitude in the control condition.
The slice environment was changed using a number of protocols. (1) The perfusion solution was modified by the addition of sucrose to provide a 40 mm sucrose solution (the hyperosmotic condition) or 10% by volume extra distilled water (the hypo-osmotic condition). (2) The level of the perfusion solution in the slice chamber was lowered by the addition of wicks made from lens tissue inserted between the slice chamber and the waste perfusate chamber (the “low-aCSF” condition). In normal conditions, the perfusate level was such that a meniscus of solution could be readily picked up by lowering a stimulating electrode toward the top surface of the slice before the slice and electrode made contact. In the low-aCSF condition, no meniscus was evident even when the stimulating electrode was touching the slice. (3) The following drugs were added to the perfusate to modify basic parameters associated with the expression of gamma oscillations: 1-[3-(3,4-methylenedioxyphenoxy)propyl]-4-phenylpiperazine (BP554), a 5-HT1A agonist, was added at 5–40 μm to reduce pyramidal neuronal action potential generation (Matsuda et al., 1989). Thiopental, 20 μm, was added to prolong the time course of GABAA-receptor-mediated synaptic inhibition. Bicuculline, 20 μm, was added to block GABAA-receptor-mediated synaptic events. (S)-α-methyl-4-carboxyphenylglycine [(S)-MCPG], 0.5 mm, was added to block metabotropic glutamate receptor activation.
The pattern of synchrony between two concurrently oscillating regions was analyzed as described in Faulkner et al. (1998). Lesions midway between the two recording sites were cut in situ with the tip of a scalpel blade. Two lesions were used: a cut through all laminae of CA1, except the alveus, and a complete bisection of area CA1.
For each experimental condition, recordings were taken from at least five slices with a minimum of three replicates per slice per drug concentration, except for interneuron recordings. Power (as peak power within the gamma band) and frequency measurements of oscillations were obtained from power spectra and autocorrelations of 500 msec epochs of data for each slice. Amplitude of EPSPs and IPSPs were obtained by measuring peak-to-peak amplitudes of at least 30 consecutive periods of oscillation in responses in each slice used. Data are expressed as mean ± SE. Data obtained were normally distributed, and statistical analysis was performed using two-way parametric ANOVA andt tests with the degree of freedom adjusted for multiple comparisons (Bonferroni).
Computer model methods. Network simulations of the synaptic nature of two-site synchrony were performed using the model described in Traub et al. (1999), with the minor modification that interneuron dendrites are electrically active (Martina et al., 2000), as in the original single-interneuron model study (Traub and Miles, 1995). Briefly, the model network is intended to simulate a 1.92 mm extent (along stratum pyramidale) of the in vitro rodent CA1 hippocampal region. It contains 3072 pyramidal neurons in a 96 × 32 array of cells and 384 interneurons in a superimposed 96 × 4 array. Each model neuron (pyramidal and interneuron) has multiple somatic–dendritic and five axonal compartments, and each neuron contains voltage- and Ca2+-dependent intrinsic currents that allow repetitive firing, adaptation, and (in the case of pyramidal cells and under certain conditions of membrane potential and absence of shunts) intrinsic bursting (Traub et al., 1994; Traub and Miles, 1995). Each interneuron can have any of four sorts of connectivity to pyramidal cells: “basket” (to soma and proximal dendrites), “axo-axonic” (to the most proximal axonal compartment), “bistratified” (to basilar dendrites and middle apical dendrites), and “o/lm” or “oriens/lacunosum-moleculare” (to distal apical dendrites). Pyramidal cells could contact postsynaptic neurons (other pyramidal cells or interneurons) that were located anywhere in the array with equal probability. Interneurons could only contact cells within 25 cell diameters along the long axis of the array. More details on connectivity and synaptic actions are given in Traub et al. (1999). Driving conductances to pyramidal cells were the same as in Traub et al. (1999); values of pyramidal–pyramidal EPSCs and of Ca2+-dependent gK(AHP) in pyramidal cells were the same as for the gamma portion of oscillations in the same publication. Signal averages were the average values of somatic potential of 224 nearby pyramidal cells in each of two groups, one at either end of the array. Cross-correlations of these signal averages were computed for 200 msec of data from the interval 600–800 msec after the start of the simulation.
In some simulations, certain axons (pyramidal, or interneuron, or both) were cut if the presynaptic cell and the postsynaptic cell lay in opposite halves of the array, that is, in different 48 × 32 (48 × 4 for interneurons, respectively) subarrays. This manipulation corresponds, at least approximately, to making a cut through the tissue. The control simulation in this study is the same as that illustrated by Kopell et al. (2000; their Fig. 4, left panel).
RESULTS
Effects of reducing pyramidal cell involvement
We reduced pyramidal cell action potential generation in the slice by including the 5-HT1A agonist BP554 into the bathing medium. BP554 significantly hyperpolarized the resting membrane potential in both pyramidal cells and fast-spiking stratum pyramidale interneurons (control, −68 ± 3 mV and −62 ± 5 mV; BP554, −77 ± 3 mV and −71 ± 3 mV; p < 0.05;n = 5 for pyramidal cells; n = 3 for interneurons). The drug caused less of an effect on the magnitude of the post-tetanic depolarization in pyramidal cells (control, absolute depolarization level −50 ± 2 mV; BP554, −52 ± 4 mV;p > 0.05). However, concurrently recorded field potentials were dramatically reduced in amplitude in the presence of the drug (control, 3.9 ± 0.7 mV; BP554, 0.8 ± 0.5 mV;p < 0.05) (Fig.1A). This decrease in maximal amplitude was caused mainly by a reduction in the size of population spikes reflecting locally synchronous pyramidal cell action potential generation. In contrast, the underlying intracellular post-tetanic gamma oscillation was little changed (Fig.1B). In control conditions, the predominantly subthreshold oscillation consisted mainly of trains of inhibitory synaptic potentials. Occasional sharp depolarizing events were apparent and appeared to be EPSPs curtailed by a following IPSP (Fig.1B, asterisks). In the presence of 20 μm BP554, these EPSPs were considerably less evident, leaving behind the train of IPSPs. The mean power of the subthreshold oscillation (500 msec epoch) was reduced from 0.037 ± 0.004 to 0.027 ± 0.005 mV2. This change did not reach significance (p > 0.05). The mean frequency of the subthreshold component was increased from 44 ± 8 to 58 ± 12 Hz, but again it was not a significant change (p > 0.05).
Fig. 1.
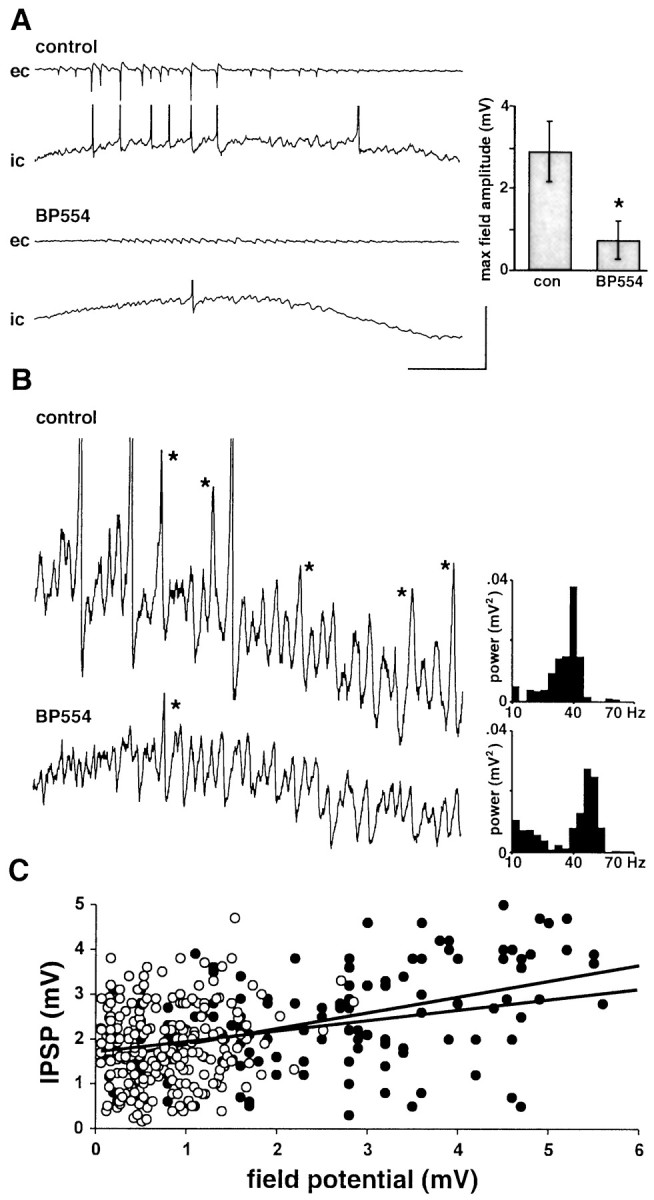
Effects of reduction in pyramidal cell involvement in the post-tetanic oscillation. A, Concurrent AC-coupled field (ec) and DC intracellular (ic) recordings in control conditions (normal perfusate level) and after bath application of BP554 (20 μm).Traces demonstrate the marked reduction in field potential amplitude in the presence of BP554 with almost no population spike generation. Traces begin immediately after the stimulus has ceased. Graph shows pooled data (n = 3 replicates each from five slices) of maximal field potential amplitude. BP554 significantly reduced this amplitude (p < 0.05). B, Effects of BP554 on the subthreshold gamma oscillation. Traces show the middle part of post-tetanic oscillations with expanded vertical scale. Prominent, sharp EPSPs are marked with asterisksin the control conditions. A considerable reduction in these EPSPs was seen in the presence of BP554. Traces were from the same cell for examples in A and a different cell for both examples in B. Graphs show frequency transforms for 500 msec epochs of gamma oscillation in control (top graph) and BP554-treated slices (bottom graph). Note that transforms are not from thetraces shown because action potential firing polluted the analysis. Calibration: A, 5 mV (ec)/10 mV (ic), 200 msec;B, 2 mV, 100 msec. C, Plot of pooled IPSP size in pyramidal cells during gamma and concurrently recorded field potential oscillation amplitude for four oscillations from four slices in control (●) and BP554 (○)-treated slices. Correlation coefficients for linear regression are shown.
These changes in extracellular and intracellular activity are explained most parsimoniously by a reduction in pyramidal cell involvement not affecting the underlying inhibition-based gamma rhythm. There was a poor correlation between field potential amplitude and IPSP amplitude in both the presence and absence of the drug (Fig. 1C) (r2 from linear regressions were control, 0.32, and BP554, 0.28). In neither case did the regression line pass through the origin, indicating that field potentials do not have to be present to observe an inhibition-based gamma oscillation. In addition, interneuron recordings in control conditions showed cells driven by both EPSPs and IPSPs (Fig.2). BP554 did not significantly alter the mean amplitude of IPSPs (evoked at −30 mV) constituting the gamma oscillation (control amplitude, 2.6 ± 0.8 mV; in the presence of BP554, 2.2 ± 0.9 mV; p > 0.05; minimum of 30 IPSPs from the post-tetanic response each from three interneurons from three slices). However, the phasic excitatory drive seen as EPSPs at −70 mV was reduced by BP554 (control values, 3.3 ± 0.8 mV; BP554 values, 1.6 ± 0.5 mV; p < 0.05). This latter result concurred with the reduction in observable EPSPs in pyramidal cells (Fig. 1B).
Fig. 2.

Pattern of synaptic potentials in stratum pyramidale fast-spiking interneurons during stimulus-induced gamma oscillations. A, Example traces from interneuron depolarized to −30 mV. Note that there is little change in the pattern of IPSPs underlying the gamma oscillation on application of BP554. B, Example traces from interneuron hyperpolarized to −70 mV. BP554 significantly reduced the amplitude of EPSPs evoked in interneurons during stimulus-induced gamma oscillation (p < 0.05). Calibration: 5 mV, 100 msec.
Effect of stimulus location on post-tetanic oscillations
We previously characterized oscillations generated by 20 pulse tetanic stimuli (Whittington et al., 1997). The change in post-tetanic response on switching from 20 to 8 pulses (with stimulus intensity fixed) was a reduction in the duration of the depolarizing envelope and the concurrent IPSP train underlying the gamma oscillation (Fig.3A). Changes in the position of the stimulating electrode, from stratum oriens to stratum pyramidale and stratum radiatum did not change the pattern of post-tetanic response seen (Fig. 3B). However, the response was spatially localized around the stimulating electrode (Fig. 3C). Moving the recording electrode to impale pyramidal cells at distances progressively farther from the stimulus site showed that the depolarization was almost absent with recordings >300 μm from stimulus. At distances closer than this, the depolarization increased in amplitude and duration, with a concurrent increase in IPSP train duration. No evidence for ephaptic artifacts (brief hyperpolarizing events corresponding to field population spikes) was seen in recordings from pyramidal cells even at the closest distance used in this study (50 μm), suggesting that the ephaptic components of a post-tetanic response seen by Bracci et al. (1999) cannot be explained by the relative position of stimulating and recording electrodes in our normal conditions.
Fig. 3.

Effects of spatial and temporal characteristics of the tetanic stimulus on evoked gamma oscillation. A, Effects of changing the number of stimuli in the tetanus from 8 to 20. Note that there is little change in depolarization amplitude but an increase in duration. The underlying train of IPSPs was also prolonged.B, Effects of position of stimulating electrode. Stimulus intensity was kept at 37 V, 8 pulses. Little change in depolarizing envelope or IPSP trains was seen. C, Effects of longitudinal distance (in micrometers) along stratum pyramidale from proximal stratum radiatum stimulus site. Note that both the depolarizing envelope and the IPSP train become shorter and of lower amplitude. Data shown in A–C were from different slices. Calibration: 10 mV, 200 msec.
Effects of osmotic changes in slice perfusate
Synchronous activity in pyramidal cells may influence neighboring neurons by nonsynaptic as well as synaptic effects. Changes in osmotic properties of the slice microenvironment have previously been shown to have effects on ephaptic interactions in area CA1 (see below). The magnitude of field nonsynaptic effects is strongly influenced by, among other factors, the ratio of interstitial to intracellular volume. This ratio can be experimentally manipulated by altering the osmolarity of the perfusing solution to cause neuronal swelling or shrinking. Addition of 40 mm sucrose to the perfusing solution changed osmolarity from 305 to 339 mOsm. However, this magnitude of increase in osmolarity had no significant effect on post-tetanic oscillations (Fig.4). Mean depolarization level was increased slightly but not significantly from −50 ± 2 to −48 ± 2 mV (p > 0.05), and mean amplitude of the subthreshold gamma oscillation and field potential oscillation remained unchanged (Fig.4B,D). However, a reduction in osmolarity from 305 to 273 mOsm caused a significant increase in maximal field potential amplitude during the oscillation (control, 3.7 ± 0.4 mV; hypo-osmotic, 5.8 ± 0.6 mV; p< 0.05) (Fig. 4D). This occurred despite the fact that stimulus intensity had to be reduced in hypo-osmotic conditions to produce a comparable post-tetanic depolarization. In contrast to the enhanced field potentials, the subthreshold intracellular gamma oscillation was markedly reduced from 2.4 ± 0.8 mV in control conditions to 0.6 ± 0.4 mV (p < 0.05). Power spectrum analysis of the peak at gamma frequencies showed a reduction in gamma power in intracellular traces from 0.031 ± 0.006 to 0.005 ± 0.002 mV2 (p < 0.05). This change was accompanied by the presence of prominent field effect artifacts in the intracellular traces, usually taking the form of a sharp hyperpolarizing potential that immediately preceded spikes when present (Fig. 4B).
Fig. 4.
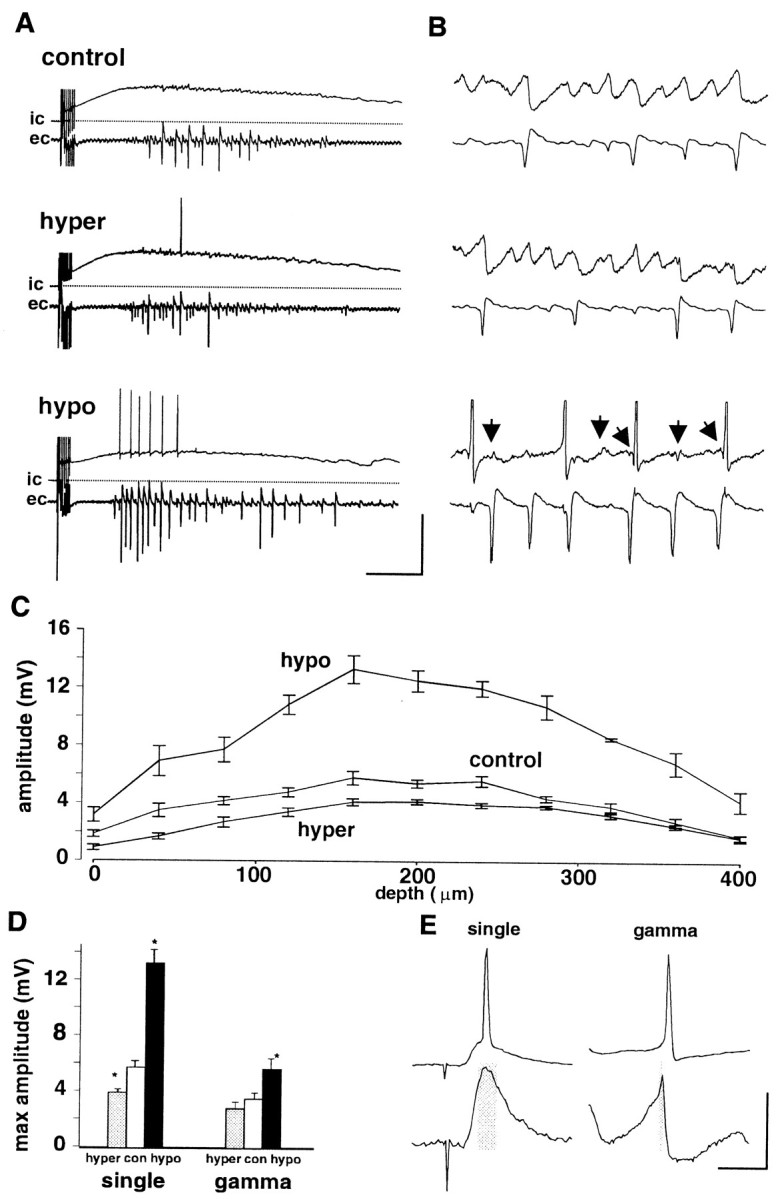
Effects of osmotic changes on oscillations induced at a single site with tetanic stimuli and responses to individual afferent stimuli. A, Concurrent field (ec) and intracellular (ic) recordings after single site stimulation in slices with normal perfusion level.Dotted lines indicate resting potential. Control data show a post-tetanic depolarization on which a gamma oscillation is superimposed. Extracellular recordings show the population response local to the recorded cell. Hyperosmotic solutions contained an additional 40 mm sucrose and produced no effect on field or intracellular recordings (both control and hypertonic situations had a stimulus intensity of 37 V). Switching to hypotonic perfusate increased pyramidal cell recruitment and increased the amplitude of the field response (increased population spike size). Stimulus intensity in hypotonic solution was lowered from that used in the above two conditions to produce a comparable depolarization amplitude (15 V in this example). B, Expanded 250 msec epochs of oscillation taken from the corresponding traces inA. No effect on subthreshold gamma oscillations was seen for hyperosmotic solutions, but hypo-osmotic solutions reduced the amplitude of this oscillation and introduced small predominantly hyperpolarizing prepotentials before most action potentials (arrows). Calibration: A, 25 mV (ic)/5 mV (ec), 500 msec;B, 5 mV (ic)/5 mV (ec), 50 msec. C, Depth profile for maximal population spike amplitude evoked by single afferent stimulation with normal perfusion level. In each condition, maximal amplitudes were seen at a depth of 150–250 μm below the surface of the slice (data shown as mean ± SEM; n = 5). D, Pooled data for the experiments in A–C. With single stimuli, hyperosmotic perfusate caused a significant decrease and hypo-osmotic perfusate caused a significant increase in maximal population spike amplitude (*p < 0.05). With tetanically induced oscillations, a similar pattern was seen but only the enhanced population spike amplitude with hypo-osmotic solutions reached significance (*p < 0.05). E, Comparison of the depolarizing event leading to action potentials with a single stimulus or during an oscillation. Traces show responses under normal conditions with no current injection. Top traces show a response and single period producing an action potential; bottom traces show a response and single period when no spike was seen (expanded vertical scale). Note the reduced depolarized time when comparing an evoked EPSP to a depolarizing phase of a gamma oscillation. Calibration: 50 mV (top)/5 mV (bottom), 20 msec.
Figure 4C shows the data from five slices in which the amplitude of the population spike induced by a single stimulus was measured at 40 μm intervals while tracking a field electrode down through the slices. The population spike amplitude was greatest in the middle of the slice (160–240 μm from the surface) for each osmotic condition tested. However, unlike the oscillation-induced field, the change to hyperosmotic perfusion medium produced a significant decrease in population spike amplitude, particularly in the top half of the slice (control maximum amplitude, 5.7 ± 0.4 mV; hyperosmotic, 3.9 ± 0.2 mV; p < 0.05) (Fig.4D). The overall magnitude of the change in population spike amplitude for both hyperosmotic and hypo-osmotic conditions was greater for population spikes induced by single maximal stimuli than during a gamma oscillation. The reason for this appeared to be related to the degree of spike timing afforded by the excitatory synaptic events in the two conditions (Fig. 4E). The depolarizing component of the EPSP–IPSP sequence elicited by a single stimulus was up to fourfold broader than the EPSP–IPSP sequence observed on individual periods of a gamma oscillation. This suggested a greater degree of precision in synaptic control of spike generation during an oscillation, compared with a single evoked event.
Effects of reduced perfusion level
In addition to changing the slice environment using direct changes in the osmolarity of the perfusate, we could mimic the effects of hypo-osmotic solutions on both oscillations and responses to single stimuli by reducing the perfusate level of normal solution in the slice chamber (Fig. 5). Reduction in the perfusion level [so that no meniscus can be picked up on the slice surface (see Materials and Methods)] caused a significant increase in maximal population spike amplitude in response to single stimuli (p < 0.05) (Fig. 5A). In addition, the vertical position in the slice at which a maximal response was evoked was shifted to the more superficial quarter of the slice. Control maximum was seen 160–240 μm into the slice; in low perfusion levels, this moved to 40–120 μm below the slice surface. The combination of the reduced perfusion level and the addition of sucrose partially, but significantly, reduced this increase in population spike amplitude (p < 0.05; normal solution–low perfusion level vs hyperosmotic solution–low perfusion level).
Fig. 5.

Effects of perfusate level on oscillations recorded in pyramidal cells. A, Maximal population spike amplitude evoked by single afferent stimulation. Depth profile of responses shows significant increase in population spike amplitude in the top half of the slice when exposed to a low perfusion level (note that osmolarity of perfusate is unchanged) (p < 0.05). No such increase was seen in data pooled from the lower half of the slice (p > 0.05). This effect of low perfusate level could be partially removed by addition of 40 mmsucrose to the perfusion medium. B, Example pyramidal cell responses to tetanic stimulation. Cells were recorded in either the top quarter of the slice or the bottom half, with bottom cells found by advancing the recording electrode down the same electrode track as that used to find the top-lying cells (i.e., not concurrently recorded). Traces in the right panel show expanded portions of the oscillations in the correspondingtraces in the left panel. Lowering the perfusion level enhanced the post-tetanic depolarization, and stimulus intensities had to be reduced to produce comparable depolarizations. Note that the reduction in subthreshold gamma evident on lowering perfusion level is most apparent in the cell lying toward the surface of the slice. Note also the hyperpolarizing prepotentials in this cell (arrows). Addition of 40 mm sucrose to the perfusate reduced the depolarization amplitude (data not shown) but on increasing stimulus intensity to produce a comparable depolarization to that seen in controls the subthreshold oscillation returns in the cell lying toward the surface of the slice. Calibration: left panel, 100 mV, 500 msec; right panel, 8 mV, 200 msec.
The effects of hypo-osmotic solutions on the oscillations (Fig.4A,B) could be reproduced in the top quarter of slices by reducing the perfusion level (Fig.5B). In normal conditions, intracellular recordings from pyramidal neurons revealed the characteristic, predominantly subthreshold synaptic oscillation both toward the surface and deep into the slice. In conditions with low perfusion levels, the pyramidal cell response in cells in the top quarter of the slice showed the almost complete absence of subthreshold gamma oscillations and the occurrence of field effect artifacts. This condition could be partially restored by low-level perfusion with hyperosmotic solutions. Cells recorded deeper within the slice did display subthreshold gamma oscillations but with a reduced amplitude (control, 1.8 ± 0.3 mV; reduced perfusion level, 1.1 ± 0.4 mV; p < 0.05). However, no field effect artifacts were seen in these lower lying cells.
As with changes in osmolarity of the perfusion solution, the stimulus intensity had to be significantly reduced on switching to the low perfusion level to generate post-tetanic depolarization levels comparable with control conditions (control intensity, 38 ± 6 V; intensity in low perfusion levels, 8 ± 3 V; p < 0.05). Further analysis of the stimulus intensity dependence of the post-tetanic response revealed marked differences in control and low perfusion level conditions (Fig. 6). At a range of stimulus intensities from 10 to 80 V, gamma oscillations were rarely seen using stimuli <30 V in control conditions. At stimulus intensities <30 V, small, brief post-tetanic depolarizations were elicited and sometimes contained low-amplitude gamma oscillations (Fig.6Ai,ii). At stimulus intensities >30 V, subthreshold oscillations were readily observed, and increasing stimulus intensity increased the duration of the depolarization much more than the maximal amplitude. In contrast, spiking could be seen on large, longer depolarizations in low perfusion levels at stimuli as low as 4 V. Also, the apparent saturation of the depolarization at high stimulus intensities was not seen; higher stimulus intensities produced larger and larger depolarizations with faster and faster frequencies of action potential occurrence (Fig.6Bi,ii). In two of the five slices tested, the higher stimulus intensities led to a protracted plateau potential or depolarizing block lasting >2 min. This was never observed in normal perfusion conditions.
Fig. 6.
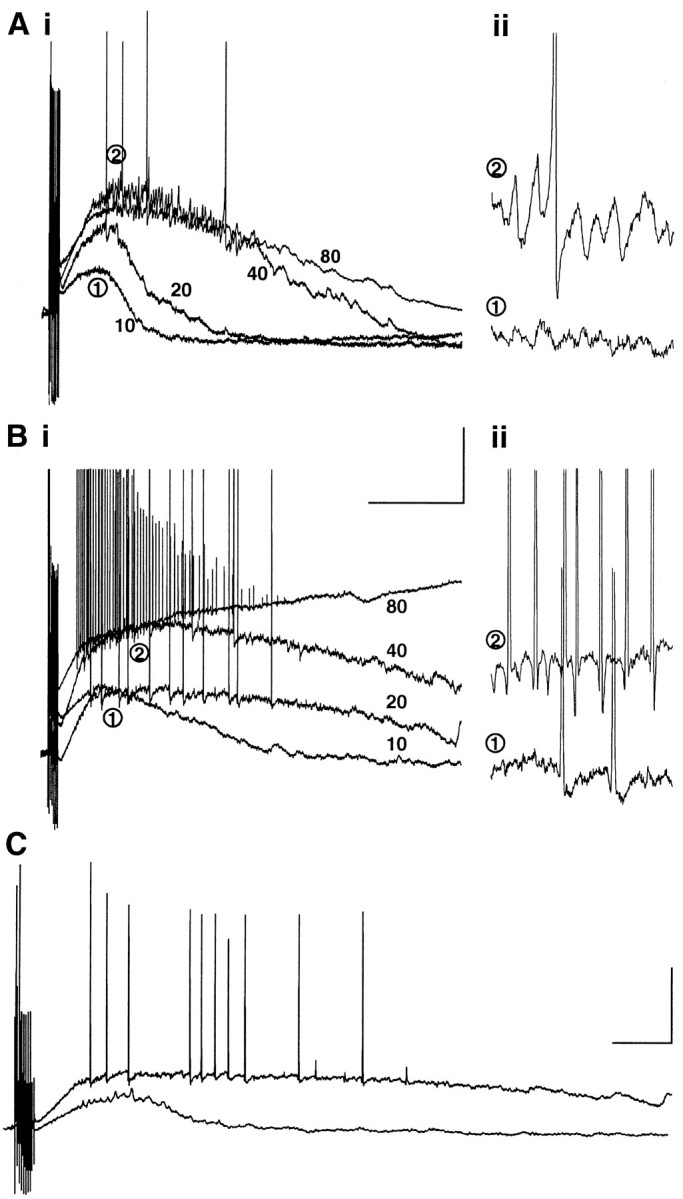
Effects of stimulus intensity on post-tetanic responses elicited in normal and reduced perfusion levels.A, Stimulus intensity was varied from 10 to 80 V, and oscillations were recorded in a cell in the top quarter of a normally perfused slice. Ai, Stimuli of 10 V failed to elicit action potentials and produced a small, brief depolarization. Stimuli ≥40 V generated a large depolarization superimposed on which were prominent trains of IPSPs and action potentials. Aii, Expanded portions of the traces in Ai at 10 V (1) and 80 V (2) showing the expression of the gamma oscillation. Bi, The same stimulus intensities used to elicit a post-tetanic response in a pyramidal cell in the top quarter of a slice exposed to a low perfusion level. Note the larger, longer depolarization and the occurrence of spiking even at 10 V. No saturation of the depolarization was seen, and higher stimulus intensities led to spreading depression in two of five slices tested in this manner. Bii, Expanded parts of thetraces in the left panel at 10 V (1) and 80 V (2). Note the absence of an observable subthreshold gamma oscillation and the hyperpolarizing prepotentials before spikes. Calibration: left panel, 20 mV, 600 msec; right panel, 5 mV, 100 msec. C, Example of post-tetanic responses elicited from the same slice perfused with normal aCSF level (bottom trace) and reduced aCSF level (top trace). Stimulus intensity in each case was adjusted to produce a 10 mV EPSP from −70 mV potential in the pyramidal cells shown (see Results). Calibration: 20 mV, 200 msec.
To test whether the reduction in threshold for generating a post-tetanic response was caused by changes in the buffering of the electrical stimuli by differences in the volume of surface aCSF in the two conditions, we normalized the stimulus intensity with respect to EPSP generation in pyramidal cells. Single stimuli required to produce a 10 mV EPSP from a membrane potential of −70 mV were 22 ± 7 V with normal perfusion and 18 ± 3 V with reduced aCSF level (n = 5 slices; p > 0.05). Using these stimulus intensities, the profile of post-tetanic responses was still very different (Fig. 6C).
Factors influencing the post-tetanic depolarization
Although the original demonstration of post-tetanic gamma oscillations showed a sensitivity of the depolarization to metabotropic glutamate receptor blockade (Whittington et al., 1997), a more recent report (Bracci et al., 1999) has shown that the post-tetanic depolarization was ablated by bicuculline, with metabotropic blockade having no measurable effect. We tested the two pharmacological manipulations on oscillations induced in normal perfusion conditions and conditions with low perfusion levels (Fig.7). Bath application of 0.5 mm MCPG reduced the underlying depolarization by 68 ± 12% (measured as the area under the post-tetanic depolarization) in control conditions. However, no significant reduction in post-tetanic depolarization was seen with responses elicited in low perfusion levels (Fig. 7B). Bicuculline (20 μm) enhanced the area under the depolarization in control conditions and changed the profile of the post-tetanic response from a gamma oscillation to a long, slow burst-type discharge (Fig. 7C). The same manipulation in slices with low-level perfusion reduced the post-tetanic depolarization area by 75 ± 14% and occasionally resulted in periods of repetitive burst firing, again with associated field effect artifacts. Addition of 20 μmbicuculline along with 0.5 mm MCPG in control conditions further reduced the depolarization amplitude to 12 ± 5% of control values, demonstrating at least a partial role for depolarizing GABA responses in generating stimulus-induced gamma oscillations in control conditions.
Fig. 7.

Different origins of the depolarization in normal and reduced perfusion levels. Intracellular recordings from pyramidal cells located in the top quarter of hippocampal slices.A, Post-tetanic responses to stimuli at 46 V (toptrace, normal perfusion level) and 10 V (bottom trace, reduced perfusion level).Right, Expanded portions of the respective traces show the subthreshold gamma oscillation and its apparent absence with low perfusion levels.B, Effects of MCPG (0.5 mm) on responses to tetani in A. Amplitude and duration of the depolarization evoked at 46 V in normal perfusion conditions were markedly reduced; subthreshold oscillations were almost abolished (right panel). In contrast, at the lower stimulus intensity with low perfusion levels, MCPG enhanced action potential spiking and had little effect on the depolarization. Note thatspikes have the hyperpolarizing prepotential characteristic of responses in low perfusion levels. C, Effects of bath application of bicuculline on the post-tetanic depolarization of cells in the top quarter of a slice with normal or low perfusion levels. Post-tetanic depolarizations with normal perfusion levels were enhanced by bicuculline, but the subthreshold oscillation was abolished (stimulus intensity, 54 V). In contrast, the depolarization induced with low perfusion levels was almost abolished by bicuculline with occasional burst spiking as illustrated (stimulus intensity, 12 V). Calibration: left, 40 mV, 800 msec;right, 5 mV, 200 msec.
It was demonstrated previously (Faulkner et al., 1998) that barbiturates reduce the frequency of post-tetanic gamma oscillations by increasing the decay time of IPSPs, but the effects on oscillations of the type presented by Bracci et al. (1999) have not been assessed. In control conditions, bath application of thiopental (20 μm) had a predictable effect in enhancing the duration of individual IPSPs making up the gamma oscillation. This was seen in both superficial and deeper pyramidal cells (Fig.8). It was also observed that thiopental reduced the frequency of field oscillations in low perfusate levels despite the near absence of observable intracellular subthreshold gamma oscillations (frequency of population spikes in low perfusate level was 58 ± 8 Hz, and with thiopental 22 ± 5 Hz; data not shown). However, slow IPSPs could be seen in superficial cells in the presence of thiopental (Fig. 8B). It was unlikely that these hyperpolarizing events were afterhyperpolarizations (AHPs) because no hyperpolarizing events were present before drug addition. Responses in deeper lying cells were similar to those observed in normal perfusion conditions. The pattern of slowing of spike and IPSP generation during the oscillations was mimicked by the effects of thiopental on stratum pyramidale field potentials in both control and low aCSF conditions (Fig. 8C).
Fig. 8.
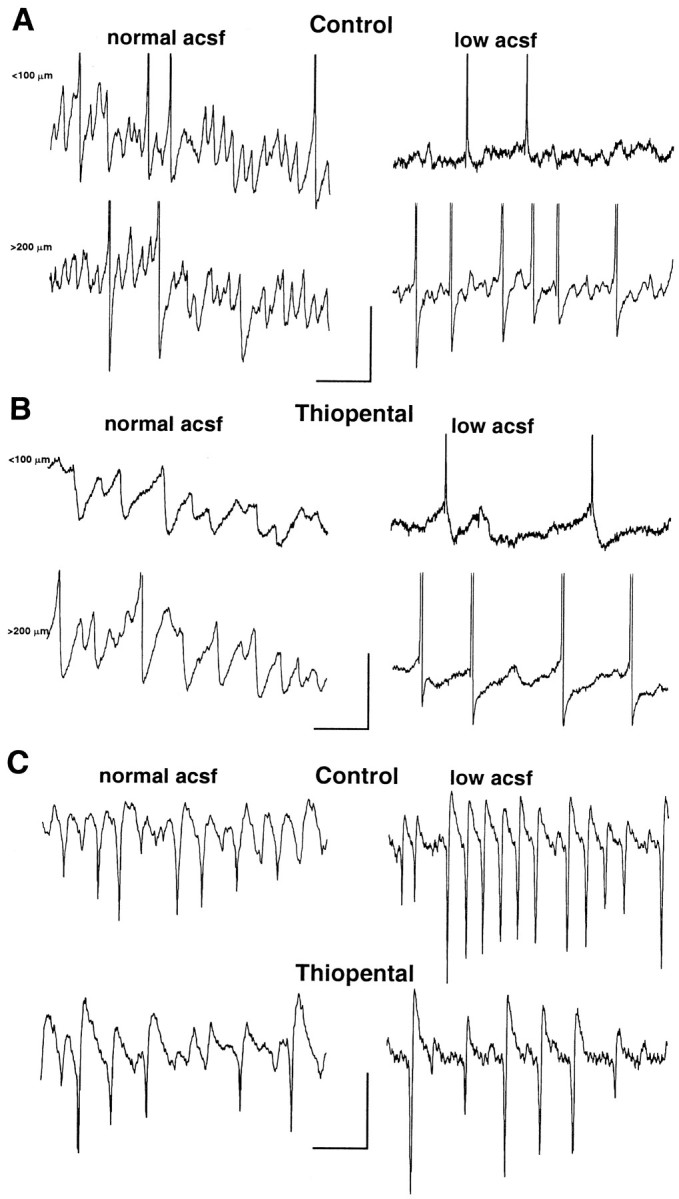
Barbiturate sensitivity of both forms of post-tetanic response. A, Epochs (500 msec) of post-tetanic oscillation recorded from pyramidal cells lying in the top quarter of a slice (top traces) and the bottom half (bottom traces). Traces were not concurrently recorded. In control conditions, cells in both locations demonstrate subthreshold gamma oscillations occasionally leading to spiking. In conditions of low perfusion level (right panel), only the deeper lying neurons demonstrate obvious subthreshold oscillations. B, Effects of 20 μm thiopental on the oscillations in A. The left panel shows effects of thiopental on a top- and bottom-lying pyramidal cell response. The duration of IPSPs constituting the subthreshold gamma oscillation is increased, and frequency is decreased at both locations. Frequency of spiking was also reduced at both locations in low perfusion level conditions (right panel). In addition, presumed slower IPSPs can now be seen in the intracellular recordings in the superficially located neuron, although prepotentials are still in evidence. Calibration: 5 mV, 100 msec (A, B).C, Slowing of IPSP trains in individual pyramidal cells was accompanied by a slowing of the stratum pyramidale field potential oscillation in the presence of thiopental. Calibration: 2 mV, 50 msec.
Extracellular potassium ion concentration changes
In an attempt to understand the mechanisms behind the enhanced excitability of neurons, particularly in the top quarter of slices, in low perfusion conditions we measured extracellular potassium ion activity concurrently with the two types of post-tetanic response (in normally perfused and low perfusate level slices) (Fig.9). Intracellular recordings of the post-tetanic oscillation were recorded from cells in the top quarter of the slice, and concurrent potassium ion measurements were taken. The potassium electrode was also advanced into the slices to record potassium transients in the deeper layers. In control perfusion conditions, a small increase in potassium activity was seen during the tetanus. This was followed by a larger, longer increase that followed the membrane depolarization but outlasted it by up to 5 sec. When corrected for the hyperpolarizing DC field potential shift accompanying the post-tetanic response (∼10% of the ion-sensitive electrode potential change; see Materials and Methods), the following values were obtained: in the top quarter of the slice, potassium concentration was raised to a mean maximum of 4.3 ± 0.6 mm; in the deeper layers, a larger increase to 5.1 ± 0.5 mm was seen (Fig. 9B).
Fig. 9.

Extracellular potassium changes accompanying the post-tetanic response are different for the two conditions.A, Example post-tetanic responses from cells in the top quarter of slices in control (left) and low perfusion level (right) conditions. Below are example potassium electrode potential changes (uncorrected for local field potential changes). Electrode was placed within 50 μm lateral to the recording electrode and advanced <100 μm into the slice (tracesshown are concurrently recorded with example intracellular responses) and >200 μm into the slice (not concurrent with example intracellular responses shown). Note the large overall amplitude difference in the two conditions, the initial decrease in potassium concentration, and the subsequent biphasic rise in condition with low perfusion level. Calibration, 1 sec. B, Pooled data from five slices in each condition with the potassium electrode potential compensated by local field potential. A significant increase in the peak estimated potassium level was seen when comparing control with low perfusion level conditions (*p < 0.05). Note also that the depth profile of potassium changes is reversed in the two conditions.
Despite the smaller stimulus intensities used to generate post-tetanic depolarizations with reduced perfusate levels, the accompanying estimated potassium ion concentrations were significantly larger. In addition, the greater changes were seen at the surface of the slice, not at the deeper levels as seen in control conditions. Also the potassium signal appeared to have two components: an initial component that followed the membrane depolarization and a later, larger rise that did not (Fig. 9A). The maximal potassium ion concentration reached in the top quarter of the slice was 9.3 ± 2.8 mm; in the deeper levels it was 6.9 ± 1.0 mm (p < 0.05, control vs low perfusate level).
Spatiotemporal properties of oscillations
Two-site, concurrent tetanic activation of both ends of area CA1 produced gamma oscillations at both sites that synchronize to within a millisecond. This synchrony can be modeled using arrays of realistic multicompartmental neurons with area CA1 considered as a continuum (i.e., a chain of interconnected oscillating areas) or as two “anatomically” distinct regions (see simulation methods for references). We examined activity midway between the two stimulated areas to assess the relative contributions of each situation to the synchrony seen experimentally. In control conditions, intracellular recordings from pyramidal cells proximal (<100 μm) to the two stimulus electrodes revealed characteristic, synaptically controlled post-tetanic gamma oscillations (Fig.10Ai). Responses midway between the two electrodes revealed a small post-tetanic depolarization with little evidence of trains of inhibitory potentials. No action potentials were elicited in pyramidal cells in this middle region, but trains of EPSPs were apparent (Fig.10Aii). In contrast, two-site oscillations elicited in low perfusate level conditions showed a great deal of activity midway between the locally stimulated sites (Fig.10Bii). The depolarization was of a smaller amplitude than that elicited at each local site but was of a longer duration. Again, little evidence for trains of IPSPs was seen, but spiking occurred on the depolarizing phase of trains of EPSPs. Field effect artifacts were also still apparent at this location.
Fig. 10.

Differences in spatial extent of post-tetanic depolarization with two-site stimuli. A, Example intracellular recordings from three pyramidal cells. Two were local to the stimulating electrode (<100 μm away, sites 1 and2), and one was midway between the two (at least 0.6 mm from each stimulating electrode, middle).Ai, Responses local to the stimuli (36 V, site 1; 42 V, site 2) show typical depolarization and subthreshold gamma oscillation. Aii, Themiddle site cell shows a much reduced depolarization with little discernible IPSP train. However, EPSPs were apparent (expanded trace, right panel).Central panel shows scheme of the positioning of electrodes for this study. Note that recordings were not made concurrently. Calibration: full traces, 20 mV, 1 sec;expanded trace, 2 mV, 200 msec. B, Recordings as in A, with slices exposed to low perfusate levels. Bi, Local responses in pyramidal cells show reduced gamma oscillation for a comparable depolarization amplitude (stimulus intensities, 8 V, site 1; 10 V, site 2). Bii, Pyramidal cell responses in the middle of the two stimulating electrodes also showed a marked depolarization in contrast to control conditions (compare Aii). Little subthreshold gamma oscillation was apparent, but EPSPs were prevalent (expanded trace). Calibration: as inA.
This observation suggested that depolarizations between sites caused by potassium concentration changes and activity possibly initiated by field effects may influence the pattern of two-site synchrony in the slice. To assess the extent of these changes on synchrony, we examined the temporal relationship between oscillations at the two sites after two types of lesion to the middle of area CA1 (Fig.11). In control conditions, two-site stimulation produced synchronous gamma oscillations that could be modeled by an array of neurons with patent connectivity between excitatory and inhibitory neurons present between the two ends of the array (Fig. 11A). If the middle of area CA1 was lesioned so that only the alveus was intact between stimulated areas, then synchrony persisted (Fig. 11B). From an anatomical perspective, this suggested that only the excitatory collaterals from pyramidal cells to interneurons and other pyramidal cells were necessary for synchrony and that potassium waves and field effects did not contribute. This situation was modeled by connecting two ends of the cell array with excitatory synapses to inhibitory neurons only. In this situation, the model confirmed the experimental observations. We conducted further experiments in which a full lesion of the middle of area CA1 was performed (including the alveus). In this situation, no synaptic connectivity between areas was possible, and, not surprisingly, synchrony was destroyed (Fig. 11C).
Fig. 11.

Two-site synchrony requires only intact alvear fibers between sites. Data shown for each condition are overlaid, with concurrently recorded field potentials taken from extracellular electrodes proximal to the stimulating electrode at each site. Cross-correlations are shown as mean correlograms for the field responses in each slice (thin lines) and global mean correlogram for all five slices in each condition. Model data show average e-cell firing at each end of the model array (plotted in the negative direction for comparison with field potentials) and the cross-correlogram for the relationship between the two ends of the array. Calibration: Experiment, 2 mV, 50 msec;Model, 25 mV, 50 msec. A, Phase relationship between the two sites, either end of area CA1 in control conditions (normal perfusion level). The intact area CA1 was modeled by having interneuron–interneuron, interneuron–pyramidal cell, and pyramidal cell–interneuron connections between the two ends of the array (Traub et al., 1999). Interneuron connections can occur up to 0.5 mm (along the axis of the array), whereas pyramidal cells can contact (with some finite probability) any cell along the extent of the array. B, Phase relationships after a lesion, midway between sites, cutting through all laminas of area CA1 except the alveus. The lesion was modeled by cutting all axons crossing the midline except for pyramidal cell connections to distal interneurons. Two-site synchrony is preserved under these conditions.C, A full lesion (including the alveus) midway between sites, modeled with no synaptic connectivity between the two ends of the array. Note that, under these conditions, two-site synchrony is lost. Note that peaks in individual example correlograms are spurious, because of random drifting in and out of phase of two independent oscillations of comparable frequency.
DISCUSSION
This study demonstrated that synaptic inhibition-based oscillations gate pyramidal cell gamma oscillations and produce a field potential oscillation dependent on the degree of excitability of the pyramidal neuronal population. Phenomena associated with field effect-mediated drive to pyramidal cells became manifest when slices were perfused with hypo-osmotic solutions or normal solutions with a low level of perfusate. In conditions in which field effects predominated, the stimulus intensity required to generate a post-tetanic response was considerably lowered. The resulting depolarizing drive was almost abolished with bicuculline and was accompanied by a very large extracellular potassium ion concentration increase.
The presence of large population spikes is not something seen in gamma oscillations associated with bursts of activity in vivo, except during electrographic seizure activity (Traub et al., 1996). This suggests that the degree of drive to pyramidal cells in thein vitro model does not accurately reflect the physiological situation. However, in normal conditions these population spikes are not associated with field effect artifacts, and reduction of pyramidal cell involvement did little to change the underlying inhibition-based oscillation. Small effects on the mean frequency and the power of the response were seen, suggesting that excitatory synaptic events in pyramidal cells and interneurons influence the synaptic gamma oscillation to some extent.
The reduction in pyramidal cell excitability afforded by the serotoninergic agent BP554 resulted in field potentials far more comparable with those seen in vivo. There is a great deal of serotoninergic input to area CA1 (Freund et al., 1990), suggesting that the differences in degree of pyramidal cell recruitment in vivo and in vitro may be a consequence of the lack of neuromodulatory cues in the slice preparation. The target receptor (5-HT1A) for this drug is located mainly on hippocampal pyramidal cells at the level of the axon hillock (Azmitia et al., 1996), but effects have been observed on inhibitory potentials (Schmitz et al., 1995). However, in the present study we observed no significant change in the power of the inhibition-based gamma oscillation, measured as IPSP trains in pyramidal cells. This suggested that any change in inhibitory neuronal excitability caused by BP554 was not sufficient to interfere with the underlying oscillation. Removal of subcortical neuromodulation of the hippocampus in vivo generates epileptic discharges (Buzsáki et al., 1989). It has also been shown that pyramidal cell involvement in vitro habituates rapidly (Doheny et al., 2000). The habituated post-tetanic response is predominantly subthreshold for pyramidal cell firing and, again, more closely resembles gamma oscillations seen in response to sensory stimulation clinically or after sharp waves in vivo (Traub et al., 1996; Haenschel et al., 2000).
Population spikes seen in normal conditions were enhanced by perfusion with hypo-osmotic solutions or low-level perfusion with normal solutions. In these cases intracellular recordings revealed field artifacts that appeared to facilitate the generation of action potentials. Population spike amplitude was also enhanced nonsynaptically after single afferent stimulation as demonstrated previously (Ballyk et al., 1991). In addition, increases in osmolarity, during conditions in which field effects predominate during post-tetanic oscillations, abolished action potential generation in the pyramidal neurons recorded. However, a gamma frequency field potential (albeit of lower amplitude) persisted after this blockade of field effects (Bracci et al., 1999).
Hypo-osmotic solutions cause neuronal swelling, and neuronal swelling is also generated by repetitive stimulation similar to the type used in this study (Gutschmidt et al., 1999). Secondary to this are a number of factors that may explain the differences in the types of post-tetanic oscillation seen. Changes in resistance of intracellular and extracellular microenvironments tend to redistribute current flow from the extracellular to the intracellular domain (Jefferys, 1995). This is prominent in laminar regions with tight cell packing such as the cornu ammonis. As a consequence of this, the length constant of dendrites is reduced, and an enhancement of synaptic currents at the level of the cell soma is seen (Rosen and Andrew, 1991). Recordings from slices in hypo-osmotic or reduced-level perfusion conditions showed a marked reduction in the amplitude of subthreshold IPSP trains making up the gamma oscillation. A decrease in GABAAreceptor-mediated currents caused by hypo-osmotic solutions and cell swelling has been reported (Vreugdenhil et al., 1995).
A feature of spiking with predominant field-effect artifacts was the reduction of AHP amplitude. Depression of some potassium currents has been observed as a consequence of exposure to hypo-osmotic solutions (Somjen, 1999). Cell swelling in hypo-osmotic environments has also been shown to enhance transmembrane calcium flux and intracellular release (Somjen, 1999; Borgdorff et al., 2000). This would be expected to activate slow, calcium-dependent AHPs that would shunt the membrane resistance.
The depolarization itself appeared to have a greater depolarizing GABA component in conditions of reduced perfusion level. A lower stimulus intensity was required to generate a depolarization, and the membrane potential change was not sensitive to metabotropic glutamate receptor blockade. Instead, this depolarization was almost abolished by bicuculline, suggesting a depolarizing GABA event. In contrast, in normal slice conditions, much stronger stimuli were required to generate a depolarization, and this depolarization was enhanced by bicuculline and reduced by MCPG. Metabotropic glutamate receptor-mediated excitation of the cornu ammonis appears to involve two mechanisms. First, there is a reduction in potassium conductance that depolarizes hippocampal neurons. Second, a pure metabotropic EPSP can be observed directly when GABA-mediated inhibition and potassium channels are blocked (Congar et al., 1997; Heuss et al., 1999;Partridge and Valenzuela, 1999). This EPSP is mediated by a nonselective cation channel in a stimulus-dependent manner. However, in normal conditions, an underlying depolarization still exists after application of MCPG (Fig. 5), and this component is blocked by bicuculline (Faulkner, 1999).
Using longer tetanic stimuli in slices from animals younger than those used in the present study yields a pure depolarizing GABA receptor-mediated depolarization (Kaila et al., 1997). In these conditions, the pyramidal cell response shows a train of full and partial spikes with little evident AHP. However, in some cases this experimental protocol also yields normal spike trains and trains of hyperpolarizing events similar to IPSPs (Taira et al., 1997), suggesting the possibility of synaptic inhibition-based oscillations with depolarizing GABA-mediated drive alone. The mainly depolarizing GABA response in the low perfusion level condition was accompanied by a large extracellular potassium transient. Potassium concentrations >0.5 mm drive the potassium chloride co-transporter (KCC2) in reverse, causing an increase in intracellular chloride (Payne, 1997). This would be expected to enhance depolarizing GABA responses (Rivera et al., 1999) and attenuate the hyperpolarizing IPSPs shaping the gamma oscillation. At the low stimulus intensities needed in these conditions, it is unlikely that sufficient glutamate was released to activate metabotropic responses.
The similarity between oscillations generated in hypo-osmotic environments and the oscillations seen in the top quarter of slices perfused at low levels suggested that the top surface of the slice was hypotonic in these conditions at rest or became more hypotonic after repetitive stimulation (Gutschmidt et al., 1999). In an interface chamber, the top surface of the slice is exposed directly to water vapor. Over the course of an experiment, some of this water vapor condenses onto surfaces in the interface chamber. If this condensation occurs, then inadequate perfusion of the top surface of the slice would result in the maintenance of a hypo-osmotic environment, thus producing the observed effects discussed above. If perfusion levels are high enough, then any condensation is immediately diluted into the large volume of perfusate present around the slice. However, the observed increase in potassium transients and ephaptic artifacts can also be produced by a reduction in extracellular volume without accompanying cell swelling, as would be expected if the surface of the slices was inadequately perfused. The enhanced excitability of the slices exposed to low levels of perfusate could also have been caused by a decrease in the shunting of electrical stimulus by reduced surface aCSF levels and/or a short-circuiting of field potentials in the vertical direction through the slice. However, with the manipulations of the microenvironment used here, there was no significant difference in the stimulus intensities required to generate EPSPs in pyramidal cells. The changes in field potential amplitude were localized mainly in the top half of the slice, and no observable change in slice thickness was seen during the course of single experiments. In addition, the changes in the profile of the oscillation and the stimulus intensity required to elicit oscillations were similar in the low perfusate condition to the slice normally perfused with hypo-osmotic solution.
Even in conditions in which field effects predominate, gamma oscillations appeared to be controlled by synaptic mechanisms. With low perfusion levels, the gamma activity seen at the surface of the slice was as susceptible to modulation of GABAAreceptor-mediated IPSP kinetics as the oscillations seen in normal conditions. Perfusing at low levels with a hyperosmotic solution partially restored synaptic gamma oscillations, and it has been previously shown (Bracci et al., 1999) that abolition of a field effect-mediated oscillation in individual pyramidal cells with hyperosmotic solutions still leaves an observable population gamma oscillation.
Despite this apparently common synaptic origin of oscillations in the two conditions, the spatiotemporal characteristics of the synaptically and predominantly nonsynaptically generated oscillations were different. In normal conditions, two oscillating areas at either end of area CA1 synchronize well despite the absence of an oscillation in the neuronal aggregate lying between them. With low perfusion levels, the area between two oscillating areas is active. With this spatial arrangement, the synchrony between two sites has been shown to be disrupted (Hack et al., 1999). In the normal condition, only long-range excitatory synaptic connections onto interneurons were necessary for maintenance of synchrony. In conditions with activity between areas, a complex temporal pattern was seen that has been interpreted as being caused by the slow spread of ephaptic excitation along the CA1 axis (Hack et al., 1999). The rises in potassium concentration associated with conditions in which intermediate regions are active were large. It has been shown that comparable changes can disrupt, or even abolish axonal conduction (Poolos et al., 1987), suggesting that the long-range excitation necessary for synchrony via synaptic mechanisms may be disrupted in this situation.
In summary, synaptically driven post-tetanic oscillations associated with trains of inhibitory potentials could be transformed into nonsynaptically driven, field effect-mediated oscillations by factors that reduce the relative size of the extracellular space with reference to the intracellular space. The latter form of oscillation was associated with lower stimulus intensities which, although adequate to activate a depolarizing GABA event, appeared inadequate to release sufficient glutamate to activate metabotropic glutamate receptors. Previous studies on post-tetanic depolarizing GABA events have used long periods (e.g., 1 sec) of tetanus that may favor expression of nonsynaptic mechanisms by directly inducing cell swelling (Gutschmidt et al., 1999). With shorter durations of tetanic stimulation, nonsynaptic events were elicited when the slice microenvironment was adjusted to favor reduced extracellular/intracellular volume ratio. However, these milder tetanic stimuli have been shown to elicit metabotropic EPSPs with stimulus numbers as low as 2–10 (Knopfel et al., 2000). Factors associated with the nonsynaptic oscillation (field effects, synaptic depression, reduced AHPs, calcium accumulation, and KCC2 activation) are all related to hypo-osmotic environments and/or cell swelling.
Neuronal swelling is associated with brain hypoxia, seizures, and excitotoxicity (Andrew and MacVicar, 1994). The large-scale pyramidal cell involvement and altered spatiotemporal characteristics associated with gamma oscillations in conditions likely to cause cell swelling, or absence of neuromodulatory cues, suggest that prolonged periods of gamma activity associated with temporal lobe seizures (Buzsáki et al., 1989; Fisher et al., 1992) may, in part, be a consequence of amplification of synaptic gamma oscillations by field effects. However, in normal slice environments, in the presence of neuromodulators such as serotonin, in vitro stimulus-induced gamma oscillations provide an accurate, useful model of physiological gamma oscillations associated with cognition (Traub et al., 1999b).
Footnotes
This work was supported by the Wellcome Trust and The Medical Research Council. R. D. T. is a Wellcome Trust Principal Research Fellow.
Correspondence should be addressed to M. A. Whittington, School of Biomedical Sciences, The Worsley Building, University of Leeds, Leeds LS2 9NL, UK. E-mail:m.a.whittington@leeds.ac.uk.
REFERENCES
- 1.Andrew RD, MacVicar BA. Imaging cell volume changes and neuronal excitation in the hippocampal slice. Neuroscience. 1994;62:371–383. doi: 10.1016/0306-4522(94)90372-7. [DOI] [PubMed] [Google Scholar]
- 2.Azmitia EC, Gannon PJ, Kheck NM, Whitaker-Azmitia PM. Cellular localisation of the 5-HT1A receptor in primate brain neurons and glial cells. Neuropsychopharmacology. 1996;14:35–46. doi: 10.1016/S0893-133X(96)80057-1. [DOI] [PubMed] [Google Scholar]
- 3.Ballyk BA, Quackenbush SJ, Andrew RD. Osmotic effects on the CA1 neuronal population in hippocampal slices with special reference to glucose. J Neurophysiol. 1991;65:1055–1066. doi: 10.1152/jn.1991.65.5.1055. [DOI] [PubMed] [Google Scholar]
- 4.Borgdorff AJ, Somjen GG, Wadman WJ. Two mechanisms that raise free intracellular calcium in rat hippocampal neurons during hypo-osmotic and low NaCl treatment. J Neurophysiol. 2000;83:81–89. doi: 10.1152/jn.2000.83.1.81. [DOI] [PubMed] [Google Scholar]
- 5.Bracci E, Vreugdenhil M, Hack SP, Jefferys JG. On the synchronizing mechanisms of tetanically induced hippocampal oscillations. J Neurosci. 1999;19:8104–8113. doi: 10.1523/JNEUROSCI.19-18-08104.1999. [DOI] [PMC free article] [PubMed] [Google Scholar]
- 6.Buzsáki G, Ponomareff GL, Bayardo F, Ruiz R, Gage FH. Neuronal activity in the subcortically denervated hippocampus: a chronic model of epilepsy. Neuroscience. 1989;28:527–538. doi: 10.1016/0306-4522(89)90002-x. [DOI] [PubMed] [Google Scholar]
- 7.Congar P, Leinekugel X, Ben-Ari Y, Crepel V. A long-lasting calcium activated nonselective cationic current is generated by synaptic stimulation or exogenous activation of group I metabotropic glutamate receptors in CA1 pyramidal neurons. J Neurosci. 1997;17:5366–5379. doi: 10.1523/JNEUROSCI.17-14-05366.1997. [DOI] [PMC free article] [PubMed] [Google Scholar]
- 8.Doheny HC, Traub RD, Faulkner HJ, Gruzelier J, Whittington MA. Receptive field-specific habituation of tetanus-induced gamma oscillations in the hippocampus in vitro. NeuroReport. 2000;11:1–5. doi: 10.1097/00001756-200008210-00005. [DOI] [PubMed] [Google Scholar]
- 9.Faulkner HJ. PhD thesis. University of London; 1999. Disruption of fast oscillations in hippocampal networks: a common mechanism of anaesthetic drug action. [Google Scholar]
- 10.Faulkner HJ, Traub RD, Whittington MA. Disruption of synchronous gamma oscillations in the rat hippocampal slice: a common mechanism of anaesthetic drug action. Br J Pharmacol. 1998;125:483–492. doi: 10.1038/sj.bjp.0702113. [DOI] [PMC free article] [PubMed] [Google Scholar]
- 11.Faulkner HJ, Traub RD, Whittington MA. Anaesthetic/amnesic agents disrupt beta oscillations associated with potentiation of excitatory synaptic potentials in the rat hippocampal slice. Br J Pharmacol. 1999;128:1813–1825. doi: 10.1038/sj.bjp.0702948. [DOI] [PMC free article] [PubMed] [Google Scholar]
- 12.Fisher RS, Webber WR, Leeser RP, Arroyo S, Uematsu S. High frequency EEG activity at the start of seizures. J Clin Neurophysiol. 1992;9:441–448. doi: 10.1097/00004691-199207010-00012. [DOI] [PubMed] [Google Scholar]
- 13.Freund TF, Gulyas AI, Acsady L, Gorcs T, Toth K. Serotonergic control of the hippocampus via local inhibitory interneurons. Proc Natl Acad Sci USA. 1990;87:8501–8505. doi: 10.1073/pnas.87.21.8501. [DOI] [PMC free article] [PubMed] [Google Scholar]
- 14.Gutschmidt KU, Stenkamp K, Buchheim K, Heinemann U, Meierkord H. Anticonvulsant actions of furosemide in vitro. Neuroscience. 1999;91:1471–1481. doi: 10.1016/s0306-4522(98)00700-3. [DOI] [PubMed] [Google Scholar]
- 15.Hack SP, Vreugdenhil M, Bracci E, Greene RW, Jefferys JG. Tetanic gamma frequency discharges in hippocampal CA1: role of depolarising GABA in long-range synchronisation. Soc Neurosci Abstr. 1999;25:363.3. [Google Scholar]
- 16.Haenschel C, Baldeweg T, Croft R, Whittington MA, Gruzelier J. Gamma and beta oscillations in response to novel auditory stimuli: a comparison of human EEG data with in vitro models. Proc Natl Acad Sci USA. 2000;97:7645–7650. doi: 10.1073/pnas.120162397. [DOI] [PMC free article] [PubMed] [Google Scholar]
- 17.Heuss C, Scanziani M, Gahwiler BH, Gerber U. G-protein-independent signalling mediated by metabotropic glutamate receptors. Nat Neurosci. 1999;2:1070–1077. doi: 10.1038/15996. [DOI] [PubMed] [Google Scholar]
- 18.Jefferys JG. Nonsynaptic modulation of neuronal activity in the brain: electric currents and extracellular ions. Physiol Rev. 1995;75:689–723. doi: 10.1152/physrev.1995.75.4.689. [DOI] [PubMed] [Google Scholar]
- 19.Kaila K, Lamsa K, Smirnov S, Taira T, Voipio J. Long-lasting GABA-mediated depolarization evoked by high-frequency stimulation in pyramidal neurons of rat hippocampal slice is attributable to a network-driven, bicarbonate-dependent K+ transient. J Neurosci. 1997;17:7662–7672. doi: 10.1523/JNEUROSCI.17-20-07662.1997. [DOI] [PMC free article] [PubMed] [Google Scholar]
- 20.Knopfel T, Anchisi D, Alojado ME, Tempia F, Strata P. Elevation of intradendritic sodium concentration mdiated by synaptic activation of metabotropic glutamate receptors in cerebellar Purkinje cells. Eur J Neurosci. 2000;12:2199–2204. doi: 10.1046/j.1460-9568.2000.00122.x. [DOI] [PubMed] [Google Scholar]
- 21.Kopell N, Ermentrout GB, Whittington MA, Traub RD. Gamma rhythms and beta rhythms have different synchronization properties. Proc Natl Acad Sci USA. 2000;97:1867–1872. doi: 10.1073/pnas.97.4.1867. [DOI] [PMC free article] [PubMed] [Google Scholar]
- 22.Martina M, Vida I, Jonas P. Distal initiation and active propagation of action potentials in interneuron dendrites. Science. 2000;287:295–300. doi: 10.1126/science.287.5451.295. [DOI] [PubMed] [Google Scholar]
- 23.Matsuda T, Seong YH, Aono H, Kanda T, Baba A, Saito K, Tobe A, Iwata H. Agonist activity of a novel compound, 1-[3-(3,4-methylenedioxyphenoxy)propyl]-4-phenyl piperazine (BP-554), at central 5-HT1A receptors. Eur J Pharmacol. 1989;170:75–82. doi: 10.1016/0014-2999(89)90136-2. [DOI] [PubMed] [Google Scholar]
- 24.Miles R, Poncer J-C. Metabotropic glutamate receptors mediate a post-tetanic excitation of guinea-pig hippocampal inhibitory neurones. J Physiol (Lond) 1993;463:461–473. doi: 10.1113/jphysiol.1993.sp019605. [DOI] [PMC free article] [PubMed] [Google Scholar]
- 25.Partridge LD, Valenzuela CF. Ca2+ store-dependent potentiation of Ca2+ activated non-selective cation channels in rat hippocampal neurons in vitro. J Physiol (Lond) 1999;521:617–627. doi: 10.1111/j.1469-7793.1999.00617.x. [DOI] [PMC free article] [PubMed] [Google Scholar]
- 26.Payne JA. Functional characterisation of the neuronal-specific K-Cl cotransporter: implications for [K+]o regulation. Am J Physiol. 1997;273:1516–1525. doi: 10.1152/ajpcell.1997.273.5.C1516. [DOI] [PubMed] [Google Scholar]
- 27.Poolos NP, Mauk MD, Kocsis JD. Activity-evoked increases in extracellular potassium modulate presynaptic excitability in the CA1 region of the hippocampus. J Neurophysiol. 1987;58:404–416. doi: 10.1152/jn.1987.58.2.404. [DOI] [PubMed] [Google Scholar]
- 28.Rivera C, Voipio J, Payne JA, Ruusuvuori E, Lahtinen H, Lamsa K, Pirvola U, Saarma M, Kaila K. The K+/Cl− cotransporter KCC2 renders GABA hyperpolarising during neuronal maturation. Nature. 1999;397:251–255. doi: 10.1038/16697. [DOI] [PubMed] [Google Scholar]
- 29.Rosen AS, Andrew RD. Glucose concentration inversely alters neocortical slice excitability through an osmotic effect. Brain Res. 1991;555:58–64. doi: 10.1016/0006-8993(91)90859-t. [DOI] [PubMed] [Google Scholar]
- 30.Schmitz D, Empson RM, Heinemann U. Serotonin reduces inhibition via 5-HT1A receptors in area CA1 or rat hippocampal slices in vitro. J Neurosci. 1995;15:7217–7225. doi: 10.1523/JNEUROSCI.15-11-07217.1995. [DOI] [PMC free article] [PubMed] [Google Scholar]
- 31.Somjen GG. Low external NaCl concentration and low osmolarity enhance voltage-gated Ca currents but depress K currents in freshly isolated rat hippocampal neurons. Brain Res. 1999;851:189–197. doi: 10.1016/s0006-8993(99)02185-x. [DOI] [PubMed] [Google Scholar]
- 32.Taira T, Lamsa K, Kaila K. Post tetanic excitation mediated by GABA(A) receptors in rat CA1 pyramidal neurons. J Neurophysiol. 1997;77:2213–2218. doi: 10.1152/jn.1997.77.4.2213. [DOI] [PubMed] [Google Scholar]
- 33.Tallon-Baudry C, Bertrand O, Peronnet F, Pernier J. Induced gamma-band activity during the delay of a visual short-term memory task in humans. J Neurosci. 1998;18:4244–4254. doi: 10.1523/JNEUROSCI.18-11-04244.1998. [DOI] [PMC free article] [PubMed] [Google Scholar]
- 34.Traub RD, Miles R. Pyramidal cell-to-inhibitory cell spike transduction explicable by active dendritic conductances in inhibitory cell. J Comput Neurosci. 1995;2:291–298. doi: 10.1007/BF00961441. [DOI] [PubMed] [Google Scholar]
- 35.Traub RD, Jefferys JGR, Miles R, Whittington MA, Tóth K. A branching dendritic model of a rodent CA3 pyramidal neurone. J Physiol (Lond) 1994;481:79–95. doi: 10.1113/jphysiol.1994.sp020420. [DOI] [PMC free article] [PubMed] [Google Scholar]
- 36.Traub RD, Whittington MA, Colling SB, Buzsaki G, Jefferys JG. Analysis of gamma rhythms in the rat hippocampus in vitro and in vivo. J Physiol (Lond) 1996;493:471–484. doi: 10.1113/jphysiol.1996.sp021397. [DOI] [PMC free article] [PubMed] [Google Scholar]
- 37.Traub RD, Whittington MA, Buhl EH, Jefferys JGR, Faulkner HJ. On the mechanism of the γ→β frequency shift in neuronal oscillations induced in rat hippocampal slices by tetanic stimulation. J Neurosci. 1999a;19:1088–1105. doi: 10.1523/JNEUROSCI.19-03-01088.1999. [DOI] [PMC free article] [PubMed] [Google Scholar]
- 38.Traub RD, Jefferys JG, Whittington MA. Fast oscillations in cortical circuits. MIT; Cambridge, MA: 1999b. [Google Scholar]
- 39.Vreugdenhil M, Somjen GG, Wadman WJ. Effects of strongly anisosmotic and NaCl deficient solutions on muscimol and glutamate evoked whole-cell currents in freshly dissociated hippocampal neurons. Brain Res. 1995;670:89–96. doi: 10.1016/0006-8993(94)01283-n. [DOI] [PubMed] [Google Scholar]
- 40.Whittington MA, Traub RD, Jefferys JG. Synchronised oscillations in interneuron networks driven by metabotropic glutamate receptor activation. Nature. 1995;373:612–615. doi: 10.1038/373612a0. [DOI] [PubMed] [Google Scholar]
- 41.Whittington MA, Stanford IM, Colling SB, Jefferys JG, Traub RD. Spatiotemporal patterns of gamma frequency oscillations tetanically induced in the rat hippocampal slice. J Physiol (Lond) 1997;502:591–607. doi: 10.1111/j.1469-7793.1997.591bj.x. [DOI] [PMC free article] [PubMed] [Google Scholar]