

Abstract
The expansion of polyglutamine tracts encoded by CAG trinucleotide repeats is a common mutational mechanism in inherited neurodegenerative diseases. Spinocerebellar ataxia type 6 (SCA6), an autosomal dominant, progressive disease, arises from trinucleotide repeat expansions present in the coding region of CACNA1A (chromosome 19p13). This gene encodes α1A, the principal subunit of P/Q-type Ca2+ channels, which are abundant in the CNS, particularly in cerebellar Purkinje and granule neurons. We assayed ion channel function by introduction of human α1A cDNAs in human embryonic kidney 293 cells that stably coexpressed β1 and α2δ subunits. Immunocytochemical analysis showed a rise in intracellular and surface expression of α1A protein when CAG repeat lengths reached or exceeded the pathogenic range for SCA6. This gain at the protein level was not a consequence of changes in RNA stability, as indicated by Northern blot analysis. The electrophysiological behavior of α1Asubunits containing expanded (EXP) numbers of CAG repeats (23, 27, and 72) was compared against that of wild-type subunits (WT) (4 and 11 repeats) using standard whole-cell patch-clamp recording conditions. The EXP α1A subunits yielded functional ion channels that supported inward Ca2+ channel currents, with a sharp increase in P/Q Ca2+ channel current density relative to WT. Our results showed that Ca2+channels from SCA6 patients display near-normal biophysical properties but increased current density attributable to elevated protein expression at the cell surface.
Keywords: P/Q-type calcium channel, α1A, SCA6, polyglutamine, CAG repeats, cerebellar ataxia
Spinocerebellar ataxia type 6 (SCA6), a progressive neurodegenerative disease of the cerebellum and inferior olives, arises from modifications in α1A, the pore-forming subunit of P/Q-type Ca2+ channels (Gillard et al., 1997;Piedras-Renteria and Tsien, 1998; Jun et al., 1999). Several variants of this subunit carry an insertion (GGCAG) before the stop codon (Zhuchenko et al., 1997), which generates a frame shift and channel isoforms with longer C-terminal cytoplasmic domains (see Fig.1A). Such isoforms contain a trinucleotide repeat domain (CAGn) that encodes a polyglutamine (polyQ) tract whose expansion causes SCA6. Unlike many other polyQ-carrying proteins, α1A exhibits unusually small expansions in disease, 21–30 repeats in SCA6 compared with 4–18 repeats in normal individuals (Zoghbi, 1997; Schols et al., 1998;Takiyama et al., 1998; Watanabe et al., 1998; Yabe et al., 1998; Tran and Miller, 1999).
Fig. 1.
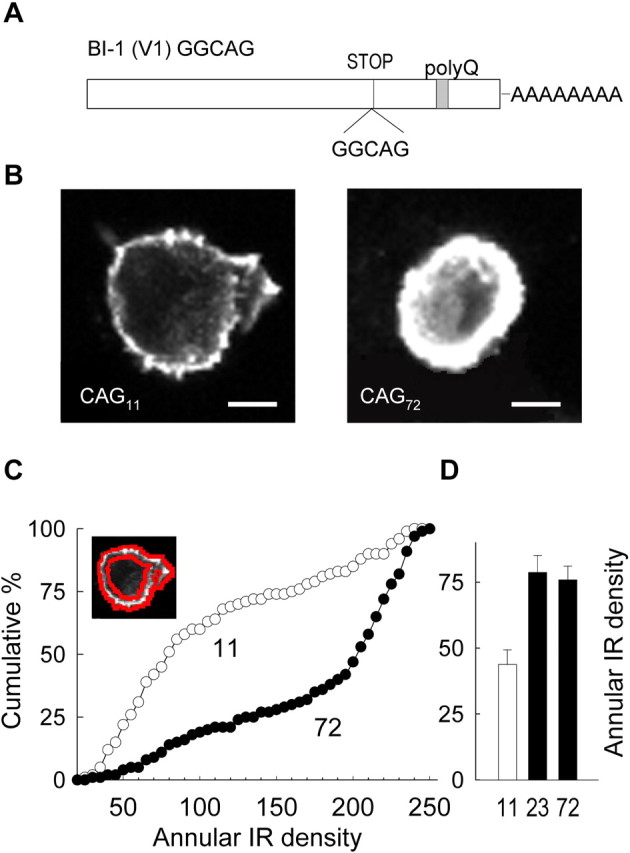
Expanded α1A gives rise to greater immunoreactivity than WT. A, Schematic representation of isoform BI-1 (V1) GGCAG, showing the position of the GGCAG insertion [near the stop codon (STOP)], which results in a frame shift and the inclusion of a polyQ tract in the human α1Acalcium channel. B, Representative examples of HEK293 cells expressing CAG11 and CAG72α1A. Note that CAG72 yields stronger immunoreactivity than CAG11 when expressed under parallel conditions. Scale bar, 5 μm. C, Annular immunoreactivity analysis reveals greater IR adjacent to the edge of the cell in EXP α1A. Cumulative distribution of annular IR density in cell populations expressing CAG72α1A (n = 186) compared with CAG11 α1A (n = 144) (p < 0.001). Inset, Exemplar cell showing annulus for IR analysis outlined in red.D, In a separate experiment comparing membrane IR values in cells expressing EXP constructs CAG23 and CAG72, mean values are similar (p > 0.1). CAG11 is shown for comparison (n = 28, 53, and 47 for CAG11, CAG23, and CAG72, respectively).
Does the mild polyQ expansion of SCA6 α1A give rise to a channelopathy or to a cytopathology typical of polyQ disorders? Ishikawa et al. (1999b,c) found abundant expression and cytoplasmic aggregation of the human α1Aprotein, in both human embryonic kidney 293 (HEK293) cells and cerebella from SCA6 patients. However, Matsuyama et al. (1999) found no difference in current density when rabbit α1Achannels with 4, 24, 30, or 40 polyQ repeats were expressed in baby hamster kidney cells. The α1A channels with 30 or 40 glutamines showed a negative shift in their voltage dependence of inactivation, consistent with a reduction in Ca2+ channel function. The same result was found even for α1A channels with only 24 glutamines in a later study (Toru et al., 2000) that focused on the spliced isoform corresponding to P-type channel behavior (Bourinet et al., 1999). In contrast to these reductions in channel availability,Restituito et al. (2000a) studied polyQ-expanded α1A subunits in Xenopus oocytes and found changes in channel gating consistent with enhanced Ca2+ entry. These inconsistencies leave considerable uncertainty about the cellular basis of SCA6 pathophysiology. The published studies described the biophysical properties of P/Q-type channels in detail but did not examine the subcellular distribution of the expressed channel protein, precluding comparisons with postmortem specimens.
In approaching SCA6, we used both immunocytochemistry and electrophysiology because of their complementary advantages. Immunocytochemistry provides information about subcellular distribution of channel protein, including its relative abundance at the cell surface, allowing comparisons with human brain; electrophysiology monitors the functional properties of channels under well defined conditions. The effects of polyQ expansions were tested with an entirely human α1A subunit rather than an interspecies chimera. The modified subunits were expressed in a well characterized cell line stably expressing auxiliary subunits (β1c and α2δ1) appropriate to support the function of α1A. Our experiments showed that polyQ expansion increased the surface expression of FLAG-tagged α1A protein, both at the surface and deep within the cytosol. PolyQ expansion also sharply increased maximal P/Q-type currents and shifted the voltage dependence of activation toward negative potentials, thereby causing peak current density to increase twofold once CAG repeat lengths exceeded the pathogenic threshold. Our data suggest that increased membrane protein in SCA6 may give rise to elevated channel activity and altered calcium homeostasis in a genetically dominant manner. The cytosolic accumulation of mutant α1A protein we observed may also contribute to SCA6 pathogenesis.
MATERIALS AND METHODS
Full-length α1A cDNA construction. cDNA generated from human brain poly(A+) RNA (Clontech, Palo Alto, CA) with the Gubler and Hoffman methods was cloned into a λ phage vector using a primer that corresponds to nucleotide (nt) position 5221–5241 of the human α1ACa2+ channel sequence. Primary recombinants were screened using a radioactive probe made from the 3.6 kb cDNA corresponding to the 3′ region (Zhuchenko et al.). A 5.2 kb clone containing 236 base pairs of the 5′ untranslated region was isolated. The 3′ region of this cDNA fragment overlapped with the existing 3′ fragment by ∼1.0 kb. The 3′ fragment contained the C-terminal region of the human α1ACa2+ channel subunit and included the GGCAG sequence. The 5′ fragment was recombined with the 3′ fragment via an internal EcoRV site at nucleotide position 5149. The complete sequence to the full-length human BI-1 (V1)-GGCAG isoform has been deposited in GenBank (accession number U79666).
Construction of α1ACa2+ channel with normal and expanded CAG repeats. The α1A cDNA containing 11 CAG repeats (CAG11) was isolated directly from a human cDNA library (Zhuchenko et al., 1997). The 23 and 27 CAG repeats (CAG23 and CAG27, respectively) were derived from genomic DNA of diseased individuals from the MDSCA and INSCA family, respectively (Zhuchenko et al., 1997). The four CAG repeats was obtained from genomic DNA isolated from a healthy individual from the general population. Genomic DNA containing this region was amplified by PCR using the sense primer 5′-CACGTGTCCTATTCCCCTGTGATCC-3′ and the antisense primer 5′-CGAGGACGCGTGTCGTACG-3′. After the repeat length was confirmed by DNA sequence analysis, a 189 bp ApaI-SalI fragment of the PCR product was subcloned together with a 94bpSacII-ApaI fragment (nt 7058–7152) from the human α1A BI-1-GGCAG cDNA into pBluescript (Strategene, La Jolla, CA). Using a four-way ligation of a 283 bpSacII-SalI fragment from this construct, together with a 1574 bp HindIII-SacII (nt 5484–7058) and a 398 bp SalI-HindIII, C-terminal fragments were ligated into the HindIII cloning site of pBluescript to generate pBS-H-4Q. The expression vector containing the human CAG4 BI-1 (V1)-GGCAG isoform was created by exchanging the HindIII fragment containing 11 CAGs of the original human BI-1 (V1)-GGCAG isoform in the pBSK-CMV vector. Similar cloning strategy was applied to obtain human BI-1 (V1)-GGCAG isoforms with 23 and 27 CAG repeats.
The 72 CAG repeat isoform was generated with an in vitrostrategy for increasing the length of the CAG repeat, based on the idea that compatible end restriction fragments can ligate to form large concatamers. The SacII and KpnI (nt 7058–7237) of the human BI-1 (V1)-GGCAG isoform fragment cloned from the INSCA patient was digested with MwoI. The flanking fragments and the basic 5′-CAGCAGCAG-3′ repeat unit were then religated, with the resulting random formation of 5′-CAGCAGCAG-3′ concatamers. The larger fragments were isolated from an agarose gel and ligated to a vector containing SacII and KpnI restriction sites and transformed into bacteria. Approximately 200 clones from this ligation were isolated, and a total of seven clones visibly larger than the original construct were obtained. These clones were sequenced and found to contain CAG repeats ranging from 35 to 72 units. No aberrant nucleotide sequence was observed within the CAG repeat domain. The fragment containing the 72 CAG repeat was used to replace the corresponding fragment containing the 11 CAG fragment as described above.
FLAG-tagged human α1A Ca channel BI-1-GGCAG. An NH2-terminal fragment from the human α1A CACNA1A channel BI-1-GGCAG cDNA was amplified by PCR using the oligonucleotide primers 5′-CGTAAGCTTTGCAGAATGGCCCGC-3′ and 5′-CGACTTCAGGA-CGACTTGTA-3′. The PCR fragment was digested with HindIII and NotI, and, together with a 5.2 kb NotI-BglII 5′ fragment of the α1A CACNA1A channel, BI-1-GGCAG cDNA was ligated into the HindIII-BglII site of the pFLAG-CMV-2 (Eastman Kodak, Rochester, NY). FLAG-tagged BI-1-GGCAG cDNA constructs containing various CAG repeat lengths were created by the ligation of C-terminal fragments generated withBglII-EcoRV treatment with the various sizes of CAG repeats. The authenticity of these constructs was confirmed by DNA sequence analysis.
α1A expression in HEK293 cells. A stable HEK293 cell line expressing the calcium channel auxiliary subunits β1c (U86960) and α2δ (generous gift from Dr. J. Offord, Parke-Davies Pharmaceuticals, Ann Arbor, MI) (Rock et al., 1998) was used to transiently transfect 10 μg of α1A subunit constructs with various trinucleotide expansions using the calcium phosphate method (Yang and Horn, 1995). For electrophysiology experiments, cells were transfected with BI-1 (V1) GGCAG channels bearing 4, 11, 23, 27, or 72 CAG repeats and recorded from 48–72 hr after transfection. DNA amounts were quantified before transfection by gel electrophoresis and UV spectroscopy. The cells were kept in DMEM supplemented with 10% fetal bovine serum, 1000 U/ml penicillin–streptomycin, and 600 μg/ml geneticin. Cells were trypsinized and plated onto coverslips coated with Matrigel 24 hr after transfection. Positively transfected cells were detected by cotransfection with human CD8 lymphocyte surface antigen and CD8 antibody coated-paramagnetic beads (Dynal, Great Neck, NY).
Northern blot analysis. Total RNA from cells transfected with FLAG-tagged BI-1 (V1) GGCAG cDNAs with 11, 23, and 72 CAG repeats was obtained 2 d after transfection following standard protocols. RNA was fractionated and transferred to nylon membranes. Blots were probed with a 32P-labeled cDNA probe spanning bp 474–981 from the human α1A BI-1 (V1) cDNA and compared with glyceraldehyde 3-phosphate dehydrogenase (GAPDH) levels measured in a Storm 820 phosphorimager scanner (Molecular Dynamics, Sunnyvale, CA).
Electrophysiology. Ba2+currents were recorded using the whole-cell patch-clamp technique with an Axopatch 200A patch-clamp amplifier (Axon Instruments, Foster City, CA). Signals were acquired at 10 kHz and filtered at 2 kHz, and current traces were corrected for linear capacitive leak with on-line P/4 trace subtraction. Pipettes were made from borosilicate glass with resistance values ranging from 3 to 5 MΩ. Cell capacitance (18.6 ± 8.5 pF;n = 46) and series resistance (10.8 ± 3.4 MΩ before compensation; n = 45) were measured from the current transient elicited by a hyperpolarizing voltage pulse from −80 to −90 mV and compensated electronically. Series resistance was routinely compensated by 80–85%. Cells with large currents in which errors in voltage control might appear were discarded. Tail current amplitudes were measured 500 μsec after termination of the test pulse to minimize series resistance artifacts. The extracellular solution contained (in mm): 160 TEA-Cl, 10 BaCl2, and 10 HEPES-CsOH, pH 7.3 (305 mOsm). The intracellular solution composition was (in mm): 108 MeSO3 CsOH, 4.5 MgCl2, 9 EGTA, 4 ATP-Mg, 0.3 GTP-Na, and 24 HEPES, pH 7.4 (295 mOsm). All experiments were performed at room temperature (22–24°C). Steady-state inactivation and activation curves were fitted to a single Boltzmann function of the form Imax/(1 + exp(V1/2 −V)/k) + m, whereImax is the maximal current,V1/2 is the half-voltage of activation or inactivation, k is the slope factor, and m is the baseline factor (for inactivation only). When appropriate, data are reported as the mean ± SEM. Statistical significance was tested using single-factor ANOVA and the nonparametric Kolmogorov–Smirnov one-sample test, with p < 0.05 as the limit for statistical significance.
Immunocytochemistry. HEK293 cells transfected with FLAG-α1A fusion proteins were fixed with 4% paraformaldehyde–PBS and permeabilized with 0.4% saponin 48 hr after transfection. The primary antibody used was anti-FLAG M2 monoclonal antibody (1:2000; Eastman Kodak). Alexa 594 goat anti-mouse IgG (1:200; Molecular Probes) was used for secondary antibody. Midsection cell images were collected on a confocal laser-scanning microscope (MDI 2010; Molecular Dynamics). Total immunoreactivity (IR) was analyzed using the Scion Image program from NIH (Bethesda, MD), and IR density was expressed as total IR normalized by cell area. Membrane immunoreactivity was estimated by measuring the signal intensity in the area contiguous to the boundary of the cell. Annular regions of interest (ROI) were assigned to individual cells. A perimeter of a cell was manually traced, and then an inner curve was obtained at a constant distance from the perimeter. A region enclosed by the two curves represented the annular membrane ROI. An analysis program was written in LabVIEW (National Instruments, Austin, TX) to measure the area, total intensity, and average intensity within the ROI. The width of the annuli was set to 2 μm, and the annulus drawing line width was 0.4 μm.
RESULTS
Elevated membrane expression of mutant α1A protein
Previous reports have shown either altered subcellular distribution and nuclear accumulation of proteins with expanded polyQ tracts or their accumulation within their usual subcellular locale (Sisodia, 1998; Huynh et al., 1999; Tran and Miller, 1999). This led us to test whether the polyQ expansion in SCA6 might augment the number of P/Q-type Ca2+ channels in the surface membrane (Fig. 1). CAG11, CAG23, or CAG72 constructs (Fig. 1A) were tagged with a FLAG epitope to allow an analysis of cellular distributions and relative protein levels by immunofluorescence. Figure1B shows representative examples of HEK293 cells transfected with the FLAG-tagged CAG11 and CAG72 α1A subunits and then counterstained at 72 hr after transfection with anti-FLAG antibody. The intensity of the IR was generally greater in the cells with CAG expansion, both superficially and within the depths of the cell. The superficial immunofluorescence was examined quantitatively in confocal sections through the midsection of the cell. The IR at or near the cell membrane was estimated by consideration of an annulus, bounded on the outside by the edge of the cell and extending 2 μm toward the cell interior (Fig. 1C, inset). The total number of fluorescence counts within the annulus was divided by its area to obtain the annular IR density. Figure 1C compares the cumulative distributions of annular IR density in cells expressing CAG11 or CAG72. Compared with the wild-type (WT)-expressing cell population, the cells expressing the expanded (EXP) α1A showed significantly increased levels of IR in the immediate vicinity of the surface membrane. The median values of annular IR density were 79.3 for CAG11 (n = 144 cells) and 201.9 for CAG72 (n = 186 cells) (p < 0.005 by two-sample median test). Mean values were also increased, by ∼70% (104.3 ± 5.4 for CAG11 and 176.3 ± 4.5 for CAG72; p < 0.001 by ztest for means).
A more limited set of experiments was performed to compare the levels of surface IR between the mildly and strongly expanded CAG23 and CAG72 constructs (Fig. 1D), using similar annular analysis. The pooled data showed that the intensity of immunoreactivity in the immediate vicinity of the surface membrane was not significantly different in CAG23 or CAG72(p > 0.1; n = 53 and 47, respectively), although both appeared to be elevated relative to the particular CAG11 construct examined in this series (n = 28) (p < 0.01).
Analysis of α1A immunoreactivity in the immediate vicinity of the plasma membrane was a primary focus because of its possible relevance to the electrophysiological expression of conducting channels. Increases in α1A within the depths of the cytoplasm could not directly affect the electrical properties of cells but were also of interest in light of possible cell biological sequelae that may arise from polyglutaminopathy (Cummings et al., 1999; Huynh et al., 1999; Ishikawa et al., 1999a,b; Tran and Miller, 1999). As illustrated in Figure2, we found that cells could be divided in a relatively unambiguous way between those with immunoreactivity primarily restricted to the cell surface (membrane IR) and those in which the immunoreactivity was also clearly evident in the deep cytoplasm as well as near the surface membrane (membrane–cytosolic IR;right column). This categorization permitted the analysis of all cells, even those growing in clusters in which the individual cell boundaries were not well defined. In the cases of cytosolic–membrane IR, immunoreactivity was usually spread evenly throughout the cytoplasm but sometimes appeared in discrete puncta within the cell interior.
Fig. 2.

Subcellular localization of WT and EXP α1A. Representative examples of cells expressing CAG11 and CAG72 α1A. A total of 84.4% of cells transfected with CAG11 show membrane-localized IR (top left), whereas 15.6% exhibit additional cytosolic expression of α1A (top right; n = 307). EXP-expressing cells display 51.3% of cells with membrane-localized IR (bottom left), whereas cells with both membrane and cytosolic localization increased to 48.7% (bottom right;n = 388). Scale bars, 20 μm.
Striking differences in cellular distribution of immunoreactivity were found between cells expressing WT and EXP α1A. In a large sample of CAG11-expressing cells (n = 307), the great majority displayed membrane IR (84.4%). This value was comparable with published data for the subcellular localization of L-type channels supported by α1C (Gerster et al., 1999). The remaining cells (15.6%) displayed membrane–cytosolic IR, which could be further subdivided according to the appearance of the cytoplasmic IR (10.7% punctate, 4.9% uniformly cytosolic). The subcellular localization of immunoreactivity within cells expressing CAG72α1A (n = 388) was noticeably different. Membrane IR cells (51.3%) barely outnumbered the membrane–cytoplasmic IR cells (48.7%). In turn, the latter group could be further subdivided into cells with a punctate cytoplasmic pattern (31.9%) and those with a uniform distribution within the cytoplasmic area (16.8%).
To summarize the main points of the immunocytochemical analysis, cells expressing α1A subunits with CAG expansions exhibit significantly greater α1A IR in the immediate vicinity of their surface membrane, as well as a heightened tendency to display IR within the depths of the cytoplasm.
Comparisons between RNA levels
To assess whether the increases in protein immunofluorescence observed in the EXP constructs were attributable to increased RNA stability relative to WT, we examined the levels of total α1A RNA by Northern blot analysis (Fig.3). Transcripts for GAPDH, a housekeeping gene, were used as a basis for comparison. The ratio of α1A/GAPDH showed no significant difference between WT and EXP constructs, ruling out the possibility that observed increases in EXP protein expression and current density might have arisen from differences in RNA stability, as found, for example, in splice variants of α1B subunits (Schorge et al., 1999). This experiment also ruled out possible concerns about differences in cDNA expression between WT and expanded constructs.
Fig. 3.

A, Northern blot analysis of cells expressing α1A with 11, 23, and 72 expansions.B, Quantification of RNA levels 24–48 after transfection shows similar amounts among constructs. Values were normalized to endogenous GAPDH.
Importance of electrophysiological tests: increased current density in cells expressing expanded α1A channels
Just because the surface density of α1Aprotein is augmented does not necessary imply that electrophysiologically measurable current density should also increase. In a recent paper on L-type channels, Flucher and colleagues reported that coexpression of β subunits helped target α1C subunits to the plasma membrane of tsA201 cells, greatly augmenting their surface abundance, but did not actually increase the number of functional channels (Gerster et al., 1999). The authors hypothesized that an unknown cellular factor may act to limit the expression of functional channels. With this precedent in mind, we considered it to be particularly important to assay currents supported by α1A in direct electrophysiological recordings. Accordingly, the electrophysiological behavior of α1A subunits containing EXP numbers of CAG repeats (23, 27, and 72) was compared with that of WT subunits (4 and 11 CAGs) using standard recording whole-cell patch-clamp conditions, with Ba2+ as the charge carrier.
All EXP and WT α1A subunits yielded functional ion channels that supported inward Ca2+channel current during membrane depolarization (Fig.4). Ca2+channel currents were evoked by depolarizations from a holding potential (Vh) of −90 mV to test potentials ranging from −40 to +50 mV. In each case, inward currents first became detectable with depolarization to −35 mV and reached their peak amplitude at 0 and +5 mV for EXP and WT channels, respectively.
Fig. 4.

Electrophysiological analysis of the expression of the α1A calcium channel with normal and expanded number of CAG repeats. B, Ba2+ currents evoked by 100 msec depolarizing pulses from a holding potential (Vh) of −90 mV to test potentials (Vtest) of −40 to +50 mV with 5 mV steps. Top row, Currents originated from α1A channels with normal number of repeats (WT): CAG4 and CAG11. Bottom row, Currents from cells expressing mutant channel repeats (EXP): CAG23, CAG27, and CAG72. The current–voltage relationship (I–V curve) for all five samples is shown in the top row. The symbols used for each construct throughout this study are depicted above each currenttrace.
A striking finding emerged when we compared the current densities generated by WT and EXP channel constructs (Figs. 4,5). Current density in individual HEK293 cells was determined as the current amplitude atVm of +5 mV (the voltage at which inward current of WT constructs was maximal), normalized by cell capacitance. The mean peak currents were 28.3 ± 2 pA/pF for CAG23, 27.9 ± 1.9 pA/pF for CAG27, and 24.7 ± 2.3 pA/pF for CAG72, significantly greater than 12.8 ± 0.7 and 9.8 ± 0.7 pA/pF for CAG4 and CAG11, respectively (p < 0.05 for comparisons between either WT and any of the EXP constructs) (Fig. 5A). Additional analysis was performed to avoid assumptions about the distributions of current densities, which deviate from a Gaussian shape as seen in cumulative distribution plots (Fig.5B). Median values of current density were 7.5 and 10.9 pA/pF for CAG4 and CAG11and 22, 25.6, and 28.6 pA/pF for CAG23, CAG27, and CAG72, respectively. The distributions for the WT constructs were clearly separated from those of their EXP counterparts (varying betweenp < 0.01 and p < 0.05 by the nonparametric Kolmogorov–Smirnov test). Interestingly, comparisons between the two WT constructs or among the group of expanded alleles showed no significant differences within either group, as if the main increase in current density took place in a stepwise manner for CAG repeats longer than a critical threshold.
Fig. 5.

Current density is increased in α1Achannels with expanded glutamine tracts. A, Comparison of peak current densities in α1A with normal (CAG4 and CAG11) or expanded (CAG23, CAG27, and CAG72) repeats. B, Cumulative distribution of current densities found in cells expressing normal CAG4 and CAG11 α1A (dotted lines) and expanded α1A (continuous lines).
The enhancement of P/Q-type Ca2+ channel current in cells expressing α1A subunits with polyQ expansions was in good agreement with the increase in surface membrane immunoreactivity for α1A, a measure of protein expression.
To delineate the voltage dependence of activation more precisely, we performed an analysis of tail currents (Fig.6, rightmost curves). Cells were held at Vh of −90 mV, depolarized for 50 msec to various test potentials, and then repolarized to −80 mV to evoke inward current tails. The dependence of inward tail current amplitude on Vtestwas well fit by a single Boltzmann function, characterized by a midpoint voltage (V1/2) and slope parameter (k) (Table 1). There were no significant differences in the values for k among the various channel constructs. The midpoint values for the variants with 23 and 72 CAG repeats were −10.8 ± 1.2 and −11.9 ± 1.3 mV, significantly more negative than theV1/2 values for the CAG4 and CAG11 controls of −2.9 ± 1.7 and −4.7 ± 0.7 mV (p < 0.05). However, the midpoint for CAG27, −4.1 ± 1.9, was not significantly different.
Fig. 6.

Voltage dependence of inactivation and activation. Inactivation curves (descending curves) show no difference between normal and mutant clones, whereas the activation parameters (ascending curves) of the expanded constructs CAG23, CAG27, and CAG72 show a slight shift to hyperpolarized potentials compared with controls, CAG4 and CAG11. Three representative traces of inactivation (left) and activation (right) experiments are shown at thetop. Prepulse voltages (Vpre) are indicated in each case, and voltage protocols are represented above (Vtest).
Table 1.
Activation and inactivation parameters of α1A
| Activation | Inactivation | ||||||
|---|---|---|---|---|---|---|---|
| V1/2 | k | n | V1/2 | k | Baseline | n | |
| CAG4 | −2.9 ± 1.7 | 9.4 ± 1.4 | 6 | −52.6 ± 2.3 | 17.8 ± 2.0 | 0.09 ± 0.02 | 5 |
| CAG11 | −4.7 ± 0.7 | 5.5 ± 0.5 | 6 | −46.1 ± 2.7 | 20.1 ± 1.6 | 0.11 ± 0.01 | 7 |
| CAG23 | −10.8 ± 1.2* | 4.1 ± 0.4* | 11 | −45.1 ± 10.7 | 19.8 ± 3.4 | 0.13 ± 0.02 | 9 |
| CAG27 | −4.1 ± 1.9 | 3.5 ± 0.4 | 4 | −52.8 ± 3.5 | 18.4 ± 1.9 | 0.10 ± 0.02 | 5 |
| CAG72 | −11.9 ± 1.3* | 4.7 ± 0.9* | 5 | −44.6 ± 2.8 | 18.2 ± 1.1 | 0.14 ± 0.02* | 5 |
p < 0.05; statistically significant.
The voltage dependence of inactivation was determined by stepping the membrane potential for 1 sec to various prepulse voltage levels (Vpre), before depolarization to a fixed test level (+20 mV) to evoke channel opening. The resulting data for peak current were well described by a fixed pedestal (m) surmounted by a Boltzmann function dependent onVpre (see Materials and Methods). None of the midpoint voltages or slope or pedestal parameters displayed significantly different values for any of the WT or EXP α1A constructs (Table 1).
Additional comparisons were made between the various constructs with regard to time constants of activation and inactivation, voltage-dependent characteristics that tightly regulate Ca2+ influx and ultimately influence cytosolic Ca2+ levels. Figure7 shows data for the time constant of activation (τon; A) and the fraction of peak current that had not inactivated after a 400 msec pulse (IPlateau/IPeak;C). We also examined kinetic features that dictate how the channel behaves during intense bursts of activity, measured as the time course of decline of peak current amplitude during a train of repetitive pulses (Fig. 7B) and the time course of recovery from inactivation, studied with a double-pulse protocol (Fig.7D). There were no significant differences detected between channels with normal and expanded CAG tracts, with one minor exception (the fraction of current present at the end of pulses to voltages of 0 and +10 mV for CAG72) (Fig. 7C,triangles). The overall conclusion of this analysis was that our WT and EXP constructs appeared quite similar with respect to their voltage- and time-dependent properties.
Fig. 7.

Kinetic properties are similar in normal and mutant constructs. A, Time constant of activation (τon) from Vh of −90 mV to Vtest from −10 to +50 mV.Inset, Examples of current traces and their superimposed fits. B, Current decay during 0.5 Hz pulse trains fromVh of −90 mV toVtest of +10 mV. Inset, Example of current traces. C, Current inactivation expressed as the ratio of the maximum current,IPeak, divided by the current measured at the end of the pulse, IPlateau.Inset, Exemplar of typical current traces.D, Peak current (IPeak) recovery from inactivation after a conditioning prepulse (Vpre).IPeak was measured during test pulses (Vtest) applied at different times after the Vpre. Inset, Representative current traces. Pp, Prepulse; Tp, test pulse.
DISCUSSION
After the discovery that SCA6 arises from polyQ expansions in the α1A subunit, the prevailing conjecture was that P/Q-type Ca2+ channel current would be decreased (Klockgether and Evert, 1998; Yvert and Mandel, 1999), just as reported for other disorders of α1A (Dove et al., 1998; Kraus et al., 1998; Lorenzon et al., 1998; Wakamori et al., 1998; Hans et al., 1999). To the contrary, we found that expression of polyQ-containing α1A generated Ca2+ channel currents approximately double those arising from normal subunits. This was true for expansions clinically observed in SCA6 (23 or 27 CAG repeats) or an exaggerated expansion (72 repeats). The elevated current density could primarily be accounted for by increased expression of α1A at the cell surface, detected by immunocytochemistry with FLAG-tagged subunits. In both immunocytochemistry and electrophysiology, cellular properties changed once the glutamine expansion exceeded the threshold for SCA6 pathology, as expected for a relevant pathophysiological mechanism. Increased surface expression of α1A and enhanced P/Q-type current would support a toxic gain of function, consistent with the dominant pattern of SCA6 inheritance (Zhuchenko et al., 1997; Ishikawa et al., 1999b,c; Zoghbi and Orr, 2000).
Comparison with other studies
Our data on levels of channel expression matched up well with immunocytochemical data from Ishikawa et al. (1999b,c), who found abundant expression and cytoplasmic aggregation of the human α1A protein, in both SCA6 cerebella and HEK293 cells. However, our results are at odds with two recent electrophysiological studies (Matsuyama et al., 1999; Toru et al., 2000), which did not report changes in channel expression or accumulation as expected from the data from human brain. Our observations on the voltage-dependent gating properties of WT and EXP subunits agreed with Restituito et al. (2000a), who also found small changes in the voltage dependence of activation that would favor increased Ca2+ entry at depolarized potentials but no significant changes in inactivation. Once again, however, there was a discrepancy with Matsuyama et al. (1999) and Toru et al. (2000), who found a hyperpolarizing shift in the inactivation curve that would reduce Ca2+ channel function, not increase it. Their approximately −8 mV shift was large enough to have been detected in our voltage-clamp experiments.
Various explanations for the discrepancies with previous papers may be considered: the choice of animal species of α1A[predominantly rabbit by Matsuyama et al. (1999) vs human in our work] or the use of relatively high concentrations of DNA in our transfections (possibly revealing limitations in turnover of glutamine-expanded channel protein that would be harder to detect at lower DNA concentrations). Yet another possibility, one we find most compelling, is that the discrepancies arise from use of different structural variants of α1A. This principal subunit undergoes a high degree of alternative splicing: in addition to the GGCAG insertion that allows polyQ expansions to be expressed, ∼16 possible transcripts for the C terminus of the α1A subunit have been described thus far, nine of which have been isolated from brain and spinal cord (Ophoff et al., 1996; Zhuchenko et al., 1997; Bourinet et al., 1999; Hans et al., 1999;Krovetz et al., 2000). The isoforms used for testing effects of polyglutamine expansions have differed at a locus of alternative splicing in the I–II loop [possibilities ranging from incorporation of V421G422 to exclusion of both amino acids (Bourinet et al., 1999)] and at a site of variation near the “EF-hand” region within the C-terminal cytoplasmic tail (10 amino acid substitutions, leading to variants α1A-a and α1A-b). We studied a human α1A isoform without V421, with an α1A-a tail sequence. In each respect, this α1A was analogous to the rabbit–human chimera used by Restituito et al. (2000a). On the other hand, Matsuyama et al. (1999) tested a rabbit α1A subunit, the classic BI-1 isoform, containing an α1A-b-type sequence, not α1A-a. Likewise, Toru et al. (2000) studied a human α1A with an α1A-b-type sequence in the C terminus, and furthermore, their I–II linker lacked G422, not just V421. Thus, the pattern of molecular variations in α1A constructs provides a tentative rationale for the experimental discrepancies.
Relationship between cellular effects and pathophysiology of SCA6
If present in brain, an increase in Ca2+ entry supported by EXP α1A channels would represent a gain of function, consistent with the dominant nature of SCA6 in afflicted individuals. The specific pathogenic mechanism in humans remains to be determined. Changes in Ca2+ entry could alter intracellular Ca2+ levels, contributing in the long-term to neuronal necrosis or apoptosis (Choi, 1995; Mattson, 2000; Sapolsky, 2001). Because the P/Q-type current dwarfs other pathways for voltage-gated Ca2+ entry in cerebellar Purkinje cells (Regan et al., 1991; Mintz et al., 1992; Jun et al., 1999), it makes sense that Purkinje neurons should be particularly strongly affected (Ishikawa et al., 1999b,c; Yang et al., 2000). The question of why increasingly long polyQ expansions are generally associated with decreased age of disease onset remains open, because we did not find a correlation between current density and polyQ repeat length beyond the disease threshold. The lack of correlation could be attributable to limitations of HEK293 cells as an expression system, insofar as they may lack hypothetical neuronal factors directly affected by repeat size. Also, our studies were performed over a span of days, whereas the influence of polyQ repeat number on disease onset is manifested over decades. Another possibility is that the age of onset may be influenced by a second pathogenic effect in parallel with the channelopathy (Kato et al., 2000), such as the “polyglutaminopathy” proposed for other disorders. For example, in SCA2, polyQ-expanded isoforms of the mutant protein ataxin-2 accumulate in the cytoplasm of affected neurons (Huynh et al., 1999). Here it is noteworthy that polyQ-expanded α1A protein also tended to accumulate in the cytoplasm (Fig. 2), consistent with immunohistochemical studies of cerebellar sections from SCA6 patients (Ishikawa et al., 1999b,c).
Possible cellular mechanisms
Why do polyQ expansions lead to increased levels of functional channel protein at the surface membrane? The Northern blot analysis ruled out changes in stability of α1Atranscripts. Thus, to explain the accumulation of mutant channels in the plasmalemma, one must turn to the possibility of alterations in protein turnover. Such a mechanism has been invoked to explain the nuclear aggregation of mutant proteins in other polyQ expansion disorders, such as Huntington's disease and spinal and bulbar cerebellar atrophy, and SCA1, SCA3, and SCA7. In SCA1, nuclear aggregation of the polyQ-expanded protein ataxin-1 has been traced to an increased resistance to protein degradation, attributable to the presence of the polyQ domain (Cummings et al., 1999). From this perspective, our observations of increased levels of mutant α1A protein at the membrane and in the cytoplasm would fit into a general pattern of altered protein turnover and cellular localization.
The role of the C terminus in targeting Ca2+ channels to the plasma membrane is most firmly established for α1C (Gao et al., 2000). In the case of α1A, precedent already exists for increased levels of membrane protein and current density in response to minor changes in amino acid sequence, specifically point mutations within domain IV (Hans et al., 1999). polyQ expansions in the C-terminal tail of α1A would be strategically positioned to influence subunit interactions, with itself (Restituito et al., 2000b), with other channel subunits (Hering et al., 2000), and with cytoplasmic signaling proteins, such as G-proteins (Qin et al., 1997; Furukawa et al., 1998a,b; Simen and Miller, 1998, 2000) and calmodulin (de Leon et al., 1995; Lee et al., 1999; Peterson et al., 2000; Pitt et al., 2001). For example, changes in the C-terminus region of α1A may lead to abnormal interactions with β subunits, based on the finding that this region interacts with β4 and β2 (Walker et al., 1998). Altered interactions between the α1 and β subunits could result in changes in membrane trafficking, which can result in higher cell surface expression and current density (Chien et al., 1995;Perez-Garcia et al., 1995; Josephson and Varadi, 1996; Kamp et al., 1996; Gao et al., 1999, 2000; Bichet et al., 2000), as well as changes in biophysical (Neely et al., 1993; Gerster et al., 1999), pharmacological (Perez-Reyes et al., 1992; Castellano et al., 1993;Nishimura et al., 1993; Mitterdorfer et al., 1994; Chien et al., 1995), and modulatory properties.
Our study focused on expression of α1A against a constant background of ancillary subunits. Now that the focus is on increased levels of α1 expression and P/Q current density, additional studies may address the question of how the effect of polyQ expansions is modified by systematic variations in other subunits, including β (Restituito et al., 2000b), α2δ, and γ. It would be particularly interesting to find out whether expression levels of other subunits are affected by polyQ expansions in α1A.
Footnotes
This work was supported by the American Heart Association-Western States Affiliates and the Stanford University McCormick Foundation (E.P.R.), National Institutes of Health Grant NS27699 and the Howard Hughes Medical Institute (H.Z.), The Clayton Foundation for Research and the National Institutes of Health (C.C.L.), and National Institutes of Health Grant NS24067 and the Matthews Charitable Trust (R.W.T.). K.W. is a postdoctoral research associate with Howard Hughes Medical Institute. We thank Drs. J. B. Bergsman, E. T. Kavalali, P. G. Mermelstein, G. Pitt, and N. Yang for their helpful suggestions.
Correspondence should be addressed to Richard W. Tsien, B-105 Beckman Center, Stanford University Medical Center, 300 Pasteur Drive, Stanford, CA 94395-5426. E-mail: rwtsien@leland.stanford.edu.
REFERENCES
- 1.Bichet D, Cornet V, Geib S, Carlier E, Volsen S, Hoshi T, Mori Y, De Waard M. The I-II loop of the Ca2+ channel alpha1 subunit contains an endoplasmic reticulum retention signal antagonized by the beta subunit. Neuron. 2000;25:177–190. doi: 10.1016/s0896-6273(00)80881-8. [DOI] [PubMed] [Google Scholar]
- 2.Bourinet E, Soong TW, Sutton K, Slaymaker S, Mathews E, Monteil A, Zamponi GW, Nargeot J, Snutch TP. Splicing of alpha 1A subunit gene generates phenotypic variants of P- and Q-type calcium channels. Nat Neurosci. 1999;2:407–415. doi: 10.1038/8070. [DOI] [PubMed] [Google Scholar]
- 3.Castellano A, Wei X, Birnbaumer L, Perez-Reyes E. Cloning and expression of a neuronal calcium channel beta subunit. J Biol Chem. 1993;268:12359–12366. [PubMed] [Google Scholar]
- 4.Chien AJ, Zhao X, Shirokov RE, Puri TS, Chang CF, Sun D, Rios E, Hosey MM. Roles of a membrane-localized beta subunit in the formation and targeting of functional L-type Ca2+ channels. J Biol Chem. 1995;270:30036–30044. doi: 10.1074/jbc.270.50.30036. [DOI] [PubMed] [Google Scholar]
- 5.Choi DW. Calcium: still center-stage in hypoxic-ischemic neuronal death. Trends Neurosci. 1995;18:58–60. [PubMed] [Google Scholar]
- 6.Cummings CJ, Reinstein E, Sun Y, Antalffy B, Jiang Y, Ciechanover A, Orr HT, Beaudet AL, Zoghbi HY. Mutation of the E6-AP ubiquitin ligase reduces nuclear inclusion frequency while accelerating polyglutamine-induced pathology in SCA1 mice. Neuron. 1999;24:879–892. doi: 10.1016/s0896-6273(00)81035-1. [DOI] [PubMed] [Google Scholar]
- 7.de Leon M, Wang Y, Jones L, Perez-Reyes E, Wei X, Soong TW, Snutch TP, Yue DT. Essential Ca2+-binding motif for Ca2+-sensitive inactivation of L-type Ca2+ channels. Science. 1995;270:1502–1506. doi: 10.1126/science.270.5241.1502. [DOI] [PubMed] [Google Scholar]
- 8.Dove LS, Abbott LC, Griffith WH. Whole-cell and single-channel analysis of P-type calcium currents in cerebellar Purkinje cells of leaner mutant mice. J Neurosci. 1998;18:7687–7699. doi: 10.1523/JNEUROSCI.18-19-07687.1998. [DOI] [PMC free article] [PubMed] [Google Scholar]
- 9.Furukawa T, Nukada T, Mori Y, Wakamori M, Fujita Y, Ishida H, Fukuda K, Kato S, Yoshii M. Differential interactions of the C terminus and the cytoplasmic I-II loop of neuronal Ca2+ channels with G-protein alpha and beta gamma subunits. I. Molecular determination. J Biol Chem. 1998a;273:17585–17594. doi: 10.1074/jbc.273.28.17585. [DOI] [PubMed] [Google Scholar]
- 10.Furukawa T, Miura R, Mori Y, Strobeck M, Suzuki K, Ogihara Y, Asano T, Morishita R, Hashii M, Higashida H, Yoshii M, Nukada T. Differential interactions of the C terminus and the cytoplasmic I-II loop of neuronal Ca2+ channels with G-protein alpha and beta gamma subunits. II. Evidence for direct binding. J Biol Chem. 1998b;273:17595–17603. doi: 10.1074/jbc.273.28.17595. [DOI] [PubMed] [Google Scholar]
- 11.Gao T, Chien AJ, Hosey MM. Complexes of the alpha1C and beta subunits generate the necessary signal for membrane targeting of class C L-type calcium channels. J Biol Chem. 1999;274:2137–2144. doi: 10.1074/jbc.274.4.2137. [DOI] [PubMed] [Google Scholar]
- 12.Gao T, Bunemann M, Gerhardstein BL, Ma H, Hosey MM. Role of the C terminus of the alpha 1C (CaV1.2) subunit in membrane targeting of cardiac L-type calcium channels. J Biol Chem. 2000;275:25436–25444. doi: 10.1074/jbc.M003465200. [DOI] [PubMed] [Google Scholar]
- 13.Gerster U, Neuhuber B, Groschner K, Striessnig J, Flucher BE. Current modulation and membrane targeting of the calcium channelalpha1C subunit are independent functions of the beta subunit. J Physiol (Lond) 1999;517:353–368. doi: 10.1111/j.1469-7793.1999.0353t.x. [DOI] [PMC free article] [PubMed] [Google Scholar]
- 14.Gillard SE, Volsen SG, Smith W, Beattie RE, Bleakman D, Lodge D. Identification of pore-forming subunit of P-type calcium channels: an antisense study on rat cerebellar Purkinje cells in culture. Neuropharmacology. 1997;36:405–409. doi: 10.1016/s0028-3908(97)00046-4. [DOI] [PubMed] [Google Scholar]
- 15.Hans M, Luvisetto S, Williams ME, Spagnolo M, Urrutia A, Tottene A, Brust PF, Johnson EC, Harpold MM, Stauderman KA, Pietrobon D. Functional consequences of mutations in the human alpha1A calcium channel subunit linked to familial hemiplegic migraine. J Neurosci. 1999;19:1610–1619. doi: 10.1523/JNEUROSCI.19-05-01610.1999. [DOI] [PMC free article] [PubMed] [Google Scholar]
- 16.Hering S, Berjukow S, Sokolov S, Marksteiner R, Weiss RG, Kraus R, Timin EN. Molecular determinants of inactivation in voltage-gated Ca2+ channels. J Physiol (Lond) 2000;528:237–249. doi: 10.1111/j.1469-7793.2000.t01-1-00237.x. [DOI] [PMC free article] [PubMed] [Google Scholar]
- 17.Huynh DP, Del Bigio MR, Ho DH, Pulst SM. Expression of ataxin-2 in brains from normal individuals and patients with Alzheimer's disease and spinocerebellar ataxia 2. Ann Neurology. 1999;45:232–241. doi: 10.1002/1531-8249(199902)45:2<232::aid-ana14>3.0.co;2-7. [DOI] [PubMed] [Google Scholar]
- 18.Ishikawa K, Fujigasaki H, Saegusa H, Ohkoshi N, Shoji S, Tanabe T, Misuzawa H. Expression analysis of alpha 1A voltage-dependent calcium channel in spinocerebellar ataxia (SCA6). Abstract for Second International Conference on Unstable Microsatellites and Human Disease. University of North Carolina, Chapel Hill, NC, April; 1999a. [Google Scholar]
- 19.Ishikawa K, Fujigasaki H, Saegusa H, Ohwada K, Fujita T, Iwamoto H, Komatsuzaki Y, Toru S, Toriyama H, Watanabe M, Ohkoshi N, Shoji S, Kanazawa I, Tanabe T, Mizusawa H. Abundant expression and cytoplasmic aggregations of α1A voltage-dependent calcium channel protein associated with neurodegeneration in spinocerebellar ataxia type 6. Hum Mol Genet. 1999b;8:1185–1193. doi: 10.1093/hmg/8.7.1185. [DOI] [PubMed] [Google Scholar]
- 20.Ishikawa K, Watanabe M, Yoshizawa K, Fujita T, Iwamoto H, Yoshizawa T, Harada K, Nakamagoe K, Komatsuzaki Y, Satoh A, Doi M, Ogata T, Kanazawa I, Shoji S, Mizusawa H. Clinical, neuropathological, and molecular study in two families with spinocerebellar ataxia type 6 (SCA6). J Neurol Neurosurg Psychiatry. 1999c;67:86–89. doi: 10.1136/jnnp.67.1.86. [DOI] [PMC free article] [PubMed] [Google Scholar]
- 21.Josephson IR, Varadi G. The beta subunit increases Ca2+ currents and gating charge movements of human cardiac L-type Ca2+ channels. Biophys J. 1996;70:1285–1293. doi: 10.1016/S0006-3495(96)79685-6. [DOI] [PMC free article] [PubMed] [Google Scholar]
- 22.Jun K, Piedras-Renteria ES, Smith SM, Wheeler DB, Lee SB, Lee TG, Chin H, Adams ME, Scheller RH, Tsien RW, Shin HS. Ablation of P/Q-type Ca2+ channel currents, altered synaptic transmission, and progressive ataxia in mice lacking the alpha(1A)-subunit. Proc Natl Acad Sci USA. 1999;96:15245–15250. doi: 10.1073/pnas.96.26.15245. [DOI] [PMC free article] [PubMed] [Google Scholar]
- 23.Kamp TJ, Perez-Garcia MT, Marban E. Enhancement of ionic current and charge movement by coexpression of calcium channel beta 1A subunit with alpha 1C subunit in a human embryonic kidney cell line. J Physiol (Lond) 1996;492:89–96. doi: 10.1113/jphysiol.1996.sp021291. [DOI] [PMC free article] [PubMed] [Google Scholar]
- 24.Kato T, Tanaka F, Yamamoto M, Yosida E, Indo T, Watanabe H, Yoshiwara T, Doyu M, Sobue G. Sisters homozygous for the spinocerebellar ataxia type 6 (SCA6)/CACNA1A gene associated with different clinical phenotypes. Clin Genet. 2000;58:69–73. doi: 10.1034/j.1399-0004.2000.580112.x. [DOI] [PubMed] [Google Scholar]
- 25.Klockgether T, Evert B. Genes involved in hereditary ataxias. Trends Neurosci. 1998;21:413–418. doi: 10.1016/s0166-2236(98)01315-0. [DOI] [PubMed] [Google Scholar]
- 26.Kraus RL, J SM, Glossmann H, Hering S, Striessnig J. Familial hemiplegic migraine mutations change alpha1A Ca2+ channel kinetics. J Biol Chem. 1998;273:5586–5590. doi: 10.1074/jbc.273.10.5586. [DOI] [PubMed] [Google Scholar]
- 27.Krovetz HS, Helton TD, Crews AL, Horne WA. C-Terminal alternative splicing changes the gating properties of a human spinal cord calcium channel alpha 1A subunit. J Neurosci. 2000;20:7564–7570. doi: 10.1523/JNEUROSCI.20-20-07564.2000. [DOI] [PMC free article] [PubMed] [Google Scholar]
- 28.Lee A, Wong ST, Gallagher D, Li B, Storm DR, Scheuer T, Catterall WA. Ca2+/calmodulin binds to and modulates P/Q-type calcium channels. Nature. 1999;399:155–159. doi: 10.1038/20194. [DOI] [PubMed] [Google Scholar]
- 29.Lorenzon NM, Lutz CM, Frankel WN, Beam KG. Altered calcium channel currents in Purkinje cells of the neurological mutant mouse leaner. J Neurosci. 1998;18:4482–4489. doi: 10.1523/JNEUROSCI.18-12-04482.1998. [DOI] [PMC free article] [PubMed] [Google Scholar]
- 30. Matsuyama Z, Wakamori M, Mori Y, Kawakami H, Nakamura S, Imoto K. Direct alteration of the P/Q-type Ca2+ channel property by polyglutamine expansion in spinocerebellar ataxia 6. J Neurosci 19 1999. RC14(1–5). [DOI] [PMC free article] [PubMed] [Google Scholar]
- 31.Mattson MP. Apoptosis in neurodegenerative disorders. Nat Rev Mol Cell Biol. 2000;1:120–129. doi: 10.1038/35040009. [DOI] [PubMed] [Google Scholar]
- 32.Mintz IM, Adams ME, Bean BP. P-type calcium channels in rat central and peripheral neurons. Neuron. 1992;9:85–95. doi: 10.1016/0896-6273(92)90223-z. [DOI] [PubMed] [Google Scholar]
- 33.Mitterdorfer J, Froschmayr M, Grabner M, Striessnig J, Glossmann H. Calcium channels: the beta-subunit increases the affinity of dihydropyridine and Ca2+ binding sites of the alpha 1-subunit. FEBS Lett. 1994;352:141–145. doi: 10.1016/0014-5793(94)00938-4. [DOI] [PubMed] [Google Scholar]
- 34.Neely A, Wei X, Olcese R, Birnbaumer L, Stefani E. Potentiation by the beta subunit of the ratio of the ionic current to the charge movement in the cardiac calcium channel. Science. 1993;262:575–578. doi: 10.1126/science.8211185. [DOI] [PubMed] [Google Scholar]
- 35.Nishimura S, Takeshima H, Hofmann F, Flockerzi V, Imoto K. Requirement of the calcium channel beta subunit for functional conformation. FEBS Lett. 1993;324:283–286. doi: 10.1016/0014-5793(93)80135-h. [DOI] [PubMed] [Google Scholar]
- 36.Ophoff RA, Terwindt GM, Vergouwe MN, van Eijk R, Oefner PJ, Hoffman SMG, Lamerdin JE, Mohrenweiser HW, Bulman DE, Ferrari M, Haan J, Lindhout D, van Ommen G-JB, Hofker MH, Ferrari MD, Frants RR. Familial hemiplegic migraine and episodic ataxia type-2 are caused by mutations in the Ca2+ channel gene CACNL1A4. Cell. 1996;87:543–552. doi: 10.1016/s0092-8674(00)81373-2. [DOI] [PubMed] [Google Scholar]
- 37.Perez-Reyes E, Castellano A, Kim HS, Bertrand P, Baggstrom E, Lacerda AE, Wei XY, Birnbaumer L. Cloning and expression of a cardiac/brain beta subunit of the L-type calcium channel. J Biol Chem. 1992;267:1792–1797. [PubMed] [Google Scholar]
- 38.Perez-Garcia MT, Kamp TJ, Marban E. Functional properties of cardiac L-type calcium channels transiently expressed in HEK293 cells. Roles of alpha 1 and beta subunits. J Gen Physiol. 1995;105:289–305. doi: 10.1085/jgp.105.2.289. [DOI] [PMC free article] [PubMed] [Google Scholar]
- 39.Peterson BZ, Lee JS, Mulle JG, Wang Y, de Leon M, Yue DT. Critical determinants of Ca2+-dependent inactivation within an EF-hand motif of L-type Ca2+ channels. Biophys J. 2000;78:1906–1920. doi: 10.1016/S0006-3495(00)76739-7. [DOI] [PMC free article] [PubMed] [Google Scholar]
- 40.Piedras-Renteria ES, Tsien RW. Antisense oligonucleotides against alpha1E reduce R-type calcium currents in cerebellar granule cells. Proc Natl Acad Sci USA. 1998;95:7760–7765. doi: 10.1073/pnas.95.13.7760. [DOI] [PMC free article] [PubMed] [Google Scholar]
- 41.Pitt GS, Zuhlke RD, Hudmon A, Schulman H, Reuter H, Tsien RW. Molecular basis of calmodulin tethering and Ca2+-dependent inactivation of L-type Ca2+ channels. J Biol Chem. 2001;276:30794–30802. doi: 10.1074/jbc.M104959200. [DOI] [PubMed] [Google Scholar]
- 42.Qin N, Platano D, Olcese R, Stefani E, Birnbaumer L. Direct interaction of gbetagamma with a C-terminal betagamma-binding domain of the Ca2+ channel alpha1 subunit is responsible for channel inhibition by G protein-coupled receptors. Proc Natl Acad Sci USA. 1997;94:8866–8871. doi: 10.1073/pnas.94.16.8866. [DOI] [PMC free article] [PubMed] [Google Scholar]
- 43.Regan LJ, Sah DW, Bean BP. Ca2+ channels in rat central and peripheral neurons: high-threshold current resistant to dihydropyridine blockers and omega-conotoxin. Neuron. 1991;6:269–280. doi: 10.1016/0896-6273(91)90362-4. [DOI] [PubMed] [Google Scholar]
- 44.Restituito S, Thompson RM, Eliet J, Raike RS, Riedl M, Charnet P, Gomez CM. The polyglutamine expansion in spinocerebellar ataxia type 6 causes a beta subunit-specific enhanced activation of P/Q-type calcium channels in Xenopus oocytes. J Neurosci. 2000a;20:6394–6403. doi: 10.1523/JNEUROSCI.20-17-06394.2000. [DOI] [PMC free article] [PubMed] [Google Scholar]
- 45.Restituito S, Cens T, Barrere C, Geib S, Galas S, De Waard M, Charnet P. The β2a subunit is a molecular groom for the Ca2+ channel inactivation gate. J Neurosci. 2000b;20:9046–9052. doi: 10.1523/JNEUROSCI.20-24-09046.2000. [DOI] [PMC free article] [PubMed] [Google Scholar]
- 46.Rock DM, Horne WA, Stoehr SJ, Hashimoto C, Zhou M, Cong R, Palma A, Hidayetoglu D, Offord J. Does α1E code for T-type calcium channels? A comparison of recombinant α1E calcium channels with GH3 pituitary T-type and recombinant α1B calcium channels. In: Tsien RW, Clozel J-P, Nargeot J, editors. Low-voltage-activated T-type calcium channels. Adis International; Chester, UK: 1998. pp. 279–289. [Google Scholar]
- 47.Sapolsky RM. Cellular defenses against excitotoxic insults. J Neurochem. 2001;76:1601–1611. doi: 10.1046/j.1471-4159.2001.00203.x. [DOI] [PubMed] [Google Scholar]
- 48.Schols L, Kruger R, Amoiridis G, Przuntek H, Epplen JT, Riess O. Spinocerebellar ataxia type 6: genotype and phenotype in German kindreds. J Neurol Neurosurg Psychiatry. 1998;64:67–73. doi: 10.1136/jnnp.64.1.67. [DOI] [PMC free article] [PubMed] [Google Scholar]
- 49.Schorge S, Gupta S, Lin Z, McEnery MW, Lipscombe D. Calcium channel activation stabilizes a neuronal calcium channel mRNA. Nat Neurosci. 1999;2:785–790. doi: 10.1038/12153. [DOI] [PubMed] [Google Scholar]
- 50.Simen AA, Miller RJ. Structural features determining differential receptor regulation of neuronal Ca channels. J Neurosci. 1998;18:3689–3698. doi: 10.1523/JNEUROSCI.18-10-03689.1998. [DOI] [PMC free article] [PubMed] [Google Scholar]
- 51.Simen AA, Miller RJ. Involvement of regions in domain I in the opioid receptor sensitivity of alpha1B Ca2+ channels. Mol Pharmacol. 2000;57:1064–1074. [PubMed] [Google Scholar]
- 52.Sisodia SS. Nuclear inclusions in glutamine repeat disorders: are they pernicious, coincidental, or beneficial? Cell. 1998;95:1–4. doi: 10.1016/s0092-8674(00)81743-2. [DOI] [PubMed] [Google Scholar]
- 53.Takiyama Y, Sakoe K, Namekawa M, Soutome M, Esumi E, Ogawa T, Ishikawa K, Mizusawa H, Nakano I, Nishizawa M. A Japanese family with spinocerebellar ataxia type 6 which includes three individuals homozygous for an expanded CAG repeat in the SCA6/CACNL1A4 gene. J Neurol Sci. 1998;158:141–147. doi: 10.1016/s0022-510x(98)00108-7. [DOI] [PubMed] [Google Scholar]
- 54.Toru S, Murakoshi T, Ishikawa K, Saegusa H, Fujigasaki H, Uchihara T, Nagayama S, Osanai M, Mizusawa H, Tanabe T. Spinocerebellar ataxia type 6 mutation alters P-type calcium channel function. J Biol Chem. 2000;275:10893–10898. doi: 10.1074/jbc.275.15.10893. [DOI] [PubMed] [Google Scholar]
- 55.Tran PB, Miller RJ. Aggregates in neurodegenerative disease: crowds and power? Trends Neurosci. 1999;22:194–197. doi: 10.1016/s0166-2236(99)01409-5. [DOI] [PubMed] [Google Scholar]
- 56.Wakamori M, Yamazaki K, Matsunodaira H, Teramoto T, Tanaka I, Niidome T, Sawada K, Nishizawa Y, Sekiguchi N, Mori E, Mori Y, Imoto K. Single tottering mutations responsible for the neuropathic phenotype of the P-type calcium channel. J Biol Chem. 1998;273:34857–34867. doi: 10.1074/jbc.273.52.34857. [DOI] [PubMed] [Google Scholar]
- 57.Walker D, Bichet D, Campbell KP, De Waard M. A beta 4 isoform-specific interaction site in the carboxyl-terminal region of the voltage-dependent Ca2+ channel alpha 1A subunit. J Biol Chem. 1998;273:2361–2367. doi: 10.1074/jbc.273.4.2361. [DOI] [PubMed] [Google Scholar]
- 58.Watanabe H, Tanaka F, Matsumoto M, Doyu M, Ando T, Mitsuma T, Sobue G. Frequency analysis of autosomal dominant cerebellar ataxias in Japanese patients and clinical characterization of spinocerebellar ataxia type 6. Clin Genet. 1998;53:13–19. doi: 10.1034/j.1399-0004.1998.531530104.x. [DOI] [PubMed] [Google Scholar]
- 59.Yabe I, Sasaki H, Matsuura T, Takada A, Wakisaka A, Suzuki Y, Fukazawa T, Hamada T, Oda T, Ohnishi A, Tashiro K. SCA6 mutation analysis in a large cohort of the Japanese patients with late-onset pure cerebellar ataxia. J Neurol Sci. 1998;156:89–95. doi: 10.1016/s0022-510x(98)00009-4. [DOI] [PubMed] [Google Scholar]
- 60.Yang N, Horn R. Evidence for voltage-dependent S4 movement in sodium channels. Neuron. 1995;15:213–218. doi: 10.1016/0896-6273(95)90078-0. [DOI] [PubMed] [Google Scholar]
- 61.Yang Q, Hashizume Y, Yoshida M, Wang Y, Goto Y, Mitsuma N, Ishikawa K, Mizusawa H. Morphological Purkinje cell changes in spinocerebellar ataxia type 6. Acta Neuropathol (Berl) 2000;100:371–376. doi: 10.1007/s004010000201. [DOI] [PubMed] [Google Scholar]
- 62.Yvert G, Mandel JL. Variation on a trinucleotide theme. Nat Med. 1999;5:383–384. doi: 10.1038/7381. [DOI] [PubMed] [Google Scholar]
- 63.Zhuchenko O, Bailey J, Bonnen P, Ashizawa T, Stockton DW, Amos C, Dobyns WB, Subramony SH, Zoghbi HY, Lee CC. Autosomal dominant cerebellar ataxia (SCA6) associated with small polyglutamine expansions in the alpha 1A-voltage-dependent calcium channel. Nat Genet. 1997;15:62–69. doi: 10.1038/ng0197-62. [DOI] [PubMed] [Google Scholar]
- 64.Zoghbi HY. CAG repeats in SCA6. Anticipating new clues. Neurology. 1997;49:1196–1199. doi: 10.1212/wnl.49.5.1196. [DOI] [PubMed] [Google Scholar]
- 65.Zoghbi HY, Orr HT. Glutamine repeats and neurodegeneration. Annu Rev Neurosci. 2000;23:217–247. doi: 10.1146/annurev.neuro.23.1.217. [DOI] [PubMed] [Google Scholar]