 Short hydrogen bonds are ubiquitous in biological macromolecules and exhibit distinctive proton potential energy surfaces and proton sharing properties.
Abstract
The three-dimensional architecture of biomolecules often creates specialized structural elements, notably short hydrogen bonds that have donor–acceptor separations below 2.7 Å. In this work, we statistically analyze 1663 high-resolution biomolecular structures from the Protein Data Bank and demonstrate that short hydrogen bonds are prevalent in proteins, protein–ligand complexes and nucleic acids. From these biological macromolecules, we characterize the preferred location, connectivity and amino acid composition in short hydrogen bonds and hydrogen bond networks, and assess their possible functional importance. Using electronic structure calculations, we further uncover how the interplay of the structural and chemical features determines the proton potential energy surfaces and proton sharing conditions in biological short hydrogen bonds.
1. Introduction
The structure, dynamics and energetics of a hydrogen bond strongly depend on its donor–acceptor distance, R. While typical hydrogen bonds have R between 2.8 and 3.2 Å,1 short hydrogen bonds (SHBs) with R ≤ 2.7 Å occur extensively in organic and inorganic small molecules, both in crystalline phases and in aprotic solvents.2–5 These SHBs have the donor and acceptor atoms reside much closer than the sum of their van der Waals radii, and hence exhibit prominent covalent characters arising from the quantum delocalization of electrons.2,6 As hydrogen is the lightest element, the zero-point energies associated with the O–H or N–H vibrations often act to strengthen the SHBs and promote the sharing and transferring of protons.7–12 As such, properties of SHBs can be significantly altered by electronic and nuclear quantum effects, in stark contrast to the conventional description of hydrogen bonds as classical dipole–dipole interactions. As a manifestation, SHBs have distinctive spectroscopy features such as considerably red-shifted stretching frequencies, highly downfield 1H NMR chemical shifts and prominent isotope effects when H is replaced by deuterium (D).2–4,6,13,14
SHBs have been widely observed in proteins,15–18 possibly because the three-dimensional folds of these biological macromolecules can help position the hydrogen bonded groups in close proximity. In particular, low-barrier hydrogen bonds have R around 2.5 Å and have been associated with diverse biological functions, ranging from accelerating enzymatic reactions to promoting protein structural stability and mediating antibiotic resistance.19–29 For example, recent NMR experiments have revealed that a serine protease from the Dengue type II virus contains a low-barrier hydrogen bond in the active site.29 In the presence of a bound ligand, the enzyme is observed to have a large downfield 1H chemical shift of 19.93 ppm and a weak N–H bond coupling, indicating that the proton is shared in the hydrogen bond formed between its catalytic residues.29 Despite the importance of biological SHBs, their structural features, energetics and the protein environment suitable for their formation are still under debate.30–33 Complications arise from the experimental difficulty to observe the electron density of hydrogen atoms using X-ray diffraction and to directly probe specific protons in a large biomolecule. While neutron diffraction has enabled unambiguous determination of the proton positions in biological SHBs,24,28,34,35 its application to proteins are limited by the small number of high-flux neutron sources globally.36
The Protein Data Bank (PDB), which contains over 153 000 biological macromolecular structures,37,38 offers a unique opportunity to dissect the features of SHBs. For example, previous analysis of the database has provided valuable insight into the geometries and locations of SHBs in proteins and on protein–ligand interfaces.15,16,18,39,40 In this work, we systematically examine the top 1% highest-quality structures in the PDB to unravel the structural and chemical factors that promote the formation of SHBs. For this purpose, we evaluate biomolecules that are refined with resolution better than 1.1 Å from X-ray or neutron diffraction measurements, and reveal that SHBs and their networks are prevalent in proteins, protein–ligand complexes and nucleic acids. Combining statistical analysis and electronic structure calculations, we further uncover their preferred patterns in connectivity and amino acid composition and evaluate the impact of quantum effects on the proton behavior.
2. Computational methods
We conducted a search of the PDB for biomolecular structures that are determined by X-ray or neutron diffraction and have resolution of 1.1 Å or higher. This search yields 1663 structures, which include 103 nucleic acids and 1564 proteins. There are 4 protein–nucleic acid complexes among them, which we treat as both proteins and nucleic acids.
Except for the potential energy surfaces, all the calculations and analyses were performed using the Amber 2016 software package.41 The biomolecules and ligands were modeled using the Amber14SB force field42,43 and the generalized Amber force field,44 respectively. For each structure, we removed the crystallographic waters and added the H atoms using Amber 2016, and optimized the geometry with all the non-hydrogen atoms maintained at their positions in the crystal structures. A hydrogen bond A–H···B is considered to be a SHB if it satisfies all of the following criteria: (1) the donor and acceptor atoms are N or O; (2) 2.3 Å ≤ R ≤ 2.7 Å; (3) the A–H–B angle, θAHB ≥ 135°. When both the A and B atoms are in the backbone of a protein, we determined the corresponding secondary structures using the DSSP45 algorithm as implemented in Amber 2016.41 In protein–ligand complexes, we defined a ligand as a compound that is not an amino acid, nucleotide, water, OH– or metal ion. Ligands must also contain N or O atoms so that they are capable of forming hydrogen bonds.
We used electronic structure methods to obtain the optimized geometries and proton energy surfaces of the SHBs that formed from the side chains of Tyr, Lys, Arg, His, Asp and Glu. If the SHBs were involved in hydrogen bond networks, we further carried out electronic structure calculations in the presence of the networks. All calculations were performed with the non-hydrogen atoms fixed at their positions in the crystal structures, using the TeraChem software package.46,47 The electronic structures were described with the B3LYP density functional,48 the D3 dispersion correction49 and the 6-31+G(d) basis set. To represent a side chain of an amino acid, we included all the side chain atoms and the α-C atom, which was capped with hydrogens to saturate the bonds. In each SHB or hydrogen bond trimer, we computed the potential energy surface by scanning the A–H or D–H bond length and optimizing the position of all the protons at each step. This procedure was taken because the H atoms that were added using Amber 2016 might not be at their optimal positions in the electronic structure calculations. In addition, the protons can have concerted movements when the SHBs or their networks involve the side chains of Lys or Arg, which contain multiple N–H bonds. To assess the performance of the basis set, we repeated the calculations on 101 randomly chosen SHBs using the 6-31+G(d,p) and aug-cc-pVDZ basis sets and found that the equilibrium proton position and the barrier for proton sharing predicted from the three basis sets agreed well with each other, as shown in Fig. S1.† On average, the equilibrium proton position calculated from the 6-31+G(d,p) and aug-cc-pVDZ basis sets differed from that of the 6-31+G(d) basis set by 0.0039 and 0.0046 Å, respectively. Similarly, the average barrier differed from the value obtained from 6-31+G(d) by 0.54 and 0.45 kcal mol–1, respectively. These results verified that the 6-31+G(d) basis set was sufficient to capture the correct proton potential energy surfaces in the SHBs. We carried out all the electronic structure calculations in the gas phase. To validate this approach, we considered 648 single SHBs and repeated the geometry optimization by representing the protein environment as point charges, as described using the Amber14SB force field.42,43 The resulting proton positions were in quantitative agreement with the gas-phase results with an average error of 0.03 Å.
3. Results and discussion
3.1. Validation of the biomolecular structures
In this work, we consider the top 1% highest quality structures from the PDB that have resolution equal to or above 1.1 Å. Before conducting the analysis, we first examine their R-factor and R-free values to validate the 1663 crystal structures. 98.2% of the biomolecules have the R-factor ≤ 0.20 and the difference between the R-free and R-factor ≤ 7%, demonstrating that they are reliable structures.50 The rest of them have slightly larger R-factor between 0.21 and 0.28.
As we define a SHB based on its heavy atom distance, the statistical analysis strongly depends on the accuracy of the atom position and R in the biomolecular structures. In our dataset, all the biomolecules are at atomic resolution51 and the coordinate errors are expected to be around 0.03 Å.40,52,53 To verify this rule on our dataset, we find that 946 structures contain the estimated overall coordinate error calculated by the maximum likelihood method,54 Δx, in their PDB files. In each biomolecule, the Δx value measures the coordinate error of all the non-hydrogen atoms and is expected to give an upper limit to the error in specific SHBs. In the 946 structures, Δx values vary from 0.004 to 0.3 Å with an average of 0.04 Å, confirming the accuracy of the atom positions. The average Δx gives rise to an error of  in the heavy atom distance, R.55 Given that the coordinate error can extend beyond the average value, we find that 94% of the structures have Δx ≤ 0.1 Å, which corresponds to an error up to 0.14 Å in R. Therefore, by focusing on biomolecular structure that are at atomic resolution, we can reliably analyze the SHBs as the errors in atomic position and R are relatively small.
3.2. Short hydrogen bonds in biological macromolecules
After examining 1663 high-quality crystal structures, we have found that 1504 biomolecules contain at least one SHB. These include 1475 proteins and protein–ligand complexes as well as 30 nucleic acids, among which there is 1 protein–nucleic acid complex. We have identified a total of 15 968 SHBs, which gives an average of 11 SHBs in each structure. Moreover, when considering both short and regular hydrogen bonds in the 1663 structures, we find a total of 258 753 cases with 2.3 Å ≤ R ≤ 3.0 Å. This suggests that one can observe 1 SHB in every 16 hydrogen bonds, highlighting the prevalence of these special structural elements in biological macromolecules.
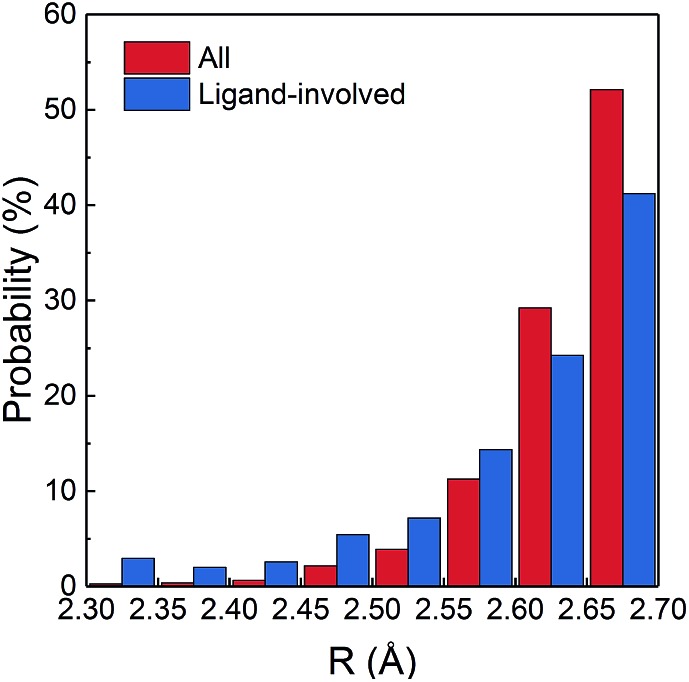
A small amount of 57 SHBs are present in nucleic acids, which form in Watson–Crick base pairs, guanine–uracil wobble base pairs and between the backbone ribose and phosphate groups of adjacent nucleotides. The majority of SHBs are distributed among proteins and protein–ligand complexes, with the number varying from 1 to 215 in each structure. As shown in Fig. 1, 50.6% of these biological SHBs have R between 2.65 and 2.7 Å. However, there are 3314 very short hydrogen bonds with R < 2.6 Å. Considering that the van der Waals radii for the N and O atoms are 1.55 and 1.52 Å, respectively,56 these SHBs are conformationally highly compact with the donor and acceptor groups in much closer proximity than those typically observed in the condensed phase. Chemically, 98.8% of the SHBs have O as the acceptor atom, and O–H···O is the most commonly observed type. This is followed by N–H···O hydrogen bonds, which are more likely to occur when R is shorter than 2.55 Å.
Fig. 1. Percentage distribution of R in all the 15 968 biological SHBs and in 2187 SHBs that involve ligands.
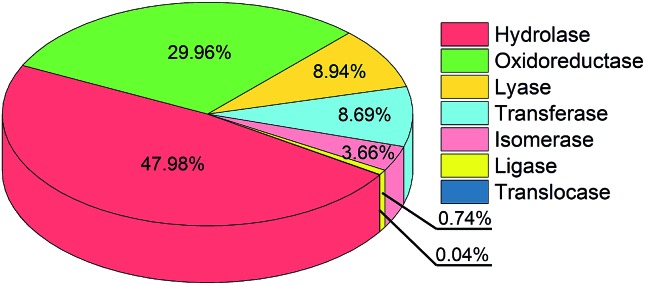
Given the observation that SHBs are extensively distributed in biological systems, they might play a role in enhancing the functions of proteins and nucleic acids. While it is not the main focus of this work, we will use two categories of proteins to demonstrate the possible functional importance of SHBs. In the first category, we have identified 226 SHBs from the analysis of 37 proteins that are crucial for cellular signal transduction. These include Ras the RAF proteins, which are pivotal components in the Ras-RAF-MARK pathway to mediate mammalian gene expression,57–59 and response regulatory proteins for bacterial photo- and chemotaxis.60–62 As an example, the light-sensing chromophore in photoactive yellow protein, a photoreceptor that controls the negative phototaxis of purple sulfur bacteria, forms a network of SHBs with residues Tyr42 and Glu46 with R of 2.49 and 2.58 Å, respectively.24,35,61,62 The SHB network is proposed to stabilize the deprotonated chromophore in the hydrophobic protein interior and maintain the ground receptor state of the protein in its signal transduction pathway.24,63 In the second category, we have found a total of 11 814 SHBs in 900 enzymes. As shown in Fig. 2, SHBs exist in all 7 classes of enzymes,64 which include 484 hydrolases, 208 oxidoreductases, 86 lyases, 59 transferases, 57 isomerases, 5 ligases and 1 translocase. SHBs are most abundant in hydrolases, followed by oxidoreductases, lyases and transferases, in accordance with the fractions of these enzymes in our dataset. On average, we find that each hydrolase and lyase contain 12 SHBs, whereas each oxidoreductase, transferase and ligase contain 17 SHBs. In addition, we find an average of 8 SHBs in each isomerase, and there are 5 SHBs formed in the only translocase structure. For example, as one of the largest groups in hydrolases, serine proteases utilize a highly conserved Asp–His–Ser catalytic triad to facilitate the hydrolytic cleavage of peptide bonds.65–67 From the statistical analysis, we have identified SHBs in serine proteases ranging from trypsin to proteinase K and elastase,68–70 and these SHBs in the catalytic triad have been proposed to aid the initiation of the enzymatic reactions and stabilize the reaction intermediates.20,21,29
Fig. 2. Distribution of 11 814 SHBs in 7 enzyme classes.
From our analysis, 99.6% of the observed SHBs are present in protein and protein–ligand complexes. In the following, we will focus on these systems and characterize SHBs and hydrogen bond networks that form from amino acids, and show how the interplay of their geometric and chemical features determines the proton potential surfaces. We will then identify the types of amino acids and ligands that commonly participate in the formation of SHBs in protein–ligand complexes.
3.3. Structural and chemical features of short hydrogen bonds in proteins
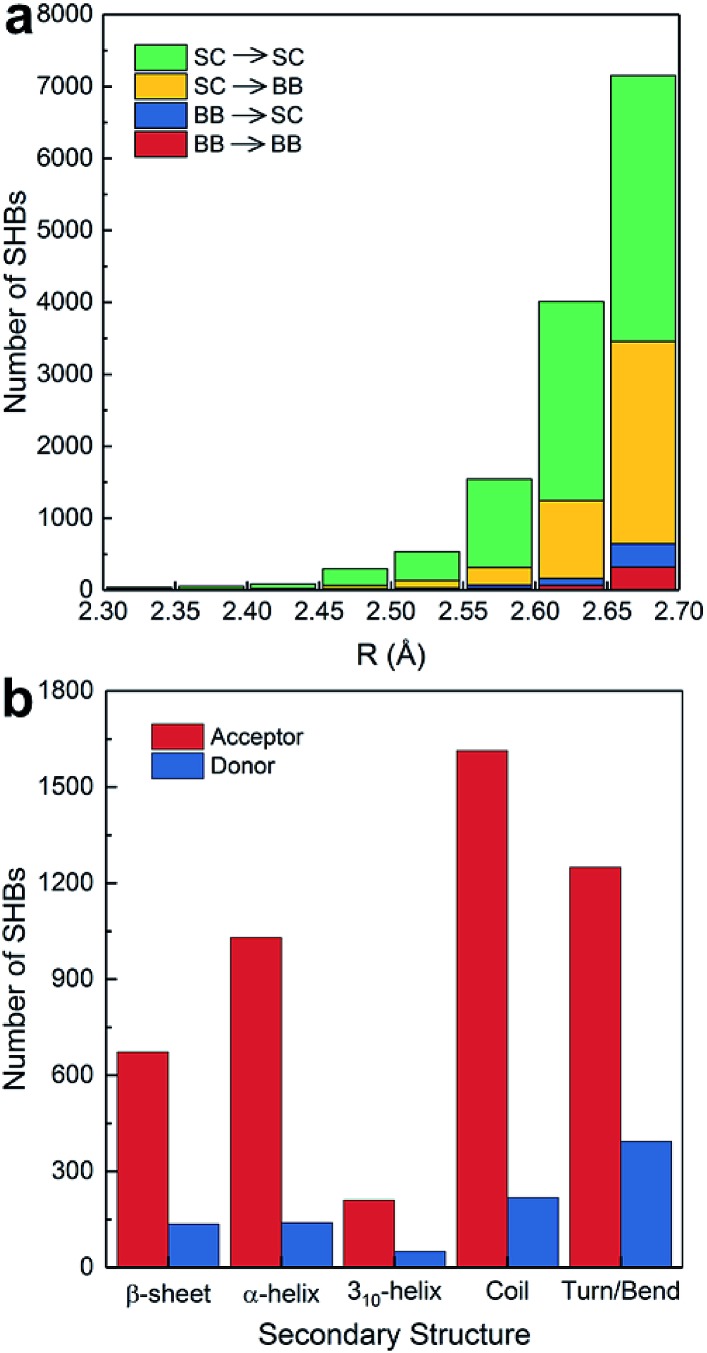
A total of 13 724 SHBs occur between amino acids in proteins. As shown in Fig. 3a, 5281 SHBs are backbone–backbone (BB–BB) and backbone–side chain (BB–SC) hydrogen bonds. 82.2% of these backbone-involving SHBs have the peptide bond C O as acceptors and the side chain O–H or N–H groups as donors, and they are the predominant types across all hydrogen bond lengths. The rest have the main chain N–H groups as donors and the backbone or side chains as acceptors, which are more frequently observed when R is around 2.7 Å.
Fig. 3. Distribution of SHBs in (a) the backbone and side chains of proteins at different hydrogen bond lengths, and (b) in different secondary structures when the donor or acceptor groups are in the protein backbone.
From Fig. 3a, 90.5% of the acceptors in the BB–BB and BB–SC hydrogen bonds are the amide bond C O groups, consistent with the finding that O is the most common acceptor in biological SHBs. As shown in Fig. 3b, these backbone acceptors are distributed among all types of secondary structures. 40.1% of them are in ordered protein configurations, including α- and 310-helices and β-sheets. In BB–BB hydrogen bonds, this ratio increases to 63.9%, indicating that regular protein structural patterns can facilitate the formation of SHBs. In contrast, in BB–SC hydrogen bonds, the majority of the backbone carbonyl acceptors reside in more disordered regions of the proteins such as coils, bends and turns, in agreement with a previous study of the PDB.16 Similarly, when the backbone N–H groups serve as donors in the SHBs, their preferred locations are in disordered secondary structure motifs. Therefore, Fig. 3b suggests that proteins can not only use regular secondary structures to position backbone amide groups in close proximity, but also take advantage of flexible structural elements to bring backbone and side chain groups together and facilitate the formation of SHBs.
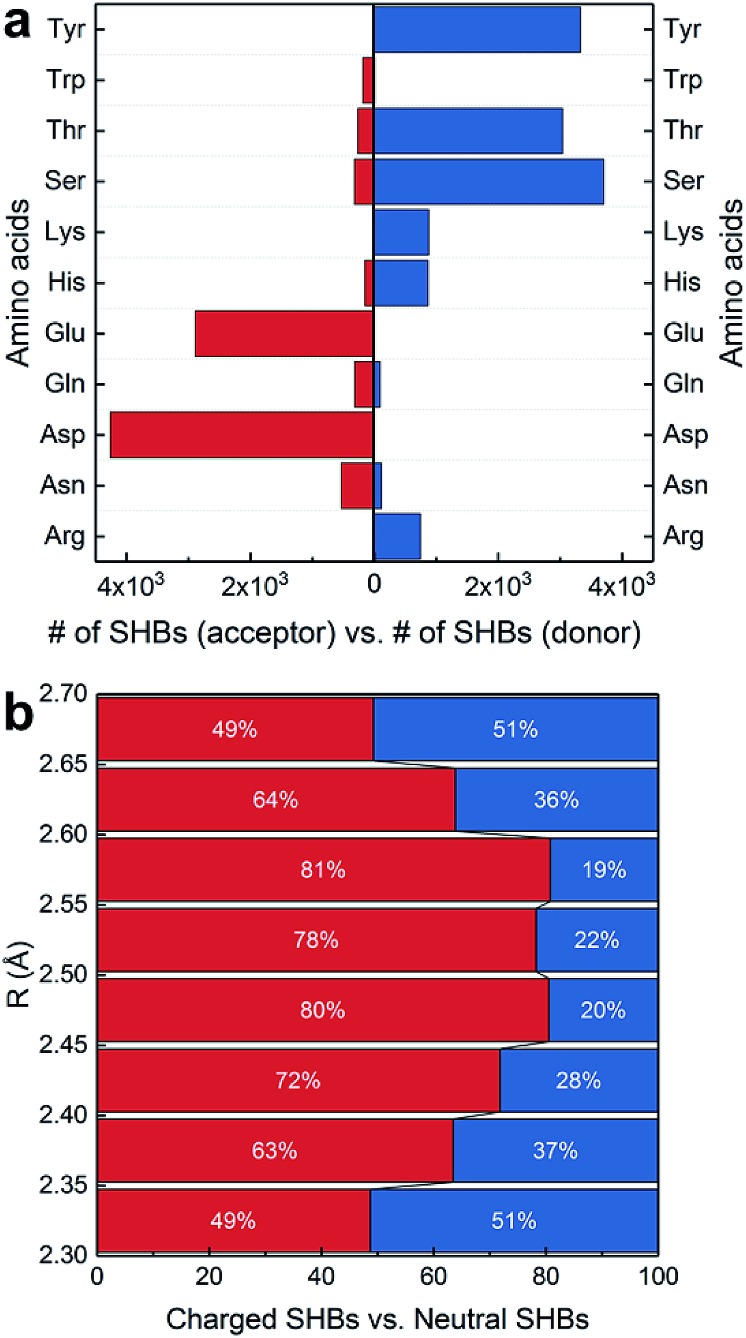
In Fig. 3a, the side chains of amino acids are present in 13 284 SHBs, and they account for over 95% of SHBs at each R. Among them, there are 4841 BB–SC SHBs and 8443 side chain–side chain (SC–SC) SHBs. To elucidate their chemical features, we have examined the occurrence of 11 proteinogenic amino acids with polar side chains that are capable of forming hydrogen bonds. These amino acids include Ser, Thr and Tyr with side chain –OH groups, Asp and Glu with –COO– groups, Asn and Gln with –CONH2 groups, Lys with the –NH2 group, Trp with the indole group, Arg with the guanidinium group, and His with the imidazole group. Fig. 4a shows that except Trp, all the other 10 amino acids are frequently involved in the formation of SHBs. In all the BB–SC and SC–SC hydrogen bonds, 80.0% have the negatively charged Asp and Glu as acceptor residues while 9.5% have the neutral Asn and Gln as acceptors. In contrast, the donor residues in these SHBs are predominantly amino acids with neutral side chains. For example, Ser and Thr have aliphatic side chains with hydroxyl groups and serve as donors in 52.8% of SHBs. Tyr contains the aromatic phenol side chain and acts as donors in 26.9% of SHBs. The remaining 20.3% of SHBs mainly have the positively-charged Lys, His and Arg as donor groups. From Fig. 4a, the most favorable acceptor and donor residues in the BB–SC and SC–SC hydrogen bonds contain carboxyl and hydroxyl groups, respectively, which contribute to the observation that O–H ···O is the most common type of biological SHBs. In addition, many N–H···O hydrogen bonds form when the side chains of Lys, His and Arg are the donor groups. Here the observations that amino acid side chains are present in the majority of SHBs and that the charged Lys, His, Arg, Asp and Glu as well as the neutral Tyr, Ser and Thr are enriched in the SHBs are consistent with a recent study by Qi and Kulik on close contacts in the crystal structures of proteins.40
Fig. 4. Chemical features of BB–SC and SC–SC SHBs. (a) Occurrence of 11 proteinogenic amino acids as acceptors or donors in SHBs. (b) Distribution of charged and neutral SHBs at different hydrogen bond lengths.
Fig. 4a indicates that the charge and aromaticity of the amino acids are important chemical factors in the formation of BB–SC and SC–SC SHBs. To further elucidate the role of side chain charges, we have computed the distribution of “charged” and “neutral” SHBs at different hydrogen bond lengths. While residues involved in SHBs might have considerably disturbed acidity, it is computationally demanding to accurately calculate their pKa in the protein interior. Therefore, we use the solution pKa values as references to determine the ionization states of the amino acid side chains. A SHB is defined as charged if at least one hydrogen bond participant bears a charge, and as neutral if both the donor and acceptor groups are neutral. As shown in Fig. 4b, both types of SHBs are abundant at all hydrogen bond lengths. The majority (71.7%) of neutral SHBs are BB–SC hydrogen bonds in which the peptide bond C O groups are acceptors. In contrast, 89.2% of charged SHBs are SC–SC hydrogen bonds. Consistent with the findings in Fig. 4a, the most favorable acceptor residues in the charged SHBs are Asp and Glu, whereas the most common donors are the neutral Tyr, Ser and Thr as well as the positively charged Arg, Lys and His. As there are almost twice as many SC–SC hydrogen bonds as BB–SC hydrogen bonds, it is more likely to find charged SHBs when R is between 2.35 and 2.65 Å. Accordingly, Fig. 4b demonstrates that possession of charges in the donor or acceptor groups facilitates the formation of SC–SC SHBs. From recent symmetry-adapted perturbation theory calculations by Qi and Kulik, this phenomenon arises because the electrostatic and induction interactions are significantly enhanced when a charged residue is present, providing stabilization to the SHBs.40
3.4. Proton potential energy surfaces for SC–SC short hydrogen bonds
Shortening R in a hydrogen bond often results in a larger degree of proton sharing between the donor and acceptor groups.2–4,11,71 As such, compared to hydrogen bonds that are typically observed in the condensed phase, SHBs can have distinct electronic energy surfaces when the proton is moved between the donor and acceptor atoms. To uncover how the structural and chemical features impact the SHBs in proteins, we have used electronic structure methods to compute the proton potential energy curves for 3665 SC–SC hydrogen bonds that are composed of Tyr, Lys, Arg, His, Asp and Glu. Here we only consider SC–SC SHBs that contain specific amino acids because the backbone amide groups and the side chains of Trp, Ser, Thr, Asn and Gln are protonated under neutral pH conditions, and hence are energetically unfavorable to participate in the sharing or transferring of protons.
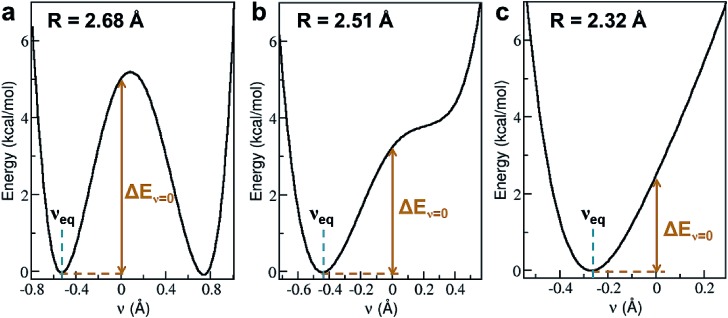
To characterize a SC–SC hydrogen bond A–H···B, we have determined the donor and acceptor atoms from its optimized geometry and defined the proton sharing coordinate as ν = dAH – dBH, where dAH and dBH are the distance from the H atom to the donor and acceptor, respectively. From this definition, the equilibrium proton positions, νeq, in all of the 3665 SHBs are negative. As shown in Fig. 5 and S2,† the proton potential energy curves fall into 3 categories, and their fractions depend heavily on R. For relatively long hydrogen bonds with R > 2.55 Å, the potential energy surfaces can take the form of a symmetric or asymmetric double well curve (Fig. 5a). In addition to the negative νeq, they have a second minimum at ν > 0, suggesting that the proton can form a stable B–H bond after being transferred to the acceptor group. However, these SHBs are more likely to adopt a single-well potential curve with a small shoulder (Fig. 5b). Here the proton transferred configuration is not thermodynamically stable, as evident from the presence of a shoulder rather than a second minimum at ν > 0. When R < 2.55 Å, over 70% of the SHBs have a single-well potential energy surface, and this ratio increases to 100% when R becomes shorter than 2.4 Å. As shown in Fig. 5c, νeq in the single-well potentials are closer to 0 than those in other types of surfaces, indicating that protons are more shared in the hydrogen bonds as their lengths shorten. Fig. 5 hence demonstrates the well-known phenomenon that as R of hydrogen bonds shorten, the proton energy surfaces change from double-well to single-well potentials,2–4,21,73,74 and it has been extensively shown that these differences in the shape of the potential energy curves lead to unique residual entropy and spectroscopic properties in small molecule crystals such as ice and bifluoride ions.2,3,75–77
Fig. 5. Three types of proton potential energy surfaces in biological SHBs. (a) A double-well potential, calculated from the Arg331–Glu328 hydrogen bond in a glucose isomerase (PDB ID 4A8I). (b) A single-well potential with a shoulder, calculated from the Asp35–Tyr109 hydrogen bond in a cellobiohydrolase (PDB ID ; 2V3I). (c) A single-well potential, calculated from the Arg947–Glu972 hydrogen bond in a mineralocorticoid receptor (PDB ID ; 4PF3).72νeq and ΔEν=0 are highlighted for each system.
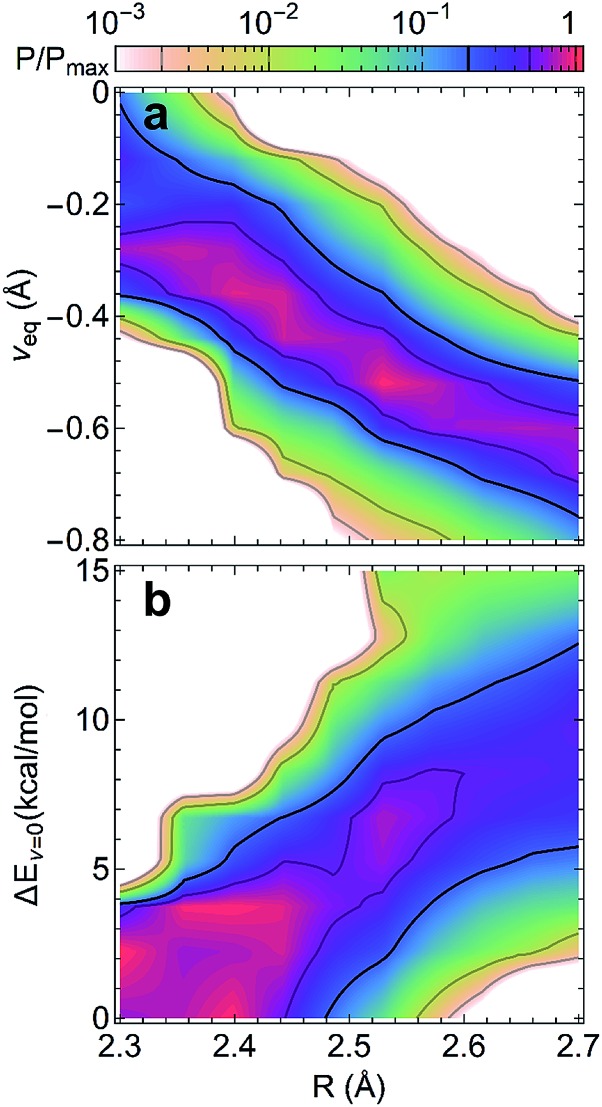
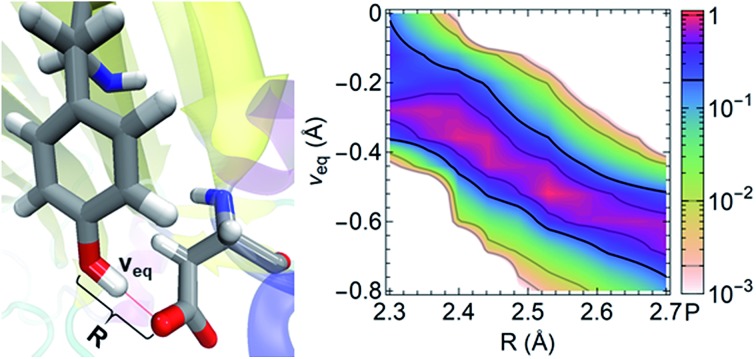
The compact structures of SHBs strongly impact the extent to which quantum effects modulate the potential energy surfaces and the proton behavior. From the electronic structure calculations, we have examined the optimized geometries of the SHBs and calculated the conditional probability of finding a hydrogen bond with length R and the proton at νeq, Pcp(R, νeq) = P(R, νeq)/P(R), where P(α) represents the probability distribution of the property α. As shown in Fig. 6a, while the 3665 SC–SC hydrogen bonds have different donor and acceptor residues, their equilibrium proton positions follow the same trend with the change in R. At R of 2.7 Å, νeq distributes between –0.4 and –0.9 Å with an average value of –0.7 Å. As R shortens, the average νeq increases almost linearly with a slope of –1.2 (Fig. S3†). When R < 2.4 Å, the average νeq becomes larger than –0.3 Å and noticeable amount of the SHBs has νeq close to 0, where the proton resides equidistantly between the donor and acceptor atoms. To disentangle the impact of electronic quantum effects, we compare Fig. 6a with the conditional probability obtained using the Amber14SB force field (Fig. S4†). In both cases, we observe the strong correlation between νeq and R, demonstrating that the classical force field is capable of providing a qualitatively correct description of the proton behavior in SHBs. However, the interplay of R and electronic quantum effects results in two distinct features. First, explicit inclusion of the quantum nature of the electrons promotes proton sharing in the SHBs, because the average νeq is larger at any given R and moves more rapidly towards 0 as R shortens as compared to the classical results (Fig. S3†). Second, electronic quantum effects significantly increase the fluctuations of νeq around their average values, hence capturing the sensitivity of the proton positions to the surrounding chemical environment.
Fig. 6. Conditional probabilities (a) Pcp(R, νeq) and (b) Pcp(R, ΔEν=0) from electronic structure calculations of 3665 SC–SC SHBs. In each graph, the probabilities are normalized by their maximum value.
To further delineate the potential energy surfaces, we define the barrier for proton sharing in the SHBs as the energy required to move the proton from its equilibrium state to the equally shared position, ΔEν=0, as illustrated in Fig. 5. Similar to the case of νeq, we have examined the 3665 SC–SC hydrogen bonds and computed the conditional probability Pcp(R, ΔEν=0) = P(R, ΔEν=0)/P(R). As shown in Fig. 6b, ΔEν=0 of the SHBs exhibit a strong positive correlation with R. When R is at 2.7 Å, ΔEν=0 of the SHBs can go up to 34.6 kcal mol–1 and have a large average value of 10.3 kcal mol–1 (Fig. S5†). Due to the high barrier, the protons in these relatively long hydrogen bonds are covalently linked to the donor atoms with highly negative νeq values, as observed from Fig. 6a. When 2.4 Å ≤ R ≤ 2.6 Å, the average barrier decreases to 2.6–6.7 kcal mol–1, which makes the proton more shared in the SHBs with the average νeq between –0.3 and –0.6 Å. These SHBs are also in the low-barrier hydrogen bond regime, where ΔEν=0 is comparable to the zero-point energy of the O–H or N–H vibration (∼5 kcal mol–1). The zero-point energy hence promotes the quantum delocalization of the proton in the SHBs, as demonstrated in previous simulation studies of a hydrogen bond network in the active site of an enzyme.78,79 When R further shortens to below 2.4 Å, the potential energy curves becomes a single-well potential (Fig. 5c) with the average ΔEν=0 smaller than 3 kcal mol–1. Accordingly, both electronic and nuclear quantum effects will facilitate the sharing of protons in these very short hydrogen bonds. Note that while nuclear quantum effects allow the proton to be delocalized between the donor and acceptor groups and strengthen a SHB, they also enhance the motions of the proton in other directions that act to distort and weaken the hydrogen bond. Therefore, the net impact results from a delicate balance between two competing effects, with their relative importance depending strongly on R. From a series of recent simulations on hydrogen bonded systems, it has been shown that nuclear quantum effects strengthen shorter hydrogen bonds and weaken longer ones.10,12,79–83
3.5. Hybrid hydrogen bond networks in proteins
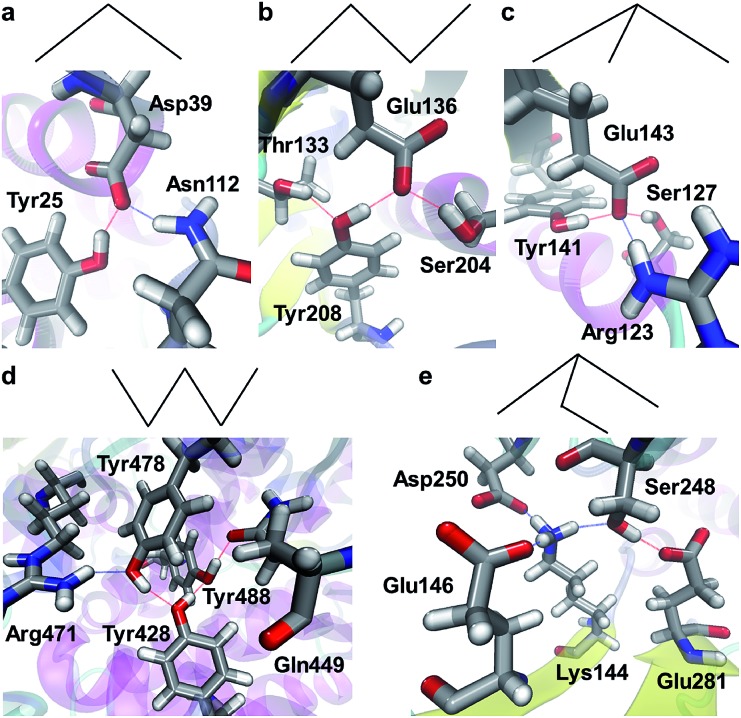
Properties of a SHB can be significantly changed when it is involved in a hydrogen bond network. From all the proteins, we have identified a total of 4967 networks that contain at least 1 SHB. We refer to these structures as hybrid hydrogen bond networks because 96.2% of them are formed from both SHBs and regular hydrogen bonds. As schematically represented in the top panels of Fig. 7, the hybrid networks exhibit 5 characteristic connectivity patterns. 76.4% of them are hydrogen bonded trimers, which take a V-shaped chain geometry (Fig. 7a). The second largest population have 4 hydrogen bond participants, among which 792 systems adopt a chain structure that provides 2 hydrogen bonds to each of the central residues and 1 hydrogen bond for the terminal groups (Fig. 7b). 95 of these tetramers take a branched geometry, in which the central residue forms 3 hydrogen bonds with the surrounding terminal groups, as shown in Fig. 7c. In addition, 168 networks are hydrogen bonded pentamers that are in either a chain or branched configuration, as demonstrated in Fig. 7d and e, respectively.
Fig. 7. Patterns of hybrid hydrogen bond networks. The top panels are schematic representations of the networks, in which nodes and lines represent atoms and hydrogen bonds, respectively. The bottom panels show example structures in proteins. The structural patterns include (a) the chain geometry of hydrogen bonded trimers (PDB ID 2BCH),84 the (b) chain and (c) branched geometries of tetramers (PDB IDs ; 2CI1 and ; 2EVW),57,85 and the (d) chain and (e) branched geometries of the pentamers (PDB IDs ; 5A0Y and ; 3RWN).86,87 Silver, red, blue and white represent C, O, N and H, respectively, and the hydrogen bonds are represented by dotted lines.
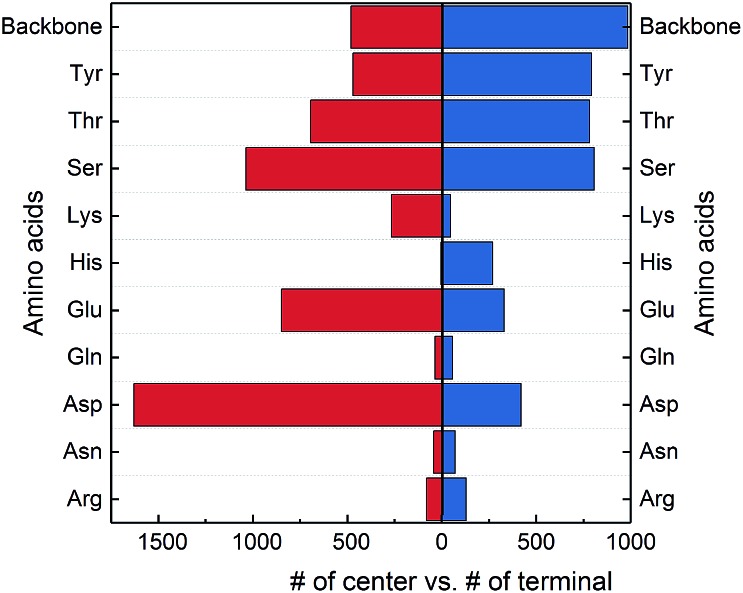
The protein backbone amide groups and the polar side chains, except that in tryptophan, have the capacity to form multiple hydrogen bonds. From Fig. 7, the two amino acids in a SHB can reside in the center or terminal of a hybrid hydrogen bond network. We hence examine their preferred locations in hybrid networks and plotted the distributions in Fig. 8. 44.3% of hybrid networks have the negatively charged Asp and Glu as central residues, possibly because multiple hydrogen bonds can act to stabilize the negatively charged carboxylate groups in the protein interior. The neutral side chains in Ser, Thr and Tyr are commonly observed both in the center and terminal of hybrid networks, demonstrating that the –OH functional group is highly favored in the hybrid networks. Furthermore, the protein backbone amide groups frequently occur in the centers of hybrid networks and are the most favored terminal residues, highlighting their prevalence in hydrogen bond networks that involve SHBs.
Fig. 8. Occurrence of the protein backbone and side chains in the center or terminal of hybrid hydrogen bond networks. The amino acids are donors or acceptors in SHBs.
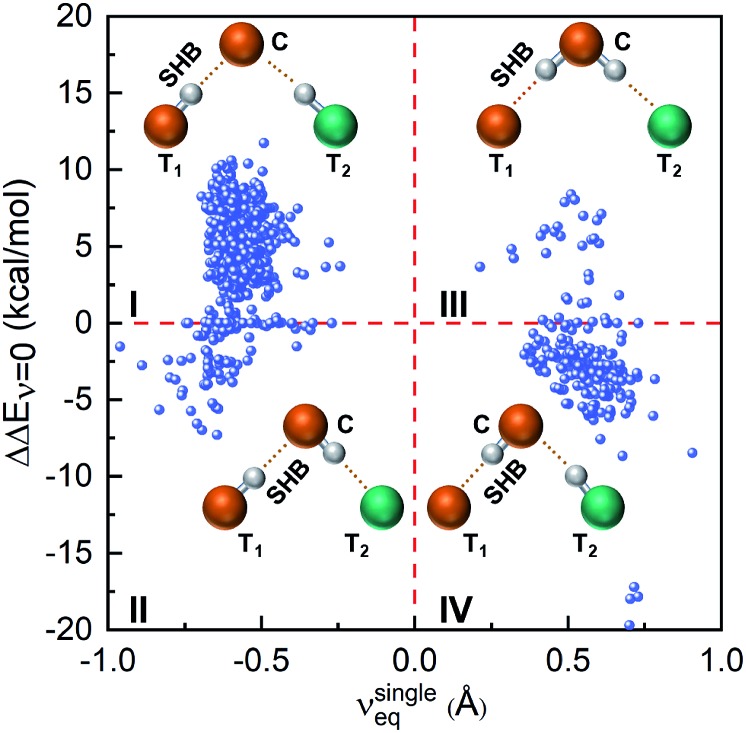
Next, we investigate how the presence of a hydrogen bond network alters the proton energy surface of a SHB. Here we only consider hydrogen bonded trimers because the hybrid networks predominantly take a trimer structure and that the most prominent influence on a SHB comes from its closest hydrogen bond partner. To directly compare the properties of SHBs in the absence and presence of the network, we have carried out electronic structure calculations on 947 trimers in which the SHBs are formed from the side chains of Tyr, Lys, Arg, His, Asp and Glu. Their structures are schematically presented in the insets of Fig. 9: the terminal residue T1 forms a SHB with the central residue C, which is further linked to another terminal residue T2 to form a hydrogen bond network. In the reference state, the pair of T1 and C is treated as an isolated single SHB and its proton energy curve is characterized by the equilibrium proton position, νsingleeq = dT1H – dCH, and the barrier for proton sharing, ΔEsingleν=0. When the SHB is involved in a network, its barrier becomes ΔEnetworkν=0. As shown in Fig. 9, the impact of the hydrogen bond network on the barrier for proton sharing, ΔΔEν=0 = ΔEnetworkν=0 – ΔEsingleν=0, depends heavily on νsingleeq in the reference state.
Fig. 9. Correlation between ΔΔEν=0 and the proton positions in the reference state, νsingleeq. Insets shows the most probable configurations of the hydrogen bonded trimers in each quadrant.
In the reference state that residues T1 and C forms a single SHB, 77.8% of the systems have the protons reside closer to T1 and νsingleeq < 0 and hence belong to Quadrants I and II in Fig. 9. In the presence of residue T2, 650 of them have increased barrier (Quadrant I). In these cases, residue C are almost exclusively Asp or Glu that accept hydrogen bonds from both T1 and T2, as shown in the inset picture. Because of this connectivity, the electronic induction effects from T2 result in a slight decrease in νeq in the SHBs and an increase in their barriers (ΔΔEν=0 > 0) as compared to the reference state. In contrast, 87 SHBs are in Quadrant II and have reduced barriers upon forming the hybrid networks. Over 50% of these systems have ΔΔEν=0 < –1 kcal mol–1 and lysine as the central residue, which accepts a hydrogen bond from T1 and donates a hydrogen bond to T2. As such, T2 electronically induces the proton to be more shared in the SHBs and lowers the barrier for proton sharing. In fact, the reduced barriers lead to proton transfer from residues T1 to C in a few systems. As an example, the proton potential energy surfaces of a Glu–Lys SHB are shown in Fig. S6a.† When the side chain of a Gln residue is hydrogen bonded to Lys, a proton transfer occurs and the shape of the energy curves qualitatively changes, as the barrier decreases by 3.7 kcal mol–1 and νeq shifts from –0.6 to 0.5 Å.
In the reference state, a total of 210 SHBs have residue C as the hydrogen bond donor and νsingleeq > 0. When involved in hydrogen bond networks, the majority of them have decreased barriers and are in Quadrant IV of Fig. 9. In these systems, the most common central residue is Lys, which is followed by Asp and Glu. As illustrated in the inset picture, residue C donates a hydrogen bond to T1 and accepts one from T2. From this connectivity, the presence of T2 stabilizes residue C, facilitates the sharing of the proton in the SHB and reduces the potential energy barrier. For example, we have observed 3 cases where ΔΔEν=0 < –17 kcal mol–1, all of which have a Tyr–Tyr SHB connected to a Glu residue as T2. Due to the barrier reduction, proton transfer occurs in 32% of the SHBs in Quadrant IV, particularly when T2 are the side chains of Arg, Lys or His as their positive charges provide stronger induction effects. This is demonstrated in Fig. S6b† using a Glu–Tyr SHB. In the presence of a third His residue, the barrier for proton sharing decreases by 5.8 kcal mol–1, leading to a proton transfer and a shift in νeq from 0.6 to –0.5 Å. Finally, a small number of 34 SHBs are in Quadrant III, which have increased barrier when hydrogen bond networks are formed. When ΔΔEν=0 > 2 kcal mol–1, Arg is the predominant residue C as it contains more than one hydrogen atoms in the side chain and can serve as dual donors in the hydrogen bond networks. In these cases, residue T2 are Asp or Glu and their strong electrostatic interactions with residue C increase the barrier for proton sharing in the SHBs (ΔΔEν=0 > 0). Therefore, Fig. 9 demonstrates that the potential energy curves, and hence the proton behavior in the SHBs are significantly influenced by the geometries and chemical features of the hydrogen bond networks.
3.6. Short hydrogen bonds in protein–ligand complexes
Apart from the protein–protein hydrogen bonds, we have identified 2187 SHBs that have ligands as donor or acceptor groups. These SHBs are distributed in 827 protein–ligand complexes, ranging from signaling proteins to transport proteins and enzymes. Structurally, hydrogen bonds that involve ligands are more likely to have shorter R compared to those between amino acids, as demonstrated in Fig. 1. For example, 34.6% of these SHBs have R < 2.6 Å, whereas the ratio in protein–protein SHBs is only 18.6%. From Fig. 6, we expect to observe more prominent proton sharing in the ligand-containing SHBs, which arise from an interplay of R and quantum effects in both the electronic and nuclear degrees of freedom.
We have found a total of 1966 protein–ligand SHBs. To characterize their chemical features, we have listed the most commonly observed amino acids in Table 1. The predominant acceptors in protein–ligand SHBs are Asp and Glu, which also favor the formation of shorter hydrogen bonds with R < 2.6 Å. Similar to the cases in protein–protein SHBs, the neutral amino acids Ser, Thr and Tyr are frequently observed as both donors and acceptors, whereas the positively charged Lys and His are common donors in the formation of protein–ligand SHBs.
Table 1. 5 most commonly observed amino acids and ligands as acceptors or donors in protein–ligand SHBs.
| SHB acceptor |
SHB donor |
||
| Amino acid | Occurrence | Amino acid | Occurrence |
| Asp | 407 | Ser | 211 |
| Glu | 319 | Tyr | 129 |
| Thr | 77 | Thr | 110 |
| Ser | 63 | Lys | 95 |
| Tyr | 46 | His | 95 |
| SHB acceptor |
SHB donor |
||
| Ligand | Occurrence | Ligand | Occurrence |
| FAD/FMN | 51 | NADP/NAD | 96 |
| Heme | 45 | α-l-Fucose | 77 |
| NADP/NAD | 38 | FAD/FMN | 59 |
| N-Acetyl-d-glucosamine | 19 | α-d-Mannose | 40 |
| α-l-Fucose | 13 | Heme | 36 |
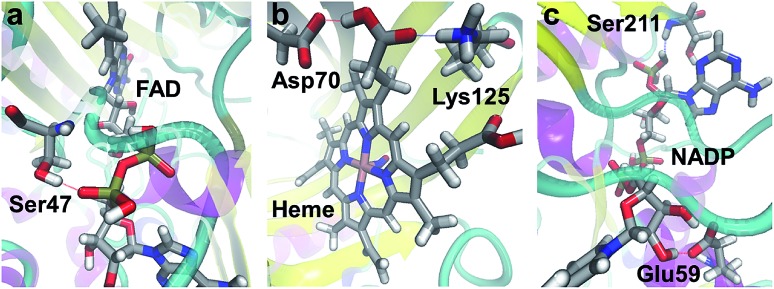
Many of the ligands involved in protein–ligand SHBs are inorganic anions and polyols such as SO42–, PO43–, ethylene glycol and glycerol. We will not consider them since they are mainly used in the solvation of biomolecules for experimental measurements. We then identify the most commonly observed ligands in the formation of SHBs, and find them to belong to 4 types of molecules that have important biological functions. As shown in Table 1, the first type is flavin nucleotides, which include flavin adenine dinucleotide (FAD) and flavin mononucleotide (FMN). These molecules are rich in hydroxyl groups and can form both intra- and intermolecular hydrogen bonds. As such, FAD and FMN are widely observed as SHB acceptors and donors in flavoproteins, in which they serve as cofactors to catalyze cellular redox reactions.88–90 As an example, the FAD-binding domain of alditol oxidase, a flavoprotein that selectively oxidizes the terminal hydroxyl groups of sugar alcohols, is shown in Fig. 10a.90 The pyrophosphate group of FAD forms two SHBs with residues Ser44 and Ser47 with R of 2.60 and 2.54 Å, respectively, and the FAD–Ser47 SHB is highlighted in Fig. 10a. These SHBs likely act to position the FAD cofactor in the FAD-binding domain of the enzyme to facilitate catalysis. The second type of ligand is heme, which is composed of an iron ion coordinated to protoporphyrin IX. The heme-containing SHBs are distributed in a variety of proteins ranging from nitrophorin 4, myoglobin to cytochrome c and dehaloperoxidase hemoglobin.91–95 For example, nitrophorin 4 is used by the insect Rhodnius prolixus to transport nitric oxide (NO) for cell signaling, and its active-site in the presence of a NO molecule is shown in Fig. 10b.92 Two residues Asp70 and Lys125 are hydrogen bonded to the protoporphyrin IX, with R of 2.50 Å in both cases, possibly stabilizing the heme for NO binding.92
Fig. 10. Examples of SHBs formed between proteins and (a) FAD (PDB ID 2VFR),90 (b) heme (PDB ID ; 1X8O),92 and (c) NADP (PDB ID ; 5FI3).96 Silver, red, blue, white and pink represent C, O, N, H and Fe, respectively. The SHBs are represented by dotted lines.
The third type is pyridine nucleotides, which include nicotinamide adenine dinucleotide (NAD+), nicotinamide adenine dinucleotide phosphate (NADP+) and their reduced forms NADH and NADPH. These enzyme cofactors are composed of two nucleotides joined through the phosphate groups, and are crucial electron carriers in a range of important redox reactions in metabolism. To simplify the notation, we will represent NAD+ and NADH as NAD, and NADP+ and NADPH as NADP. As shown in Table 1, pyridine nucleotides, in particular NADP, are widely found in oxidoreductases and are frequent donors and acceptors in protein–ligand SHBs.96–98 As an example, Fig. 10c shows the active-site cavity of a heteroyohimbine synthase, which plays key roles in the biosynthesis of heteroyohimbine.96 NADP is anchored by residue Glu59 through bidentate hydrogen bonds, one of which is a SHB with R of 2.49 Å. Furthermore, NADP accepts a hydrogen bond from Ser211 at an R of 2.59 Å, and these SHBs hold NADP in place for enzymatic redox reactions.96 As the fourth ligand type, carbohydrates are commonly involved in the formation of SHBs, as listed in Table 1. In particular, N-acetyl-d-glucosamine, α-l-fucose and α-d-mannose regularly participate in protein–ligand SHBs in lectins, cholera toxins and at the glycosylation sites of enzymes such as glycoside hydrolases, manganese peroxidases and polysaccharide monooxygenases.99–104 In these proteins, a carbohydrate molecule is often involved in multiple SHBs, suggesting that living organisms might take advantage of these specialized structural motifs to achieve specific binding to mono- and polysaccharides and mediate their biological functions.
4. Conclusion
In this work, we statistically analyze the PDB and find that on average, each of the 1504 high-resolution biomolecular structures contains 11 SHBs. This observation demonstrates that SHBs are ubiquitous in proteins, protein–ligand complexes and nucleic acids, and indicates the importance to incorporate these special structural elements in X-ray or NMR structure refinement as conventional methods tend to avoid the formation of very close contacts between atoms. Structurally, these SHBs all have R ≤ 2.7 Å and are frequently involved in the formation of hydrogen bond networks. Chemically, they often contain the charged side chains of Asp, Glu, Arg, Lys and His as well as the neutral side chains of Ser, Thr and Tyr. SHBs can also be functionally important as they are widely distributed in signaling proteins and enzymes and many of them are in the form of active-site protein–ligand hydrogen bonds. As such, our findings can potentially be used for the design of novel proteins and bio-inspired materials that incorporate these compact structural elements to achieve enhanced functions.
The interplay of the structural and chemical features results in characteristic proton potential energy surfaces that are universal for all biological SHBs. In particular, as R shortens, the potential energy barrier decreases and the proton is more shared in the hydrogen bond, and the influence of quantum effects becomes prominent. For example, our calculations have shown that the classical Amber14SB force field can only provide a qualitative description of this relation, and explicit inclusion of electronic quantum effects is required to accurately predict the equilibrium proton positions and the barrier for proton sharing in the SHBs. Note that we have carried out all the calculations with the non-hydrogen atoms fixed at their positions in the crystal structures, and one can further investigate the impact of conformational fluctuations using molecular simulations that obtain forces from instantaneous quantum mechanical calculations.105–109 Moreover, our results confirm that when R is between 2.4 and 2.6 Å, one enters the low-barrier hydrogen bond regime as the barrier for sharing the proton between the donor and acceptor groups is comparable to the zero-point energies of typical O–H and N–H vibrations. To elucidate how quantum effects facilitate the sharing and transferring of the protons in these SHBs and unravel their functional importance, one can exploit simulations that incorporate the quantum mechanical nature of both the electrons and nuclei, which have offered crucial insight into hydrogen bonded systems in proteins and nucleic acids.27,78,83,110–114 These simulations will also provide benchmark data for the development of new force fields that accurately and efficiently describe the conformations and proton sharing conditions in biological SHBs.
Conflicts of interest
There are no conflicts to declare.
Supplementary Material
Acknowledgments
L. W. thanks Professor Stephen Burley and Professor Helen Berman for helpful discussions and for their support to analyze the RCSB Protein Data Bank. L. W. acknowledges support from the Research Council Grant provided by Rutgers University. The authors acknowledge the Office of Advanced Research Computing at Rutgers University for providing access to the Amarel cluster.
Footnotes
†Electronic supplementary information (ESI) available: Additional computational methods and supplementary figures. See DOI: 10.1039/c9sc01496a
References
- Baker E. N., Hubbard R. E. Prog. Biophys. Mol. Biol. 1984;44:97–179. doi: 10.1016/0079-6107(84)90007-5. [DOI] [PubMed] [Google Scholar]
- Hibbert F., Emsley J. Adv. Phys. Org. Chem. 1990;26:255–379. [Google Scholar]
- Jeffrey G., An Introduction to Hydrogen Bonding, Oxford University Press, 1997. [Google Scholar]
- Perrin C. L., Nielson J. B. Annu. Rev. Phys. Chem. 1997;48:511–544. doi: 10.1146/annurev.physchem.48.1.511. [DOI] [PubMed] [Google Scholar]
- Sigala P. A., Ruben E. A., Liu C. W., Piccoli P. M. B., Hohenstein E. G., Martínez T. J., Schultz A. J., Herschlag D. J. Am. Chem. Soc. 2015;137:5730–5740. doi: 10.1021/ja512980h. [DOI] [PubMed] [Google Scholar]
- Grabowski S. J. Chem. Rev. 2011;111:2597–2625. doi: 10.1021/cr800346f. [DOI] [PubMed] [Google Scholar]
- Tuckerman M. E., Marx D., Klein M. L., Parrinello M. Science. 1997;275:817–820. doi: 10.1126/science.275.5301.817. [DOI] [PubMed] [Google Scholar]
- Raugei S., Klein M. L. J. Am. Chem. Soc. 2003;125:8992–8993. doi: 10.1021/ja0351995. [DOI] [PubMed] [Google Scholar]
- Marx D. ChemPhysChem. 2006;7:1848–1870. doi: 10.1002/cphc.200600128. [DOI] [PubMed] [Google Scholar]
- Li X.-Z., Walker B., Michaelides A. Proc. Natl. Acad. Sci. U. S. A. 2011;108:6369–6373. [Google Scholar]
- Ceriotti M., Cuny J., Parrinello M., Manolopoulos D. E. Proc. Natl. Acad. Sci. U. S. A. 2013;110:15591–15596. doi: 10.1073/pnas.1308560110. [DOI] [PMC free article] [PubMed] [Google Scholar]
- Ceriotti M., Fang W., Kusalik P. G., McKenzie R. H., Michaelides A., Morales M. A., Markland T. E. Chem. Rev. 2016;116:7529–7550. doi: 10.1021/acs.chemrev.5b00674. [DOI] [PubMed] [Google Scholar]
- White P. B., Hong M. J. Phys. Chem. B. 2015;119:11581–11589. doi: 10.1021/acs.jpcb.5b06171. [DOI] [PMC free article] [PubMed] [Google Scholar]
- Pinney M., Natarajan A., Yabukarski F., Sanchez D. M., Liu F., Liang R., Doukov T., Schwans J. P., Martinez T. J., Herschlag D. J. Am. Chem. Soc. 2018;140:9827–9843. doi: 10.1021/jacs.8b01596. [DOI] [PubMed] [Google Scholar]
- Flocco M. M., Mowbray S. L. J. Mol. Biol. 1995;254:96–105. doi: 10.1006/jmbi.1995.0602. [DOI] [PubMed] [Google Scholar]
- Rajagopal S., Vishveshwara S. FEBS J. 2005;272:1819–1832. doi: 10.1111/j.1742-4658.2005.04604.x. [DOI] [PubMed] [Google Scholar]
- Oltrogge L. M., Boxer S. G. ACS Cent. Sci. 2015;1:148–156. doi: 10.1021/acscentsci.5b00160. [DOI] [PMC free article] [PubMed] [Google Scholar]
- Lin J., Pozharski E., Wilson M. A. Biochemistry. 2017;56:391–402. doi: 10.1021/acs.biochem.6b00906. [DOI] [PMC free article] [PubMed] [Google Scholar]
- Brady K., Wei A., Ringe D., Abeles R. H. Biochemistry. 1990;29:7600–7607. doi: 10.1021/bi00485a009. [DOI] [PubMed] [Google Scholar]
- Frey P., Whitt S., Tobin J. Science. 1994;264:1927–1930. doi: 10.1126/science.7661899. [DOI] [PubMed] [Google Scholar]
- Cleland W. W., Frey P. A., Gerlt J. A. J. Biol. Chem. 1998;273:25529–25532. doi: 10.1074/jbc.273.40.25529. [DOI] [PubMed] [Google Scholar]
- Northrop D. B. Acc. Chem. Res. 2001;34:790–797. doi: 10.1021/ar000184m. [DOI] [PubMed] [Google Scholar]
- Mildvan A., Massiah M., Harris T., Marks G., Harrison D., Viragh C., Reddy P., Kovach I. J. Mol. Struct. 2002;615:163–175. [Google Scholar]
- Yamaguchi S., Kamikubo H., Kurihara K., Kuroki R., Niimura N., Shimizu N., Yamazaki Y., Kataoka M. Proc. Natl. Acad. Sci. U. S. A. 2009;106:440–444. doi: 10.1073/pnas.0811882106. [DOI] [PMC free article] [PubMed] [Google Scholar]
- Sharma M., Yi M., Dong H., Qin H., Peterson E., Busath D. D., Zhou H.-X., Cross T. A. Science. 2010;330:509–512. doi: 10.1126/science.1191750. [DOI] [PMC free article] [PubMed] [Google Scholar]
- Nichols D. A., Hargis J. C., Sanishvili R., Jaishankar P., Defrees K., Smith E. W., Wang K. K., Prati F., Renslo A. R., Woodcock H. L., Chen Y. J. Am. Chem. Soc. 2015;137:8086–8095. doi: 10.1021/jacs.5b00749. [DOI] [PMC free article] [PubMed] [Google Scholar]
- Pinotsi D., Grisanti L., Mahou P., Gebauer R., Kaminski C. F., Hassanali A., Kaminski Schierle G. S. J. Am. Chem. Soc. 2016;138:3046–3057. doi: 10.1021/jacs.5b11012. [DOI] [PubMed] [Google Scholar]
- Kumar P., Serpersu E. H., Cuneo M. J. Sci. Adv. 2018;4:eaas8667. doi: 10.1126/sciadv.aas8667. [DOI] [PMC free article] [PubMed] [Google Scholar]
- Agback P., Agback T. Sci. Rep. 2018;8:10078. doi: 10.1038/s41598-018-28441-7. [DOI] [PMC free article] [PubMed] [Google Scholar]
- Warshel A., Papazyan A., Kollman P. Science. 1995;269:102–106. doi: 10.1126/science.7661987. [DOI] [PubMed] [Google Scholar]
- Warshel A., Papazyan A. Proc. Natl. Acad. Sci. U. S. A. 1996;93:13665–13670. doi: 10.1073/pnas.93.24.13665. [DOI] [PMC free article] [PubMed] [Google Scholar]
- Perrin C. L. Acc. Chem. Res. 2010;43:1550–1557. doi: 10.1021/ar100097j. [DOI] [PubMed] [Google Scholar]
- Hosur M. V., Chitra R., Hegde S., Choudhury R. R., Das A., Hosur R. V. Crystallogr. Rev. 2013;19:3–50. [Google Scholar]
- Tamada T., Kinoshita T., Kurihara K., Adachi M., Ohhara T., Imai K., Kuroki R., Tada T. J. Am. Chem. Soc. 2009;131:11033–11040. doi: 10.1021/ja9028846. [DOI] [PubMed] [Google Scholar]
- Yonezawa K., Shimizu N., Kurihara K., Yamazaki Y., Kamikubo H., Kataoka M. Sci. Rep. 2017;7:9361. doi: 10.1038/s41598-017-09718-9. [DOI] [PMC free article] [PubMed] [Google Scholar]
- Oksanen E., Chen J. C.-H., Fisher S. Z. Molecules. 2017;22:596. doi: 10.3390/molecules22040596. [DOI] [PMC free article] [PubMed] [Google Scholar]
- Berman H. M., Westbrook J., Feng Z., Gilliland G., Bhat T. N., Weissig H., Shindyalov I. N., Bourne P. E. Nucleic Acids Res. 1999;28:235–242. doi: 10.1093/nar/28.1.235. [DOI] [PMC free article] [PubMed] [Google Scholar]
- Rose P. W., Prlić A., Altunkaya A., Bi C., Bradley A. R., Christie C. H., Costanzo L. D., Duarte J. M., Dutta S., Feng Z., Green R. K., Goodsell D. S., Hudson B., Kalro T., Lowe R., Peisach E., Randle C., Rose A. S., Shao C., Tao Y.-P., Valasatava Y., Voigt M., Westbrook J. D., Woo J., Yang H., Young J. Y., Zardecki C., Berman H. M., Burley S. K. Nucleic Acids Res. 2017;45:D271. doi: 10.1093/nar/gkw1000. [DOI] [PMC free article] [PubMed] [Google Scholar]
- Panigrahi S. K., Desiraju G. R. Proteins: Struct., Funct., Bioinf. 2007;67:128–141. doi: 10.1002/prot.21253. [DOI] [PubMed] [Google Scholar]
- Qi H. W., Kulik H. J. Chem. Inf. Model. 2019;59:2199–2211. doi: 10.1021/acs.jcim.9b00144. [DOI] [PubMed] [Google Scholar]
- Case D., Betz R., Cerutti D., Cheatham T., Darden T., Duke R., Giese T., Gohlke H., Goetz A., Homeyer N., Izadi S., Janowski P., Kaus J., Kovalenko A., Lee T., LeGrand S., Li P., Lin C., Luchko T., Luo R., Madej B., Mermelstein D., Merz K., Monard G., Nguyen H., Nguyen H., Omelyan I., Onufriev A., Roe D., Roitberg A., Sagui C., Simmerling C., Botello-Smith W., Swails J., Walker R., Wang J., Wolf R., Wu X., Xiao L. and Kollman P., AMBER 2016, University of California, San Francisco, 2016.
- Ponder J. W., Case D. A. Adv. Protein Chem. 2003;66:27–85. doi: 10.1016/s0065-3233(03)66002-x. [DOI] [PubMed] [Google Scholar]
- Maier J. A., Martinez C., Kasavajhala K., Wickstrom L., Hauser K. E., Simmerling C. J. Chem. Theory Comput. 2015;11:3696–3713. doi: 10.1021/acs.jctc.5b00255. [DOI] [PMC free article] [PubMed] [Google Scholar]
- Wang J., Wolf R. M., Caldwell J. W., Kollman P. A., Case D. A. J. Comput. Chem. 2004;25:1157–1174. doi: 10.1002/jcc.20035. [DOI] [PubMed] [Google Scholar]
- Kabsch W., Sander C. Biopolymers. 1983;22:2577–2637. doi: 10.1002/bip.360221211. [DOI] [PubMed] [Google Scholar]
- Ufimtsev I. S., Martinez T. J. J. Chem. Theory Comput. 2009;5:2619–2628. doi: 10.1021/ct9003004. [DOI] [PubMed] [Google Scholar]
- Titov A. V., Ufimtsev I. S., Luehr N., Martinez T. J. J. Chem. Theory Comput. 2013;9:213–221. doi: 10.1021/ct300321a. [DOI] [PubMed] [Google Scholar]
- Becke A. D. J. Chem. Phys. 1993;98:5648. [Google Scholar]
- Grimme S., Antony J., Ehrlich S., Krieg H. J. Chem. Phys. 2010;132:154104. doi: 10.1063/1.3382344. [DOI] [PubMed] [Google Scholar]
- Wlodawer A., Minor W., Dauter Z., Jaskolski M. FEBS J. 2008;275:1–21. doi: 10.1111/j.1742-4658.2007.06178.x. [DOI] [PMC free article] [PubMed] [Google Scholar]
- Sheldrick G. M. Acta Crystallogr., Sect. A: Found. Crystallogr. 1990;46:467–473. [Google Scholar]
- Dauter Z., Lamzin V. S., Wilson K. S. Curr. Opin. Struct. Biol. 1997;7:681–688. doi: 10.1016/s0959-440x(97)80078-4. [DOI] [PubMed] [Google Scholar]
- EU 3-D Validation Network J. Mol. Biol. 1998;276:417–436. doi: 10.1006/jmbi.1997.1526. [DOI] [PubMed] [Google Scholar]
- Murshudov G. N., Vagin A. A., Dodson E. J. Acta Crystallogr., Sect. D: Biol. Crystallogr. 1997;53:240–255. doi: 10.1107/S0907444996012255. [DOI] [PubMed] [Google Scholar]
- Carpenter G. B. Acta Crystallogr., Sect. A: Cryst. Phys., Diffr., Theor. Gen. Crystallogr. 1979;35:248–250. [Google Scholar]
- Bondi A. J. Phys. Chem. 1964;68:441–451. [Google Scholar]
- Klink B. U., Goody R. S., Scheidig A. J. Biophys. J. 2006;91:981–992. doi: 10.1529/biophysj.105.078931. [DOI] [PMC free article] [PubMed] [Google Scholar]
- Molzan M., Schumacher B., Ottmann C., Baljuls A., Polzien L., Weyand M., Thiel P., Rose R., Rose M., Kuhenne P., Kaiser M., Rapp U. R., Kuhlmann J., Ottmann C. Mol. Cell. Biol. 2010;30:4698. doi: 10.1128/MCB.01636-09. [DOI] [PMC free article] [PubMed] [Google Scholar]
- Noguchi H., Ikegami T., Nagadoi A., Kamatari Y. O., Park S.-Y., Tame J. R., Unzai S. Biochem. Biophys. Res. Commun. 2015;462:46–51. doi: 10.1016/j.bbrc.2015.04.103. [DOI] [PubMed] [Google Scholar]
- Simonovic M., Volz K. J. Biol. Chem. 2001;276:28637–28640. doi: 10.1074/jbc.C100295200. [DOI] [PubMed] [Google Scholar]
- Getzoff E. D., Gutwin K. N., Genick U. K. Nat. Struct. Biol. 2003;10:663–668. doi: 10.1038/nsb958. [DOI] [PubMed] [Google Scholar]
- Anderson S., Crosson S., Moffat K. Acta Crystallogr., Sect. D: Biol. Crystallogr. 2004;60:1008–1016. doi: 10.1107/S090744490400616X. [DOI] [PubMed] [Google Scholar]
- Kaledhonkar S., Hara M., Stalcup T. P., Xie A., Hoff W. D. Biophys. J. 2013;105:2577–2585. doi: 10.1016/j.bpj.2013.10.017. [DOI] [PMC free article] [PubMed] [Google Scholar]
- Webb E. C., Enzyme nomenclature 1992: Recommendations of the Nomenclature Committee of the International Union of Biochemistry and Molecular Biology on the Nomenclature and Classification of Enzymes, Published for the International Union of Biochemistry and Molecular Biology by Academic Press, 1992. [Google Scholar]
- Perona J. J., Craik C. S. Protein Sci. 1995;4:337–360. doi: 10.1002/pro.5560040301. [DOI] [PMC free article] [PubMed] [Google Scholar]
- Hedstrom L. Chem. Rev. 2002;102:4501–4524. doi: 10.1021/cr000033x. [DOI] [PubMed] [Google Scholar]
- Polgár L. Cell. Mol. Life Sci. 2005;62:2161–2172. doi: 10.1007/s00018-005-5160-x. [DOI] [PMC free article] [PubMed] [Google Scholar]
- Katona G., Wilmouth R. C., Wright P. A., Berglund G. I., Hajdu J., Neutze R., Schofield C. J. J. Biol. Chem. 2002;277:21962–21970. doi: 10.1074/jbc.M200676200. [DOI] [PubMed] [Google Scholar]
- Wahlgren W. Y., Pál G., Kardos J., Porrogi P., Szenthe B., Patthy A., Gráf L., Katona G. J. Biol. Chem. 2011;286:3587–3596. doi: 10.1074/jbc.M110.161604. [DOI] [PMC free article] [PubMed] [Google Scholar]
- Zander U., Hoffmann G., Cornaciu I., Marquette J.-P., Papp G., Landret C., Seroul G., Sinoir J., Röwer M., Felisaz F., Rodriguez-Puente S., Mariaule V., Murphy P., Mathieu M., Cipriani F., Márquez J. A. Acta Crystallogr., Sect. D: Struct. Biol. 2016;72:454–466. doi: 10.1107/S2059798316000954. [DOI] [PMC free article] [PubMed] [Google Scholar]
- Hanoian P., Sigala P. A., Herschlag D., Hammes-Schiffer S. Biochemistry. 2010;49:10339–10348. doi: 10.1021/bi101428e. [DOI] [PMC free article] [PubMed] [Google Scholar]
- Hasui T., Ohyabu N., Ohra T., Fuji K., Sugimoto T., Fujimoto J., Asano K., Oosawa M., Shiotani S., Nishigaki N., Kusumoto K., Matsui H., Mizukami A., Habuka N., Sogabe S., Endo S., Ono M., Siedem C. S., Tang T. P., Gauthier C., De Meese L. A., Boyd S. A., Fukumoto S. Bioorg. Med. Chem. 2014;22:5428–5445. doi: 10.1016/j.bmc.2014.07.038. [DOI] [PubMed] [Google Scholar]
- Huggins M. L. J. Phys. Chem. 1935;40:723–731. [Google Scholar]
- Frey P. A. J. Phys. Org. Chem. 2004;17:511–520. [Google Scholar]
- Pauling L. J. Am. Chem. Soc. 1935;57:2680–2684. [Google Scholar]
- Westrum E. F., Pitzer K. S. J. Am. Chem. Soc. 1949;71:1940–1949. [Google Scholar]
- Williams J. M. J. Chem. Educ. 1975;52:210. [Google Scholar]
- Wang L., Fried S. D., Boxer S. G., Markland T. E. Proc. Natl. Acad. Sci. U. S. A. 2014;111:18454–18459. doi: 10.1073/pnas.1417923111. [DOI] [PMC free article] [PubMed] [Google Scholar]
- Wang L., Fried S. D., Markland T. E. J. Phys. Chem. B. 2017;121:9807–9815. doi: 10.1021/acs.jpcb.7b06985. [DOI] [PubMed] [Google Scholar]
- Habershon S., Markland T. E., Manolopoulos D. E. J. Chem. Phys. 2009;131:24501. doi: 10.1063/1.3167790. [DOI] [PubMed] [Google Scholar]
- Markland T. E., Berne B. J. Proc. Natl. Acad. Sci. U. S. A. 2012;109:7988–7991. doi: 10.1073/pnas.1203365109. [DOI] [PMC free article] [PubMed] [Google Scholar]
- McKenzie R. H., Bekker C., Athokpam B., Ramesh S. G. J. Chem. Phys. 2014;140:174508. doi: 10.1063/1.4873352. [DOI] [PubMed] [Google Scholar]
- Fang W., Chen J., Rossi M., Feng Y., Li X.-Z., Michaelides A. J. Phys. Chem. Lett. 2016;7:2125–2131. doi: 10.1021/acs.jpclett.6b00777. [DOI] [PMC free article] [PubMed] [Google Scholar]
- Sekar K., Yogavel M., Kanaujia S. P., Sharma A., Velmurugan D., Poi M.-J., Dauter Z., Tsai M.-D. Acta Crystallogr., Sect. D: Biol. Crystallogr. 2006;62:717–724. doi: 10.1107/S0907444906014855. [DOI] [PubMed] [Google Scholar]
- Frey D., Braun O., Briand C., Vašák M., Grütter M. G. Structure. 2006;14:901–911. doi: 10.1016/j.str.2006.03.006. [DOI] [PubMed] [Google Scholar]
- Wagner T., Kahnt J., Ermler U., Shima S. Angew. Chem., Int. Ed. 2016;55:10630–10633. doi: 10.1002/anie.201603882. [DOI] [PubMed] [Google Scholar]
- Bhardwaj A., Molineux I. J., Casjens S. R., Cingolani G. J. Biol. Chem. 2011;286:30867–30877. doi: 10.1074/jbc.M111.260877. [DOI] [PMC free article] [PubMed] [Google Scholar]
- Lyubimov A. Y., Lario P. I., Moustafa I., Vrielink A. Nat. Chem. Biol. 2006;2:259. doi: 10.1038/nchembio784. [DOI] [PubMed] [Google Scholar]
- Key J., Hefti M., Purcell E. B., Moffat K. Biochemistry. 2007;46:3614–3623. doi: 10.1021/bi0620407. [DOI] [PubMed] [Google Scholar]
- Forneris F., Heuts D. P. H. M., Delvecchio M., Rovida S., Fraaije M. W., Mattevi A. Biochemistry. 2008;47:978–985. doi: 10.1021/bi701886t. [DOI] [PubMed] [Google Scholar]
- Leys D., Meyer T. E., Tsapin A. S., Nealson K. H., Cusanovich M. A., Van Beeumen J. J. J. Biol. Chem. 2002;277:35703–35711. doi: 10.1074/jbc.M203866200. [DOI] [PubMed] [Google Scholar]
- Kondrashov D. A., Roberts S. A., Weichsel A., Montfort W. R. Biochemistry. 2004;43:13637–13647. doi: 10.1021/bi0483155. [DOI] [PubMed] [Google Scholar]
- Maes E. M., Roberts S. A., Weichsel A., Montfort W. R. Biochemistry. 2005;44:12690–12699. doi: 10.1021/bi0506573. [DOI] [PubMed] [Google Scholar]
- Schreiter E. R., Rodríguez M. M., Weichsel A., Montfort W. R., Bonaventura J. J. Biol. Chem. 2007;282:19773–19780. doi: 10.1074/jbc.M701363200. [DOI] [PubMed] [Google Scholar]
- Thompson M. K., Davis M. F., de Serrano V., Nicoletti F. P., Howes B. D., Smulevich G., Franzen S. Biophys. J. 2010;99:1586–1595. doi: 10.1016/j.bpj.2010.05.041. [DOI] [PMC free article] [PubMed] [Google Scholar]
- Stavrinides A., Tatsis E. C., Caputi L., Foureau E., Stevenson C. E. M., Lawson D. M., Courdavault V., O'Connor S. E. Nat. Commun. 2016;7:12116. doi: 10.1038/ncomms12116. [DOI] [PMC free article] [PubMed] [Google Scholar]
- Schlieben N. H., Niefind K., Müller J., Riebel B., Hummel W., Schomburg D. J. Mol. Biol. 2005;349:801–813. doi: 10.1016/j.jmb.2005.04.029. [DOI] [PubMed] [Google Scholar]
- Wan Q., Bennett B. C., Wilson M. A., Kovalevsky A., Langan P., Howell E. E., Dealwis C. Proc. Natl. Acad. Sci. U. S. A. 2014;111:18225–18230. doi: 10.1073/pnas.1415856111. [DOI] [PMC free article] [PubMed] [Google Scholar]
- Sudakevitz D., Kostlánová N., Blatman-Jan G., Mitchell E. P., Lerrer B., Wimmerová M., Katcoff D. J., Imberty A., Gilboa-Garber N. Mol. Microbiol. 2004;52:691–700. doi: 10.1111/j.1365-2958.2004.04020.x. [DOI] [PubMed] [Google Scholar]
- Marotte K., Sabin C., Préville C., Moumé-Pymbock M., Wimmerová M., Mitchell E. P., Imberty A., Roy R. ChemMedChem. 2007;2:1328–1338. doi: 10.1002/cmdc.200700100. [DOI] [PubMed] [Google Scholar]
- Sundaramoorthy M., Gold M. H., Poulos T. L. J. Inorg. Biochem. 2010;104:683–690. doi: 10.1016/j.jinorgbio.2010.02.011. [DOI] [PMC free article] [PubMed] [Google Scholar]
- Li X., Beeson W. T., Phillips C. M., Marletta M. A., Cate J. H. Structure. 2012;20:1051–1061. doi: 10.1016/j.str.2012.04.002. [DOI] [PMC free article] [PubMed] [Google Scholar]
- Heggelund J. E., Burschowsky D., Bjørnestad V. A., Hodnik V., Anderluh G., Krengel U. PLoS Pathog. 2016;12:1–19. doi: 10.1371/journal.ppat.1005567. [DOI] [PMC free article] [PubMed] [Google Scholar]
- Petricevic M., Sobala L. F., Fernandes P. Z., Raich L., Thompson A. J., Bernardo-Seisdedos G., Millet O., Zhu S., Sollogoub M., Jiménez-Barbero J., Rovira C., Davies G. J., Williams S. J. J. Am. Chem. Soc. 2017;139:1089–1097. doi: 10.1021/jacs.6b10075. [DOI] [PMC free article] [PubMed] [Google Scholar]
- Carloni P., Rothlisberger U., Parrinello M. Acc. Chem. Res. 2002;35:455–464. doi: 10.1021/ar010018u. [DOI] [PubMed] [Google Scholar]
- Marx D., Parrinello M. J. Chem. Phys. 1996;104:4077. [Google Scholar]
- Ufimtsev I. S., Luehr N., Martinez T. J. J. Phys. Chem. Lett. 2011;2:1789–1793. [Google Scholar]
- Gaus M., Cui Q., Elstner M. Wiley Interdiscip. Rev.: Comput. Mol. Sci. 2014;4:49–61. [Google Scholar]
- Cui Q. J. Chem. Phys. 2016;145:140901. doi: 10.1063/1.4964410. [DOI] [PMC free article] [PubMed] [Google Scholar]
- Pérez A., Tuckerman M. E., Hjalmarson H. P., von Lilienfeld O. A. J. Am. Chem. Soc. 2010;132:11510–11515. doi: 10.1021/ja102004b. [DOI] [PubMed] [Google Scholar]
- Rossi M., Fang W., Michaelides A. J. Phys. Chem. Lett. 2015;6:4233–4238. doi: 10.1021/acs.jpclett.5b01899. [DOI] [PubMed] [Google Scholar]
- Wang L., Shen Y., Yang Y., Lu W., Li W., Wei F., Zheng G., Zhou Y., Zheng W., Cao Y. ACS Omega. 2017;2:9241–9249. doi: 10.1021/acsomega.7b01214. [DOI] [PMC free article] [PubMed] [Google Scholar]
- Zuehlsdorff T. J., Napoli J. A., Milanese J. M., Markland T. E., Isborn C. M. J. Chem. Phys. 2018;149:024107. doi: 10.1063/1.5025517. [DOI] [PubMed] [Google Scholar]
- Markland T. E., Ceriotti M. Nat. Rev. Chem. 2018;2:0109. [Google Scholar]
Associated Data
This section collects any data citations, data availability statements, or supplementary materials included in this article.


